Deepwater oil and gas exploration is the key to sustainable breakthroughs in petroleum exploration worldwide. The Central Canyon gas field has confirmed the Lingshui Sag is a hydrocarbon-generating sag, and the deepwater reservoirs in the Lingshui Sag still have more fabulous oil and gas exploration potential. Based on drilling data and three-dimensional (3D) seismic data, this paper uses seismic facies analysis, seismic attribute analysis, and coherence slice analysis to identify the types of submarine fans (lobe-shaped and band-shaped submarine fans) that developed in the Lingshui Sag during the Middle Miocene, clarify the source-to-sink system of the submarine fans and discuss the genesis mechanism of the submarine fans. The results show that: (1) the deepwater source-to-sink system of the Lingshui Sag in the Middle Miocene mainly consisted of a “delta (sediment supply) - submarine canyon (sediment transport channel) - submarine fan (deepwater sediment sink)” association; (2) the main factor controlling the formation of the submarine fans developed in the Lingshui Sag was on the relative sea level decline; and (3) the bottom current reworked the lobe-shaped submarine fan that developed in the northern Lingshui Sag and formed the band-shaped submarine fan with a greater sand thickness. This paper aims to provide practical geological knowledge for subsequent petroleum exploration and development in the deepwater area of the Qiongdongnan Basin through a detailed analysis of the Middle Miocene submarine fan sedimentary system developed in the Lingshui Sag.
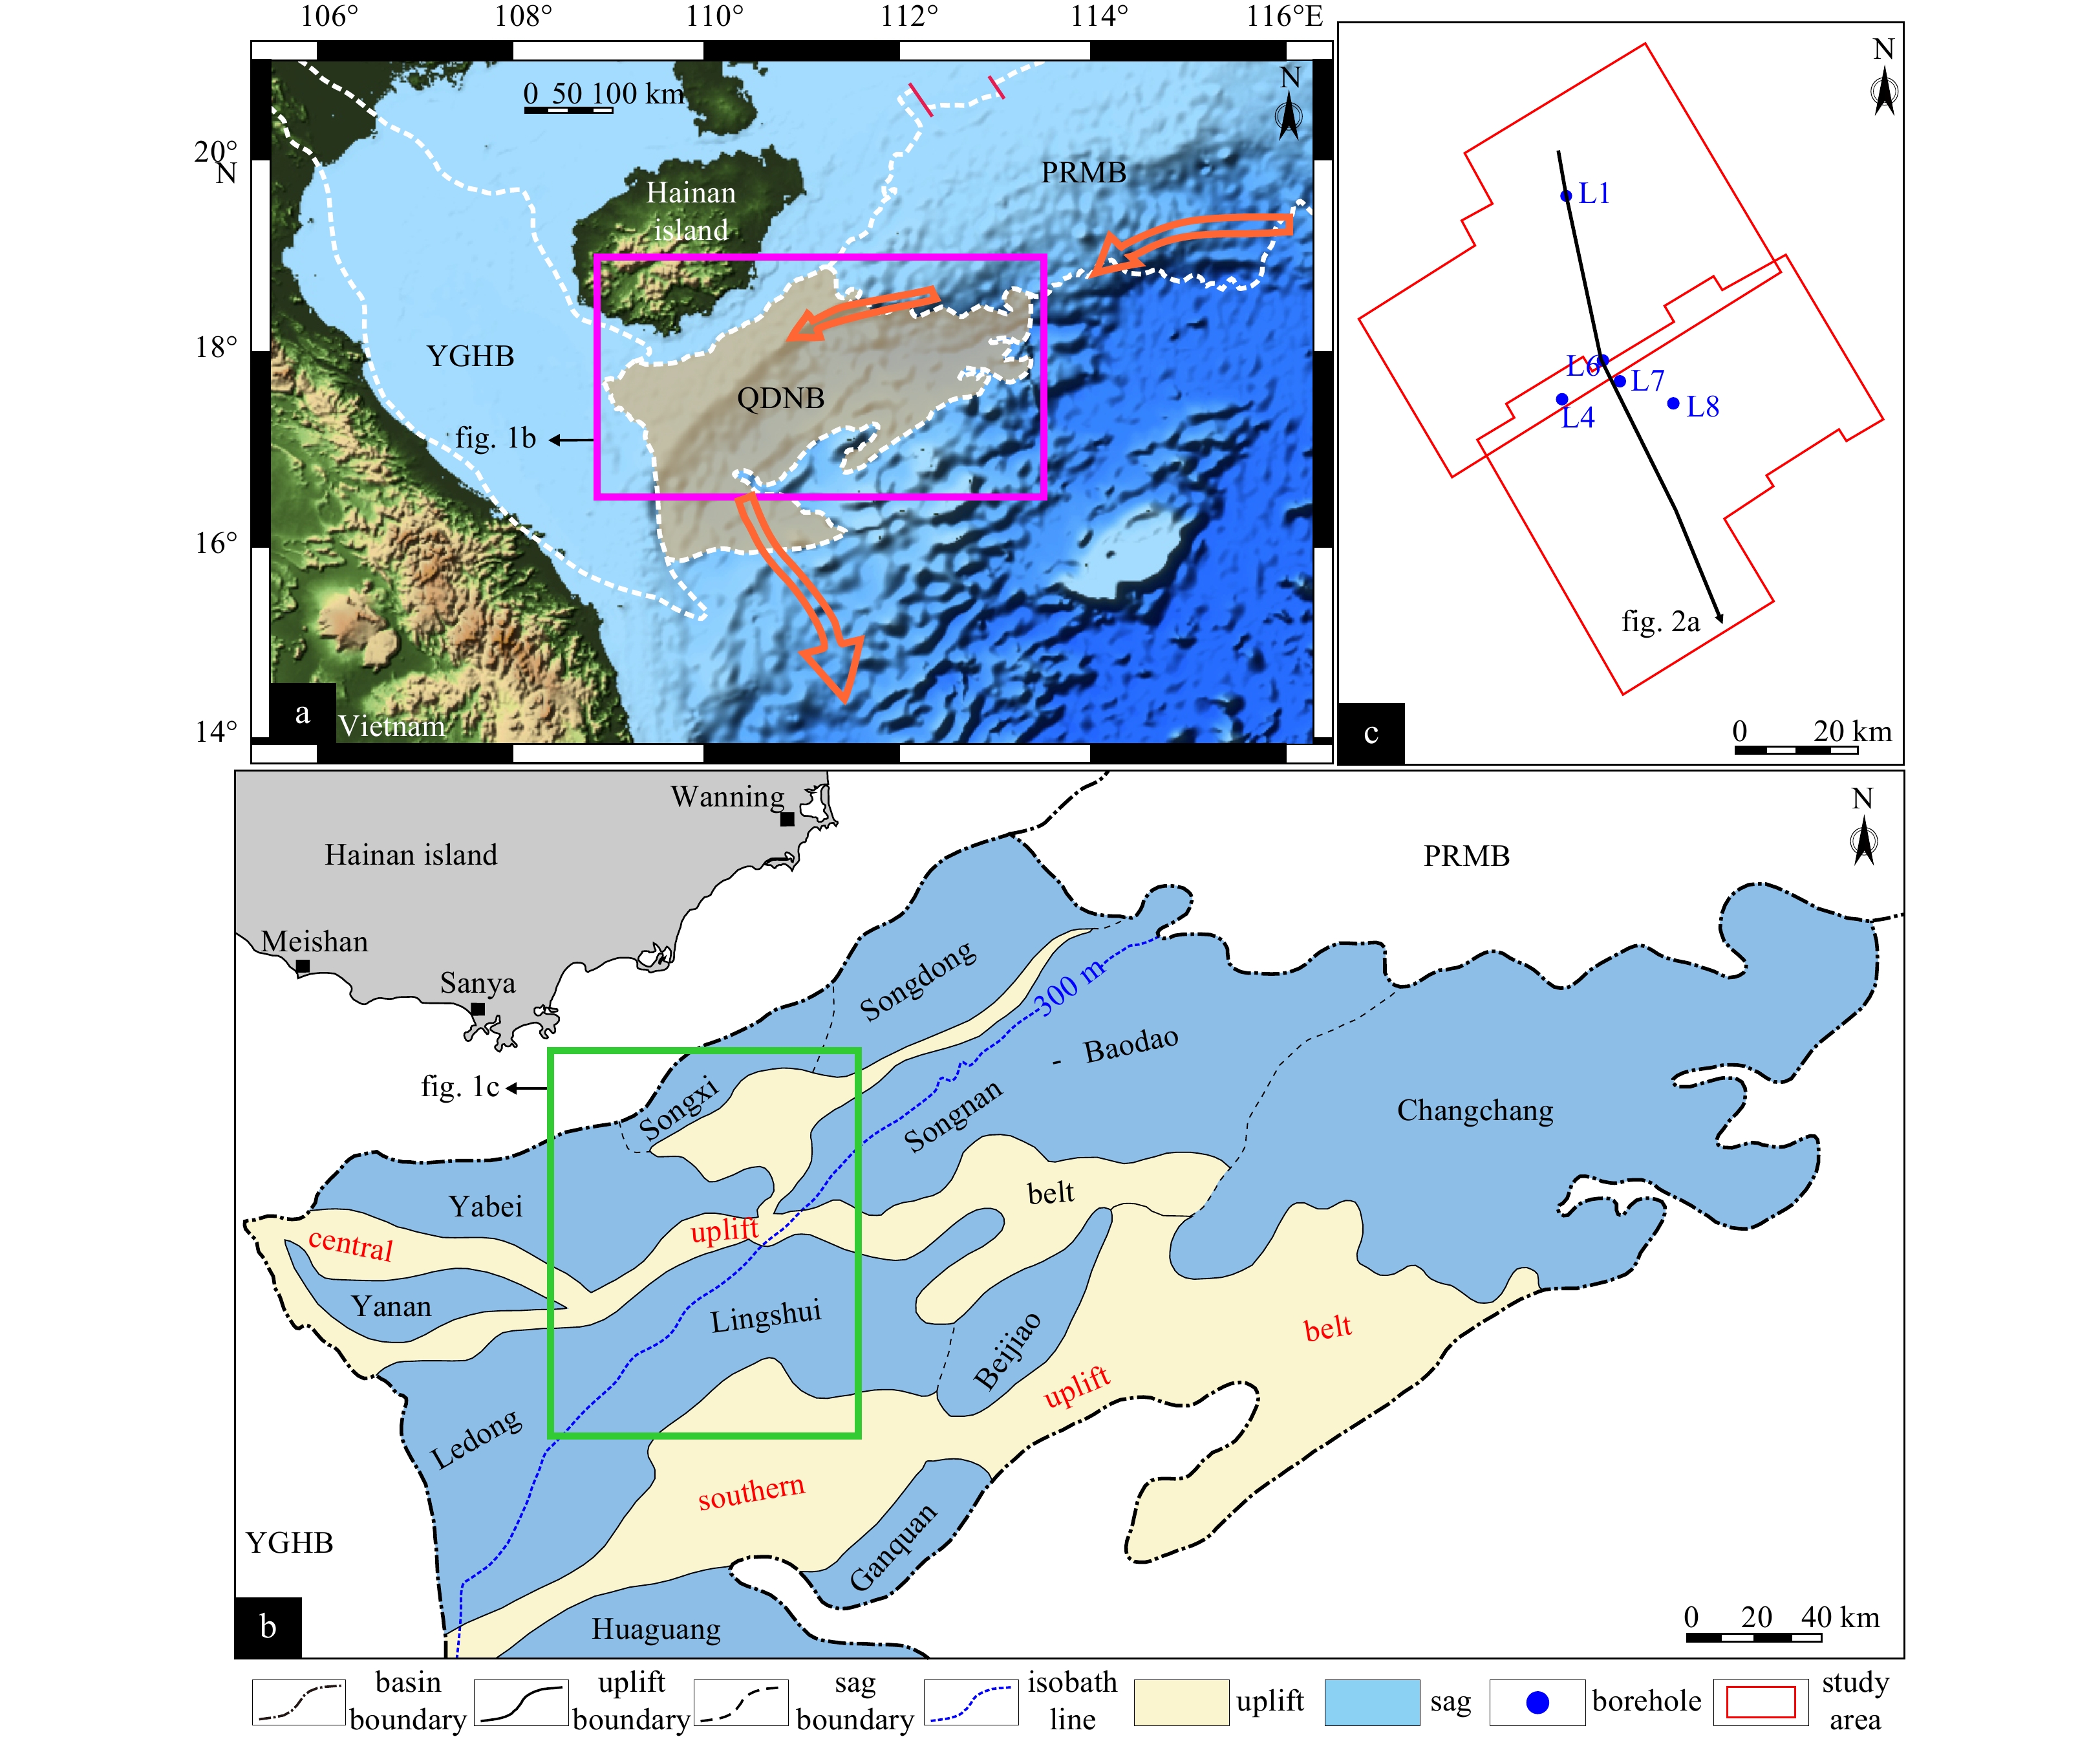
Figure 1. The geographical location of the Qiongdongnan Basin (a); the white dashed lines represent basin boundaries; the purple rectangle represents the position of (b); the purple arrows show the deep-water circulation in the northern South China Sea (Zheng et al., 2012; Zhao et al., 2014; Liu et al., 2016); QDNB represents the Qiongdongnan Basin; PRMB represents the Pearl River Mouth Basin; and YGHB represents the Yinggehai Basin. b shows the plane distribution of the internal tectonic units of the Qiongdongnan Basin(Zhang et al., 2016), and the green rectangle shows the position of (c). c shows the coverage range of the 3D seismic data (red polygon) and the plane location of the wells used in this study.
Figure 2. Shows the NW‒SE seismic profile of the Lingshui Sag (see Fig. 1c for plane location) (a). Shows the corresponding interpreted geological profile (b), and (c) is the comprehensive histogram of the Qiongdongnan Basin (modified from Zhang et al., 2017; Sun et al., 2022).
Figure 3. Stratigraphic calibration and stratigraphy boundary identification of the Meishan Formation on the northern continental margin of Lingshui Sag. a. Shows the synthetic results of Well L1 (see Fig. 4e for the plane location); the green arrow represents the onlap, and the blue arrow represents the downlap. b. It is a locally enlarged section of (a). c. It is the corresponding geological interpretation profile of (a), and the blue curve is the gamma logging curve (GR). d. It is the single-well histogram of Well L1. MRS represents the maximum regression surface; MFS represents the maximum flooding surface; UDC represents the underwater distributary channel; PM represents prodelta mudstone; and NM represents neritic mudstone.
Figure 4. Plane distribution of the continental margin delta in the northern Lingshui Sag. Panels (a), (b), (c) and (d) show seismic profiles at different locations of the continental margin delta. The blue arrow represents the downlap point position of the delta, and the red point represents the position of the shelf edge. Panel (e) is the interbedded root-mean-square amplitude attribute map of the Meishan Formation, and the red line represents the maximum extension position of the delta front, with an area of approximately 720 km2. The purple line represents the boundary of the submarine canyon at the continental shelf; the black curve represents the position of the continental shelf edge.
Figure 5. Panels (a), (b), (c) and (d) show the seismic profiles of submarine canyon evolution in the northern Lingshui Sag (see panel (H) for the plane locations of the seismic profiles). Panels (e), (f), (g) and (h) show that the bottom interface T50 of the Meishan Formation shifted up and down to extract coherent slices along the layer, corresponding to +20 ms, 0 ms, ﹣50 ms and ﹣100 ms, respectively. The red dotted line indicates the location of the submarine canyon at the continental shelf, the blue solid line indicates the location of the continental shelf edge, and the red filled position indicates the plane distribution of submarine canyons.
Figure 6. Sedimentary facies of the Meishan Formation in the northern Lingshui Sag (a). The range of the submarine fan is mapped by the plane-projection transformation of the mound-like seismic facies and vermicular seismic facies; it is a superposition diagram of the maximum positive amplitude attribute map between layers (T41-T50) and coherent slices along the layers of the T50 interface (b). The red curve represents the boundary of the delta, the blue curve represents the location of the continental shelf break, the orange curve represents the boundary of the submarine canyons, the black curve represents the plane location of the vermicular seismic facies, and the purple curve represents the plane location of the mound-like seismic facies.
Figure 7. Northwest‒southeast-trending seismic profile of the front end of the lobe-shaped submarine fan, with the black arrow indicating the downlap position; the figure indicates that the submarine fan exhibits multiple development characteristics (see Fig. 6a for the plane location) (a). Southwest‒northeast-trending lobe-shaped submarine fan seismic profile of Well L8 reveals that the lithology of the submarine fan is mainly siltstone. According to the downlap characteristics of the lobe-shaped submarine fan, four stages of submarine fan are recognized, and the interfaces are labeled T44, T43, T42, and T41 (see Fig. 6a for the plane location) (b). Lithology histogram of Well L8 (c).
Figure 8.
Figure 9.
Figure 10. Comparison of global and Qiongdongnan Basin relative sea level variations since 18.5 Ma. The black arrows indicate a continuing trend of overall sea level decline in the Middle Miocene. The global relative sea level variation is cited from Haq et al. (1987). The relative sea level variation in the Qiongdongnan Basin is cited from Hao et al. (2000). The global deep-sea foraminiferal oxygen isotope curve was modified from Zachos et al. (2008) and Zhang (2019).
Figure 11. Schematic diagram of the dip-angle measurement of the Middle Miocene continental shelf in the Lingshui Sag, Qiongdongnan Basin. The red dot represents the shelf-edge position, H represents the thickness, L represents the horizontal length, and α represents the dip angle of the continental shelf.
Figure 12. Schematic diagram of gravity flow velocity differences. AC represents the direction of gravity flow perpendicular to the strike of the continental slope, BC represents the direction of gravity flow with an acute angle between the direction and the strike of the continental slope, and EF represents the strike of the continental slope.
Figure 13. Sedimentary model of Middle Miocene submarine fans in the Lingshui Sag. The red arrows represent the direction of gravity flow sediments; the black arrow represents the moving direction of the bottom current.


 DownLoad: