


Figure
1.
Sample sites. a. Location of Ny-Ålesund on Svalbard Archipelago; b. map of Ny-Ålesund and Kongsfjorden; c. sampling sites in Ny-Ålesund in 2015.
| Citation: | Zhan Shen, Liping Ye, Jing Zhang, Hongmei Ma, Ruifeng Zhang. Major ions and trace metals in glacial meltwaters nearby Ny-Ålesund, Svalbard[J]. Acta Oceanologica Sinica, 2024, 43(10): 86-99. doi: 10.1007/s13131-024-2385-9

|
Glaciers contain about 70% of the global fresh water resources on earth. Polar regions are some of the most sensitive regions with respect to climate changes. According to the IPCC (2019) reports, almost all glaciers are experiencing continuous retreat, especially in the Arctic and the west Antarctica regions (Hugonnet et al., 2021). For quite some time, polar regions were considered too remote for direct, noticeable effects of anthropogenic activities, but activities such as tourism, mining, shipping, and long-range atmospheric transport are increasingly having an impact (Vargo et al., 2020). Therefore, the polar regions are suffering from not only a warming climate, but also from environmental and ecological issues. The feedbacks to these environmental and anthropogenic driving forces therefore draw lots of attention to the polar regions.
Hydrochemical parameters, such as major ions and alkalinity, are usually studied to understand aqueous weathering and environmental conditions (Nowak and Hodson, 2014; Yde et al., 2014). They help researchers comprehend the weathering and environmental processes in glacierized catchments that respond to changing climate (Graly et al., 2014; Ingri et al., 2005). As melting accelerates, glacial meltwater carries large freshwater and material fluxes into the adjacent ocean (Nowak and Hodson, 2013), making it urgent to study their environmental and ecological consequences. Among these fluxes, trace metals have attracted attention due to their distinctive roles in tracing geochemical and environmental processes, as well as fertilizing or poisoning marine biota (Morel and Price, 2003). For example, Al and Mn are usually applied as tracers to reveal the lithogenic sources or redox processes (Ren et al., 2006), while Fe, Co, Zn and Mn are essential elements for marine phytoplankton that regulate primary production in some ocean regions (Gerringa et al., 2020; Tagliabue et al., 2017; Vance et al., 2017; Huertas et al., 2014). Cd and Cu act as either stimulating or toxic elements to marine life, depending on their concentration levels (Miao et al., 2005), while Cr and Pb are harmful elements for health that create environmental issues (Pratush et al., 2018).
Ny-Ålesund is located on Svalbard, where the Arctic Ocean and Atlantic Ocean connect. The Ny-Ålesund area is characterized as subarctic with respect to climate, and has a landscape consisting of fjords, glaciers, meltwater, and tundra (Willis et al., 2006). Fresh water in Ny-Ålesund mainly comes from glacier melting, snow and ice melting, and summer precipitation, and the melting season is typically from late April to September (Nowak and Hodson, 2014; Svendsen et al., 2002). The bedrocks are mainly Carboniferous-Permian limestone and dolomite to the west, and older metamorphic phyllite and schists to the east, especially beneath the glaciers’ accumulation areas (Dallmann, 2015). Ny-Ålesund is also subjected to a warming climate, such that data from the environmental monitoring of Svalbard and Jan Mayen (MOSJ) shows the mass balance in Austre Brøggerbreen glacier and Midtre Lovénbreen glacier was almost always negative from 1968 to 2018 (
Trace metals in meltwater originate predominantly from both natural and anthropogenic processes, such as weathering, dissolution of local geological substratum, and atmospheric depositions. A few studies have addressed the soils in Ny-Ålesund (Rajaram et al., 2023; Halbach et al., 2017), the metals composition of aerosols from long-distance anthropogenic-derived transportation (Platt et al., 2022; Moroni et al., 2016) or summertime cruise ship emissions (Zhan et al., 2014). Zhang et al. (2015) applied iron isotopes to reveal that the aggregation and adsorption of nanoparticulate and colloidal Fe to particles were responsible for Fe loss in the proglacial environment within the Bayelva catchment. However, since most meltwater hydrology studies focus on Bayelva, there is a lack of studies on the processes that determine trace metals in meltwaters elsewhere in the region. A comprehensive study of major ions and trace metals in meltwaters from different meltwater systems near Ny-Ålesund is therefore necessary to understand natural and anthropogenic biogeochemical conditions in this important research environment.
In August 2015, five types of water samples including supraglacial meltwater, englacial meltwater, ice marginal meltwater, proglacial meltwater and groundwater, were sampled from four glacier systems near Ny-Ålesund. Major ions (Ca2+, Mg2+, Na+, K+, Cl−,
The area of sampling and sampled sites is shown in Fig. 1. The Svalbard archipelago (74°−81°N, 10°−35°E) consist of many islands, including Spitsbergen, Nordaustlandet, Barents Island, and others. It is located between the Barents Sea and the Greenland Sea, which are the channels of water exchange between the Arctic Ocean and the Atlantic Ocean (Hop et al., 2006; Svendsen et al., 2002). About 60% of the land in the Svalbard Archipelago is covered by glaciers, with estimated fluxes of meltwater and iceberg calving of (25 ± 5) km3 and (4 ± 1) km3 annually, respectively (Hagen et al., 2003). Ny-Ålesund is located in south of Kongsfjorden. There are five main glaciers around Ny-Ålesund on the south shore side of Kongsfjorden, including Vestre Brøggerbreen, Austre Brøggerbreen, Midtre Lovénbreen, Austre Lovénbreen, and Pedersenbreen. The main channel of Bayelva River derives from Austre Brøggerbreen, and it mixes with meltwater from Vestre Brøggerbreen in the middle-reach. Both Austre and Vestre Brøggerbreen are almost entirely cold-based. By contrast, Midtre Lovénbreen and Pedersenbreen offer extended opportunities for rock-water contact at the glacier bed due to the presence of temperate, subglacial ice (Irvine-Fynn et al., 2010). Lastly, little or nothing is known of the drainage system of Vestre Lovénbreen, although it has been suggested that it has also become cold-based according to research into a historic groundwater system thought to have been recharged by temperate ice in the accumulation area when the glacier was substantially thicker (Haldorsen et al., 2011).
Glacial meltwater sampling from four glaciers was carried out in August 2015, shown as in Fig. 1. Meltwater from Vestre Brøggerbreen as VBBOM, Austre Brøggerbreen as ABUP, ABMD, and ABDW, were taken twice for observing daily variation. Meltwater from Austre Lovénbreen as AL1–AL5, and Pedersenbreen as P1 and P2, were taken once. The sampling site for ABDW was located at the Norwegian Water Resources and Energy Directorate (NVE) station, which is situated 2 km northwest of Ny-Ålesund and 300 m from the outlet of the Bayelva River into Kongsfjorden. A third sampling survey was also conducted at the ABDW site. Additionally, one groundwater sample, namely GW, was collected from moss land in the Bayelva River basin. A total of 17 water samples were taken from five types of water sources: supraglacial meltwater flowing on the surface of Austre Lovénbreen (AL1, n = 1), englacial meltwater which is clear outflow water from an opening from Austre Lovénbreen (AL3, n = 1), groundwater near the Bayelva River (GW, n = 1), ice marginal meltwater (ABUP, AL2, P1, n = 4), and proglacial meltwaters with high turbidity, derived from meltwater contacting the bedrock of each glacier (VBBOM, ABMD, ABDW, AL4, AL5, and P2, n = 10).
At a riverbed approximately 200 m from ABDW station, a well with dimension of 1.5 m × 1.5 m × 1 m (width × length × depth) was dug, and the active-layer groundwater sample (GW) was taken after removing the overflow water three times. The GW station is characterized as a tundra ecosystem with permafrost. The continuous permafrost underlies the unglaciated area is around 100 m thick, and at the end of summer, the active layer ranges from 1 m to 2 m in thickness (Boike et al., 2018). Meltwater samples were collected using a custom-made “pole sampler”, as described previously in Zhang et al. (2015). Briefly, a pre-cleaned 1 L high density polyethene (HDPE) bottle was attached to the top of the pole sampler, rinsed several times with meltwater from the middle of the main stream, then bottled with meltwater, sealed in double plastic bags, and kept in a cool box after sampling. Samples were taken on foot from upper stream to downstream, and then transported back to the marine lab onshore by rubber boat. Samples were filtered in class 100 clean flow bench in the marine lab immediately upon arrival using acid-cleaned 0.4 μm polycarbonate membrane (Whatman). Filtered samples for trace metal analysis were acidified to pH = 2 using ultrapure HCl, and kept in triple bags at room temperature until analysis. All plastic labware were pre-cleaned according to the protocol described in Zhang et al. (2015). Specificly, the plastic labwares were cleaned using the following procedures: soaking in 2% Citranox detergent overnight, followed by cleaning with ultra-pure water (Milli-Q) seven times. Next, they were soaked in 10% HCl for a week, then cleaned again with ultra-pure water seven times. Finally, they were packed in triple plastic bags. Auxiliary parameters, including temperature (T), pH, dissolved oxygen (DO), and electronic conductivity (EC), were collected on-site using a multi-parameter probe (WTW Multi 350i).
Major ions (including: Na+, K+, Mg2+, Ca2+, Cl−,
Alkalinity (Alk) was determined and calculated from the pH probe measurements, as described by Ye et al. (2018). The relative standard deviation (RSD) of measurements was less than 1.3%. Based on the total amount of HCl standard added and the remaining amount, we calculated alkalinity using following equation:
| $$ \mathrm{Alk}=[{C}_{\mathrm{HCl}}\times {V}_{\mathrm{T}}-{10}^{(-\mathrm{pH})}\times ({V}_{\mathrm{T}}+{V}_{\mathrm{S}}\left)\right]/{V}_{\mathrm{S}}, $$ | (1) |
where CHCl, VT, and VS represent the concentration of standards HCl, total volume of HCl added, and the sample volume, respectively. We determined 3 measurements for each sample, and the difference between parallel samples was less than 0.02 pH unit.
[
| $$\begin{split} \mathrm{pH} < 8:\left[{\mathrm{HCO}}_{3}^-\right]=&\mathrm{Alk}-\left[{\mathrm{OH}}^-\right]+\left[{\mathrm{H}}^+\right]=\\ &\mathrm{Alk}-{k}_{\mathrm{w}}\times {10}^{\mathrm{pH}}+{10}^{-\mathrm{pH}} , \end{split}$$ | (2) |
| $$ \mathrm{pH}\geqslant 8:\left[{\mathrm{HCO}}_{3}^-\right]=\mathrm{Alk}-\left[{\mathrm{OH}}^-\right]+\left[{\mathrm{H}}^+\right]/(1+2\times {K}_{2}/[{\mathrm{H}}^+]) , $$ | (3) |
where, kw refers to the ionic product constant of water, and the constant values under different temperatures were obtained from Perlt et al. (2017). k2 refers to the dissociation constants of carbonic acid, which is calculated according to the method described by Millero et al. (2006) and Woosley and Moon (2023).
The concentrations of nutrients (
Trace metals (Al, Cr, Mn, Fe, Co, Cu, Zn, Cd, and Pb) were measured using a high resolution inductively coupled plasma mass spectrometer (Element 2, Thermo Fisher) at the University of Southern California. All samples were matched into a 0.1 mol/L HNO3 matrix and determined by an external standard curve with 1 mg/L In as an internal standard. The detection limits for Al, Cr, Mn, Fe, Co, Cu, Zn, Cd, and Pb were 0.27 ng/L, 0.03 ng/L, 0.02 ng/L, 0.10 ng/L, 0.01 ng/L, 0.02 ng/L, 0.06 ng/L, 0.06 ng/L and 0.01 ng/L, respectively, with analytical precision <3%.
Sea-salts can significantly influence some of the chemical components in Bayelva (Hodson et al., 2002), especially major ions. Thus, it is necessary to eliminate the contribution of sea-salt using Cl as a reference element (Grosbois et al., 2000), following equation:
| $${}^{*}\left[\mathrm{M}\right]={\left[\mathrm{M}\right]}_{\mathrm{measure}}-\frac{{\left[\mathrm{M}\right]}_{\mathrm{sea}}}{{\left[\mathrm{Cl}^-\right]}_{\mathrm{sea}}}\times {\left[\mathrm{Cl}^-\right]}_{\mathrm{measure}}, $$ | (4) |
where, *[M] represents the concentration of major ions after sea-salt correction; [M]measure and [
Significance test (t-test), Principal Component Analysis (PCA) and Cluster Analysis (CA) were all completed using Statistical Package of the Social Sciences (SPSS, version 20.0). In the t-test, a result with t less than 0.05 is considered to indicate a significant difference. PCA analysis was employed to identify the primary controlling factors of trace metals among ice marginal and proglacial meltwater samples, while CA analysis was applied to identify the similarity of trace metal in ice marginal and proglacial meltwater. For PCA, the Kaiser-Meyer-Olkin (KMO) test and Bartlett’s test of sphericity were used, and the maximum variance method was selected. A result of less than 0.001 for the sphericity test indicates correlation among the data and suggests further analysis can be done. Ward’s method was chosen for cluster analysis, and Squared Euclidean distance was used as the measurement distance.
The average and range of major ions in all ice marginal and proglacial meltwater samples are shown in Table 1. Hydrochemistry parameter for all meltwater samples are shown in Table 2. The range of electronic conductivity (EC) was between 12 μS/cm and 110 μS/cm, with an average of (64 ± 39) μS/cm (n = 16). EC in the Bayelva River increased downstream, from an average of 34.5 μS/cm at Station ABUP to an average value of 65.7 μS/cm at Station ABDW before entering the sea. Temperature ranged from 0.5℃ to 5.9℃ and averaged (2.0 ± 1.5)℃ (n = 16). pH ranged from 7.59 to 9.10, averaging 8.43 ± 0.36 (n = 16); dissolved oxygen (DO) ranged from 10.2 mg/L to 14.4 mg/L with an average value of (12.6 ± 1.4) mg/L (n = 16). The main components of major ions in meltwater were Ca2+ for cations, and
| Na+ | K+ | Mg2+ | Ca2+ | ${\mathrm{Cl}}^- $ | ${{\rm {SO}}_4^{2-}} $ | ${{\rm {HCO}_3^-}} $ | Si | ${{\rm {NO}}_3^-} $ | |
| Average value | 46.4 | 15.0 | 70.0 | 267 | 43.9 | 90.8 | 501 | 5.44 | 1.29 |
| Standard deviation | 15.4 | 7.9 | 24.9 | 72.5 | 18.5 | 77.1 | 147 | 2.56 | 0.67 |
| Max value | 76.1 | 29.4 | 119 | 358 | 84.6 | 245 | 773 | 9.86 | 2.58 |
| Min value | 27.8 | 7.2 | 23.4 | 126 | 20.3 | 21.9 | 305 | 2.23 | 0.32 |
 DownLoad:
CSV
DownLoad:
CSV
| Water types | Source glacier | Station | EC | T | pH | DO | Alk | Na+ | K+ | Mg2+ | Ca2+ | ${\mathrm{Cl}}^- $ | ${{\rm {SO}}_4^{2-}} $ | ${{\rm {HCO}_3^-}} $ | Si | ${{\rm {NO}}_3^-} $ | *Na+ | *K+ | *Mg2+ | *Ca2+ | ${{}^*{{\rm {SO}}_4^{2-}} }$ | TC | TA | SMF | A | E | M | U |
| Ice marginal and proglacial meltwater (n = 14) |
Austre Brøggerbreen |
ABUP (n = 2) |
34 | 0.7 | 8.27 | 14.1 | 0.31 | 36.1 | 7.2 | 23.4 | 126 | 41.5 | 21.9 | 305 | 2.37 | 0.65 | 0.4 | 6.4 | 23.4 | 125 | 19.7 | 0.34 | 0.40 | 0.11 | 25 | 0 | 14 | 60 |
| 35 | 0.8 | 8.35 | 13.8 | 0.33 | 37.8 | 8.7 | 37.4 | 158 | 41.2 | 26.2 | 325 | 2.23 | 1.77 | 2.2 | 7.9 | 37.4 | 157 | 24.0 | 0.44 | 0.43 | 0.13 | 24 | 0 | 13 | 63 | |||
| ABMD (n = 2) |
67 | n.a. | 8.21 | 13.3 | 0.49 | 44.8 | 12.8 | 77.3 | 227 | 54.2 | 76.7 | 487 | 4.47 | 1.13 | n.a. | 11.8 | 77.3 | 226 | 73.9 | 0.67 | 0.70 | 0.23 | 17 | 0 | 11 | 72 | ||
| 46 | 1.1 | 8.05 | 14.4 | 0.42 | 46.1 | 10.7 | 42.0 | 200 | 41.5 | 34.5 | 418 | 2.5 | 1.61 | 10.4 | 10.0 | 42.0 | 199 | 32.4 | 0.54 | 0.53 | 0.13 | 26 | 0 | 10 | 63 | |||
| ABDW (n = 3) |
68 | 4.1 | 8.60 | n.a. | 0.63 | 35.2 | 9.7 | 72.0 | 269 | 29.9 | 41.9 | 619 | 5.26 | 0.48 | 9.6 | 9.2 | 72.0 | 268 | 40.4 | 0.73 | 0.74 | 0.12 | 28 | 0 | 5 | 67 | ||
| 66 | 5.9 | 8.39 | 11.1 | 0.58 | 32.2 | 10.2 | 68.3 | 260 | 27.4 | 45.6 | 567 | 3.81 | 0.32 | 8.7 | 9.7 | 68.3 | 260 | 44.1 | 0.70 | 0.69 | 0.13 | 27 | 0 | 5 | 68 | |||
| 63 | 2.3 | 8.26 | 13.2 | 0.59 | 40.0 | 13.3 | 63.3 | 267 | 31.3 | 44.8 | 583 | 3.29 | 1.45 | 13.0 | 12.5 | 63.3 | 266 | 43.1 | 0.71 | 0.71 | 0.13 | 28 | 0 | 6 | 66 | |||
| Vestre Brøggerbreen |
ABBOM (n = 2) |
79 | 2.3 | 8.85 | 13.5 | 0.79 | 33.9 | 7.9 | 92.6 | 322 | 31.6 | 30.2 | 758 | 5.91 | 0.81 | 6.5 | 7.4 | 92.6 | 321 | 28.6 | 0.87 | 0.86 | 0.07 | 29 | 0 | 5 | 66 | |
| 85 | 2.3 | 8.45 | 13.0 | 0.78 | 27.8 | 8.4 | 93.4 | 331 | 20.3 | 40.1 | 773 | 4.99 | 1.77 | 10.4 | 7.9 | 93.4 | 330 | 39.0 | 0.88 | 0.89 | 0.09 | 29 | 0 | 3 | 68 | |||
| Austre Lovénbreen |
AL2 | 110 | 0.5 | 8.13 | 10.3 | 0.55 | 76.1 | 29.4 | 119 | 355 | 84.6 | 203 | 549 | 9.86 | 1.94 | 3.5 | 27.9 | 119 | 354 | 199 | 1.05 | 1.06 | 0.42 | 9 | 0 | 11 | 79 | |
| AL4 | 93 | 2.6 | 8.70 | 12.7 | 0.46 | 45.2 | 18.4 | 76.5 | 350 | 36.4 | 205 | 445 | 7.62 | 0.81 | 13.9 | 17.9 | 76.5 | 349 | 203 | 0.92 | 0.91 | 0.48 | 9 | 0 | 6 | 85 | ||
| AL5 | 103 | 3.4 | 7.69 | 10.8 | 0.41 | 62.6 | 18.9 | 87.6 | 358 | 47.4 | 245 | 409 | 6.97 | 0.81 | 21.7 | 18.2 | 87.6 | 358 | 242 | 0.97 | 0.96 | 0.54 | 11 | 0 | 7 | 81 | ||
| Pedersenbreen | P1 | 81 | 0.6 | 8.60 | 10.2 | 0.40 | 73.9 | 28.6 | 63.8 | 263 | 79.3 | 132 | 389 | 9.86 | 2.58 | 5.7 | 27.1 | 63.8 | 261 | 128 | 0.76 | 0.75 | 0.40 | 11 | 0 | 15 | 73 | |
| P2 | 75 | 1.1 | 8.20 | 13.4 | 0.39 | 57.9 | 25.6 | 62.9 | 250 | 48.2 | 125 | 382 | 6.97 | 1.94 | 16.5 | 24.6 | 62.9 | 249 | 123 | 0.71 | 0.70 | 0.39 | 15 | 0 | 10 | 75 | ||
| Average value | 72 | 2.1 | 8.34 | 12.6 | 0.51 | 46.5 | 15.1 | 69.9 | 267 | 44.0 | 90.8 | 501 | 5.39 | 1.29 | 9.6 | 14.1 | 69.9 | 266 | 88.5 | 0.73 | 0.74 | n.a. | 21 | 0 | 9 | 70 | ||
| Supraglacial meltwater |
Austre Lovénbreen |
AL1 | 13 | 1.3 | 9.10 | 11.2 | 0.04 | 27.4 | 2.3 | 7.8 | 22 | 28.5 | 16.1 | 36 | 0.53 | 0.16 | 3.0 | 1.8 | 7.8 | 21 | 14.6 | 0.09 | 0.10 | 0.45 | 12 | 0 | 39 | 48 |
| Englacial meltwater |
AL3 | 12 | 0.7 | 9.05 | 13.4 | 0.05 | 26.1 | 1.8 | 5.8 | 23 | 25.7 | 4.9 | 49 | n.a. | 0.16 | 3.9 | 1.3 | 5.8 | 23 | 3.5 | 0.09 | 0.08 | 0.13 | 22 | 0 | 37 | 41 | |
| Groundwater | Moss Land | GW | 10.1 | 8.31 | 9.0 | 3.90 | 1.35×10³ | 159 | 2.59×10³ | 1.90×10³ | 310 | 3.94×10³ | 3.74×10³ | 99.1 | 16.4 | 1.09×10³ | 153 | 2.59×10³ | 1.87×10³ | 3.92×10³ | 10.5 | 12.1 | 0.68 | 30 | 0 | 4 | 65 | |
| Note: *, data after sea-salt correction. n.a., data not available. | ||||||||||||||||||||||||||||
DownLoad:
CSV
The groundwater at Site GW had the highest EC value and highest major ion concentrations among all water samples, while the lowest dissolved oxygen concentration was observed at this site with the value of 9.0 mg/L. Compared to the visible redness color in Bayelva River, meltwater from Vestre Brøggerbreen showed a greyish color and higher EC value. The highest
Trace metal concentrations are shown in Table 3. In glacial meltwaters, the average concentrations of trace metals followed the order of Al > Mn > Fe > Cu > Co > Zn > Cr > Pb > Cd. The concentrations of Al and Mn in glacial meltwater near the ice margin ranged from 5.78 μg/L to 112.7 μg/L and from 0.99 μg/L to 40.42 μg/L, respectively. Fe in turbid glacial meltwater ranged from 0.22 μg/L to 8.39 μg/L, with the exception of a single maximum value of 116.8 μg/L at sampling site AL2. The detectable concentrations of Zn, Cu, Co, Cr, Pb, and Cd in ice marginal and proglacial meltwater ranged from 0 to 0.23 μg/L, 30.09 ng/L to 166.8 ng/L, 4.96 ng/L to 128.6 ng/L, 7.47 ng/L to 118.9 ng/L, 0.26 ng/L to 102.2 ng/L, and 0.07 ng/L to 13.02 ng/L, respectively. Trace metal concentrations such as Al, Mn, Fe, Co, Zn, and Pb decreased from Site ABUP to Site ABDW in the Bayelva River. At the same station, larger temporal variations on different days were observed for trace metals than for major ions. For example, the coeffiecient of temporal variation (RSD) for trace metals was up to 131%, while that for major ions was no more than 40%. Except for Al and Cr, trace metal concentrations in the supraglacial and englacial meltwaters were comparable to those in the ice marginal and proglacial meltwater. For Zn, Cu, Pb and Co, higher concentrations were observed in supraglacial meltwater at AL1 than in the englacial meltwater at AL3. All metal concentrations at Site AL2 exceeded values elsewhere, with the exception of Mn. The highest Mn concentration was sampled at AL4 in Austre Lovénbreen. The lowest Mn and Co concentrations were observed in the ice marginal and proglacial meltwater from Vestre Brøggerbreen. The highest Cu concentration was found in the groundwater sample. Trace metal concentrations, except for Al, in groundwater at GW were also higher than in the nearby stream water at ABDW station.
| Water types | Source glacier | Station | Al/ (μg·L−1) |
Cr/ (ng·L−1) |
Mn/ (μg·L−1) |
Co/ (ng·L−1) |
Cu/ (ng·L−1) |
Fe/ (μg·L−1) |
Zn/ (μg·L−1) |
Cd/ (ng·L−1) |
Pb/ (ng·L−1) |
| Ice marginal and proglacial meltwater |
Austre Brøggerbreen |
ABUP (n = 2) | 12.95 | 25.15 | 16.85 | 39.20 | 164.9 | 8.39 | 0.09 | LDL | 14.66 |
| 12.10 | 8.59 | 10.77 | 13.86 | 63.47 | 0.61 | 0.11 | LDL | 1.25 | |||
| ABMD (n = 2) | 5.78 | 18.33 | 13.02 | 29.81 | 61.64 | 1.41 | 0.02 | 1.66 | 0.53 | ||
| 13.00 | 9.21 | 10.48 | 14.64 | 64.09 | 0.69 | 0.00 | 0.53 | 0.94 | |||
| ABDW (n = 3) | 6.86 | 28.64 | 7.58 | 13.13 | 76.59 | 0.78 | 0.01 | 0.07 | LDL | ||
| 12.52 | 13.12 | 10.15 | 17.20 | 68.24 | 0.27 | LDL | LDL | 1.08 | |||
| 7.95 | 28.84 | 6.76 | 11.26 | 69.43 | 0.87 | 0.02 | 1.32 | 0.26 | |||
| Vestre Brøggerbreen |
ABBOM (n = 2) | 14.73 | 54.02 | 1.47 | 11.40 | 103.7 | 7.70 | 0.04 | 0.92 | 7.64 | |
| 9.46 | 39.40 | 0.99 | 4.94 | 98.85 | 0.22 | LDL | LDL | LDL | |||
| Austre Lovénbreen | AL2 | 112.7 | 118.9 | 12.66 | 108.6 | 166.8 | 164.9 | 0.23 | LDL | 102.2 | |
| AL4 | 19.28 | 9.98 | 40.42 | 128.6 | 46.27 | 3.43 | 0.12 | 13.02 | 3.41 | ||
| Pedersenbreen | P1 | 24.11 | 13.61 | 10.19 | 23.81 | 53.25 | 0.86 | LDL | LDL | 1.46 | |
| P2 | 14.41 | 7.47 | 22.94 | 79.59 | 30.09 | 1.87 | 0.01 | LDL | 3.87 | ||
| Average of above value | 20.45 | 28.87 | 12.64 | 38.16 | 82.10 | 14.77 | 0.07 | 2.92 | 12.49 | ||
| Supraglacial meltwater | Austre Lovénbreen | AL1 | 0.91 | LDL | 5.35 | 53.92 | 30.47 | 1.65 | 0.16 | LDL | 10.09 |
| Englacial meltwater | AL3 | 3.55 | 3.99 | 6.45 | 25.90 | 17.38 | 4.17 | 0.05 | 0.37 | 3.47 | |
| Groundwater | Moss Land | GW | 6.75 | 39.17 | 32.78 | 64.54 | 278.0 | 3.04 | 0.14 | 12.31 | 4.37 |
| Note: LDL refers to the trace metal concentration is lower than the method determination limit. | |||||||||||
DownLoad:
CSV
Observations over a 20-year duration from 1990 to 2010 revealed that the retreat of the cold-based glaciers most likely led to increasing chemical weathering by longer residence time waters in the recently exposed forefield in the proglacial environment (Nowak and Hodson, 2014). Indeed, major ion concentrations, including Ca2+,

Solute acquisitions in meltwater come from multiple sources in the glacier basin. Following the calculation criterion defined by Hodson et al. (2000), solute provenances of sea, aerosol, crustal and atmospheric sources could be calculated by concentrations of major ions and nutrients. This provenace model ignores respired CO2 as a contributing factor to the alkalinity budget of the water because it seems that respired CO2 dose not significantly contribute to the water budget (Graly et al., 2017). In brief, marine provenance includes all the

As shown in Fig. 4, both cation and anion ternary plots suggested a dominance of carbonate weathering in Ny-Ålesund, following the definition of Gaillardet et al. (1999). Ratios of [*Mg2+]/[*Na+] and [*Ca2+]/[*Na+] shown in Fig. 5a also indicated that carbonate weathering dominated the hydrology in meltwater of Ny-Ålesund, with only a small fraction of solutes coming from silicates weathering. This is consistent with previous studies based on hydrochemistry features (Nowak and Hodson, 2014; Hodson et al., 2002, 2000) and observations that bedrock types in Ny-Ålesund are mainly composed of carbonate rocks such as calcite and dolomite from Late Palaeozoic (Svendsen et al., 2002). Compared with other polar regions, such as the hydrology of Fildes Peninsula in Antarctica, Iceland and Greenland in the Arctic showed characteristics of both carbonate weathering and evaporate weathering with cations compositions. As for anion compositions, Iceland and Greenland mainly showed characteristics of silicate weathering (Figs 4 and 5a). In contrast to the weathering character in meltwaters, in groundwater sample, the ratios of [*Mg2+]/[*Na+] and [*Ca2+]/[*Na+] indicated the predominance of silicate weathering or Mg-Ca-sulphate salts dissolution (Fig. 5a). For the chemical composition of GW, the cation contained Ca2+ (36%), Mg2+ (49%), and (Na++ K+) (14%) ions in μeq/L, while the anion included


Though carbonate weathering dominated the hydrology in Ny-Ålesund, carbonate wearthering and silicate weathering are often coupled with other reactions, such as carbonation and sulfide oxidation (Stachnik et al., 2016; Nowak and Hodson, 2014). As shown in Figs 5b−d, ion ratios, slopes, and intercepts in linear regression equations from the ion association were plotted to indentify other reactions coupled with these two major weathering types, according to the definitions by Stachnik et al. (2016) and Tranter et al. (2002). Sulfate mass fraction (SMF), calculated as the ratio of [*
Finally, chemical weathering intensities (CWI) can be indicated by the sum of total crustal-derived cations (TCC) concentrations (Krawczyk et al., 2003). For all studied meltwaters, the highest CWI was observed in Austre Lovénbreen [TCC = (930 ± 39) μeq/L, n = 3], followed by Vestre Brøggerbreen [VBBOM station, TCC = (853 ± 12) μeq/L, n = 2], Pedersenbreen [TCC = (674 ± 9) μeq/L, n = 2], and Austre Brøggerbreen [TCC = (554 ± 144) μeq/L, n = 7]. Solutes in meltwater runoffs may experience changes in the proglacial environment due to proglacial weathering processes and groundwater inputs. The relatively short stream length of approximately 4 km and a flowing time of about 1 h (Hodson et al., 2002) might restrict the contribution of groundwater to Bayelva River. Altnatively, chemical weathering intensity in the midstream [ABMD station, (560 ± 58) μeq/L, n = 2] increased by 60% compared to the upstream [ABUP station, (351 ± 48) μeq/L, n = 2] in Bayelva River, indicating solute accumulation from the active layer along the stream flow and the importance of proglacial weathering processes (Hodson et al., 2002). The CWI further increased from the midstream to the downstream [ABDW station, (696 ± 10) μeq/L, n = 2] in Bayelva River may be due to the mixing with a meltwater tributary from Vestre Brøggerbreen. The high CWI [(853 ± 12) μeq/L, n = 2] in meltwater was observed at the VBBOM station. If mixing caused the CWI increase at station ABDW, equivalent discharge would be calculated from runoffs derived from both Austre Brøggerbreen and Vestre Brøggerbreen, which is consistant with the previous judgement by Hodson et al. (2002). For other proglacial runoffs, similar CWI along the stream flow was observed in runoffs derived from Austre Lovénbreen and Pedersenbreen, both with a short stream length of approximately 1.5 km. This implies the lack of an active layer in the bed of both short courses. However, similar SMF values and ion associations between upstream and downstream in meltwater from all investigated glaciers indicated similar weathering conditions along their meltwater flow paths. Because the groundwater sample was featured with different hydrology charateristics from silicate weathering and Mg-Ca-sulphate salts dissolution, the sample we took for groundwater may not represent a significant ion source to the proglacial runoffs in this study. Observed CWI, described by TCC concentration of (695 ± 190) μeq/L (n = 14) in Ny-Ålesund, fell at the higher end in comparison to other glacier-covered basins on Svalbard. For example, Krawczyk et al. (2003) reported that the CWI in Erikbreen, Finsterwalderbreen, Hannabreen, Midre Lovénbreen, and Scott Turnerbreen were 627 μeq/L, 600 μeq/L, 400 μeq/L, 431 μeq/L, and 308 μeq/L, respectively. Comparable CWI in cold-based glaciers, such as Vestre Brøggerbreen [VBBOM station, (853 ± 12) μeq/L] and Austre Brøggerbreen upstream (ABDW station, n = 2) to those found in polythermial glaciers like Erikbreen and Finsterwalderbreen demonstrate the intensive chemical weathering occuring in the recently exposed forefield by glacier retreat (Nowak and Hodson, 2014).
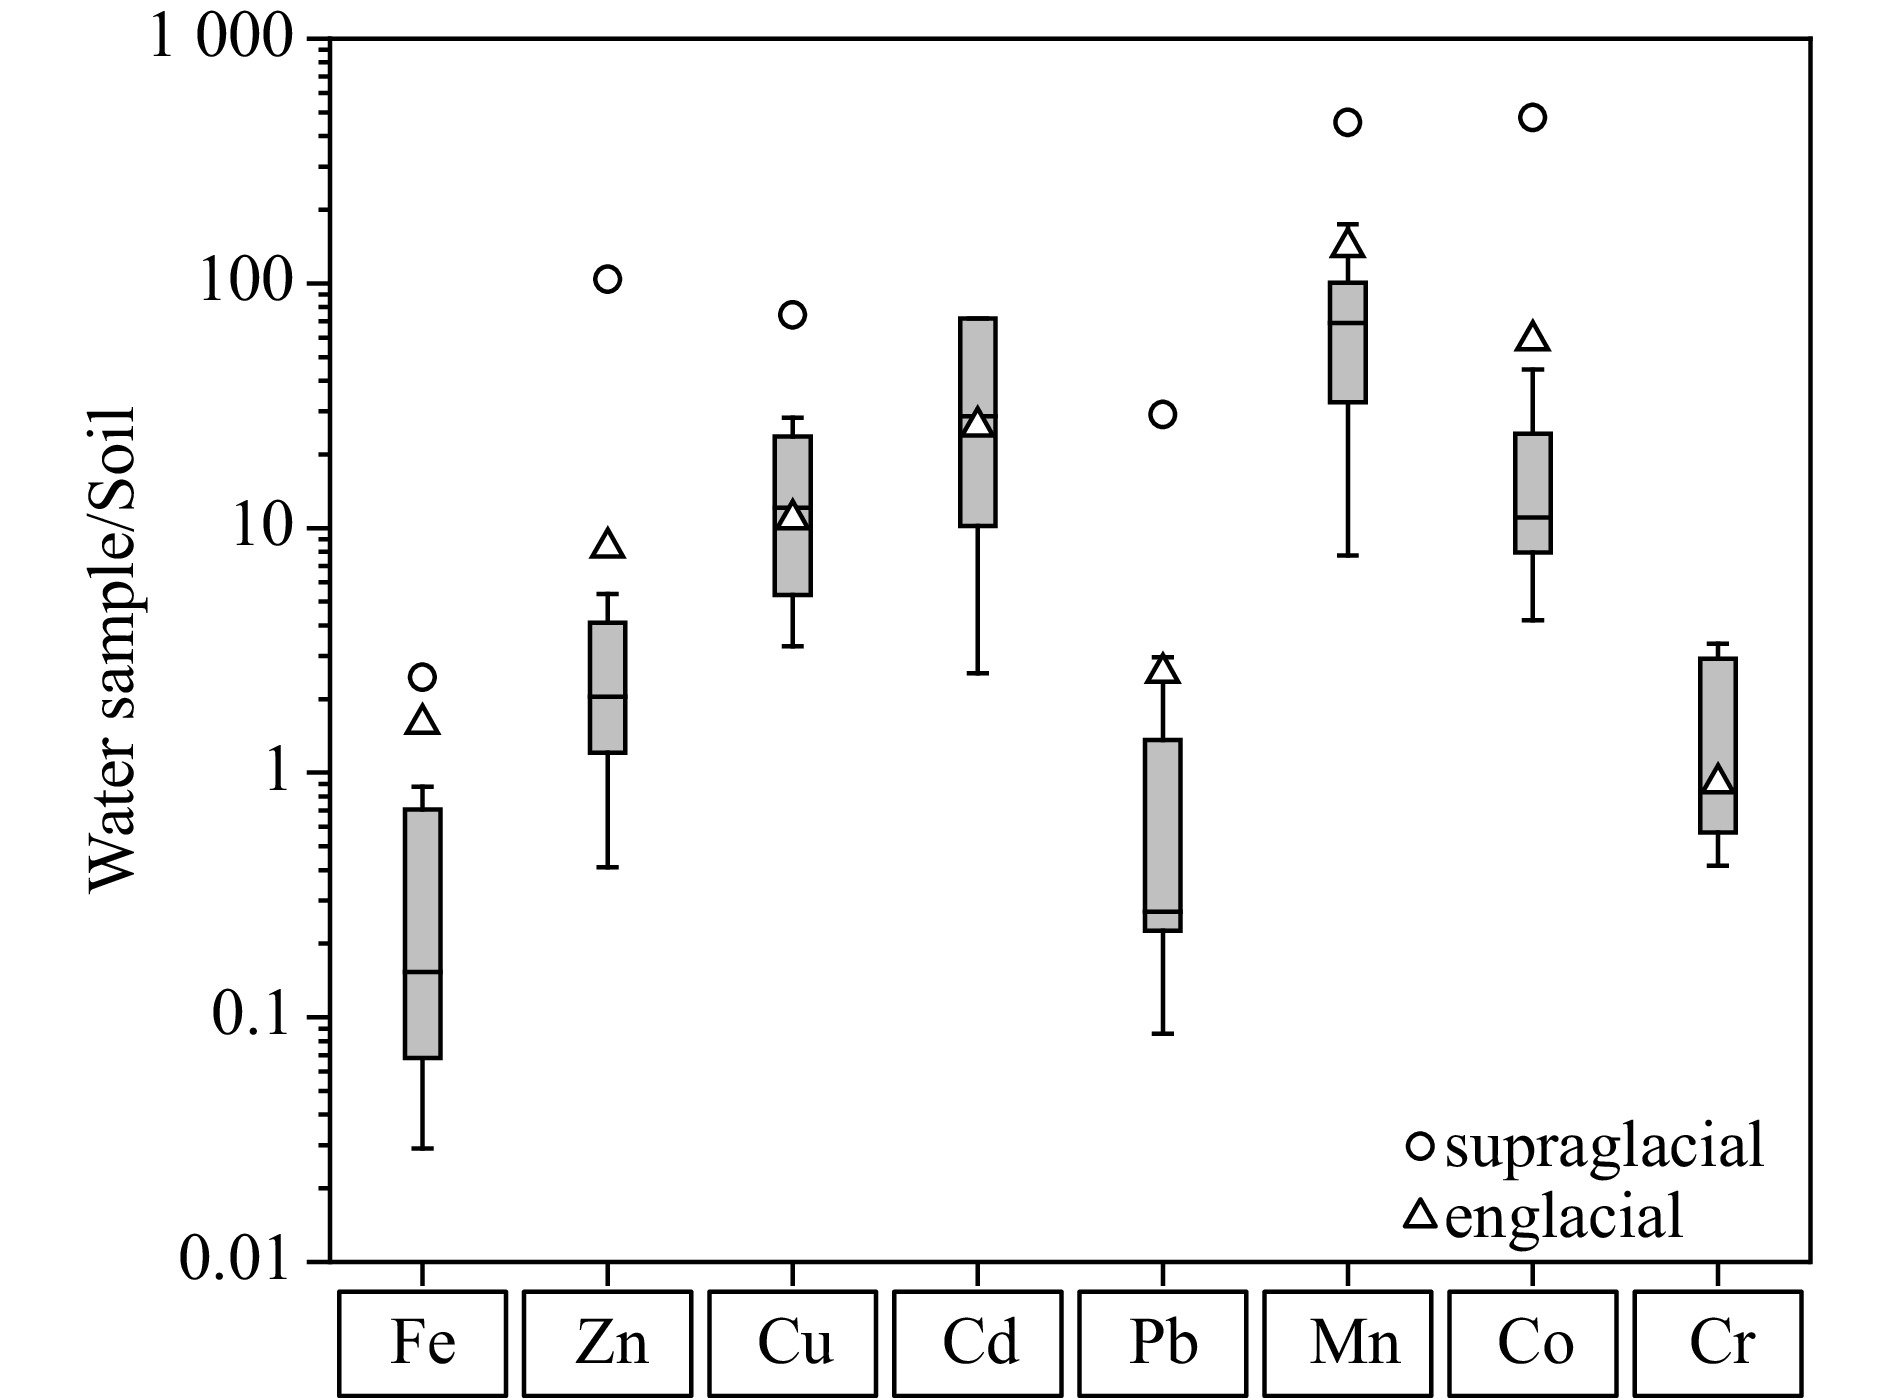
Enrichment factor (EF) value is defined as the concentration ratio of dissolved trace metals to dissolved Al in different types of meltwater, normalized to the same element ratio in the mineral soils from Bayelva area (Halbach et al., 2017). In this case, EF values of the element in meltwater are able to reveal the natural weathering or anthropogenic sources for these elements or the mobility of trace metals relative to Al in Ny-Ålesund (Dong et al., 2017; Huang et al., 2013). Overall, as shown in Fig. 6, EF values of metals in ice marginal and proglacial meltwaters were generally within range of one order of magnitude, which suggested the lithogenic sources. This is consistant with the previous knowledge that bedrock weathering is an important source for trace metals (Lehmann-Konera et al., 2021; Li et al., 2016; Aciego et al., 2015; Fortner et al., 2009; Mitchell et al., 2005). Physicochemical processes, such as absorption, desorption and precipitation, also attribute to the variations of trace metals in meltwater and have been found to affect trace metals in meltwater (Singh et al., 2017; Li et al., 2013; Fortner et al., 2009; Mitchell et al., 2006, 2005). However, in supraglacial meltwater, we found EF values of all trace metals were higher than that ranges in englacial/ice marginal/proglacial meltwaters, except for Cd and Cr, whose concentrations were lower than the detection limit. EF values of metals, such as Zn, Pb and Co, in supraglacial meltwater were more than 10 times higher than those in ice marginal and proglacial meltwaters, indicating an addition source. The possible source for the enrichment of metals in supraglacial meltwater is likely due to atmospheric deposition from melting snow or directly deposition, especially anthropogenic sources. Aerosols deposited in Ny-Ålesund were found from both natural and anthropogenic sources, including long-range sources mainly from Siberian local soils and reginal wildfires, and local sources mainly by fly ash emitted by cruise ships (Moroni et al., 2016). Polluted aerosols from ship emissions have been reported enriched in metals in summer, for example, Ni increased by 7 folds in aerosols emitted by cruise ships (Zhan et al., 2014). A general decreasing annual trend was reported for most observed heavy metals, except for Mn, at Zeppelin Observatory station in Ny-Ålesund over a 30-year period (Platt et al., 2022). Pb is one of the heavy metals mainly from anthropogenic sources to Ny-Ålesund (Bazzano et al., 2021), and the increasing trend of Zn was observed during the last decade (Platt et al., 2022). This is consistent with observed high EF values for Zn and Pb in supraglacial meltwaters. Thus, we conclude that trace metals in ice marginal and proglacial meltwaters are from bedrock weathering while trace metals in the supraglacial meltwater are effected by atmospheric input.

Principal component analysis (PCA) and cluster analysis were applied to reveal metals acquisition from different processes in glacial meltwater near the ice margin. Two main components were identified from the PCA results: Principal Component 1 (PC1) and Principal Component 2 (PC2), which accounted for 32% and 25% of the total variance, respectively. As shown in Fig. 7a, based on the PCA results and the weathering properties discussed above, we identified two main groups that explain the processes controlling metal concentrations in glacial meltwater. First, we refer to Cluster 1, which is governed by carbonate weathering, resulting in significant correlation among conductivity,

Cr was located close to cluster 1 in PCA loading plot, and was well correlated with
| Region | Al/(μg·L−1) | Cr/(ng·L−1) | Mn/(μg·L−1) | Co/(ng·L−1) | Cu/(ng·L−1) | Fe/(μg·L−1) | Zn/(μg·L−1) | Cd/(ng·L−1) | Pb/(ng·L−1) | Literature | ||
| Svalbard | Scott River | n = 9 | 1.62 ± 1.47 | 10 ± 11 | 2.58 ± 3.74 | 33 ± 11 | 54 ± 81 | n.a. | 0.36 ± 0.33 | 29 ± 22 | 13 ± 3 | Lehmann-Konera et al. (2021) |
| Ny-Ålesund | n = 13 | 20.5 ± 27.0 | 28.9 ± 29.2 | 12.6 ± 9.75 | 38.2 ± 39.1 | 82.1 ± 40.3 | 14.8 ± 43.4 | 0.07 ± 0.07 | 2.92 ± 4.55 | 12.5 ± 28.7 | this study | |
| Greenland | Leverett Glacier |
n = 82 | 445 | 311 | 3.99 | 90.2 | 667 | 133 | 0.46 | 0.67 | 37.7 | Hawkings et al. (2020) |
| Southern Greenland |
n= 16 | 67.5 ± 98.9 | 79.3 ± 96.5 | 6.08 ± 3.74 | n.a. | 541 ± 377 | 71.1 ± 108 | 1.78 ± 1.58 | n.a. | n.a. | Aciego et al. (2015) | |
| Canadian Arctic Archipelago |
n = 28 | 5.63 ± 5.61 | n.a. | 1.08 ± 2.33 | n.a. | 308 ± 247 | 7.42 ± 16.1 | 0.11 ± 0.13 | 1.13 ± 0.54 | 2.76 ± 4.14 | Colombo et al. (2019) | |
| Switzerland | Haut Glacier d’Arolla |
n = 132 | 35 | 930 | 9.4 | 100 | 670 | 390 | 6.7 | 210 | 200 | Mitchell et al. (2006) |
| Antarctica | Onyx River | n = 11 | n.a. | n.a. | 1.26 ± 0.65 | n.a. | 190.6 ± 27.9 | 18.7 ± 16.8 | 0.24 ± 0.15 | 25.9 ± 21.5 | n.a. | Green et al. (2005) |
| Note: n.a., data not available. | ||||||||||||
DownLoad:
CSV
Al, Co, Mn and Cd, were located close to cluster 2, which indicated silicate weathering origins. The presence of silicate weathering via SOSD has been identified from the major ion data, as well as previous studies in Ny-Ålesund (Nowak and Hodson, 2014). Al showed significant correlation with Si, *
For rest of the investigated metals, Fe, Pb, Zn, and Cu, were not associated with either cluster 1 or cluster 2, and they were not correlated with major ions and other hydrochemical parameters. This implies the complexity of controlling factors in regulating these metals in Ny-Ålesund, including their various natural and anthropogenic sources (Li et al., 2019, 2016), as well as physicochemical processes in the glacier basin (Nowak and Hodson, 2015; Yde et al., 2014; Raiswell and Canfield, 2012; Wadham et al., 2010). This is also reflected by the highly spatio-temporal variations for these metals in meltwater. For example, despite similar chemical weathering intensities observed in upstream stations in Vestre Brøggerbreen and Austre Brøggerbreen, the concentrations of Fe, Zn, and Pb varied up to 35 times between two sampling expeditions. Previous studies have been found a large portion of dissolved Fe was removed along flow path in the proglacial environment in Bayelva River due to aggregation and adsorption of nanoparticulate and colloidal Fe to particles with the lack of organic complexation (Zhang et al., 2015). Intensive Fe, Zn, and Pb removal were also found in this study from the glacier output to the downstream before it entered the Kongsfjorden. Understanding of the controlling factors for trace metals in meltwater is limited in this study due to a small number of samples. We suggest a comprehensive and sustained study in this field for a better understanding of the trace metal glacial flux to the ocean under the global warming circumstances.
Concentrations of trace metals of Cr, Al, Co, Mn, and Cd exhibited regional disparities among the glaciers nearby Ny-Ålesund. There was not a clear trend of these trace metals transformation along the proglacial flow pathway. The averaged concentrations of trace metals (Al, Cr, Mn, Co, Cu, Fe, Zn, Cd, and Pb) in the ice marginal and proglacial meltwater nearby Ny-Ålesund were (20.45 ± 27.04) μg/L, (28.87 ± 29.18) ng/L, (12.64 ± 9.75) μg/L, (38.16 ± 39.11) ng/L, (82.10 ± 40.25) ng/L, (14.77 ± 43.43) μg/L, (0.07 ± 0.07) μg/L, (2.92 ± 3.41) ng/L, and (12.49 ± 28.62) ng/L, respectively. Utilizing these average trace metal concentrations and considering the glacial meltwater discharge of 0.8 km3/a (Svendsen et al., 2002) into Kongsfjorden, we estimated the annual fluxes of Al, Cr, Mn, Co, Cu, Fe, Zn, Cd, and Pb from glacial meltwater into Kongsfjorden at approximately (16 ± 22) Mg/a, (0.02 ± 0.02) Mg/a, (10 ± 8) Mg/a, (0.03 ± 0.03) Mg/a, (0.07 ± 0.03) Mg/a, (12 ± 35) Mg/a, (0.06 ± 0.06) Mg/a, (0.002 ± 0.003) Mg/a, and (0.01 ± 0.02) Mg/a, respectively. However, the samples in this study were collected in 2015, during a period of rapid environmental changes in the Arctic. These changes are likely to alter weathering characteristics and thus the glacial meltwater flux for trace metals. Nonetheless, the data reported provide valuable insights for process research.
In this study, major ions and trace metals in meltwater were studied to reveal weathering and biogeochemical features in meltwaters from four glacier systems around Ny-Ålesund. The study attempts to establish a relationship between weathering and trace metals in glacial meltwaters, as well as provides a baseline study for trace metals in glacier systems in the area of Ny-Ålesund.
Major ions suggested that carbonate weathering played a dominate role in Ny-Ålesund, associated with silicate weathering and sulfide oxidation. SOCD and silicate weathering were more important in glaciers Austre Lovénbreen and Pedersenbreen. Solutes transformations reflected similar weathering conditions, and the mixing was found that corresponded to the solutes load changes.
Trace metals in supraglacial meltwater exhibited the fingerprint of anthropogenic aerosol deposition.
Principal component analysis demonstrated that Cr was correlated with carbonate weathering, while Al, Co, Mn, and Cd were correlated with silicate weathering in glacial meltwaters. Higher silicate weathering in Austre Lovénbreen and Pedersenbreen corresponded a higher content of Al, Co, Mn and Cd in glacial meltwaters. Removal of Fe, Zn, and Pb was observed from the glacier output to the downstream area before it entered Kongsfjorden, while Cr, Al, Co, Mn, and Cd exhibited regional disparities patterns. As the accelerated glacier retreat due to global warming continues, chemical components such as trace metals, which serve as trace nutrients to marine phytoplankton, derived from glaciers are subject to future changes in weathering types and intensity.
Acknowledgements: We would like to thank the Chinese Antarctic and Arctic Administration of National Oceanic Bureau and Arctic Yellow River Earth System National Observation and Research Station for the logistic support for field sampling. We are grateful to the staff at Kings Bay AS and the Chinese team members at the Yellow River Station for their assistance during our fieldwork at Ny-Ålesund, Svalbard. We also thank Prof. Seth John and Prof. James Moffett at University of Southern California for their generous offering facilities to conduct trace metals analysis. We thank Prof. Andy Hundson at University Centre in Svalbard for his valuable support to improve this manuscript.|
Aciego S M, Stevenson E I, Arendt C A. 2015. Climate versus geological controls on glacial meltwater micronutrient production in southern Greenland. Earth and Planetary Science Letters, 424: 51–58, doi: 10.1016/j.jpgl.2015.05.017
|
|
Bazzano A, Bertinetti S, Ardini F, et al. 2021. Potential source areas for atmospheric lead reaching Ny-Ålesund from 2010 to 2018. Atmosphere, 12(3): 388, doi: 10.3390/atmos12030388
|
|
Boike J, Juszak I, Lange S, et al. 2018. A 20-year record (1998–2017) of permafrost, active layer and meteorological conditions at a high Arctic permafrost research site (Bayelva, Spitsbergen). Earth System Science Data, 10(1): 355–390, doi: 10.5194/essd-10-355-2018
|
|
Colombo M, Brown K A, De Vera J, et al. 2019. Trace metal geochemistry of remote rivers in the Canadian Arctic Archipelago. Chemical Geology, 525: 479–491, doi: 10.1016/j.chemgeo.2019.08.006
|
|
Cooper R J, Wadham J L, Tranter M, et al. 2002. Groundwater hydrochemistry in the active layer of the proglacial zone, Finsterwalderbreen, Svalbard. Journal of Hydrology, 269(3–4): 208–223, doi: 10.1016/S0022-1694(02)00279-2
|
|
Dallmann W K. 2015. Geoscience Atlas of Svalbard. Tromsø: Norwegian Polar Institute Press, 133-173
|
|
Dong Z W, Qin D H, Qin X, et al. 2017. Changes in precipitating snow chemistry with seasonality in the remote Laohugou glacier basin, western Qilian Mountains. Environmental Science and Pollution Research, 24(12): 11404–11414, doi: 10.1007/s11356-017-8778-y
|
|
Feng F, Li Z Q, Jin S, et al. 2012. Hydrochemical characteristics and solute dynamics of meltwater runoff of Urumqi Glacier No. 1, eastern Tianshan, northwest China. Journal of Mountain Science, 9(4): 472–482, doi: 10.1007/s11629-012-2316-7
|
|
Fortner S K, Lyons W B, Fountain A G, et al. 2009. Trace element and major ion concentrations and dynamics in glacier snow and melt: Eliot Glacier, Oregon Cascades. Hydrological Processes, 23(21): 2987–2996, doi: 10.1002/hyp.7418
|
|
Gaillardet J, Dupré B, Louvat P, et al. 1999. Global silicate weathering and CO2 consumption rates deduced from the chemistry of large rivers. Chemical Geology, 159(1–4): 3–30, doi: 10.1016/S0009-2541(99)00031-5
|
|
Gerringa L J A, Alderkamp A C, van Dijken G, et al. 2020. Dissolved trace metals in the Ross Sea. Frontiers in Marine Science, 7: 577098, doi: 10.3389/fmars.2020.577098
|
|
Graly J A, Drever J I, Humphrey N F. 2017. Calculating the balance between atmospheric CO2 drawdown and organic carbon oxidation in subglacial hydrochemical systems. Global Biogeochemical Cycles, 31(4): 709–727, doi: 10.1002/2016GB005425
|
|
Graly J A, Humphrey N F, Landowski C M, et al. 2014. Chemical weathering under the greenland ice sheet. Geology, 42(6): 551–554, doi: 10.1130/G35370.1
|
|
Green W J, Stage B R, Preston A, et al. 2005. Geochemical processes in the Onyx River, Wright Valley, Antarctica: Major ions, nutrients, trace metals. Geochimica et Cosmochimica Acta, 69(4): 839–850, doi: 10.1016/j.gca.2004.08.001
|
|
Grosbois C, Négrel P, Fouillac C, et al. 2000. Dissolved load of the Loire River: Chemical and isotopic characterization. Chemical Geology, 170(1–4): 179–201, doi: 10.1016/S0009-2541(99)00247-8
|
|
Hagen J O, Kohler J, Melvold K, et al. 2003. Glaciers in Svalbard: mass balance, runoff and freshwater flux. Polar Research, 22(2): 145–159, doi: 10.3402/polar.v22i2.6452
|
|
Halbach K, Mikkelsen Ø, Berg T, et al. 2017. The presence of mercury and other trace metals in surface soils in the Norwegian Arctic. Chemosphere, 188: 567–574, doi: 10.1016/j.chemosphere.2017.09.012
|
|
Haldorsen S, Heim M, Van Der Ploeg M. 2011. Impacts of climate change on groundwater in permafrost areas: Case study from Svalbard, Norway. In: Treidel H, Martin-Bordes J L, Gurdak J J, eds. Climate Change Effects on Groundwater Resources. London: CRC Press, 341–356, doi: 10.1201/b11611-26
|
|
Hawkings J R, Skidmore M L, Wadham J L, et al. 2020. Enhanced trace element mobilization by Earth’s ice sheets. Proceedings of the National Academy of Sciences of the United States of America, 117(50): 31648–31659, doi: 10.1073/pnas.2014378117
|
|
Hindshaw R S, Rickli J, Leuthold J, et al. 2014. Identifying weathering sources and processes in an outlet glacier of the Greenland Ice Sheet using Ca and Sr isotope ratios. Geochimica et Cosmochimica Acta, 145: 50–71, doi: 10.1016/j.gca.2014.09.016
|
|
Hodson A, Tranter M, Gurnell A, et al. 2002. The hydrochemistry of Bayelva, a high Arctic proglacial stream in Svalbard. Journal of Hydrology, 257(1–4): 91–114, doi: 10.1016/S0022-1694(01)00543-1
|
|
Hodson A, Tranter M, Vatne G. 2000. Contemporary rates of chemical denudation and atmospheric CO2 sequestration in glacier basins: An Arctic perspective. Earth Surface Processes and Landforms, 25(13): 1447–1471, doi: 10.1002/1096-9837(200012)25:13<1447::AID-ESP156>3.0.CO;2-9
|
|
Hop H, Falk-Petersen S, Svendsen H, et al. 2006. Physical and biological characteristics of the pelagic system across Fram Strait to Kongsfjorden. Progress in Oceanography, 71(2–4): 182–231, doi: 10.1016/j.pocean.2006.09.007
|
|
Huang J, Kang S C, Zhang Q G, et al. 2013. Atmospheric deposition of trace elements recorded in snow from the Mt. Nyainqêntanglha region, southern Tibetan Plateau. Chemosphere, 92(8): 871–881, doi: 10.1016/j.chemosphere.2013.02.038
|
|
Huertas M J, López-Maury L, Giner-Lamia J, et al. 2014. Metals in cyanobacteria: Analysis of the copper, nickel, cobalt and arsenic homeostasis mechanisms. Life, 4(4): 865–886, doi: 10.3390/life4040865
|
|
Hugonnet R, McNabb R, Berthier E, et al. 2021. Accelerated global glacier mass loss in the early twenty-first century. Nature, 592(7856): 726–731, doi: 10.1038/s41586-021-03436-z
|
|
Ingri J, Widerlund A, Land M. 2005. Geochemistry of major elements in a pristine boreal river system; hydrological compartments and flow paths. Aquatic Geochemistry, 11(1): 57–88, doi: 10.1007/s10498-004-2248-0
|
|
IPCC. 2019. IPCC Special Report on the Ocean and Cryosphere in A Changing Climate (Pörtner H O, Roberts D C, Masson-Delmotte V, et al. , eds. ). Cambridge and New York: Cambridge University Press
|
|
Irvine-Fynn T D L, Bridge J W, Hodson A J. 2010. Rapid quantification of cryoconite: Granule geometry and in situ supraglacial extents, using examples from Svalbard and Greenland. Journal of Glaciology, 56(196): 297–308, doi: 10.3189/002214310791968421
|
|
Irvine-Fynn T D L, Hodson A J. 2010. Biogeochemistry and dissolved oxygen dynamics at a subglacial upwelling, Midtre Lovénbreen, Svalbard. Annals of Glaciology, 51(56): 41–46, doi: 10.3189/172756411795931903
|
|
Jacobson A D, Grace Andrews M, Lehn G O, et al. 2015. Silicate versus carbonate weathering in Iceland: New insights from Ca isotopes. Earth and Planetary Science Letters, 416: 132–142, doi: 10.1016/j.jpgl.2015.01.030
|
|
Klaebe R, Swart P, Frei R. 2021. Chromium isotope heterogeneity on a modern carbonate platform. Chemical Geology, 573: 120227, doi: 10.1016/j.chemgeo.2021.120227
|
|
Krawczyk W E, Lefauconnier B, Pettersson L E. 2003. Chemical denudation rates in the Bayelva Catchment, Svalbard, in the Fall of 2000. Physics and Chemistry of the Earth, Parts A/B/C, 28(28–32): 1257–1271, doi: 10.1016/j.pce.2003.08.054
|
|
Lehmann-Konera S, Kociuba W, Chmiel S, et al. 2021. Effects of biotransport and hydro-meteorological conditions on transport of trace elements in the Scott River (Bellsund, Spitsbergen). PeerJ, 9: e11477, doi: 10.7717/peerj.11477
|
|
Li X Y, Ding Y J, Hood E, et al. 2019. Dissolved iron supply from Asian Glaciers: Local controls and a regional perspective. Global Biogeochemical Cycles, 33(10): 1223–1237, doi: 10.1029/2018GB006113
|
|
Li X Y, He X B, Kang S C, et al. 2016. Diurnal dynamics of minor and trace elements in stream water draining Dongkemadi Glacier on the Tibetan Plateau and its environmental implications. Journal of Hydrology, 541: 1104–1118, doi: 10.1016/j.jhydrol.2016.08.021
|
|
Li X Y, Qin D H, Jing Z F, et al. 2013. Diurnal hydrological controls and non-filtration effects on minor and trace elements in stream water draining the Qiyi Glacier, Qilian Mountain. Science China Earth Sciences, 56(1): 81–92, doi: 10.1007/s11430-012-4480-6
|
|
Mark B G, McKenzie J M, Gómez J. 2005. Hydrochemical evaluation of changing glacier meltwater contribution to stream discharge: Callejon de Huaylas, Peru. Hydrological Sciences Journal, 50(6): 975–987, doi: 10.1623/hysj.2005.50.6.975
|
|
Miao A J, Wang W X, Juneau P. 2005. Comparison of Cd, Cu, and Zn toxic effects on four marine phytoplankton by pulse-amplitude-modulated fluorometry. Environmental Toxicology and Chemistry, 24(10): 2603–2611, doi: 10.1897/05-009R.1
|
|
Millero F J, Graham T B, Huang F, et al. 2006. Dissociation constants of carbonic acid in seawater as a function of salinity and temperature. Marine Chemistry, 100(1–2): 80–94, doi: 10.1016/j.marchem.2005.12.001
|
|
Mitchell A C, Brown G H, Fuge R. 2005. Are minor and trace elements useful indicators of chemical weathering processes and flow-routing in subglacial hydrological systems?. In: Robert H, Susan F, eds. 62nd Eastern Snow Conference. Ontario: Waterloo Press , 49–67
|
|
Mitchell A C, Brown G H, Fuge R. 2006. Minor and trace elements as indicators of solute provenance and flow routing in a subglacial hydrological system. Hydrological Processes, 20(4): 877–897, doi: 10.1002/hyp.6112
|
|
Morel F M M, Price N M. 2003. The biogeochemical cycles of trace metals in the oceans. Science, 300(5621): 944–947, doi: 10.1126/science.1083545
|
|
Moroni B, Cappelletti D, Ferrero L, et al. 2016. Local vs. long-range sources of aerosol particles upon Ny-Ålesund (Svalbard Islands): mineral chemistry and geochemical records. Rendiconti Lincei, 27(1): 115–127, doi: 10.1007/s12210-016-0533-7
|
|
Nowak A, Hodson A. 2013. Hydrological response of a High-Arctic catchment to changing climate over the past 35 years: A case study of Bayelva watershed, Svalbard. Polar Research, 32(1): 19691, doi: 10.3402/polar.v32i0.19691
|
|
Nowak A, Hodson A. 2014. Changes in meltwater chemistry over a 20-year period following a thermal regime switch from polythermal to cold-based glaciation at Austre Brøggerbreen, Svalbard. Polar Research, 33(1): 22779, doi: 10.3402/polar.v33.22779
|
|
Nowak A, Hodson A. 2015. On the biogeochemical response of a glacierized High Arctic watershed to climate change: Revealing patterns, processes and heterogeneity among micro-catchments. Hydrological Processes, 29(6): 1588–1603, doi: 10.1002/hyp.10263
|
|
Perlt E, von Domaros M, Kirchner B, et al. 2017. Predicting the ionic product of water. Scientific Reports, 7: 10244, doi: 10.1038/s41598-017-10156-w
|
|
Platt S M, Hov Ø, Berg T, et al. 2022. Atmospheric composition in the European Arctic and 30 years of the Zeppelin Observatory, Ny-Ålesund. Atmospheric Chemistry and Physics, 22(5): 3321–3369, doi: 10.5194/acp-22-3321-2022
|
|
Pratush A, Kumar A, Hu Z. 2018. Adverse effect of heavy metals (As, Pb, Hg, and Cr) on health and their bioremediation strategies: a review. International Microbiology, 21(3): 97–106, doi: 10.1007/s10123-018-0012-3
|
|
Raiswell R, Canfield D E. 2012. The iron biogeochemical cycle past and present. Geochemical Perspectives, 1(1): 1–220, doi: 10.7185/geochempersp.1.1
|
|
Rajaram R, Ganeshkumar A, Emmanuel Charles P. 2023. Ecological risk assessment of metals in the Arctic environment with emphasis on Kongsfjorden Fjord and freshwater lakes of Ny-Ålesund, Svalbard. Chemosphere, 310: 136737, doi: 10.1016/j.chemosphere.2022.136737
|
|
Reimann C, Caritat P. 1998. Chemical Elements in the Environment. Berlin, Heidelberg: Springer, Berlin, Heidelberg, doi: 10.1007/978-3-642-72016-1
|
|
Ren J L, Zhang J, Li J B, et al. 2006. Dissolved aluminum in the Yellow Sea and East China Sea - Al as a tracer of Changjiang (Yangtze River) discharge and Kuroshio incursion. Estuarine, Coastal and Shelf Science, 68(1–2): 165–174, doi: 10.1016/j.ecss.2006.02.004
|
|
Rudnick R L, Gao S. 2014. Composition of the continental crust. In: Rudnick R L, ed. Treatise on Geochemistry. 2nd ed. Amsterdam: Elsevier, 4: 1–51, doi: 10.1016/B978-0-08-095975-7.00301-6
|
|
Rutter N, Hodson A, Irvine-Fynn T, et al. 2011. Hydrology and hydrochemistry of a deglaciating high-Arctic catchment, Svalbard. Journal of Hydrology, 410(1–2): 39–50, doi: 10.1016/j.jhydrol.2011.09.001
|
|
Singh A T, Laluraj C M, Sharma P, et al. 2017. Export fluxes of geochemical solutes in the meltwater stream of Sutri Dhaka Glacier, Chandra basin, Western Himalaya. Environmental Monitoring and Assessment, 189(11): 555, doi: 10.1007/s10661-017-6268-9
|
|
Stachnik Ł, Majchrowska E, Yde J C, et al. 2016. Chemical denudation and the role of sulfide oxidation at Werenskioldbreen, Svalbard. Journal of Hydrology, 538: 177–193, doi: 10.1016/j.jhydrol.2016.03.059
|
|
Stachnik Ł, Yde J C, Nawrot A, et al. 2019. Aluminium in glacial meltwater demonstrates an association with nutrient export (Werenskiöldbreen, Svalbard). Hydrological Processes, 33(12): 1638–1657, doi: 10.1002/hyp.13426
|
|
Stumpf A R, Elwood Madden M E, Soreghan G S, et al. 2012. Glacier meltwater stream chemistry in Wright and Taylor Valleys, Antarctica: Significant roles of drift, dust and biological processes in chemical weathering in a polar climate. Chemical Geology, 322–323: 79–90, doi: 10.1016/j.chemgeo.2012.06.009
|
|
Svendsen H, Beszczynska-Møller A, Hagen J O, et al. 2002. The physical environment of Kongsfjorden – Krossfjorden, an Arctic fjord system in Svalbard. Polar Research, 21(1): 133–166, doi: 10.1111/j.1751-8369.2002.tb00072.x
|
|
Tagliabue A, Bowie A R, Boyd P W, et al. 2017. The integral role of iron in ocean biogeochemistry. Nature, 543(7643): 51–59, doi: 10.1038/nature21058
|
|
Tranter M, Sharp M J, Lamb H R, et al. 2002. Geochemical weathering at the bed of Haut glacier d’Arolla, Switzerland - A new model. Hydrological Processes, 16(5): 959–993, doi: 10.1002/hyp.309
|
|
Tranter M, Wadham J L. 2014. Geochemical weathering in glacial and proglacial environments. In: Holland H D, Turekian K K, eds. Treatise on Geochemistry. 2nd ed. Amsterdam: Elsevier, 7: 157–173
|
|
Vance D, Little S H, De Souza G F, et al. 2017. Silicon and zinc biogeochemical cycles coupled through the Southern Ocean. Nature Geoscience, 10(3): 202–206, doi: 10.1038/ngeo2890
|
|
Vargo L J, Anderson B M, Dadić R, et al. 2020. Anthropogenic warming forces extreme annual glacier mass loss. Nature Climate Change, 10(9): 856–861, doi: 10.1038/s41558-020-0849-2
|
|
Wadham J L, Tranter M, Hodson A J, et al. 2010. Hydro-biogeochemical coupling beneath a large polythermal Arctic glacier: Implications for subice sheet biogeochemistry. Journal of Geophysical Research: Earth Surface, 115(F4): F04017, doi: 10.1029/2009JF001602
|
|
Willis K, Cottier F, Kwasniewski S, et al. 2006. The influence of advection on zooplankton community composition in an Arctic fjord (Kongsfjorden, Svalbard). Journal of Marine Systems, 61(1–2): 39–54, doi: 10.1016/j.jmarsys.2005.11.013
|
|
Woosley R J, Moon J Y. 2023. Re-evaluation of carbonic acid dissociation constants across conditions and the implications for ocean acidification. Marine Chemistry, 250: 104247, doi: 10.1016/j.marchem.2023.104247
|
|
Yde J C, Knudsen N T, Hasholt B, et al. 2014. Meltwater chemistry and solute export from a Greenland Ice Sheet catchment, Watson River, West Greenland. Journal of Hydrology, 519: 2165–2179, doi: 10.1016/j.jhydrol.2014.10.018
|
|
Yde J C, Riger-Kusk M, Christiansen H H, et al. 2008. Hydrochemical characteristics of bulk meltwater from an entire ablation season, Longyearbreen, Svalbard. Journal of Glaciology, 54(185): 259–272, doi: 10.3189/002214308784886234
|
|
Ye L P, Zhang R F, Sun Q Z, et al. 2018. Hydrochemistry of the meltwater streams on Fildes Peninsula, King George Island, Antarctica. Journal of Oceanology and Limnology, 36(6): 2181–2193, doi: 10.1007/s00343-019-7193-2
|
|
Zeng C, Gremaud V, Zeng H T, et al. 2012. Temperature-driven meltwater production and hydrochemical variations at a glaciated alpine karst aquifer: Implication for the atmospheric CO2 sink under global warming. Environmental Earth Sciences, 65(8): 2285–2297, doi: 10.1007/s12665-011-1160-3
|
|
Zhan J Q, Gao Y, Li W, et al. 2014. Effects of ship emissions on summertime aerosols at Ny-Alesund in the Arctic. Atmospheric Pollution Research, 5(3): 500–510, doi: 10.5094/APR.2014.059
|
|
Zhang R F, John S G, Zhang J, et al. 2015. Transport and reaction of iron and iron stable isotopes in glacial meltwaters on Svalbard near Kongsfjorden: From rivers to estuary to ocean. Earth and Planetary Science Letters, 424: 201–211, doi: 10.1016/j.jpgl.2015.05.031
|

Figures(7) / Tables(4)

Supported by:
Beijing Renhe Information Technology Co. Ltd

Zhan Shen, Liping Ye, Jing Zhang, Hongmei Ma, Ruifeng Zhang. Major ions and trace metals in glacial meltwaters nearby Ny-Ålesund, Svalbard[J]. Acta Oceanologica Sinica, 2024, 43(10): 86-99. doi: 10.1007/s13131-024-2385-9

| Na+ | K+ | Mg2+ | Ca2+ | ${\mathrm{Cl}}^- $ | ${{\rm {SO}}_4^{2-}} $ | ${{\rm {HCO}_3^-}} $ | Si | ${{\rm {NO}}_3^-} $ | |
| Average value | 46.4 | 15.0 | 70.0 | 267 | 43.9 | 90.8 | 501 | 5.44 | 1.29 |
| Standard deviation | 15.4 | 7.9 | 24.9 | 72.5 | 18.5 | 77.1 | 147 | 2.56 | 0.67 |
| Max value | 76.1 | 29.4 | 119 | 358 | 84.6 | 245 | 773 | 9.86 | 2.58 |
| Min value | 27.8 | 7.2 | 23.4 | 126 | 20.3 | 21.9 | 305 | 2.23 | 0.32 |
DownLoad:
CSV
| Water types | Source glacier | Station | EC | T | pH | DO | Alk | Na+ | K+ | Mg2+ | Ca2+ | ${\mathrm{Cl}}^- $ | ${{\rm {SO}}_4^{2-}} $ | ${{\rm {HCO}_3^-}} $ | Si | ${{\rm {NO}}_3^-} $ | *Na+ | *K+ | *Mg2+ | *Ca2+ | ${{}^*{{\rm {SO}}_4^{2-}} }$ | TC | TA | SMF | A | E | M | U |
| Ice marginal and proglacial meltwater (n = 14) |
Austre Brøggerbreen |
ABUP (n = 2) |
34 | 0.7 | 8.27 | 14.1 | 0.31 | 36.1 | 7.2 | 23.4 | 126 | 41.5 | 21.9 | 305 | 2.37 | 0.65 | 0.4 | 6.4 | 23.4 | 125 | 19.7 | 0.34 | 0.40 | 0.11 | 25 | 0 | 14 | 60 |
| 35 | 0.8 | 8.35 | 13.8 | 0.33 | 37.8 | 8.7 | 37.4 | 158 | 41.2 | 26.2 | 325 | 2.23 | 1.77 | 2.2 | 7.9 | 37.4 | 157 | 24.0 | 0.44 | 0.43 | 0.13 | 24 | 0 | 13 | 63 | |||
| ABMD (n = 2) |
67 | n.a. | 8.21 | 13.3 | 0.49 | 44.8 | 12.8 | 77.3 | 227 | 54.2 | 76.7 | 487 | 4.47 | 1.13 | n.a. | 11.8 | 77.3 | 226 | 73.9 | 0.67 | 0.70 | 0.23 | 17 | 0 | 11 | 72 | ||
| 46 | 1.1 | 8.05 | 14.4 | 0.42 | 46.1 | 10.7 | 42.0 | 200 | 41.5 | 34.5 | 418 | 2.5 | 1.61 | 10.4 | 10.0 | 42.0 | 199 | 32.4 | 0.54 | 0.53 | 0.13 | 26 | 0 | 10 | 63 | |||
| ABDW (n = 3) |
68 | 4.1 | 8.60 | n.a. | 0.63 | 35.2 | 9.7 | 72.0 | 269 | 29.9 | 41.9 | 619 | 5.26 | 0.48 | 9.6 | 9.2 | 72.0 | 268 | 40.4 | 0.73 | 0.74 | 0.12 | 28 | 0 | 5 | 67 | ||
| 66 | 5.9 | 8.39 | 11.1 | 0.58 | 32.2 | 10.2 | 68.3 | 260 | 27.4 | 45.6 | 567 | 3.81 | 0.32 | 8.7 | 9.7 | 68.3 | 260 | 44.1 | 0.70 | 0.69 | 0.13 | 27 | 0 | 5 | 68 | |||
| 63 | 2.3 | 8.26 | 13.2 | 0.59 | 40.0 | 13.3 | 63.3 | 267 | 31.3 | 44.8 | 583 | 3.29 | 1.45 | 13.0 | 12.5 | 63.3 | 266 | 43.1 | 0.71 | 0.71 | 0.13 | 28 | 0 | 6 | 66 | |||
| Vestre Brøggerbreen |
ABBOM (n = 2) |
79 | 2.3 | 8.85 | 13.5 | 0.79 | 33.9 | 7.9 | 92.6 | 322 | 31.6 | 30.2 | 758 | 5.91 | 0.81 | 6.5 | 7.4 | 92.6 | 321 | 28.6 | 0.87 | 0.86 | 0.07 | 29 | 0 | 5 | 66 | |
| 85 | 2.3 | 8.45 | 13.0 | 0.78 | 27.8 | 8.4 | 93.4 | 331 | 20.3 | 40.1 | 773 | 4.99 | 1.77 | 10.4 | 7.9 | 93.4 | 330 | 39.0 | 0.88 | 0.89 | 0.09 | 29 | 0 | 3 | 68 | |||
| Austre Lovénbreen |
AL2 | 110 | 0.5 | 8.13 | 10.3 | 0.55 | 76.1 | 29.4 | 119 | 355 | 84.6 | 203 | 549 | 9.86 | 1.94 | 3.5 | 27.9 | 119 | 354 | 199 | 1.05 | 1.06 | 0.42 | 9 | 0 | 11 | 79 | |
| AL4 | 93 | 2.6 | 8.70 | 12.7 | 0.46 | 45.2 | 18.4 | 76.5 | 350 | 36.4 | 205 | 445 | 7.62 | 0.81 | 13.9 | 17.9 | 76.5 | 349 | 203 | 0.92 | 0.91 | 0.48 | 9 | 0 | 6 | 85 | ||
| AL5 | 103 | 3.4 | 7.69 | 10.8 | 0.41 | 62.6 | 18.9 | 87.6 | 358 | 47.4 | 245 | 409 | 6.97 | 0.81 | 21.7 | 18.2 | 87.6 | 358 | 242 | 0.97 | 0.96 | 0.54 | 11 | 0 | 7 | 81 | ||
| Pedersenbreen | P1 | 81 | 0.6 | 8.60 | 10.2 | 0.40 | 73.9 | 28.6 | 63.8 | 263 | 79.3 | 132 | 389 | 9.86 | 2.58 | 5.7 | 27.1 | 63.8 | 261 | 128 | 0.76 | 0.75 | 0.40 | 11 | 0 | 15 | 73 | |
| P2 | 75 | 1.1 | 8.20 | 13.4 | 0.39 | 57.9 | 25.6 | 62.9 | 250 | 48.2 | 125 | 382 | 6.97 | 1.94 | 16.5 | 24.6 | 62.9 | 249 | 123 | 0.71 | 0.70 | 0.39 | 15 | 0 | 10 | 75 | ||
| Average value | 72 | 2.1 | 8.34 | 12.6 | 0.51 | 46.5 | 15.1 | 69.9 | 267 | 44.0 | 90.8 | 501 | 5.39 | 1.29 | 9.6 | 14.1 | 69.9 | 266 | 88.5 | 0.73 | 0.74 | n.a. | 21 | 0 | 9 | 70 | ||
| Supraglacial meltwater |
Austre Lovénbreen |
AL1 | 13 | 1.3 | 9.10 | 11.2 | 0.04 | 27.4 | 2.3 | 7.8 | 22 | 28.5 | 16.1 | 36 | 0.53 | 0.16 | 3.0 | 1.8 | 7.8 | 21 | 14.6 | 0.09 | 0.10 | 0.45 | 12 | 0 | 39 | 48 |
| Englacial meltwater |
AL3 | 12 | 0.7 | 9.05 | 13.4 | 0.05 | 26.1 | 1.8 | 5.8 | 23 | 25.7 | 4.9 | 49 | n.a. | 0.16 | 3.9 | 1.3 | 5.8 | 23 | 3.5 | 0.09 | 0.08 | 0.13 | 22 | 0 | 37 | 41 | |
| Groundwater | Moss Land | GW | 10.1 | 8.31 | 9.0 | 3.90 | 1.35×10³ | 159 | 2.59×10³ | 1.90×10³ | 310 | 3.94×10³ | 3.74×10³ | 99.1 | 16.4 | 1.09×10³ | 153 | 2.59×10³ | 1.87×10³ | 3.92×10³ | 10.5 | 12.1 | 0.68 | 30 | 0 | 4 | 65 | |
| Note: *, data after sea-salt correction. n.a., data not available. | ||||||||||||||||||||||||||||
DownLoad:
CSV
| Water types | Source glacier | Station | Al/ (μg·L−1) |
Cr/ (ng·L−1) |
Mn/ (μg·L−1) |
Co/ (ng·L−1) |
Cu/ (ng·L−1) |
Fe/ (μg·L−1) |
Zn/ (μg·L−1) |
Cd/ (ng·L−1) |
Pb/ (ng·L−1) |
| Ice marginal and proglacial meltwater |
Austre Brøggerbreen |
ABUP (n = 2) | 12.95 | 25.15 | 16.85 | 39.20 | 164.9 | 8.39 | 0.09 | LDL | 14.66 |
| 12.10 | 8.59 | 10.77 | 13.86 | 63.47 | 0.61 | 0.11 | LDL | 1.25 | |||
| ABMD (n = 2) | 5.78 | 18.33 | 13.02 | 29.81 | 61.64 | 1.41 | 0.02 | 1.66 | 0.53 | ||
| 13.00 | 9.21 | 10.48 | 14.64 | 64.09 | 0.69 | 0.00 | 0.53 | 0.94 | |||
| ABDW (n = 3) | 6.86 | 28.64 | 7.58 | 13.13 | 76.59 | 0.78 | 0.01 | 0.07 | LDL | ||
| 12.52 | 13.12 | 10.15 | 17.20 | 68.24 | 0.27 | LDL | LDL | 1.08 | |||
| 7.95 | 28.84 | 6.76 | 11.26 | 69.43 | 0.87 | 0.02 | 1.32 | 0.26 | |||
| Vestre Brøggerbreen |
ABBOM (n = 2) | 14.73 | 54.02 | 1.47 | 11.40 | 103.7 | 7.70 | 0.04 | 0.92 | 7.64 | |
| 9.46 | 39.40 | 0.99 | 4.94 | 98.85 | 0.22 | LDL | LDL | LDL | |||
| Austre Lovénbreen | AL2 | 112.7 | 118.9 | 12.66 | 108.6 | 166.8 | 164.9 | 0.23 | LDL | 102.2 | |
| AL4 | 19.28 | 9.98 | 40.42 | 128.6 | 46.27 | 3.43 | 0.12 | 13.02 | 3.41 | ||
| Pedersenbreen | P1 | 24.11 | 13.61 | 10.19 | 23.81 | 53.25 | 0.86 | LDL | LDL | 1.46 | |
| P2 | 14.41 | 7.47 | 22.94 | 79.59 | 30.09 | 1.87 | 0.01 | LDL | 3.87 | ||
| Average of above value | 20.45 | 28.87 | 12.64 | 38.16 | 82.10 | 14.77 | 0.07 | 2.92 | 12.49 | ||
| Supraglacial meltwater | Austre Lovénbreen | AL1 | 0.91 | LDL | 5.35 | 53.92 | 30.47 | 1.65 | 0.16 | LDL | 10.09 |
| Englacial meltwater | AL3 | 3.55 | 3.99 | 6.45 | 25.90 | 17.38 | 4.17 | 0.05 | 0.37 | 3.47 | |
| Groundwater | Moss Land | GW | 6.75 | 39.17 | 32.78 | 64.54 | 278.0 | 3.04 | 0.14 | 12.31 | 4.37 |
| Note: LDL refers to the trace metal concentration is lower than the method determination limit. | |||||||||||
DownLoad:
CSV
| Region | Al/(μg·L−1) | Cr/(ng·L−1) | Mn/(μg·L−1) | Co/(ng·L−1) | Cu/(ng·L−1) | Fe/(μg·L−1) | Zn/(μg·L−1) | Cd/(ng·L−1) | Pb/(ng·L−1) | Literature | ||
| Svalbard | Scott River | n = 9 | 1.62 ± 1.47 | 10 ± 11 | 2.58 ± 3.74 | 33 ± 11 | 54 ± 81 | n.a. | 0.36 ± 0.33 | 29 ± 22 | 13 ± 3 | Lehmann-Konera et al. (2021) |
| Ny-Ålesund | n = 13 | 20.5 ± 27.0 | 28.9 ± 29.2 | 12.6 ± 9.75 | 38.2 ± 39.1 | 82.1 ± 40.3 | 14.8 ± 43.4 | 0.07 ± 0.07 | 2.92 ± 4.55 | 12.5 ± 28.7 | this study | |
| Greenland | Leverett Glacier |
n = 82 | 445 | 311 | 3.99 | 90.2 | 667 | 133 | 0.46 | 0.67 | 37.7 | Hawkings et al. (2020) |
| Southern Greenland |
n= 16 | 67.5 ± 98.9 | 79.3 ± 96.5 | 6.08 ± 3.74 | n.a. | 541 ± 377 | 71.1 ± 108 | 1.78 ± 1.58 | n.a. | n.a. | Aciego et al. (2015) | |
| Canadian Arctic Archipelago |
n = 28 | 5.63 ± 5.61 | n.a. | 1.08 ± 2.33 | n.a. | 308 ± 247 | 7.42 ± 16.1 | 0.11 ± 0.13 | 1.13 ± 0.54 | 2.76 ± 4.14 | Colombo et al. (2019) | |
| Switzerland | Haut Glacier d’Arolla |
n = 132 | 35 | 930 | 9.4 | 100 | 670 | 390 | 6.7 | 210 | 200 | Mitchell et al. (2006) |
| Antarctica | Onyx River | n = 11 | n.a. | n.a. | 1.26 ± 0.65 | n.a. | 190.6 ± 27.9 | 18.7 ± 16.8 | 0.24 ± 0.15 | 25.9 ± 21.5 | n.a. | Green et al. (2005) |
| Note: n.a., data not available. | ||||||||||||
DownLoad:
CSV
| Na+ | K+ | Mg2+ | Ca2+ | ${\mathrm{Cl}}^- $ | ${{\rm {SO}}_4^{2-}} $ | ${{\rm {HCO}_3^-}} $ | Si | ${{\rm {NO}}_3^-} $ | |
| Average value | 46.4 | 15.0 | 70.0 | 267 | 43.9 | 90.8 | 501 | 5.44 | 1.29 |
| Standard deviation | 15.4 | 7.9 | 24.9 | 72.5 | 18.5 | 77.1 | 147 | 2.56 | 0.67 |
| Max value | 76.1 | 29.4 | 119 | 358 | 84.6 | 245 | 773 | 9.86 | 2.58 |
| Min value | 27.8 | 7.2 | 23.4 | 126 | 20.3 | 21.9 | 305 | 2.23 | 0.32 |
| Water types | Source glacier | Station | EC | T | pH | DO | Alk | Na+ | K+ | Mg2+ | Ca2+ | ${\mathrm{Cl}}^- $ | ${{\rm {SO}}_4^{2-}} $ | ${{\rm {HCO}_3^-}} $ | Si | ${{\rm {NO}}_3^-} $ | *Na+ | *K+ | *Mg2+ | *Ca2+ | ${{}^*{{\rm {SO}}_4^{2-}} }$ | TC | TA | SMF | A | E | M | U |
| Ice marginal and proglacial meltwater (n = 14) |
Austre Brøggerbreen |
ABUP (n = 2) |
34 | 0.7 | 8.27 | 14.1 | 0.31 | 36.1 | 7.2 | 23.4 | 126 | 41.5 | 21.9 | 305 | 2.37 | 0.65 | 0.4 | 6.4 | 23.4 | 125 | 19.7 | 0.34 | 0.40 | 0.11 | 25 | 0 | 14 | 60 |
| 35 | 0.8 | 8.35 | 13.8 | 0.33 | 37.8 | 8.7 | 37.4 | 158 | 41.2 | 26.2 | 325 | 2.23 | 1.77 | 2.2 | 7.9 | 37.4 | 157 | 24.0 | 0.44 | 0.43 | 0.13 | 24 | 0 | 13 | 63 | |||
| ABMD (n = 2) |
67 | n.a. | 8.21 | 13.3 | 0.49 | 44.8 | 12.8 | 77.3 | 227 | 54.2 | 76.7 | 487 | 4.47 | 1.13 | n.a. | 11.8 | 77.3 | 226 | 73.9 | 0.67 | 0.70 | 0.23 | 17 | 0 | 11 | 72 | ||
| 46 | 1.1 | 8.05 | 14.4 | 0.42 | 46.1 | 10.7 | 42.0 | 200 | 41.5 | 34.5 | 418 | 2.5 | 1.61 | 10.4 | 10.0 | 42.0 | 199 | 32.4 | 0.54 | 0.53 | 0.13 | 26 | 0 | 10 | 63 | |||
| ABDW (n = 3) |
68 | 4.1 | 8.60 | n.a. | 0.63 | 35.2 | 9.7 | 72.0 | 269 | 29.9 | 41.9 | 619 | 5.26 | 0.48 | 9.6 | 9.2 | 72.0 | 268 | 40.4 | 0.73 | 0.74 | 0.12 | 28 | 0 | 5 | 67 | ||
| 66 | 5.9 | 8.39 | 11.1 | 0.58 | 32.2 | 10.2 | 68.3 | 260 | 27.4 | 45.6 | 567 | 3.81 | 0.32 | 8.7 | 9.7 | 68.3 | 260 | 44.1 | 0.70 | 0.69 | 0.13 | 27 | 0 | 5 | 68 | |||
| 63 | 2.3 | 8.26 | 13.2 | 0.59 | 40.0 | 13.3 | 63.3 | 267 | 31.3 | 44.8 | 583 | 3.29 | 1.45 | 13.0 | 12.5 | 63.3 | 266 | 43.1 | 0.71 | 0.71 | 0.13 | 28 | 0 | 6 | 66 | |||
| Vestre Brøggerbreen |
ABBOM (n = 2) |
79 | 2.3 | 8.85 | 13.5 | 0.79 | 33.9 | 7.9 | 92.6 | 322 | 31.6 | 30.2 | 758 | 5.91 | 0.81 | 6.5 | 7.4 | 92.6 | 321 | 28.6 | 0.87 | 0.86 | 0.07 | 29 | 0 | 5 | 66 | |
| 85 | 2.3 | 8.45 | 13.0 | 0.78 | 27.8 | 8.4 | 93.4 | 331 | 20.3 | 40.1 | 773 | 4.99 | 1.77 | 10.4 | 7.9 | 93.4 | 330 | 39.0 | 0.88 | 0.89 | 0.09 | 29 | 0 | 3 | 68 | |||
| Austre Lovénbreen |
AL2 | 110 | 0.5 | 8.13 | 10.3 | 0.55 | 76.1 | 29.4 | 119 | 355 | 84.6 | 203 | 549 | 9.86 | 1.94 | 3.5 | 27.9 | 119 | 354 | 199 | 1.05 | 1.06 | 0.42 | 9 | 0 | 11 | 79 | |
| AL4 | 93 | 2.6 | 8.70 | 12.7 | 0.46 | 45.2 | 18.4 | 76.5 | 350 | 36.4 | 205 | 445 | 7.62 | 0.81 | 13.9 | 17.9 | 76.5 | 349 | 203 | 0.92 | 0.91 | 0.48 | 9 | 0 | 6 | 85 | ||
| AL5 | 103 | 3.4 | 7.69 | 10.8 | 0.41 | 62.6 | 18.9 | 87.6 | 358 | 47.4 | 245 | 409 | 6.97 | 0.81 | 21.7 | 18.2 | 87.6 | 358 | 242 | 0.97 | 0.96 | 0.54 | 11 | 0 | 7 | 81 | ||
| Pedersenbreen | P1 | 81 | 0.6 | 8.60 | 10.2 | 0.40 | 73.9 | 28.6 | 63.8 | 263 | 79.3 | 132 | 389 | 9.86 | 2.58 | 5.7 | 27.1 | 63.8 | 261 | 128 | 0.76 | 0.75 | 0.40 | 11 | 0 | 15 | 73 | |
| P2 | 75 | 1.1 | 8.20 | 13.4 | 0.39 | 57.9 | 25.6 | 62.9 | 250 | 48.2 | 125 | 382 | 6.97 | 1.94 | 16.5 | 24.6 | 62.9 | 249 | 123 | 0.71 | 0.70 | 0.39 | 15 | 0 | 10 | 75 | ||
| Average value | 72 | 2.1 | 8.34 | 12.6 | 0.51 | 46.5 | 15.1 | 69.9 | 267 | 44.0 | 90.8 | 501 | 5.39 | 1.29 | 9.6 | 14.1 | 69.9 | 266 | 88.5 | 0.73 | 0.74 | n.a. | 21 | 0 | 9 | 70 | ||
| Supraglacial meltwater |
Austre Lovénbreen |
AL1 | 13 | 1.3 | 9.10 | 11.2 | 0.04 | 27.4 | 2.3 | 7.8 | 22 | 28.5 | 16.1 | 36 | 0.53 | 0.16 | 3.0 | 1.8 | 7.8 | 21 | 14.6 | 0.09 | 0.10 | 0.45 | 12 | 0 | 39 | 48 |
| Englacial meltwater |
AL3 | 12 | 0.7 | 9.05 | 13.4 | 0.05 | 26.1 | 1.8 | 5.8 | 23 | 25.7 | 4.9 | 49 | n.a. | 0.16 | 3.9 | 1.3 | 5.8 | 23 | 3.5 | 0.09 | 0.08 | 0.13 | 22 | 0 | 37 | 41 | |
| Groundwater | Moss Land | GW | 10.1 | 8.31 | 9.0 | 3.90 | 1.35×10³ | 159 | 2.59×10³ | 1.90×10³ | 310 | 3.94×10³ | 3.74×10³ | 99.1 | 16.4 | 1.09×10³ | 153 | 2.59×10³ | 1.87×10³ | 3.92×10³ | 10.5 | 12.1 | 0.68 | 30 | 0 | 4 | 65 | |
| Note: *, data after sea-salt correction. n.a., data not available. | ||||||||||||||||||||||||||||
| Water types | Source glacier | Station | Al/ (μg·L−1) |
Cr/ (ng·L−1) |
Mn/ (μg·L−1) |
Co/ (ng·L−1) |
Cu/ (ng·L−1) |
Fe/ (μg·L−1) |
Zn/ (μg·L−1) |
Cd/ (ng·L−1) |
Pb/ (ng·L−1) |
| Ice marginal and proglacial meltwater |
Austre Brøggerbreen |
ABUP (n = 2) | 12.95 | 25.15 | 16.85 | 39.20 | 164.9 | 8.39 | 0.09 | LDL | 14.66 |
| 12.10 | 8.59 | 10.77 | 13.86 | 63.47 | 0.61 | 0.11 | LDL | 1.25 | |||
| ABMD (n = 2) | 5.78 | 18.33 | 13.02 | 29.81 | 61.64 | 1.41 | 0.02 | 1.66 | 0.53 | ||
| 13.00 | 9.21 | 10.48 | 14.64 | 64.09 | 0.69 | 0.00 | 0.53 | 0.94 | |||
| ABDW (n = 3) | 6.86 | 28.64 | 7.58 | 13.13 | 76.59 | 0.78 | 0.01 | 0.07 | LDL | ||
| 12.52 | 13.12 | 10.15 | 17.20 | 68.24 | 0.27 | LDL | LDL | 1.08 | |||
| 7.95 | 28.84 | 6.76 | 11.26 | 69.43 | 0.87 | 0.02 | 1.32 | 0.26 | |||
| Vestre Brøggerbreen |
ABBOM (n = 2) | 14.73 | 54.02 | 1.47 | 11.40 | 103.7 | 7.70 | 0.04 | 0.92 | 7.64 | |
| 9.46 | 39.40 | 0.99 | 4.94 | 98.85 | 0.22 | LDL | LDL | LDL | |||
| Austre Lovénbreen | AL2 | 112.7 | 118.9 | 12.66 | 108.6 | 166.8 | 164.9 | 0.23 | LDL | 102.2 | |
| AL4 | 19.28 | 9.98 | 40.42 | 128.6 | 46.27 | 3.43 | 0.12 | 13.02 | 3.41 | ||
| Pedersenbreen | P1 | 24.11 | 13.61 | 10.19 | 23.81 | 53.25 | 0.86 | LDL | LDL | 1.46 | |
| P2 | 14.41 | 7.47 | 22.94 | 79.59 | 30.09 | 1.87 | 0.01 | LDL | 3.87 | ||
| Average of above value | 20.45 | 28.87 | 12.64 | 38.16 | 82.10 | 14.77 | 0.07 | 2.92 | 12.49 | ||
| Supraglacial meltwater | Austre Lovénbreen | AL1 | 0.91 | LDL | 5.35 | 53.92 | 30.47 | 1.65 | 0.16 | LDL | 10.09 |
| Englacial meltwater | AL3 | 3.55 | 3.99 | 6.45 | 25.90 | 17.38 | 4.17 | 0.05 | 0.37 | 3.47 | |
| Groundwater | Moss Land | GW | 6.75 | 39.17 | 32.78 | 64.54 | 278.0 | 3.04 | 0.14 | 12.31 | 4.37 |
| Note: LDL refers to the trace metal concentration is lower than the method determination limit. | |||||||||||
| Region | Al/(μg·L−1) | Cr/(ng·L−1) | Mn/(μg·L−1) | Co/(ng·L−1) | Cu/(ng·L−1) | Fe/(μg·L−1) | Zn/(μg·L−1) | Cd/(ng·L−1) | Pb/(ng·L−1) | Literature | ||
| Svalbard | Scott River | n = 9 | 1.62 ± 1.47 | 10 ± 11 | 2.58 ± 3.74 | 33 ± 11 | 54 ± 81 | n.a. | 0.36 ± 0.33 | 29 ± 22 | 13 ± 3 | Lehmann-Konera et al. (2021) |
| Ny-Ålesund | n = 13 | 20.5 ± 27.0 | 28.9 ± 29.2 | 12.6 ± 9.75 | 38.2 ± 39.1 | 82.1 ± 40.3 | 14.8 ± 43.4 | 0.07 ± 0.07 | 2.92 ± 4.55 | 12.5 ± 28.7 | this study | |
| Greenland | Leverett Glacier |
n = 82 | 445 | 311 | 3.99 | 90.2 | 667 | 133 | 0.46 | 0.67 | 37.7 | Hawkings et al. (2020) |
| Southern Greenland |
n= 16 | 67.5 ± 98.9 | 79.3 ± 96.5 | 6.08 ± 3.74 | n.a. | 541 ± 377 | 71.1 ± 108 | 1.78 ± 1.58 | n.a. | n.a. | Aciego et al. (2015) | |
| Canadian Arctic Archipelago |
n = 28 | 5.63 ± 5.61 | n.a. | 1.08 ± 2.33 | n.a. | 308 ± 247 | 7.42 ± 16.1 | 0.11 ± 0.13 | 1.13 ± 0.54 | 2.76 ± 4.14 | Colombo et al. (2019) | |
| Switzerland | Haut Glacier d’Arolla |
n = 132 | 35 | 930 | 9.4 | 100 | 670 | 390 | 6.7 | 210 | 200 | Mitchell et al. (2006) |
| Antarctica | Onyx River | n = 11 | n.a. | n.a. | 1.26 ± 0.65 | n.a. | 190.6 ± 27.9 | 18.7 ± 16.8 | 0.24 ± 0.15 | 25.9 ± 21.5 | n.a. | Green et al. (2005) |
| Note: n.a., data not available. | ||||||||||||
 DownLoad: