Li Li, Quan Li, Tao Cheng, Songling Yang, Yong Rao, Xinyu Liu, Wenjing Ding. Geochemical characteristics and origins of natural gases in the eastern Cote d’Ivoire Basin, West Africa[J]. Acta Oceanologica Sinica, 2024, 43(8): 26-36. doi: 10.1007/s13131-024-2335-6
Citation:
Li Li, Quan Li, Tao Cheng, Songling Yang, Yong Rao, Xinyu Liu, Wenjing Ding. Geochemical characteristics and origins of natural gases in the eastern Cote d’Ivoire Basin, West Africa[J]. Acta Oceanologica Sinica, 2024, 43(8): 26-36. doi: 10.1007/s13131-024-2335-6
Li Li, Quan Li, Tao Cheng, Songling Yang, Yong Rao, Xinyu Liu, Wenjing Ding. Geochemical characteristics and origins of natural gases in the eastern Cote d’Ivoire Basin, West Africa[J]. Acta Oceanologica Sinica, 2024, 43(8): 26-36. doi: 10.1007/s13131-024-2335-6
Citation:
Li Li, Quan Li, Tao Cheng, Songling Yang, Yong Rao, Xinyu Liu, Wenjing Ding. Geochemical characteristics and origins of natural gases in the eastern Cote d’Ivoire Basin, West Africa[J]. Acta Oceanologica Sinica, 2024, 43(8): 26-36. doi: 10.1007/s13131-024-2335-6
School of Natural Sciences, Macquarie University, Sydney, NSW, 2109, Australia
3.
CNOOC Research Institute, Beijing 100028, China
Funds:
The Major Science and Technology Project of CNOOC under contract No. KJGG2022-0902; the National Natural Science Foundation of China under contract Nos 42202184 and 42272177.
The gas sources in the eastern Cote d’Ivoire Basin (Tano Basin) are seldom reported and remain controversial due to multiple sets of potential source rocks and poorly documented geochemical characteristics of natural gases. The marine source rock potential from the Upper Albian to Turonian as well as the molecular composition and the stable carbon isotope composition of natural gases in the eastern Cote d’Ivoire Basin were studied in detail to investigate the origins of natural gases. The total organic carbon (TOC), hydrogen index (HI), and generation potential (S1 + S2) of source rocks indicate that both sapropelic source rocks and humic source rocks developed during the late Albian, whereas sapropelic source rocks developed during the Cenomanian and the Turonian. The normal order of δ13CH4< δ13C2H6< δ13C3H8 (δ13C1< δ13C2< δ13C3), the relationship between C2/C3 molar ratio and δ13C2-δ13C3, and the plot of δ13C1 versus C1/(C2+C3) collectively show that the natural gases are thermogenic due to the primary cracking of kerogen, including the typical oil-associated gases from Well D-1, the mixed oil-associated gases and coal-derived gases from Well G-1 and Well L-1. Based on the plot of δ13C1 versus δ13C2 and the established relationship between δ13C1 and equivalent vitrinite reflectance (Ro), we proposed that the natural gases are in a mature stage (Ro generally varies from 1.0% to 1.3%). Combined with results of basin modelling and oil-to-source correlation, the transitional to marine source rocks during the late Albian were thought to have made a great contribution to the natural gases. Our study will make a better understanding on petroleum system in the eastern Cote d’Ivoire Basin.
The stable isotope and elemental compositions of planktonic foraminiferal shells are important paleoceanographic proxies (Lea et al., 2000; Mohtadi et al., 2014; Stott et al., 2002). Based on the use of such proxies, a series of important research findings, including significant hydrological changes in the low latitude and the discovery of the super El Niño/Southern Oscillation (ENSO) or ENSO-like cycles have been obtained (Koutavas and Joanides, 2012; Mohtadi et al., 2010; Stott et al., 2002). Globigerinoides ruber (white) and Trilobatus sacculifer are two dominant species in tropical and subtropical oceans, serving as commonly used paleoceanographic proxies (Chowdhury et al., 2003; Jayan et al., 2021; Rippert et al., 2016; Sijinkumar et al., 2010; Steinke et al., 2005). In this respect, a major portion of existing knowledge on past surface seawater characteristics is based on these two surface-dwelling planktonic foraminifera species, G. ruber (white) and T.sacculifer (Gussone et al., 2004; Mohtadi et al., 2010; Steinke et al., 2005). However, the two species both have morphotypes, and the difference of geochemical proxies between these morphological shell types has not been thoroughly examined.
Globigerinoides ruber (white) has two main morphotypes, namely, the sensu stricto (s.s.) and sensu lato (s.l., or “Elongatus morphotypes”) morphotypes, which in most tropical sediments, are usually differentiated using taxonomic criteria (Jayan et al., 2021; Wang, 2000). Specifically, G. ruber s.l. is characterized by a more compact and higher degree of trochospiral coiling than G. ruber s.s. (Wang, 2000; Figs 1a and b). Their different isotopic compositions of these morphotype shells from surface sediments indicate that they inhabit at different water depths, G. ruber s.s. at a shallower depth than that of G. ruber s.l. (Antonarakou et al., 2015; Kawahata, 2005; Steinke et al., 2005; Wang, 2000). Thus, in the last two decades, G. ruber Mg/Ca ratios have been widely used as a proxy for reconstructing sea surface temperature (SST) in tropical and subtropical oceans (Dang et al., 2012; Jia et al., 2018; Lea et al., 2000; Medina-Elizalde and Lea, 2005; Stott et al., 2002). However, some studies have indicated that the Mg/Ca ratios of G. ruber s.s. and G. ruber s.l. in the South China Sea and the eastern Indian Ocean are significantly different (Steinke et al., 2005, 2008). Conversely, the results of some other studies have revealed that the two G. ruber morphotypes have relatively similar Mg/Ca ratios in some areas in the eastern Indian Ocean (Mohtadi et al., 2009, 2010) and western equatorial Pacific Ocean (Tachikawa et al., 2014). It appears that it is still debatable whether or not difference of shell Mg/Ca ratios exists between different morphotypes, hence SST reconstruction. Thereby, whether there are significant differences between the Mg/Ca ratios of G. ruber s.s. and G. ruber s.l. might be important for reconstructing SST changes and upper-ocean structure.
Figure
1.
Scanning electron micrographs of G. ruber (white) and T. sacculifer morphotypes: G. ruber sensu stricto (s.s.) (a), G. ruber sensu lato (s.l.) (b), T. sacculifer (with a sac-like final chamber) (c), and T. sacculifer (without a sac-like final chamber) (d). The foraminferal shells are from core-top sample of Core MD06-3047B. Scale bars (500 μm) are indicated on each image.
Additionally, modern T. sacculifer also has two basic morphotypes, i.e., with (w) and without (w/o) a sac-like final chamber) (André et al., 2013; Bijma and Hemleben, 1994; Spezzaferri et al., 2015). Based on the analysis of sediment samples from the Atlantic Ocean, Elderfield et al. (2002) and Anand et al. (2003) observed that there are slight differences in oxygen-carbon isotope composition and Mg/Ca ratios between T. sacculifer (w) and T. sacculifer (w/o). Nevertheless, great care has been taken to distinguish the two morphotypes of T. sacculifer when this species is used for SST reconstruction in most previous studies (Lynch-Stieglitz et al., 2015; Setiawan et al., 2015). However, few studies have referred whether there is significant difference through geological time. This is important to verify if it is necessary to strictly select the same morphotype of T. sacculifer for downcore Mg/Ca analytical testing.
However, the spatial and temporal differences in Mg/Ca between different morphotypes of G. ruber and T. saccluifer and its influencing factors are still not clear enough. How much the uncertainty of Mg/Ca records of different morphotypes exists is important for deciding whether mixed morphotypes of the two species can be used for SST reconstruction, especially in study areas where there are insufficient single morphotype shells for Mg/Ca testing. In addition, what environmental parameters are responsible for the Mg/Ca differences between different morphotypes can help figure out the potential of the inter-morphotype Mg/Ca differences as indicators for upper-water structure in the western tropical Pacific. The western Philippine Sea (WPS) has become an important area for paleoceanography studies of the western tropical Pacific. Exploring the differences in Mg/Ca ratios between the different morphotypes of G. ruber (white) and T. sacculifer in this area is significant for using their Mg/Ca ratios to reflect changes in SST or thermal structure. In this study, we investigate the differences in Mg/Ca ratios and SST estimations between the different morphotypes of G. ruber (white) and T. sacculifer in the WPS. On this basis, by collecting and comparing relevant data from other sites over the western tropical Pacific, we further discuss the spatial and temporal variations of inter-morphotype G. ruber Mg/Ca between different morphotypes and its potential as indicators of upper-ocean structure.
2.
Materials and methods
2.1
Materials
Core MD06-3047B (17°00.44'N, 124°47.93'E; 2510 m water depth) from the WPS was recovered using a Calypso Giant Piston Corer on board the R/V Marion‒Dufresne vessel during the Marco Polo 2 cruise of the International Marine Global Change Studies Program (IMAGES) in June 2006. The coring site, located on the Benham Rise formed at ~50–45 Ma, is approximately 240 km east off Luzon (Hilde and Lee, 1984). The core sediments primarily consist of yellowish-brown silty clay with no visible evidence of sediment deformation (Jia et al., 2018), and for this study, the sediments were sampled at 4 cm intervals from the upper 60 cm of the core. The age model was established by correlating the benthic foraminiferal δ18O record of this core to LR04 stack (Jia et al., 2018). The 0–60 cm portion of the core provided a continuous record covering the last ~47 ka, spanning from MIS 3 to MIS 1, with a mean temporal resolution of approximately 3 ka (Jia et al., 2018).
2.2
Mg/Ca analyses and seawater temperature estimates
Approximately 30–50 tests of G. ruber s.s., G. ruber s.l., T. sacculifer (w), and T. sacculifer (w/o) (Fig. 1) respectively were hand-picked from the 250–300 μm size fraction to determine Mg/Ca ratios. Samples corresponding to the intervals of 38–39 cm and 42–43 cm were mixed for G. ruber s.s. Mg/Ca testing, as the amounts of G. ruber s.s. specimens in individual samples are insufficient for analysis. These samples for Mg/Ca analysis were cleaned in accordance with previously reported treatment procedures without a reductive step (Barker et al., 2003). Next, the Mg/Ca ratios were analyzed by inductively coupled plasma-optical emission spectrometry (ICP-OES, iCAP6300 radial, Thermo Fisher, Waltham, MA, USA) at the Institute of Oceanology, Chinese Academy of Sciences. The long-term internal reproducibility (SD) is 0.07 mmol/mol based on a consistency standard (Mg/Ca = 3.33 mmol/mol). Additionally, the elemental ratios of Fe/Ca, Al/Ca, and Mn/Ca were analyzed at the same time to monitor any contamination by the oxides of iron and manganese, which could bias the Mg/Ca measurements. Notably, there was no significant positive correlation of Fe/Ca, Al/Ca, and Mg/Ca values, indicating negligible contamination of detrital materials and/or metal-oxides on the Mg/Ca ratios (Fig. 2).
Figure
2.
Fe/Ca (left), Al/Ca (middle) and Mn/Ca (right) versus Mg/Ca of the G. ruber (white) and T. sacculifer. There is no obvious correlation between these records, indicating negligible influence of contamination on Mg/Ca ratios.
First, the Mg/Ca (mmol/mol) ratios were converted to temperature (T, ℃) using a multispecies regression equation (Anand et al., 2003):
$$ T = {\mathrm{ln}} [{\mathrm{Mg}}/{\mathrm{Ca}} /0.38]/0.09. $$
(1)
The error of the temperature reconstruction was estimated by propagating the errors introduced by the Mg/Ca measurements and the Mg/Ca-temperature calibration, as introduced by Mohtadi et al. (2014). The resulting errors were on average of ± 1.0℃, similar to those associated with Mg/Ca-temperature calibration reported in other studies (Anand et al., 2003; Dekens et al., 2002; Sagawa et al., 2012).
For comparison, we also use species-specific equations. including
$$ T = {\mathrm{ln}}[{\mathrm{Mg}}/{\mathrm{Ca}}/0.31]/0.097 \;{\mathrm{for}}\;G.\;ruber\; {\mathrm{s}}.{\mathrm{s}} .$$
(2)
$$ T ={\mathrm{ln}} [{\mathrm{Mg}}/{\mathrm{Ca}} /0.32]/0.097 \;{\mathrm{for}}\; G.\; ruber\; {\mathrm{s}}.{\mathrm{l}}. $$
$$ T = {\mathrm{ln}} [{\mathrm{Mg}}/{\mathrm{Ca}} /0.67]/0.069 \;{\mathrm{for}} \;T.\; sacculifer \;({\mathrm{w}}.).$$
(5)
from Anand et al. (2003). The errors estimated by error propagation are on average of ±2.1℃ and ±2.0℃ for temperature estimates of G. ruber s.s. and G. ruber s.l., ±7.4℃ and ±8.0℃ for that of T. sacculifer (w/o) and T. sacculifer (w), respectively. By comparison of temperature estimates and corresponding differences based on multispecies and species-specific equations, consistent variation trends were observed (Fig. S1). Considering the larger errors from temperature estimate based on species-specific equations, and to facilitate the comparison of temperature estimates from Mg/Ca ratios of different morphotypes of G. ruber (white) and T. sacculifer, we choose to use the estimates using the multispecies equation in the following analysis.
2.3
Data collection
To compare results from our study site with those from other regions across the western tropical Pacific, we collect published Mg/Ca ratios of G. ruber s.s. and G. ruber s.l. of the core-top sediment samples from the South China Sea, Offshore Papua New Guinea, Gulf of Papua, and the WPS (Hollstein et al., 2017; Regoli et al., 2015; Steinke et al., 2005). Then the difference between the Mg/Ca ratios of two morphotypes of G. ruber [Δ(Mg/Ca)G.ruber s.s.−s.l.] are estimated see Table S2. Data of mixed-layer depth (MLD) of annual average, average from June to August, and average from December to February, respectively, are retrieved from Monterey and Levitus (1997).
2.4
Statistical analysis
Welch’s test is performed to analyze the Mg/Ca ratios of the different morphotypes of G. ruber and T. sacculifer. First, for comparison, the mean values of the two sets of data are assumed to be equivalent if the Mg/Ca ratios of G. ruber s.s. and G. ruber s.l., or T. sacculifer (w.) and T. sacculifer (w/o) are similar. Thus, the null hypothesis is accepted (H = H0), indicating no significant difference in Mg/Ca ratios between the different morphotypes of G. ruber and T. sacculifer. If significant mean differences were observed, the null hypothesis would be rejected (H = Ha), indicating significant difference in Mg/Ca ratios between different morphological types of these species.
3.
Results
3.1
Mg/Ca ratios and temperature estimation
The Mg/Ca ratios and temperature estimates of G. ruber s.s., G. ruber s.l., T. sacculifer (w), and T. sacculifer (w/o) generally show similar variation trends since MIS 3 (Fig. 3; Table S1). The core-top Mg/Ca values of G. ruber s.s., G. ruber s.l., T. sacculifer (w), and T. sacculifer (w/o) yields temperature estimates of 27.2℃, 25.6℃, 24. 7℃, 24.5℃, respectively, matching well with previous conclusions that the calcification depth of G. ruber s.s. is shallower than that of G. ruber s.l., and that the calcification depth of G. ruber is shallower than that of T. sacculifer (Hollstein et al., 2017). The overall Mg/Ca ratios of G. ruber s.s. was higher than that of G. ruber s.l., and the Δ(Mg/Ca)G.ruber s.s.−s.l. varied in the range of ~0.05–0.59 mmol/mol, with a mean value of ~0.32 mmol/mol. The differences in temperature estimates based on Mg/Ca ratios of G. ruber s.s. and G. ruber s.l. varied between ~0.2℃ and 1.6℃, with a mean value of ~1.0℃. The difference between the Mg/Ca ratios of the two morphotypes of T. sacculifer [Δ(Mg/Ca)T.sacculifer w/o−w] varies in the range of –0.29 mmol/mol to 0.35 mmol/mol, with a mean value ~0.03 mmol/mol, and an average value of absolute Δ(Mg/Ca)T.sacculifer w/o−w of ~0.13 mmol/mol. The corresponding difference in temperature estimates varied in the range of –1.1–1.3℃, showing a mean difference of ~0.1℃. The variation in Δ(Mg/C)aT.sacculifer w/o−w could be divided into three stages: (1) since ~12.5 ka, Mg/Ca ratios of T. sacculifer (w) and T. sacculifer (w/o) show no obvious differences (the mean difference was only ~0.08 mmol/mol), (2) between ~21.7 ka and 12.5 ka, Mg/Ca of T. sacculifer (w/o) are slightly higher than those of T. sacculifer (w), with a mean difference of ~0.16 mmol/mol, (3) between ~40 ka and 21.7 ka, Mg/Ca ratios of T. sacculifer (w/o) are lower than those of T. sacculifer (w), with a mean difference of ~0.18 mmol/mol. Additionally, during the 47–40 ka period, Mg/Ca of T. sacculifer (w) and T. sacculifer (w/o) show no obvious differences, with a mean difference of ~0.07 mmol/mol.
Figure
3.
Mg/Ca ratios (a, b), and Mg/Ca-based temperature (c, d) estimates (based on the multispecies equation from Anand et al. (2003)) of G. ruber s.s., G. ruber s.l., T. sacculifer (w), and T. sacculifer (w/o) of Core MD06-3047B , and the differences between these records for each species.
3.2
Regional difference of Δ(Mg/Ca)G.ruber s.s.−s.l.
By comparing the Δ(Mg/Ca)G.ruber s.s.−s.l. records obtained from our study and those from core-top samples in other areas across the western tropical Pacific, we found that the Δ(Mg/Ca)G.ruber s.s.−s.l. vary widely from one area to another (Antonarakou et al., 2015; Hollstein et al., 2017; Mohtadi et al., 2010). Based on the collected data, Δ(Mg/Ca)G.ruber s.s.−s.l. offshore Papua New Guinea and in the Gulf of Papua are relatively small, with an average difference of approximately 0.09 mmol/mol. The average Δ(Mg/Ca)G.ruber s.s.−s.l. from the WPS and the South China Sea are larger, with an average of ~0.47 mmol/mol. Generally, Δ(Mg/Ca)G.ruber s.s.−s.l. values from core-top samples collected around the center of western Pacific warm pool (WPWP) are relatively small, while those observed from the northern margin of the WPWP were relatively large (Fig. 4).
Figure
4.
Comparison of Δ(Mg/Ca)G.ruber s.s.−s.l. from core-top sediment samples and the mixed-layer depth (MLD) in the western tropical Pacific. a. Location map showing the sites of the core-top Δ(Mg/Ca)G.ruber s.s.−s.l.. The red dots represent positive Δ(Mg/Ca)G.ruber s.s.−s.l. values, while the white dots indicate negative Δ(Mg/Ca)G.ruber s.s.−s.l. values. The sizes of the symbols denote the magnitude of the absolute values of the Δ(Mg/Ca)G.ruber s.s.−s.l. records. b–e. Plots of Δ(Mg/Ca)G.ruber s.s.−s.l. vs. average annual MLD (b), difference between winter and summer MLD (c), summer MLD (d), and winter MLD (e). Data of the South China Sea and WPS are obtained from Steinke et al. (2005), those in the Gulf of Papua and offshore Papua New Guinea from Hollstein et al. (2017) and Tachikawa et al. (2014). Detailed information regarding the data sites is provided in Table S2. Data of the MLD are from Monterey and Levitus (1997).
4.1
Morphotype dependence of Mg/Ca ratios for G. ruber and T. sacculifer in the WPS
The average value of Δ(Mg/Ca)G.ruber s.s.−s.l. is approximately ~0.32 mmol/mol, with a maximum value of ~0.59 mmol/mol, much larger than the reproducibility of Mg/Ca measurements (±0.07 mmol/mol). The difference between the Mg/Ca-based temperature estimates of these two morphotypes is ~1.0℃ on average, with a maximum difference of 1.6℃, also larger than the error of the temperature reconstructions (±1℃). Based on the results of the Welch’s test performed on the Mg/Ca ratios of G. ruber s.s. and G. ruber s.l. and the estimated water temperatures, we reject the null hypothesis (H = Ha), thus, the G. ruber Mg/Ca ratios and estimated temperatures of different morphotypes show significant difference in the WPS (Table 1). Therefore, when using the Mg/Ca ratios G. ruber for SST reconstruction, a monomorphic type of is better to be selected, to avoid the effect of the Mg/Ca differences between morphotypes on the reconstruction of SSTs. If mixed morphotypes must be used, the difference value (~1.0℃) between different morphotypes should be considered.
Table
1.
Mean values of the Mg/Ca ratios (mmol·mol−1) of G. ruber s.s., G. ruber s.l., T. sacculifer (w), and T. sacculifer (w/o) based on geochemical measurements using Core MD06-3047B with outcomes obtained by performing Welch’s t test at a p < 0.05 significance level.
Mg/Ca
T/℃
Mg/Ca
T/℃
G. ruber s.s.
3.72
25.29
T. sacculifer (w/o)
3.17
23.64
G. ruber s.l.
3.40
24.28
T. sacculifer (w)
3.20
23.53
H
Ha
Ha
H
H0
H0
Note: H = H0 implies the null hypothesis cannot be rejected; H = Ha implies the null hypothesis can be rejected.
Additionally, the Mg/Ca ratios of T. sacculifer (w) and T. sacculifer (w/o) at MD06-3047B and the estimated water temperatures showed relatively small differences. The Δ(Mg/Ca)T.sacculifer w/o−w value is only ~0.03 mmol/mol on average, less than the reproducibility of Mg/Ca measurements (±0.07 mmol/mol). Further, Welch’s test also showed that the Mg/Ca ratios of T. sacculifer (w) and T. sacculifer (w/o) and the estimated temperatures are not significantly different (H = H0) (Table 1). However, the Δ(Mg/Ca)T.sacculifer w/o−w show staged variation, and the Δ(Mg/Ca)T.sacculifer w/o−w values are also greater than the reproducibility of the Mg/Ca measurements (±0.07 mmol/mol) within different periods. This possibly indicates that there are significant differences in the Mg/Ca ratios of T. sacculifer (w) and T. sacculifer (w/o) during different geological periods. Thus, when reconstructing water temperature using the Mg/Ca ratios of T. sacculifer in the WPS, it is better to use data based on a monomorphic type of T. sacculifer if the sedimentary records span over glacial-interglacial stages.
A question is, “what causes the staged variation of Δ(Mg/Ca)T.sacculifer w/o-w.?”. In a previous study, it was observed that the abundance of the T. sacculifer (w) morphotype increases with increasing temperature compared with that of T. sacculifer (w/o) (André et al., 2013), possibly indicating a higher calcification temperature of T. sacculifer (w) than that of T. sacculifer (w/o). However, this feature cannot explain the step-wise negative/positive variations in the Δ(Mg/Ca)T.sacculifer w/o−w of MD06-3047B. Modern research indicated that there are little or no genetic differences between T. sacculifer morphotypes, and the development of the sac-like final chamber is just considered as a phenotype (André et al., 2013; Darling and Wade, 2008). However, based on fossil records, the two morphotypes have different ecological preferences (Spezzaferri et al., 2015). Thus, it seemed more complicated when the habitats of the different T. sacculifer morphotypes through geological time were considered. According to δ18O and Mg/Ca records of the two morphotypes from Anand et al. (2003), the calcification depth of T. sacculifer (w/o) seems shallower (deeper) than T. sacculifer (w) during winter (summer), which may be due to the different sensitivity of the two morphotypes to seasonal variation. Thus, we speculate that the staged negative/positive variations of ΔTT.sacculifer w/o−w since ~47 ka might be associated with alternate stronger winter/summer monsoons (Fig. 5; Cheng et al., 2016; Guo et al., 2009). That is higher (lower) ΔTT.sacculifer w/o−w corresponds to stronger (weaker) East Asian winter monsoon (EAWM) and weaker (stronger) East Asian summer monsoon (EASM) (Figs 5a, c and d). This seems conflict with the modern observation that deeper mixed layer depth and smaller vertical thermal gradient are developed during winter than summer around our study area (Locarnini et al., 2013). Thus, the relationship between ΔTT.sacculifer w/o−w and upper-ocean structure might be more complicated, that needs to be fully examined by further studies on core-top sediment, sediment trap and/or culture experiments.
Figure
5.
Estimated water temperatures based on the Mg/Ca ratios of G. ruber s.s., G. ruber s.l., T. sacculifer (w), and T. sacculifer (w/o) (a). Differences in estimated temperatures based on the Mg/Ca ratios of G. ruber s.s. and G. ruber s.l. (b). Smectite crystallinity values of Core MD06-3047 (Xu et al., 2012) and the speleothem δ18O records from caves in China (Cheng et al., 2016) (c). Differences in estimated temperatures based on the Mg/Ca ratios of T. sacculifer (w/o) and T. sacculifer (w), and loess grain-size changes (content of the >32 μm fraction) from Xifeng Section, Loess Plateau of China (Guo et al., 2009). EASM and EAWM means East Asian summer and winter monsoons, respectively."+" means stronger monsoon, "-" means weaker monsoon.
4.2
Factors affecting regional differences of ΔMg/CaG.ruber s.s.−s.l.values
Considering that G. ruber predominantly inhabits in the mixed layer, we assumed that the regional distribution of core-top Δ(Mg/Ca)G.ruber s.s.−s.l. could be attributed to variability in the MLD of the upper-ocean. Accordingly, the core-top Δ(Mg/Ca)G.ruber s.s.−s.l. from the western tropical Pacific are compared with the annual mean MLD and the seasonal difference of MLD between winter and summer at these sites (Fig. 4b and c). As shown in Fig. 4b, no correlation is observed between the core-top Δ(Mg/Ca)G.ruber s.s.−s.l. and the annual mean MLD (R2 = 0.00004), indicating little influence of annual mean MLD on the Δ(Mg/Ca)G.ruber s.s.−s.l.. We also observed a negative relationship between the core-top Δ(Mg/Ca)G.ruber s.s.−s.l. and the difference between MLD in winter and summer (R2 = 0.269), possibly suggesting a certain role played by the seasonal fluctuation of MLD on the Δ(Mg/Ca)G.ruber s.s.−s.l. values. For further analysis, we plotted the core-top Δ(Mg/Ca)G.ruber s.s.−s.l. against the winter and summer MLD (Figs 4d and e), from which it can be observed that the Δ(Mg/Ca)G.ruber s.s.−s.l. are more significantly correlated with summer MLD (R2 = 0.523) than winter MLD (R2 = 0.001). This observation implies that changes in summer MLD may be the major factor for the Δ(Mg/Ca)G.ruber s.s.−s.l. over the western tropical Pacific.
The negative relationship between the core-top Δ(Mg/Ca)G.ruber s.s.−s.l. and summer MLD indicates that larger Δ(Mg/Ca)G.ruber s.s.−s.l. might be related to a shallower summer MLD. Although there is evidence that G. ruber can generally reflect annual surface water conditions (Dekens et al., 2002; Lea et al., 2000), a plankton tow study indicates high abundance of G. ruber (white) in the warm summer surface waters of the western tropical Pacific (Troelstra and Kroon, 1989). Additionally, the two morphotypes of G. ruber (G. ruber s.s. and G. ruber s.l.) show different vertical distributions (Kuroyanagi and Kawahata, 2004), as G. ruber s.s. is consistently calcified in warmer waters to a greater degree than G. ruber s.l., due to the shallower habitat depth or a more summer-weighted seasonal distribution of G. ruber s.s (Antonarakou et al., 2015). It has also been reported that in the South China Sea, G. ruber s.s. is predominant in summer and in shallower water layers (0–40 m), while G. ruber s.l. predominant in deeper water layers (40–60 m) (Zhang et al., 2020). Thus, we could speculate that the summer-weighted seasonal distribution and different vertical distributions of G. ruber morphotypes can lead to relatively strong negative correlation between Δ(Mg/Ca)G.ruber s.s.−s.l. and summer MLD in the western tropical Pacific. This relationship lends strong support to propose that Δ(Mg/Ca)G.ruber s.s.−s.l. and the corresponding differences in Mg/Ca-based temperatures between G. ruber s.s. and G. ruber s.l. (ΔTG.ruber s.s.−s.l.) are indicators of changes in summer mixed-layer depth.
To verify whether Δ(Mg/Ca)G.ruber s.s.−s.l. and ΔTG.ruber s.s.−s.l. records can reflect summer MLD in geological history, we compared the ΔTG.ruber s.s.−s.l. records from Core MD06-3047B since 47 ka with records reflecting changes in EASM, including the smectite crystallinity values from Site MD06-3047 (Xu et al., 2012) and the speleothem δ18O records from caves in China (Cheng et al., 2016). As shown in Fig. 5, the ΔTG.ruber s.s.−s.l. records show overall covariance with EASM, with higher values corresponding to a stronger EASM. In the WPS, a stronger EASM can lead to a shallower summer MLD (Hao et al., 2012; Qu, 2003; Tozuka et al., 2002), as in the boreal summer, the prevailing westly/southwesterly wind may produce a positive wind stress curl that results in Ekman divergence and upwelling in the study area (Xiong et al., 2022). Thus, in the WPS, the significant difference between estimated temperatures based on downcore Mg/Ca ratios of G. ruber s.s. and G. ruber s.l. might be affected by EASM-driven summer MLD changes. This result provides further evidence for the potential of ΔTG.ruber s.s.−s.l. records to serve as indicators of changes in summer MLD at orbital timescale. The higher Δ(Mg/Ca)G.ruber s.s.−s.l. indicates shallower MLD and stronger EASM. More records of the MLD and summer monsoon in this area are needed for further validation.
5.
Conclusions
In this study, we present the Mg/Ca records of G. ruber s.s., G. ruber s.l., T. sacculifer (w), and T. sacculifer (w/o) in the upper 60 cm of Core MD06-3047B obtained from the WPS. Based on the results obtained, we arrived at the following conclusions:
(1) Since MIS 3, significant consistent differences exist in the Mg/Ca ratios and the estimated temperatures between the morphotypes of G. ruber from Site MD06-3047B; while staged changes in the differences of Mg/Ca ratios are observed between the morphotypes of T. sacculifer. We suggest that when reconstructing SST changes using the Mg/Ca ratios of G. ruber and T. sacculifer in the WPS, it should be better to select one single morphotype.
(2) Systematic patterns are observed in the core-top Δ(Mg/Ca)G.ruber s.s.−s.l. across the western tropical Pacific, which show negative correlation with summer MLD. Combining with the covariance between downcore ΔTG.ruber s.s.−s.l. records of Core MD06-3047B and summer monsoon changes, we propose that Δ(Mg/Ca)G.ruber s.s.−s.l. may serve as a potential indicator of summer MLD changes.
Acknowledgements:
We thank the chief scientist Carlo Laj, the captain and the crew of R/V Marion Dufresne, and the French Polar Institute for their efforts and support during the IMAGES XIV-MD155-Marco Polo 2 cruise.
Antobreh A A, Faleide J I, Tsikalas F, et al. 2009. Rift–shear architecture and tectonic development of the Ghana margin deduced from multichannel seismic reflection and potential field data. Marine and Petroleum Geology, 26(3): 345–368, doi: 10.1016/j.marpetgeo.2008.04.005
Atta-Peters D, Achaegakwo C A, Kwayisi D, et al. 2015. Palynofacies and source rock potential of the ST-7H well, offshore Tano Basin, western region, Ghana. Journal of Earth Science, 4(1): 1–20
Atta-Peters D, Garrey P. 2014. Source rock evaluation and hydrocarbon potential in the Tano Basin, south western Ghana, west Africa. International Journal of Oil, Gas and Coal Engineering, 2(5): 66–77
Basile C, Mascle J, Benkhelil J, et al. 1998. Geodynamic evolution of the Côte d'Ivoire-Ghana transform margin: an overview of Leg 159 results. In: Mascle J, Lohmann G P, Moullade M, eds. Proceedings of the Ocean Drilling Program, Scientific Results. 101–110 (doi: 10.2973/odp.proc.sr.159.048.1998
Basile C, Mascle J, Popoff M, et al. 1993. The Ivory Coast-Ghana transform margin: a marginal ridge structure deduced from seismic data. Tectonophysics, 222(1): 1–19, doi: 10.1016/0040-1951(93)90186-N
Bempong F K, Ozumba B M, Hotor V, et al. 2019. A review of the geology and the petroleum potential of the Cretaceous Tano Basin of Ghana. Journal of Petroleum & Environmental Biotechnology, 10(4): 1000395
Benkhelil J, Mascle J, Guiraud M. 1998. Sedimentary and structural characteristics of the Cretaceous along the Côte d'Ivoire-Ghana transform margin and in the Benue Trough: a comparison. In: Mascle J, Lohmann G P, Moullade M, eds. Proceedings of the Ocean Drilling Program, Scientific Results. 93–99, doi: 10.2973/odp.proc.sr.159.007.1998
Bernard B B, Brooks J M, Sackett W M. 1976. Natural gas seepage in the Gulf of Mexico. Earth and Planetary Science Letters, 31(1): 48–54, doi: 10.1016/0012-821X(76)90095-9
Berner U, Faber E. 1996. Empirical carbon isotope/maturity relationships for gases from algal kerogens and terrigenous organic matter, based on dry, open-system pyrolysis. Organic Geochemistry, 24(10-11): 947–955, doi: 10.1016/S0146-6380(96)00090-3
Berner U, Faber E, Stahl W. 1992. Mathematical simulation of the carbon isotopic fractionation between huminitic coals and related methane. Chemical Geology: Isotope Geoscience Section, 94(4): 315–319, doi: 10.1016/0168-9622(92)90006-V
Bird S, Geno K, Enciso G. 2001. Potential deep water petroleum system, ivory coast, west Africa. In: Fillon R H, Rosen N C, Weimer P, et al, eds. Petroleum Systems of Deep-Water Basins–Global and Gulf of Mexico Experience. Tulsa: SEPM Society for Sedimentary Geology
Blarez E, Mascle J. 1988. Shallow structures and evolution of the Ivory Coast and Ghana transform margin. Marine and Petroleum Geology, 5(1): 54–64, doi: 10.1016/0264-8172(88)90039-6
Brownfield M E, Charpentier R R. 2006. Geology and total petroleum systems of the Gulf of Guinea province of west Africa. Reston: U. S. Geological Survey, 38
Chierici M A. 1996. Stratigraphy, palaeoenvironments and geological evolution of the Ivory Coast-Ghana Basin. In: Bulletin des Centres de Recherches Exploration-Production Elf-Aquitaine. Pau, France: Elf Aquitaine, 293–303
Clift P D, Lorenzo J, Carter A, et al. 1997. Transform tectonics and thermal rejuvenation on the Côte d’Ivoire–Ghana margin, west Africa. Journal of the Geological Society, 154(3): 483–489, doi: 10.1144/gsjgs.154.3.0483
Dai Jinxing. 1992. Identification of various genetic natural gases. China Offshore Oil and Gas (in Chinese), 6(1): 11–19
Dai Jinxing, Gong Deyu, Ni Yunyan, et al. 2014. Stable carbon isotopes of coal-derived gases sourced from the Mesozoic coal measures in China. Organic Geochemistry, 74: 123–142, doi: 10.1016/j.orggeochem.2014.04.002
Dai Jinxing, Ni Yunyan, Huang Shipeng, et al. 2016. Secondary origin of negative carbon isotopic series in natural gas. Journal of Natural Gas Geoscience, 1(1): 1–7, doi: 10.1016/j.jnggs.2016.02.002
Dai Jinxing, Ni Yunyan, Li Jian, et al. 2008. Carbon isotope types and significances of alkane gases from Junggar Basin and Tarim Basin. Xinjiang Petroleum Geology (in Chinese), 29(4): 403–410
Dai Jinxing, Qin Shengfei, Tao Shizhen, et al. 2005. Developing trends of natural gas industry and the significant progress on natural gas geological theories in China. Natural Gas Geoscience (in Chinese), 16(2): 127–142
Dai Jinxing, Wei Houfa, Song Yan, et al. 1987. Composition, carbon isotope characteristics and the origin of coal-bed gases in China and their implications. Science in China Series B, 30(12): 1324–1337
Dailly P, Henderson T, Hudgens E, et al. 2013. Exploration for Cretaceous stratigraphic traps in the Gulf of Guinea, west Africa and the discovery of the Jubilee Field: a play opening discovery in the Tano Basin, offshore Ghana. Geological Society, London, Special Publications, 369(1): 235–248
Davison I, Faull T, Greenhalgh J, et al. 2016. Transpressional structures and hydrocarbon potential along the Romanche fracture zone: a review. Geological Society, London, Special Publications, 431(1): 235–248
Espitalié J, Marquis F, Barsony I. 1984. Geochemical logging. In: Voorhees K J, ed. Analytical Pyrolysis. Amsterdam: Elsevier, 276–304
Faber E, Stahl W. 1984. Geochemical surface exploration for hydrocarbons in North Sea. AAPG Bulletin, 68(3): 363–386
Faramawy S, Zaki T, Sakr A A E. 2016. Natural gas origin, composition, and processing: a review. Journal of Natural Gas Science and Engineering, 34: 34–54, doi: 10.1016/j.jngse.2016.06.030
Gang Wenzhe, Gao Gang, Hao Shisheng. 1997. Carbon isotope of ethane applied in the analyses of genetic types of natural gas. Experimental Petroleum Geology (in Chinese), 19(2): 164–167
Garry P, Atta-Peters D, Achaegakwo C. 2016. Source - rock potential of the Lower Cretaceous sediments in SD - 1X well, offshore Tano Basin, south western Ghana. Petroleum and Coal, 58(4): 476–489
Hill R J, Jarvie D M, Zumberge J, et al. 2007. Oil and gas geochemistry and petroleum systems of the Fort Worth Basin. AAPG Bulletin, 91(4): 445–473, doi: 10.1306/11030606014
Huang Baojia, Huang Hao, Wang Zhenfeng, et al. 2015. Kinetics and model of gas generation of source rocks in the deepwater area, Qiongdongnan Basin. Acta Oceanologica Sinica, 34(4): 11–18, doi: 10.1007/s13131-015-0646-3
Lake Stuart, Derewetzky Aram, Frewin Neil. 2014. Structure, evolution, and petroleum systems of the Tano Basin, Ghana. In: Pindell J, Horn B, Rosen N, et al, eds. Sedimentary Basins: Origin, Depositional Histories, and Petroleum Systems. Houston: SEPM Society for Sedimentary Geology
Li Yong, Lu Jungang, Liu Xiangjun, et al. 2022. Geochemistry and origins of natural gas in the Hong-Che fault zone of the Junggar Basin, NW China. Journal of Petroleum Science and Engineering, 214: 110501, doi: 10.1016/j.petrol.2022.110501
Mascle J, Blarez E. 1987. Evidence for transform margin evolution from the Ivory Coast–Ghana continental margin. Nature, 326(6111): 378–381, doi: 10.1038/326378a0
Milkov A V. 2018. Secondary microbial gas. In: Wilkes H, ed. Hydrocarbons, Oils and Lipids: Diversity, Origin, Chemistry and Fate. Cham: Springer, 613–622
Milkov A V, Etiope G. 2018. Revised genetic diagrams for natural gases based on a global dataset of >20, 000 samples. Organic Geochemistry, 125: 109–120, doi: 10.1016/j.orggeochem.2018.09.002
Morrison J, Burgess C, Cornford C, et al. 2000. Hydrocarbon systems of the Abidjan margin. In: Offshore West Africa 2000, Conference and Exhibition. Abidjan, Cote d'Ivoire: Penn Well Publishing, 1–13
Pletsch T, Erbacher J, Holbourn A E L, et al. 2001. Cretaceous separation of Africa and south America: the view from the west African margin (ODP Leg 159). Journal of South American Earth Sciences, 14(2): 147–174, doi: 10.1016/S0895-9811(01)00020-7
Prinzhofer A, Battani A. 2003. Gas isotopes tracing: an important tool for hydrocarbons exploration. Oil & Gas Science and Technology, 58(2): 299–311
Prinzhofer A A, Huc A Y. 1995. Genetic and post-genetic molecular and isotopic fractionations in natural gases. Chemical Geology, 126(3-4): 281–290, doi: 10.1016/0009-2541(95)00123-9
Prinzhofer A, Mello M R, Takaki T. 2000. Geochemical characterization of natural gas: a physical multivariable approach and its applications in maturity and migration estimates. AAPG Bulletin, 84(8): 1152–1172
Prinzhofer A, Pernaton É. 1997. Isotopically light methane in natural gas: bacterial imprint or diffusive fractionation? Chemical Geology, 142(3–4): 193–200
Rooney M A, Claypool G E, Chung H M. 1995. Modeling thermogenic gas generation using carbon isotope ratios of natural gas hydrocarbons. Chemical Geology, 126(3-4): 219–232, doi: 10.1016/0009-2541(95)00119-0
Rüpke L H, Schmid D W, Hartz E H, et al. 2010. Basin modelling of a transform margin setting: structural, thermal and hydrocarbon evolution of the Tano Basin, Ghana. Petroleum Geoscience, 16(3): 283–298, doi: 10.1144/1354-079309-905
Strand K. 1998. Sedimentary facies and sediment composition changes in response to tectonics of the Côte d'Ivoire-Ghana transform margin. In: Mascle J, Lohmann G P, Moullade M, eds. Proceedings of the Ocean Drilling Program, Scientific Results. 113–123 (doi: 10.2973/odp.proc.sr.159.009.1998
Su Long, Zhang Dongwei, Yang Haizhang, et al. 2018. Chemical kinetics evaluation and its application of natural gas generation derived from the Yacheng formation in the deep-water area of the Qiongdongnan Basin, China. Acta Oceanologica Sinica, 37(1): 50–59., doi: 10.1007/s13131-018-1158-8
Tetteh J T. 2016. The Cretaceous play of Tano Basin, Ghana. International Journal of Applied Science and Technology, 6(1): 1–10
Wagner T. 2002. Late Cretaceous to Early Quaternary organic sedimentation in the eastern Equatorial Atlantic. Palaeogeography, Palaeoclimatology, Palaeoecology, 179(1–2): 113–147
Wang Zhenfeng, Sun Zhipeng, Zhang Daojun, et al. 2015. Geology and hydrocarbon accumulations in the deepwater of the northwestern South China Sea-with focus on natural gas. Acta Oceanologica Sinica, 34(10): 57–70, doi: 10.1007/s13131-015-0715-7
Whiticar M J, Suess E. 1990. Hydrothermal hydrocarbon gases in the sediments of the King George Basin, Bransfield Strait, Antarctica. Applied Geochemistry, 5(1–2): 135–147, doi: 10.1016/0883-2927(90)90044-6
Wu Xiaoqi, Liu Quanyou, Chen Yingbin, et al. 2020. Constraints of molecular and stable isotopic compositions on the origin of natural gas from Middle Triassic reservoirs in the Chuanxi large gas field, Sichuan Basin, SW China. Journal of Asian Earth Sciences, 204: 104589, doi: 10.1016/j.jseaes.2020.104589
Ye Jing, Rouby D, Chardon D, et al. 2019. Post-rift stratigraphic architectures along the African margin of the Equatorial Atlantic: part I the influence of extension obliquity. Tectonophysics, 753: 49–62, doi: 10.1016/j.tecto.2019.01.003
Table
1.
Mean values of the Mg/Ca ratios (mmol·mol−1) of G. ruber s.s., G. ruber s.l., T. sacculifer (w), and T. sacculifer (w/o) based on geochemical measurements using Core MD06-3047B with outcomes obtained by performing Welch’s t test at a p < 0.05 significance level.
Mg/Ca
T/℃
Mg/Ca
T/℃
G. ruber s.s.
3.72
25.29
T. sacculifer (w/o)
3.17
23.64
G. ruber s.l.
3.40
24.28
T. sacculifer (w)
3.20
23.53
H
Ha
Ha
H
H0
H0
Note: H = H0 implies the null hypothesis cannot be rejected; H = Ha implies the null hypothesis can be rejected.
Figure 1. Simplified structural map of the Cote d’Ivoire Basin and distributions of the three sampled wells in the basin (a). Stratigraphic table of the major Cretaceous strata in the Cote d’Ivoire Basin (modified from Morrison et al., 2000) (b).
Figure 2. Plot of total organic carbon (TOC) versus generated hydrocarbons (S1 + S2) showing source rock quality (a). Plot of hydrogen index (HI) versus maximum hydrocarbon generation (Tmax) showing kerogen types (refer to Espitalié et al., 1984) (b). HI = S2/total organic carbon × 100.
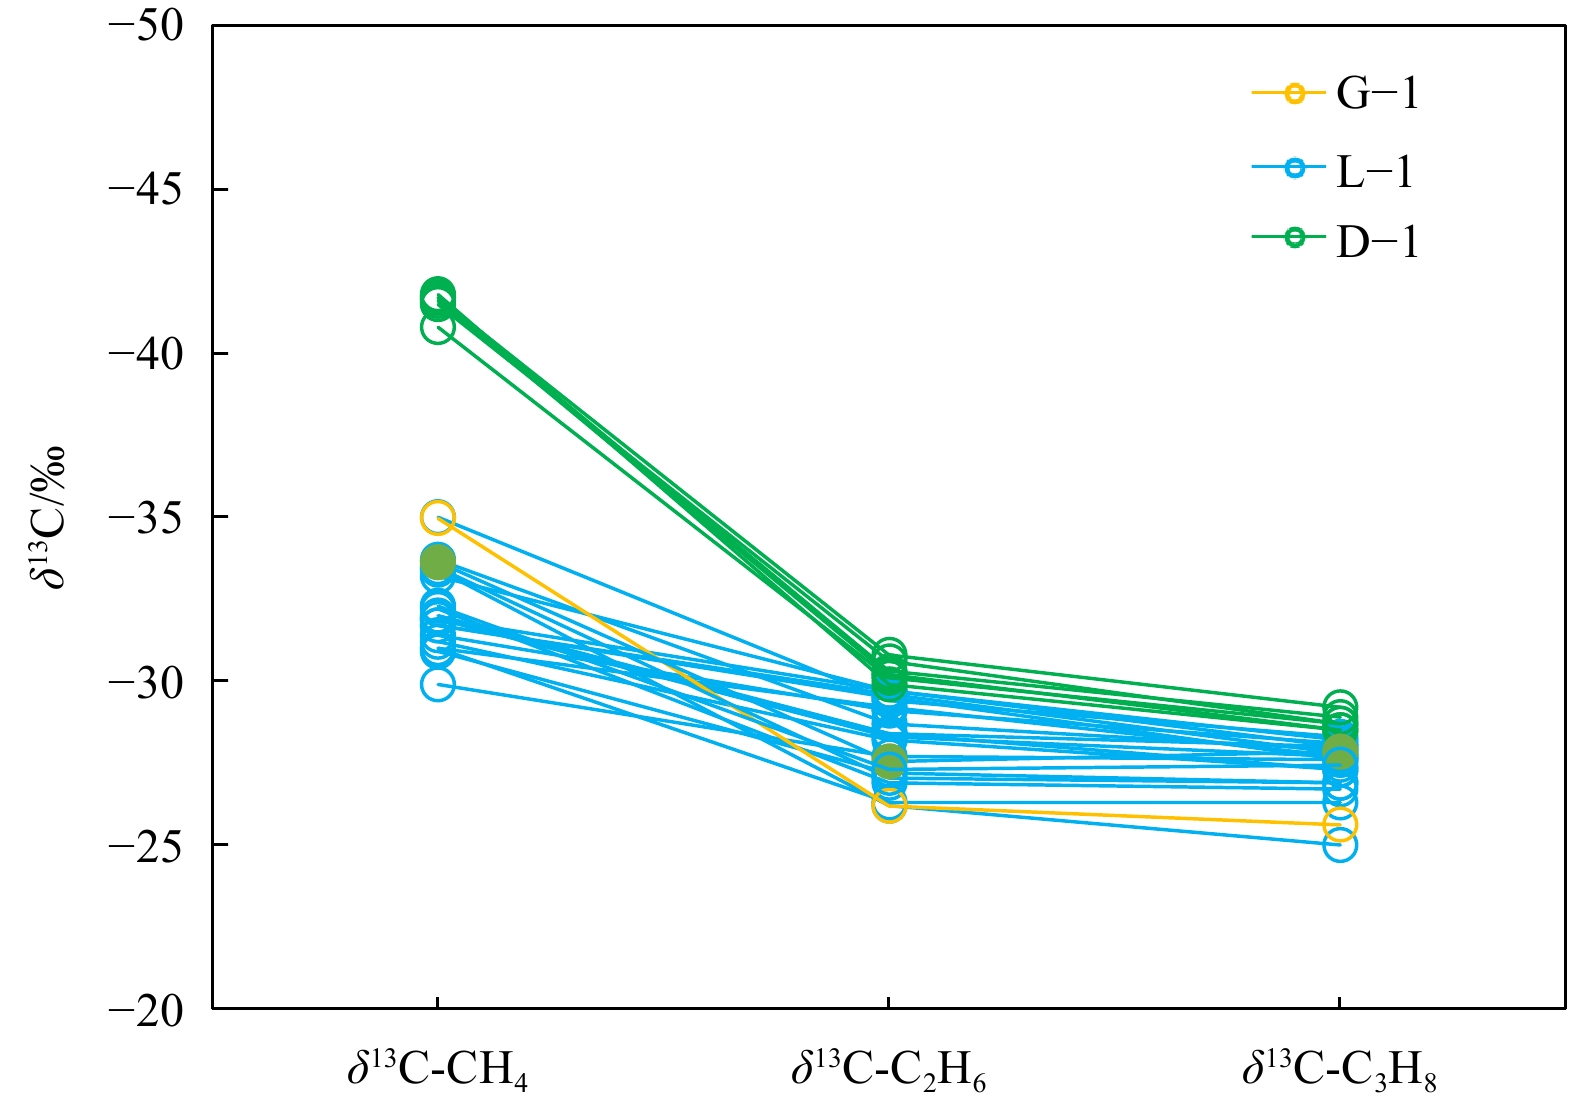
Figure 3. The stable carbon isotopes distribution of gaseous alkanes (methane CH4, ethane C2H6, and propane C3H8) in the eastern Cote d’Ivoire Basin.
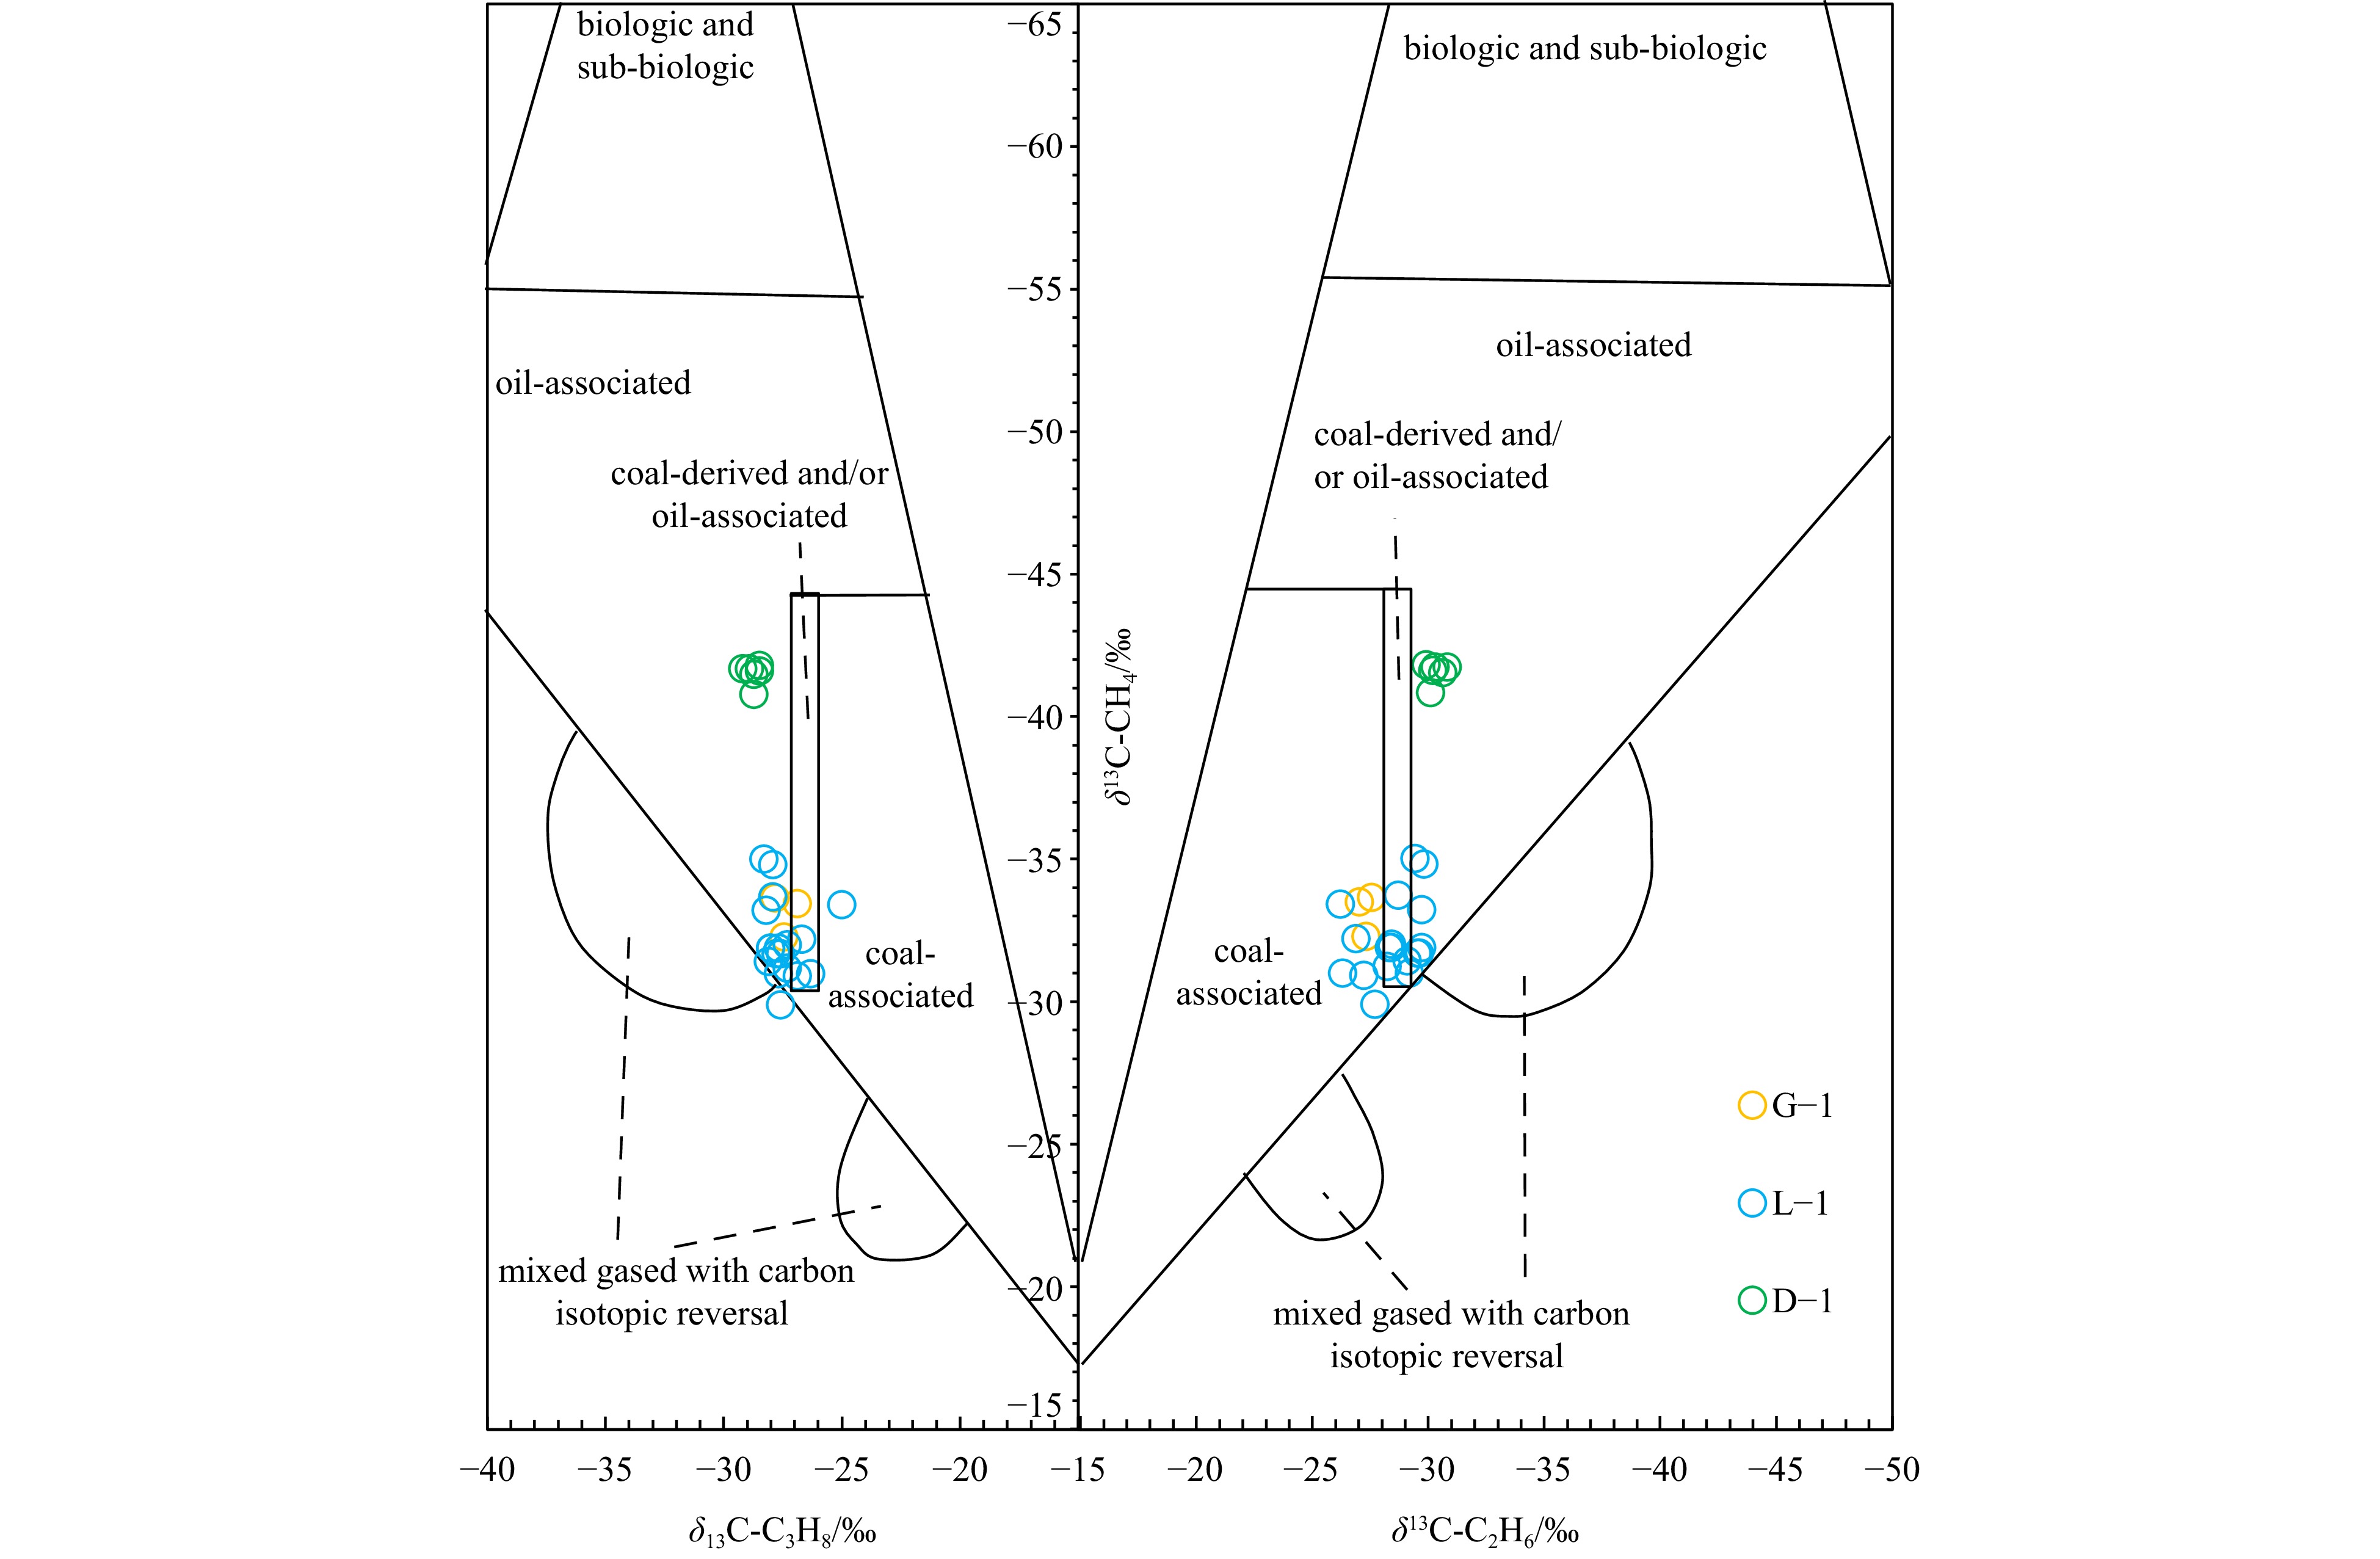
Figure 4. The origin of natural gas interpretative diagram based on δ13C-CH4, δ13C-C2H6, and δ13C-C3H8 data in the eastern Cote d’Ivoire Basin (refer to Dai et al., 2014).
Figure 5. The plot of ethane/propane (C2/C3) molar ratio versus δ13C-C2H6−δ13C-C3H8 (refer to Prinzhofer and Battani, 2003) showing the natural gases of the eastern Cote d’Ivoire Basin are dominated by primary cracking gases.
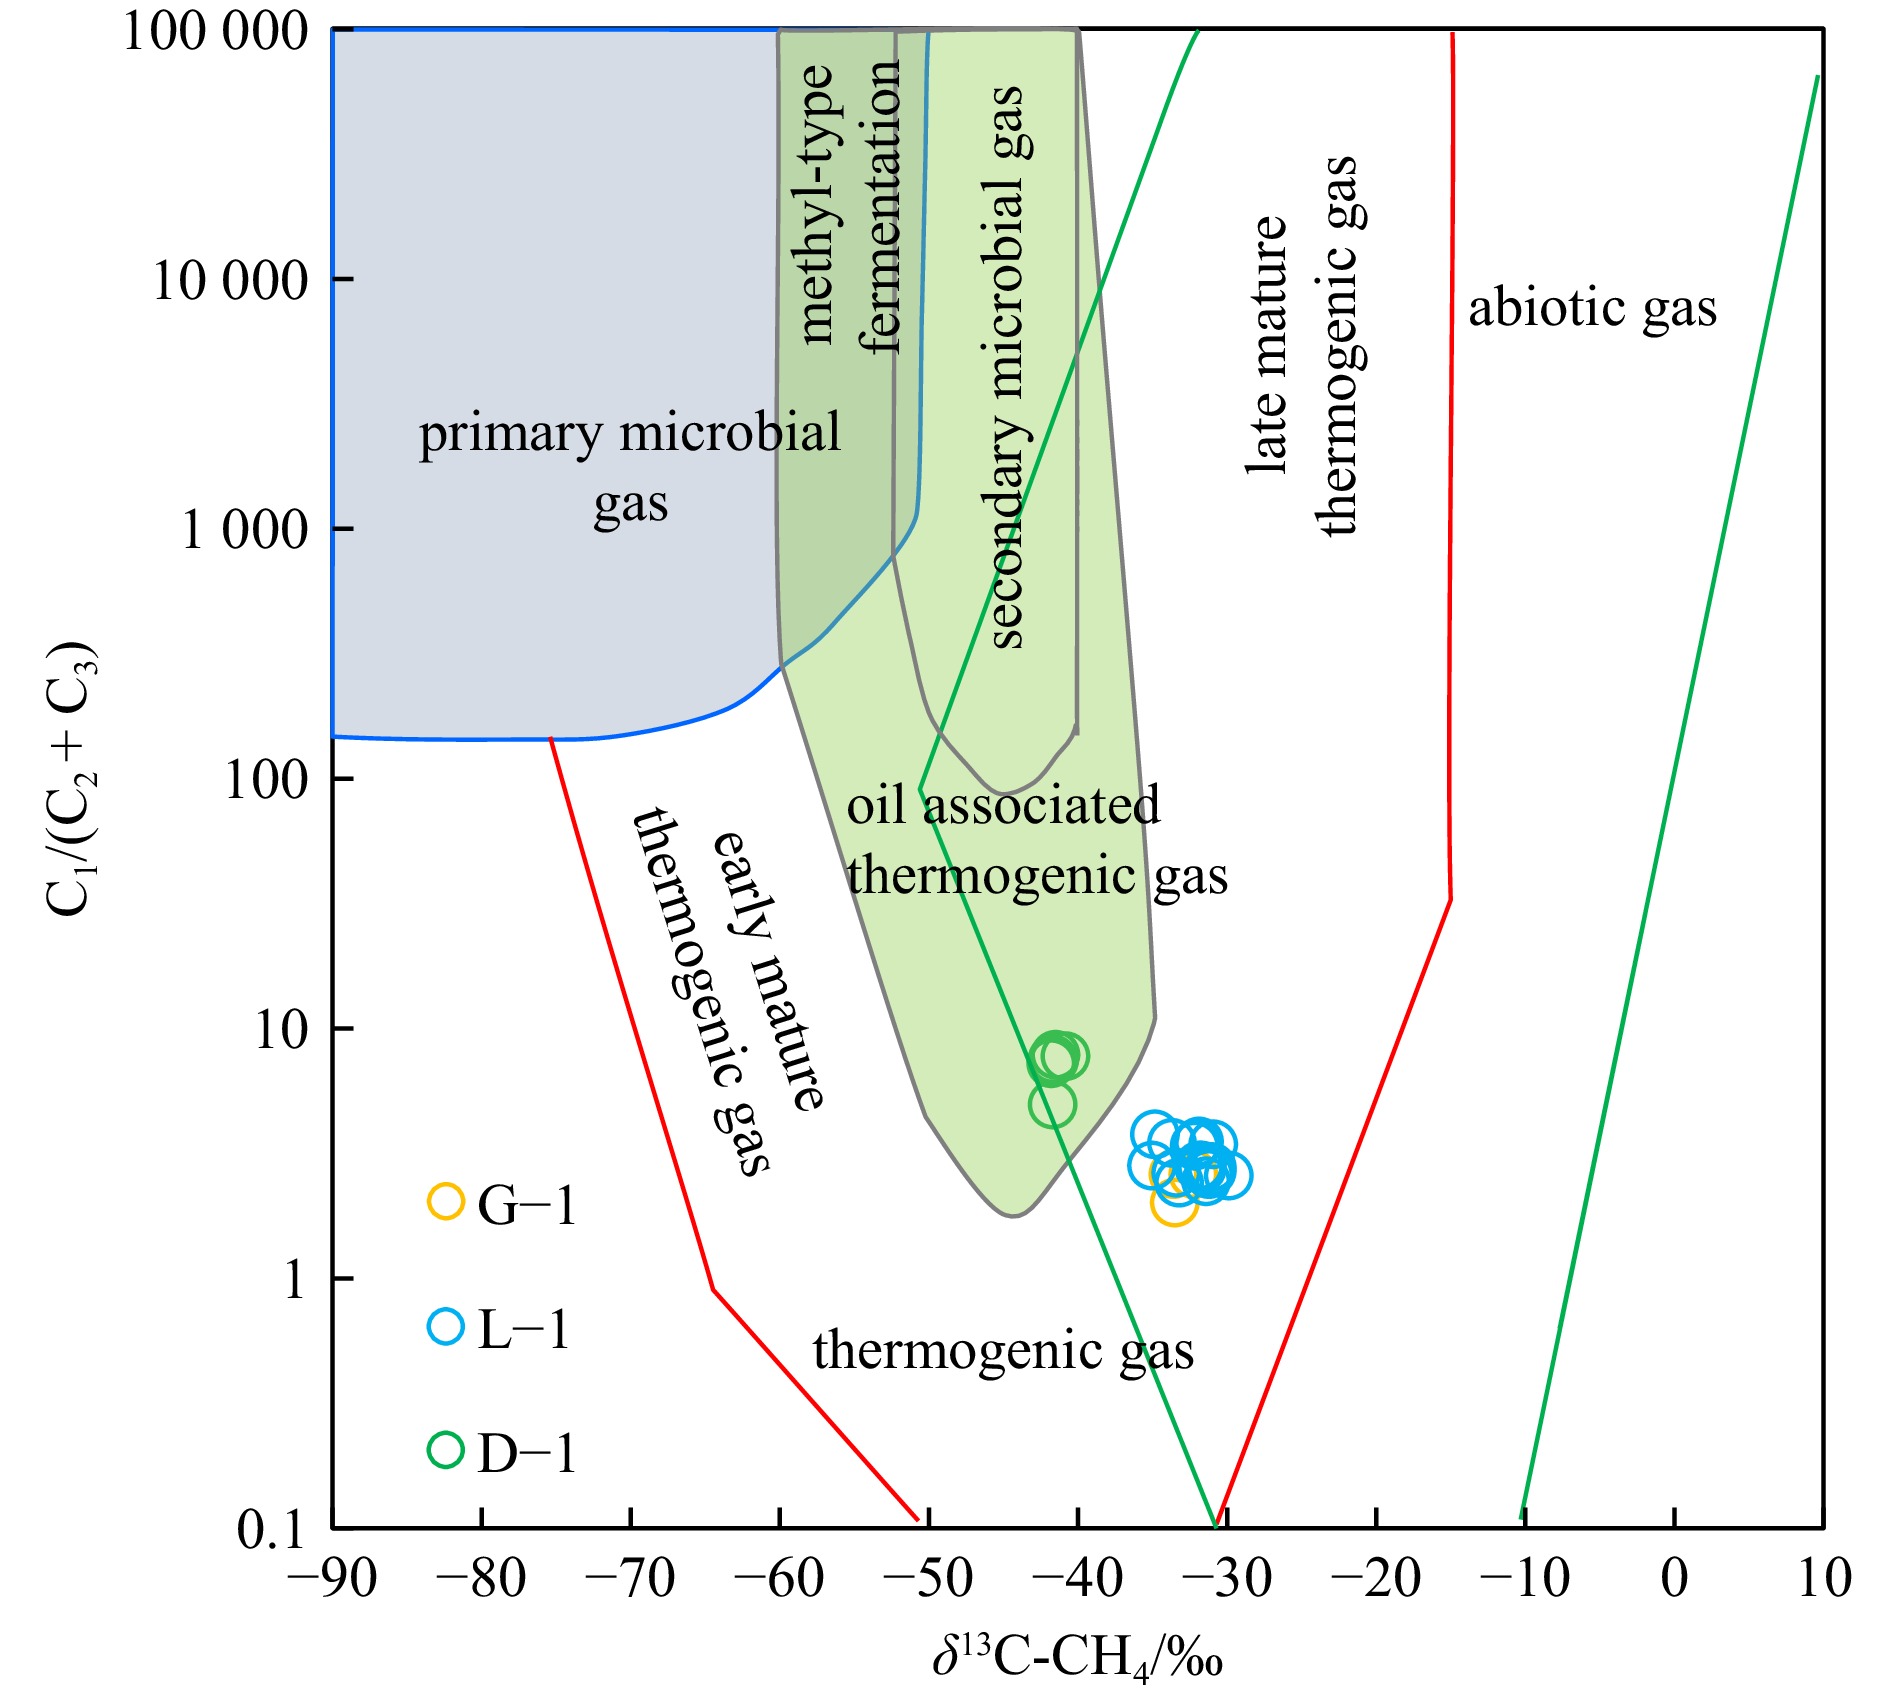
Figure 6. Genetic diagram of δ13C-CH4 versus C1/(C2+C3) showing the genetic type of the natural gases in the eastern Cote d’Ivoire Basin. The boundary lines are from Milkov and Etiope (2018).
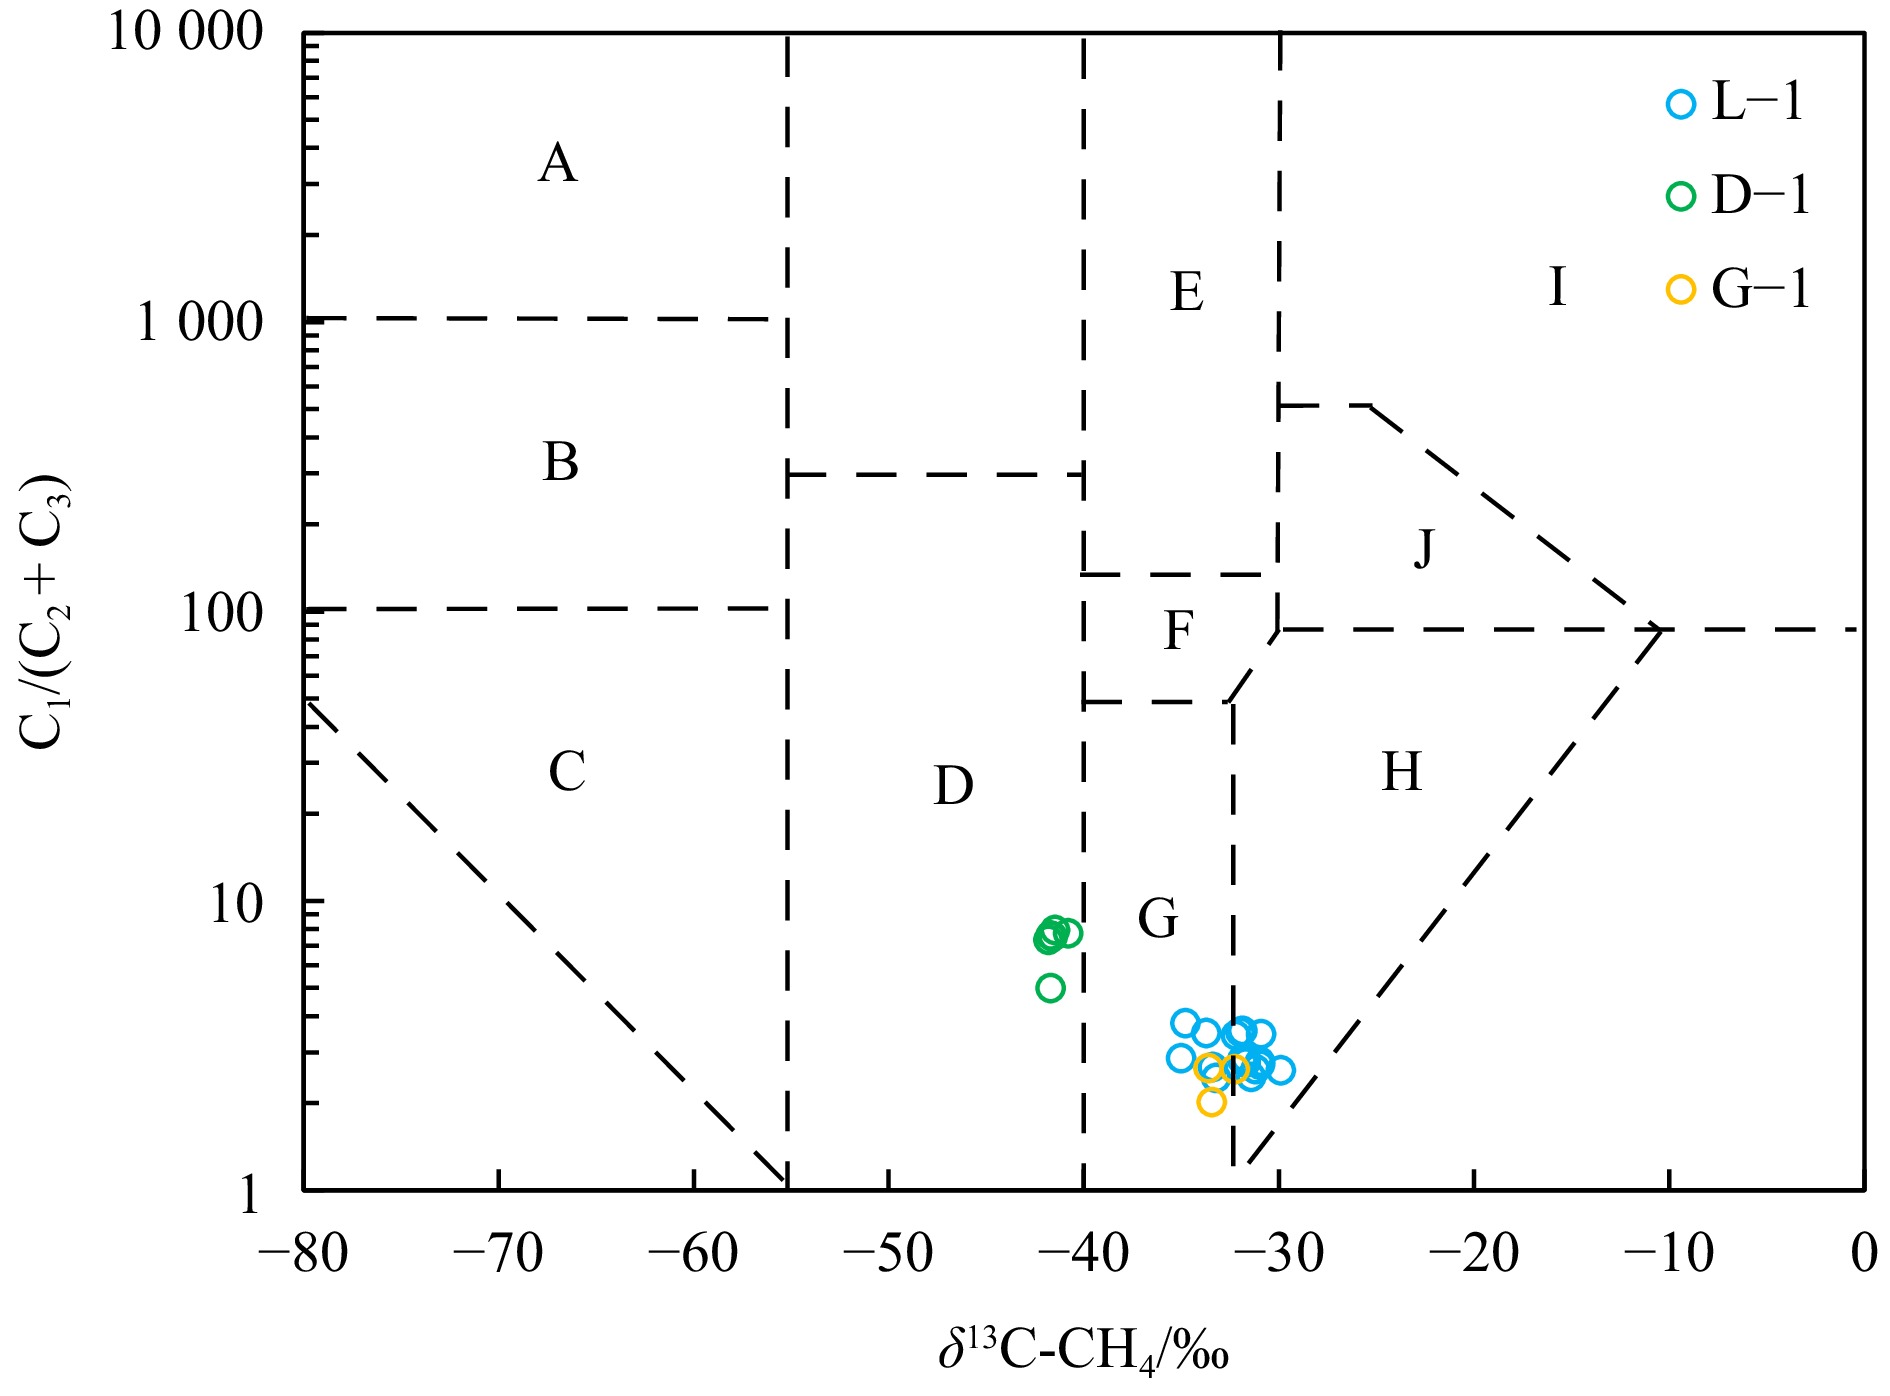
Figure 7. The plot of δ13C-CH4 and C1/(C2+C3) distinguishing the genetic types of the natural gases in the eastern Cote d’Ivoire Basin. (A: biogenic gas; B: biogenic gas and sub-biogenic gas; C: sub-biogenic gas; D: oil-type gas; E: oil-type cracked gas; F: oil-type cracked gas and coal-derived gas; G: condensate oil-associated gas and coal-derived gas; H: coal-derived gas; I: inorganic gas; J: inorganic gas and coal-derived gas [plot after Dai 1992)].
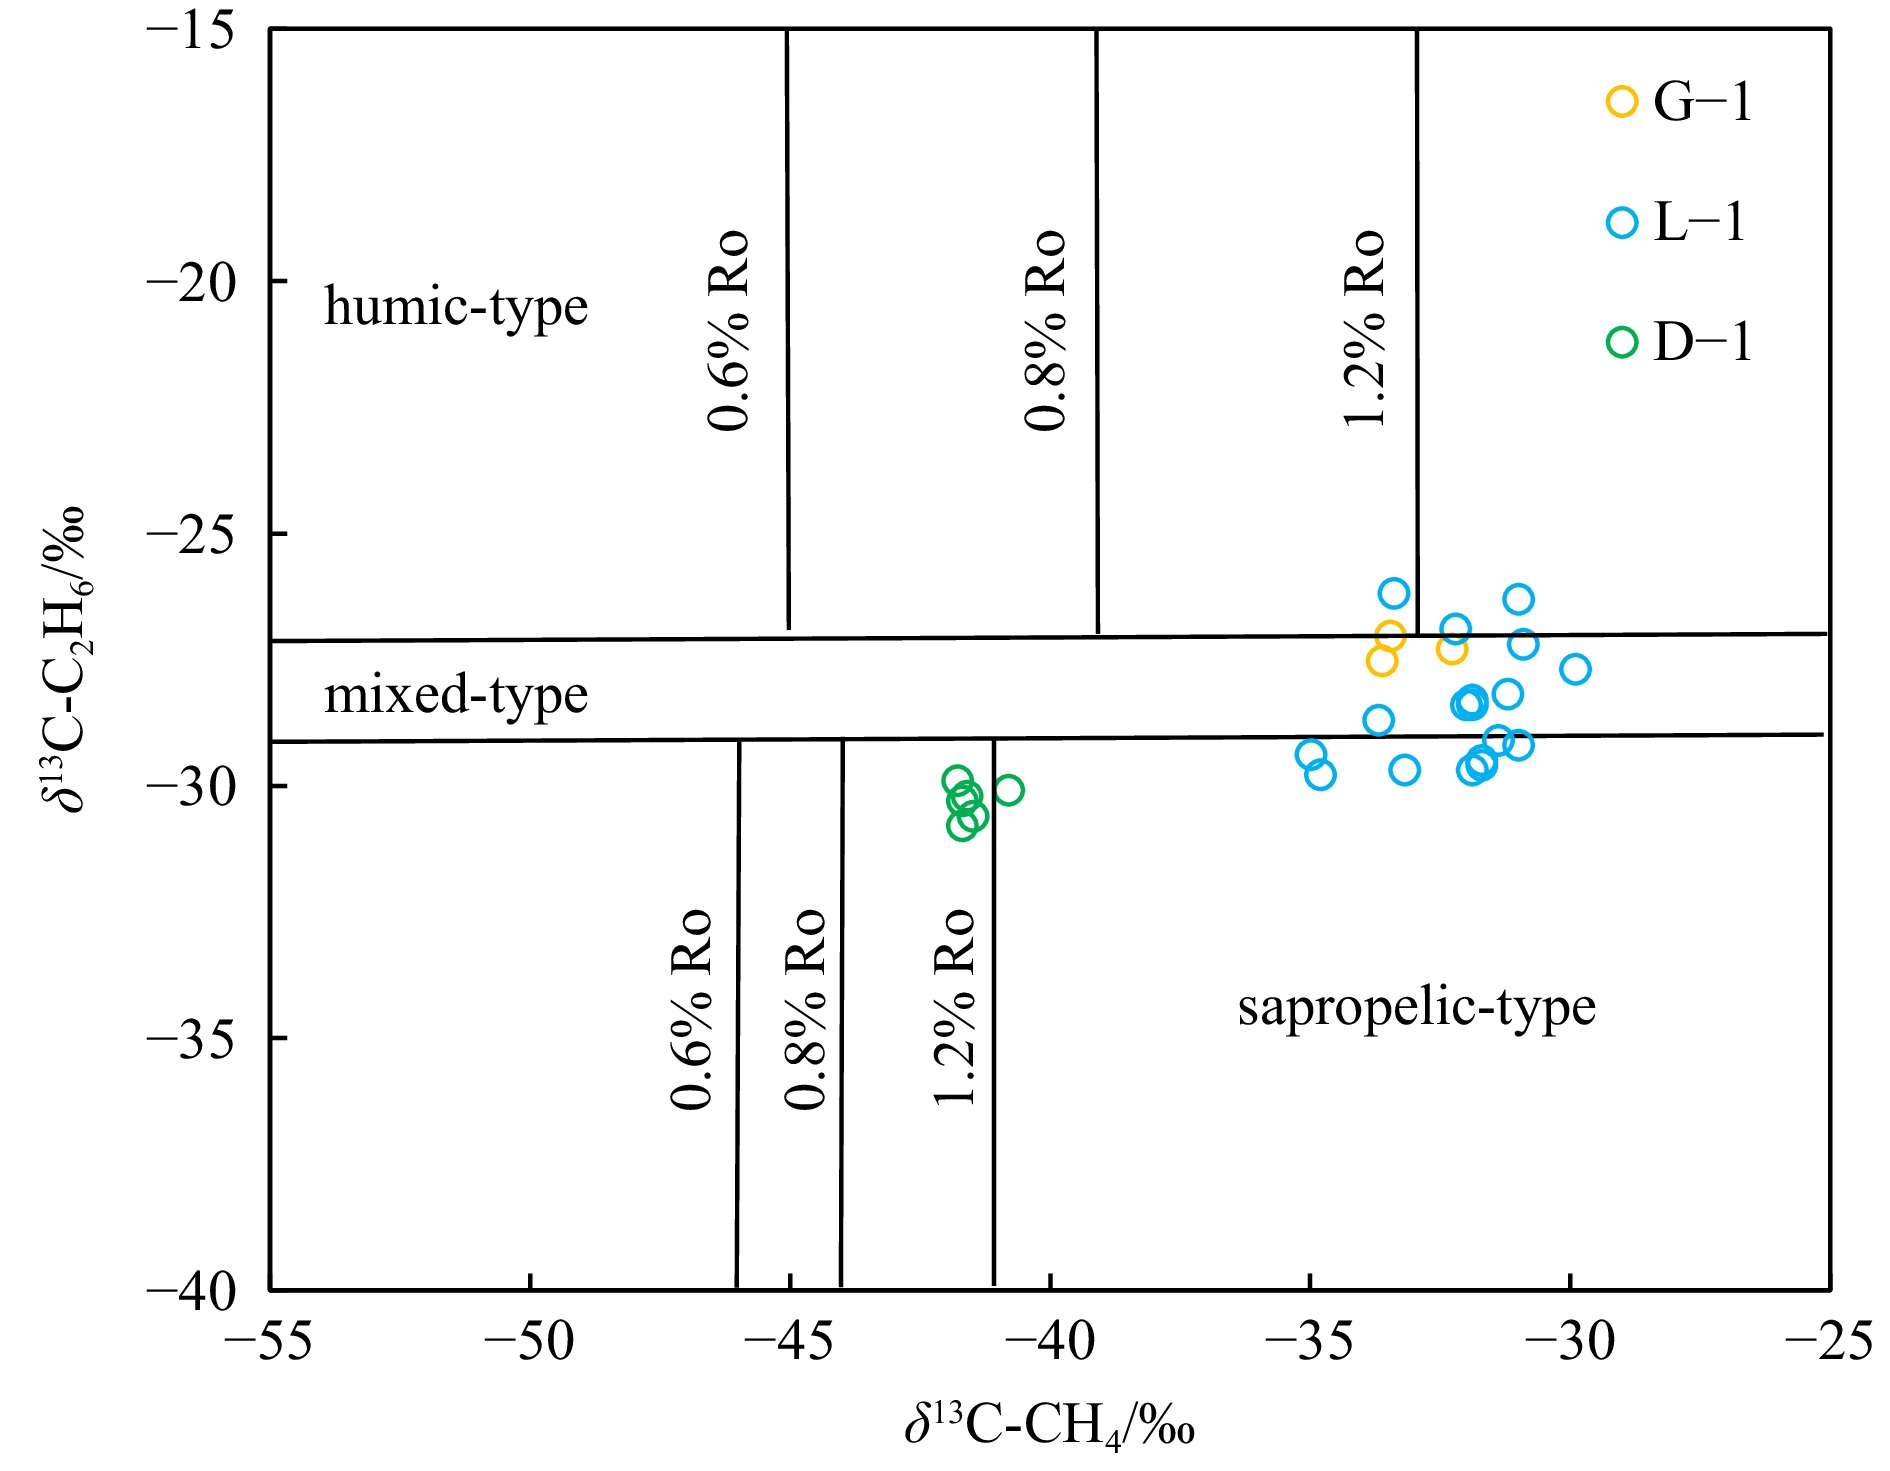
Figure 8. The types and thermal maturity of natural gas classification diagram based on δ13C-CH4 and δ13C-C2H6 data in the eastern Cote d’Ivoire Basin. The boundary lines are based on Dai (1992), Dai et al. (2005), and Li et al. (2022).
Figure 9. Down-hole variation of source rock quality [total organic carbon (TOC), generation potential (S1 + S2), and hydrogen index (HI)] from Turonian to Upper Albain in the eastern Cote d’Ivoire Basin (a). Present temperature and maturity fields of the eastern Cote d’Ivoire Basin (modified from Rüpke et al., 2010) (b).
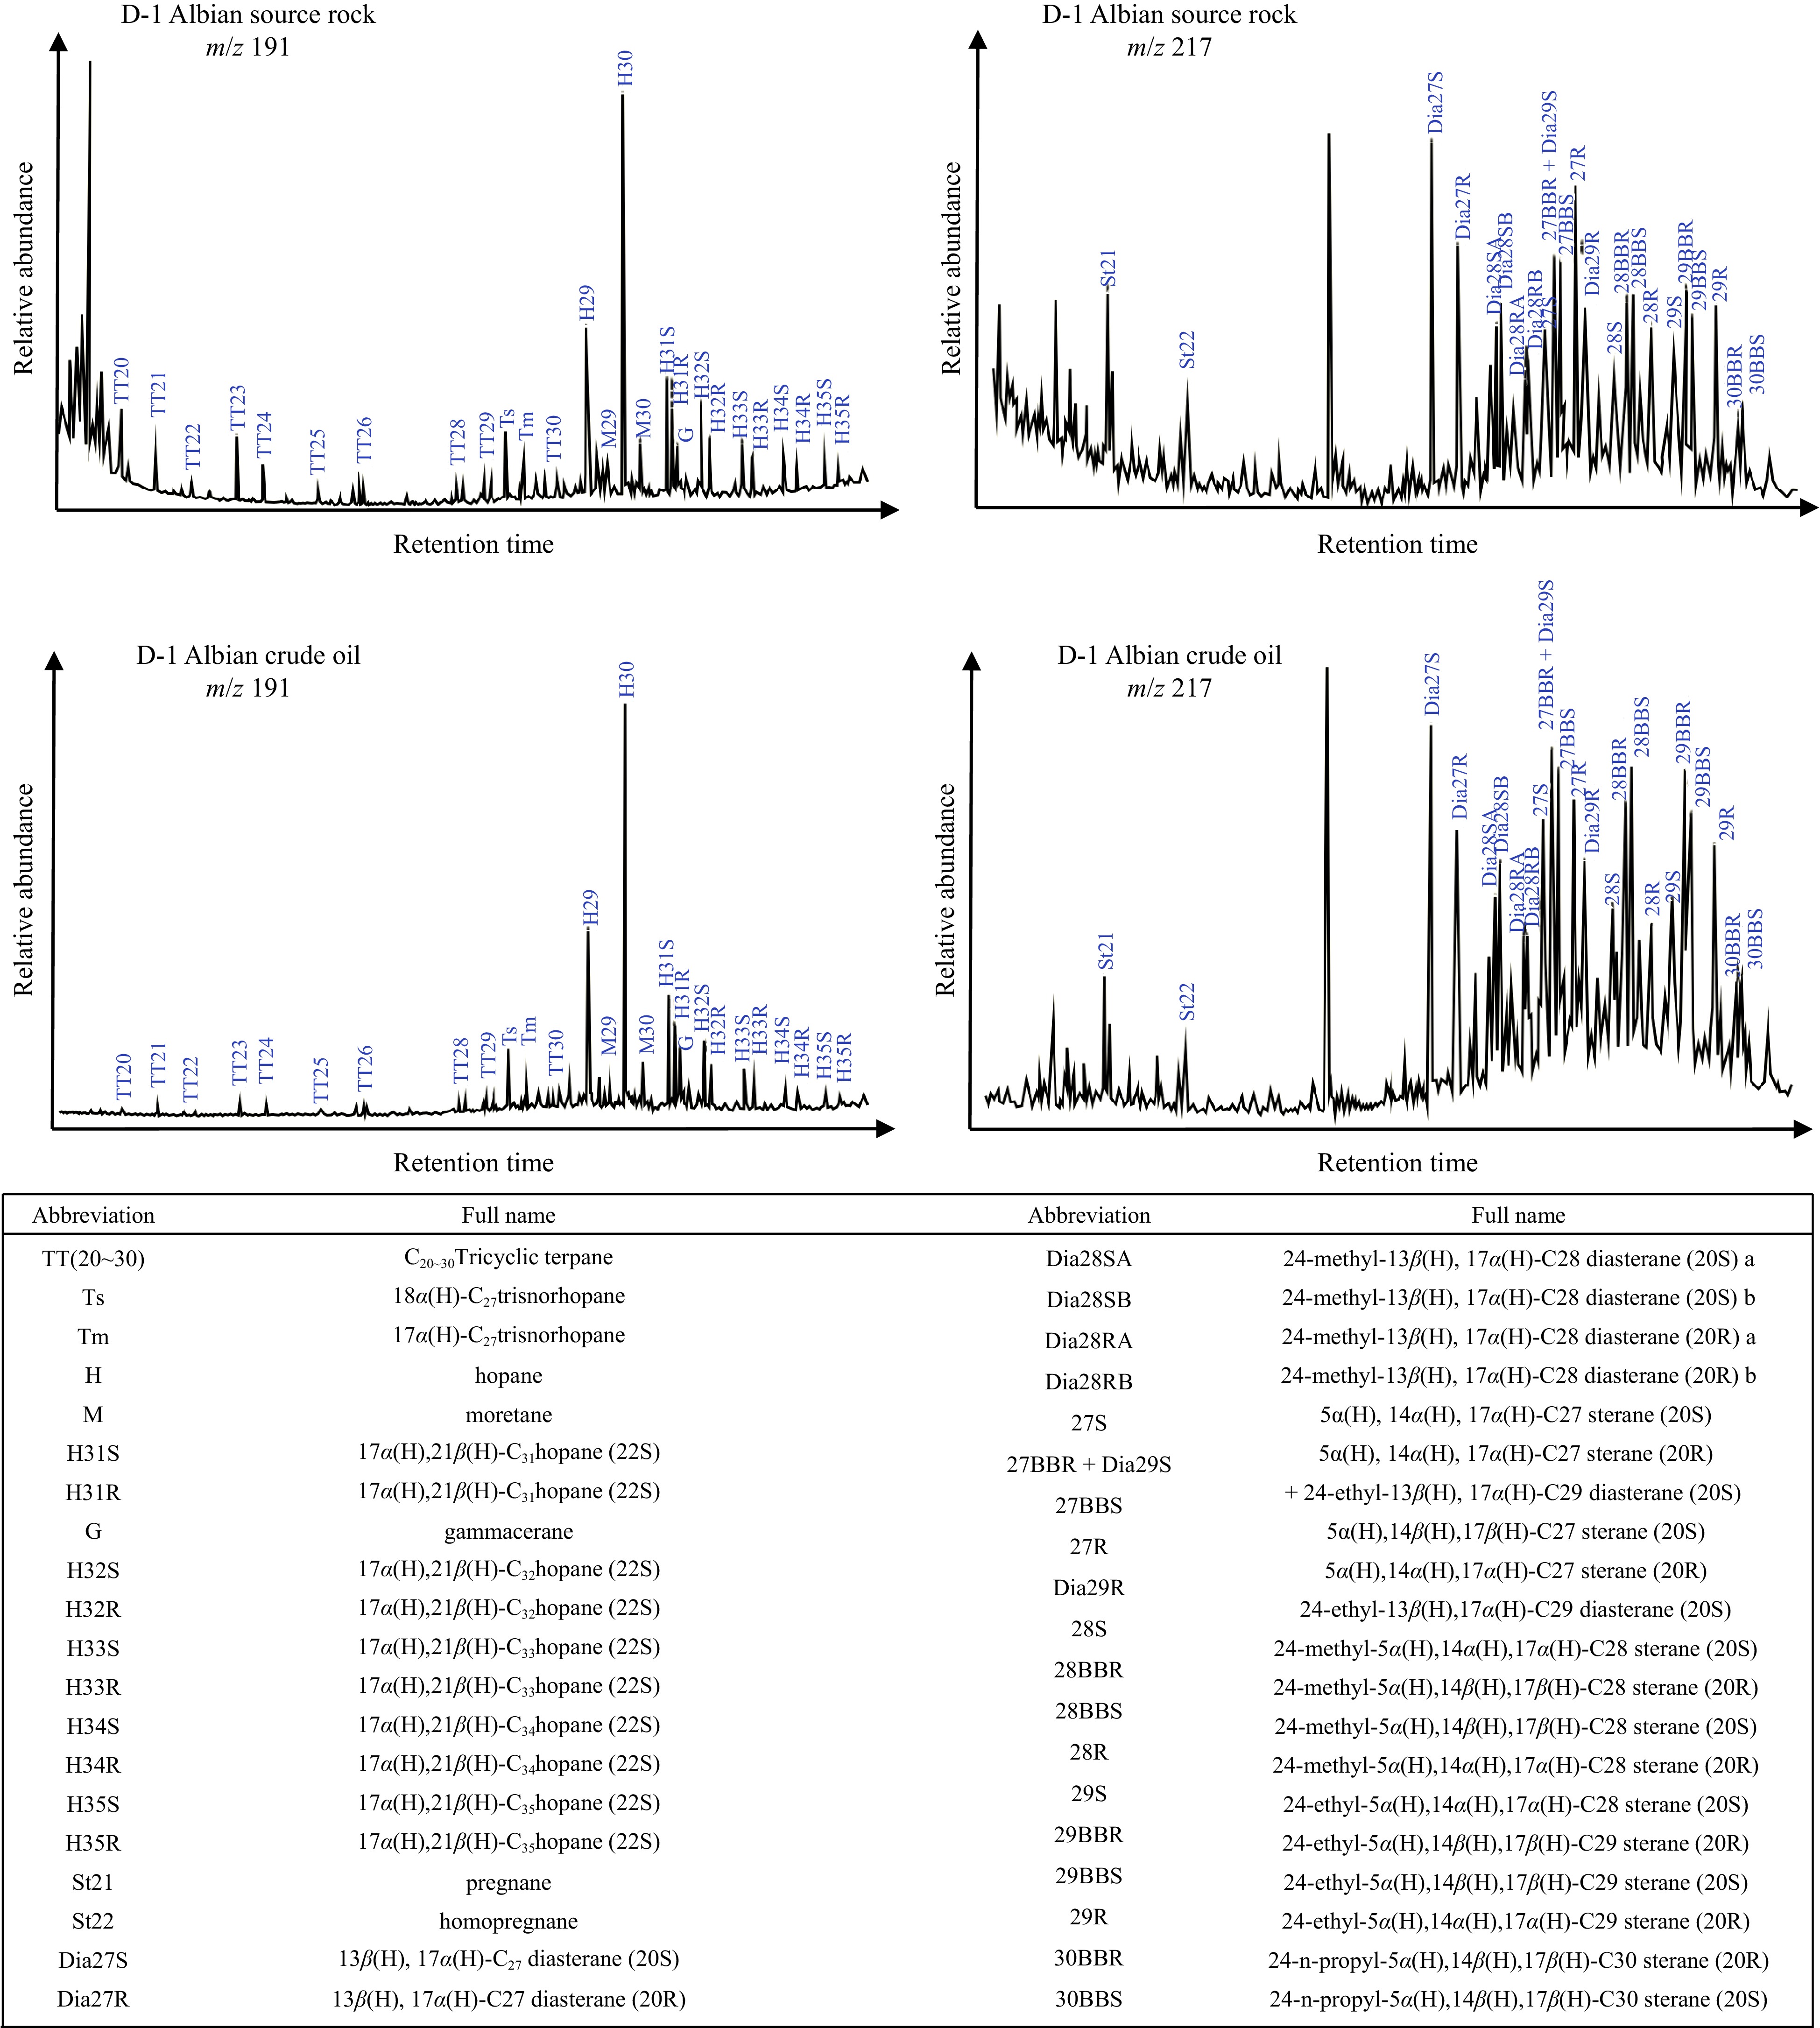
Figure 10. Mass chromatograms (m/z 191 and m/z 217) of the Upper Albian source rock and crude oil from Well D-1 (data from preliminary report of Geochemical Solutions International, Inc).


 DownLoad:


 DownLoad:


 DownLoad: