


Figure
1.
Map of the northern South China Sea with the location of mooring (red star). Blue line represents the track of Typhoon Kalmaegi.
| Citation: | Rongwei Zhai, Guiying Chen, Chenjing Shang, Xiaodong Shang, Youren Zheng. The effect of Typhoon Kalmaegi on the modal energy and period of internal waves near the Dongsha Islands (South China Sea)[J]. Acta Oceanologica Sinica, 2023, 42(12): 22-31. doi: 10.1007/s13131-023-2205-7

|
Numerical calculations (Xing and Davies, 2002) and observations (Davies and Xing, 2003; Xie et al., 2008) have indicated nonlinear interactions between near-inertial internal waves (NIWs) and internal tides (ITs) can transfer energy to small-scale (i.e., high-mode) internal waves (IWs), eventually resulting in turbulent mixing. Nonlinear interaction is a dominant mechanism of IWs dissipation (Li et al., 2019). Local mixing is mainly sustained by the dissipation of small-scale (i.e., high-mode) internal waves. The latter, often triggered by nonlinear interactions, are prone to direct breaking and thus drive mixing in the near field of their generation site (Vic et al., 2019).
Typhoons can induce strong nonlinear interactions between NIWs and diurnal ITs, resulting in rapid damping of the NIWs by transferring the energy to a higher frequency (Guan et al., 2014). The vertical velocity of diurnal ITs and vertical shear of near-inertial currents can influence the nonlinear interactions between typhoon-induced NIWs and diurnal ITs (Liu et al., 2018). Typhoons can also induce the self-interaction of NIWs
However, most studies have only focused on the characteristics of typhoon-induced NIWs, and very few observational studies have reported the characteristic changes in ITs during the passage of typhoons. Our observations provide a good opportunity to investigate the mechanisms underlying the influence of a strong typhoon on NIWs and ITs, especially in terms of the modal energy and cycle regulation. Our current study aimed to provide quantitative analyses of the modal energy change of NIWs and ITs during the passage of a typhoon and determine the effect of typhoons on the cycle regulation of diurnal ITs.
Mooring data were obtained at 20°44′N, 117°44′E near the Dongsha Islands in the northeastern SCS (Fig. 1). Water depth at the mooring location was approximately 1 249 m. The mooring consisted of three acoustic Doppler current profilers (ADCPs). One upward-looking WHS75K ADCP measured the current velocity from 76 m to 412 m, with a depth interval of 16 m and a ping rate of 120 s. One downward-looking WHS75K ADCP measured the current velocity from 477 m to 941 m, with a depth interval of 16 m and a ping rate of 120 s. Yet another downward-looking WHS150K ADCP measured the current velocity from 972 m to 1 116 m, with a depth interval of 16 m and a ping rate of 90 s. In this study, we recorded observations from August 2 to September 27, 2014. The typhoon that influenced the mooring site in 2014 was named Kalmaegi (Fig. 1) and details of Kalmaegi’s track were obtained from the Typhoon Online website (
| Time | The 13.9–17.1 $ \mathrm{m}/\mathrm{s} $ wind radius/km | The 24.5–28.4 $ \mathrm{m}/\mathrm{s} $ wind radius/km | The 32.7–36.9 $ \mathrm{m}/\mathrm{s} $ wind radius/km | Propagation speed/ $(\mathrm{k}\mathrm{m}\cdot{\mathrm{h} }^{-1})$ | Distance to Kalmaegi track/km |
| 2014/09/14 18:00 | 200–350 | 60–120 | 30 | 30 | 350 |
| 2014/09/15 00:00 | 210–400 | 70–110 | 40 | 30 | 304 |
| 2014/09/15 06:00 | 190–450 | 100–110 | 40 | 30 | 305 |
| 2014/09/15 12:00 | 280–480 | 110–120 | 60 | 40 | 401 |
| 2014/09/15 18:00 | 280–480 | 110–120 | 60 | 40 | 534 |
| 2014/09/16 00:00 | 280–480 | 110–120 | 60 | 40 | 534 |
 DownLoad:
CSV
DownLoad:
CSV
Effective depth of the current data, measured by the ADCP, covered more than 75% of the water depth; therefore, the barotropic current was estimated with the depth-averaged current. The baroclinic current was obtained by removing the barotropic current from the raw current. To examine the characteristics of the IWs, time series of the baroclinic current at each depth was band-pass filtered with a fourth-order Butterworth filter. The cut-off frequencies were set to [0.6, 0.81] cycles per day for NIWs and [0.8, 1.2] and [1.8, 2.2] cycles per day for diurnal and semidiurnal ITs.
The NIWs and diurnal and semidiurnal ITs could be represented by a superposition of discrete baroclinic modes; hence, they were projected onto baroclinic modes by modal decomposition. The baroclinic modes for vertical displacement
| $$ \frac{{{\rm{d}}}^{2}\varPhi \left(z\right)}{{\rm{d}}{z}^{2}}+\frac{{N}^{2}\left(z\right)}{{C}_{n}^{2}}\varPhi \left(z\right)=0 , $$ | (1) |
where
The baroclinic velocity of mode
| $$ {u}_{n}(z,t)={u}_{n}'\left(t\right){\varPhi }_{n}\left(z\right) , $$ | (2) |
where
The horizontal kinetic energy (HKE) of mode
| $$ {\rm{HKE}}=\frac{1}{2}\rho < {{u}_{n}(z,t)}^{2} > , $$ | (3) |
where
Atmospheric forcing at the mooring site, induced by a typhoon during the measurement period, is shown in Fig. 2a. The wind speed began to increase on September 13. The highest wind speed induced by Typhoon Kalmaegi at the mooring site occurred on September 15, with instantaneous values exceeding 19 m/s; the intensity decreased subsequently. Therefore, we considered August 30 to September 12 as the pre-typhoon period and September 13 to September 27 as the typhoon period.

To characterize the modal energy change of NIWs, and diurnal and semidiurnal ITs, induced by the typhoon, we analyzed the total depth-integrated modal energy (sum of Modes 1–5). Figure 2b clearly shows that NIWs gained strength from September 13 and peaked on September 21, and weakened thereafter. Considering both Figs 2a and b, the date of maximum NIWs was concluded to be six days after the highest wind speed. This revealed that the enhancement of NIWs due to atmospheric forcing exhibited a hysteresis effect. Quantitative analysis (Table 2) demonstrated that modal energy of NIWs increased 5.11 times, from 0.62 kJ/m2 during the pre-typhoon period to 3.79 kJ/m2 during the typhoon period. Specific to single mode, all five modes increased during the typhoon period, but Modes 3–5 exhibited a larger increase than Modes 1–2; we, therefore, defined Modes 1–2 as low modes and Modes 3–6 as high modes. Overall, the enhancement of NIWs was mainly due to increase in high-mode energy.
| Number of modes | Pre-typhoon | Typhoon | |
| NIWs | Mode 1 | 0.21 | 0.70 |
| Mode 2 | 0.06 | 0.16 | |
| Mode 3 | 0.13 | 0.95 | |
| Mode 4 | 0.09 | 0.95 | |
| Mode 5 | 0.13 | 1.03 | |
| 0.62 | 3.79 | ||
| Diurnal ITs | Mode 1 | 3.08 | 0.46 |
| Mode 2 | 1.11 | 0.38 | |
| Mode 3 | 0.63 | 0.25 | |
| Mode 4 | 0.34 | 0.33 | |
| Mode 5 | 0.50 | 0.34 | |
| 5.66 | 1.76 | ||
| Semidiurnal ITs | Mode 1 | 0.63 | 0.41 |
| Mode 2 | 0.55 | 0.35 | |
| Mode 3 | 0.20 | 0.20 | |
| Mode 4 | 0.03 | 0.10 | |
| Mode 5 | 0.07 | 0.12 | |
| 1.48 | 1.18 | ||
| Note: Bold numbers are total values. | |||
DownLoad:
CSV
The total depth-integrated modal energy of diurnal ITs decreased during the typhoon period (Fig. 2d). Quantitative analysis (Table 2) demonstrated that total modal energy of diurnal ITs was reduced by 68.9%, from 5.66 kJ/m2 during the pre-typhoon period, to 1.76 kJ/m2 during the typhoon period. All five modes decreased during the typhoon period, but low modes exhibited larger declines than high modes. This suggested that the weakening of diurnal ITs was mainly due to a decrease in the low-mode energy. During the pre-typhoon period, low modes played a dominant role in the modal energy of diurnal ITs, and the maximum proportion of low-mode energy with respect to total modal energy of diurnal ITs was 74%. However, during the typhoon period, the proportion was 48%, which meant that the high mode signals accounted for a relatively larger proportion. Simultaneously, the depth-integrated modal energy of semidiurnal ITs exhibited no clear change during the pre-typhoon and typhoon periods (Fig. 2e). The modal energy of semidiurnal ITs during the typhoon period was reduced by 20% compared with that during the pre-typhoon period. The proportions of low modes in semidiurnal ITs during the pre-typhoon and typhoon periods were 80% and 64%, respectively. For semidiurnal ITs, low modes decreased while high modes increased during the typhoon period. The commonality of diurnal and semidiurnal ITs was mainly in the low-mode energy attenuation, although difference between the two was not apparent.
Not only did diurnal ITs lose energy during the typhoon period, they also lost their fortnightly temporal pattern. The diurnal ITs displayed a clear 14-d spring-neap cycle from August 30 to September 12 (Fig. 2d). However, during the typhoon period, the previous fortnightly temporal pattern of diurnal ITs disappeared. To make clear that Typhoon Kalmaegi did regulate the temporal variation during the typhoon period, we also added the temporal variation of diurnal barotropic tides (Fig. 2c) which we compared with diurnal ITs between the pre-typhoon and typhoon periods. The diurnal ITs and diurnal barotropic tides had a significant time shift, implying that the diurnal ITs were not locally generated (Shang et al., 2015). The diurnal barotropic tides displayed a 14-d spring-neap cycle during observation period during pre-typhoon period, but not as obvious as diurnal ITs. And during typhoon period, diurnal barotropic tides still showed a 14-d spring-neap cycle, meanwhile the previous fortnightly temporal pattern of diurnal ITs disappeared. This indicated that Typhoon Kalmaegi did regulate the temporal variation of diurnal ITs during the typhoon period. The phenomenon that typhoons can modulate the period of diurnal ITs was observed, for the first time, in the mooring data. We will discuss the reason for this later in the manuscript.
The modal energy of fD1 and fD2 were presented in Figs 2f and g. The modal energy of fD1 and fD2 increased slightly during the typhoon period. Results of quantitative analysis showed that the modal energy of fD1 and fD2 during the typhoon period was increased by 13% and 48.5% compared with that during the pre-typhoon period.
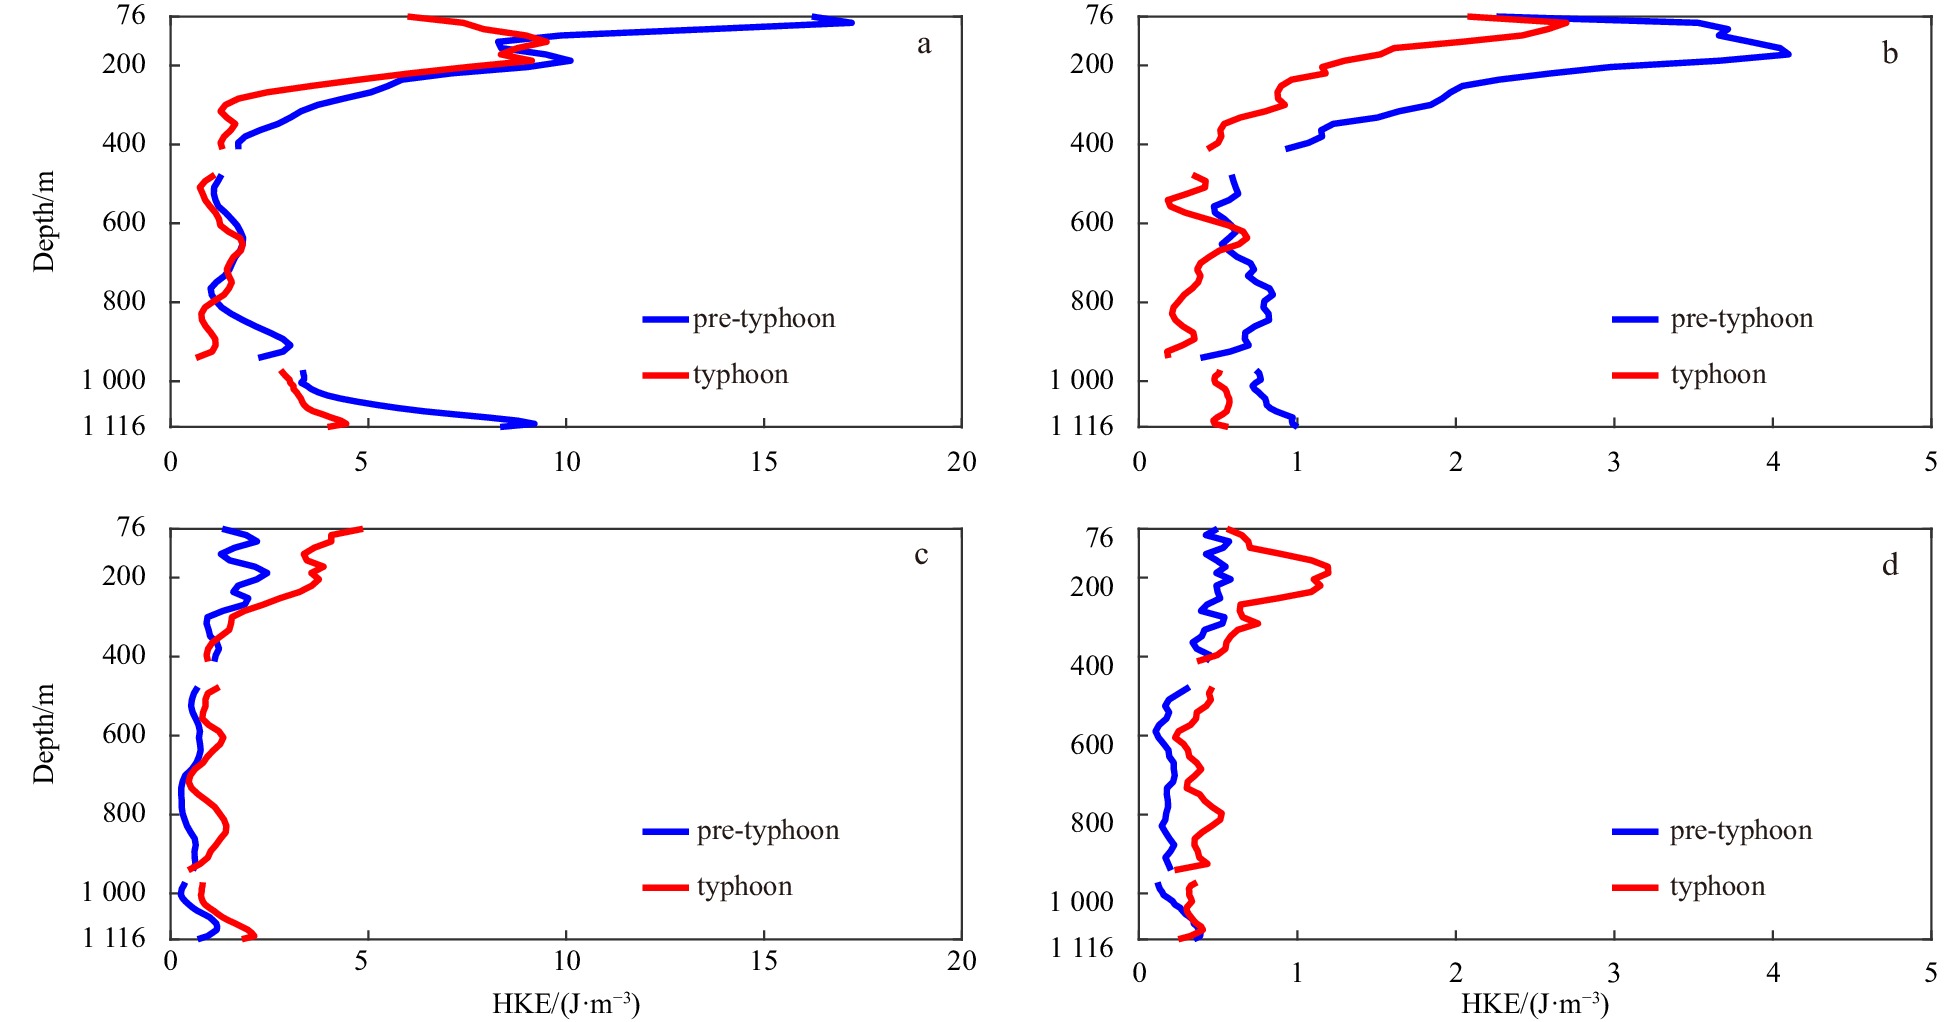
To further study the characteristic changes in diurnal and semidiurnal ITs during the typhoon period, diurnal ITs were divided into diurnal coherent ITs (CITs) and diurnal incoherent ITs (ICITs), following the method described by Zhai et al. (2020), and the same was done for semidiurnal ITs. The time-averaged HKE of coherent and incoherent parts of diurnal and semidiurnal ITs during the pre-typhoon and typhoon periods are shown in Fig. 3. During the typhoon period, HKE of diurnal CITs decreased in the upper layer, which was shallower than 400 m (especially shallower than 124 m) (Fig. 3a), whereas HKE of diurnal ICITs increased in the observational depth (especially shallower than 268 m) (Fig. 3c). The variation characteristics of semidiurnal ITs were more clearly apparent; HKE of semidiurnal CITs was clearly weakened (Fig. 3b) and that of semidiurnal ICITs was strengthened, during the typhoon period (Fig. 3d). During the pre-typhoon period, diurnal CITs accounts for about 82.7% of diurnal motions and semidiurnal ITs contains smaller fraction (80.8%) of the coherent motions, compared to 64.7% and 58% during the typhoon period. This indicated that coherent and incoherent parts of diurnal and semidiurnal ITs exhibited consistent characteristic changes during the typhoon period; while the coherent part in diurnal and semidiurnal ITs decreased, the incoherent part tended to increase. Previous observation results showed that both diurnal and semidiurnal ITs contained stronger coherent signals than incoherent counterparts and diurnal ITs are more coherent than semidiurnal ITs in the northeastern SCS (Xu et al., 2013, 2014). These results are consistent with the results of our paper.
Diurnal ITs displayed a clear 14-d spring-neap cycle during the pre-typhoon period, but lost this fortnightly temporal pattern during the typhoon period (Fig. 2d). Previous studies had reported that diurnal ITs exhibit a fortnightly spring-neap cycle in the SCS (Shang et al., 2015; Xie et al., 2013, 2018) and a 14-d cycle of diurnal ITs was induced by the superposition of
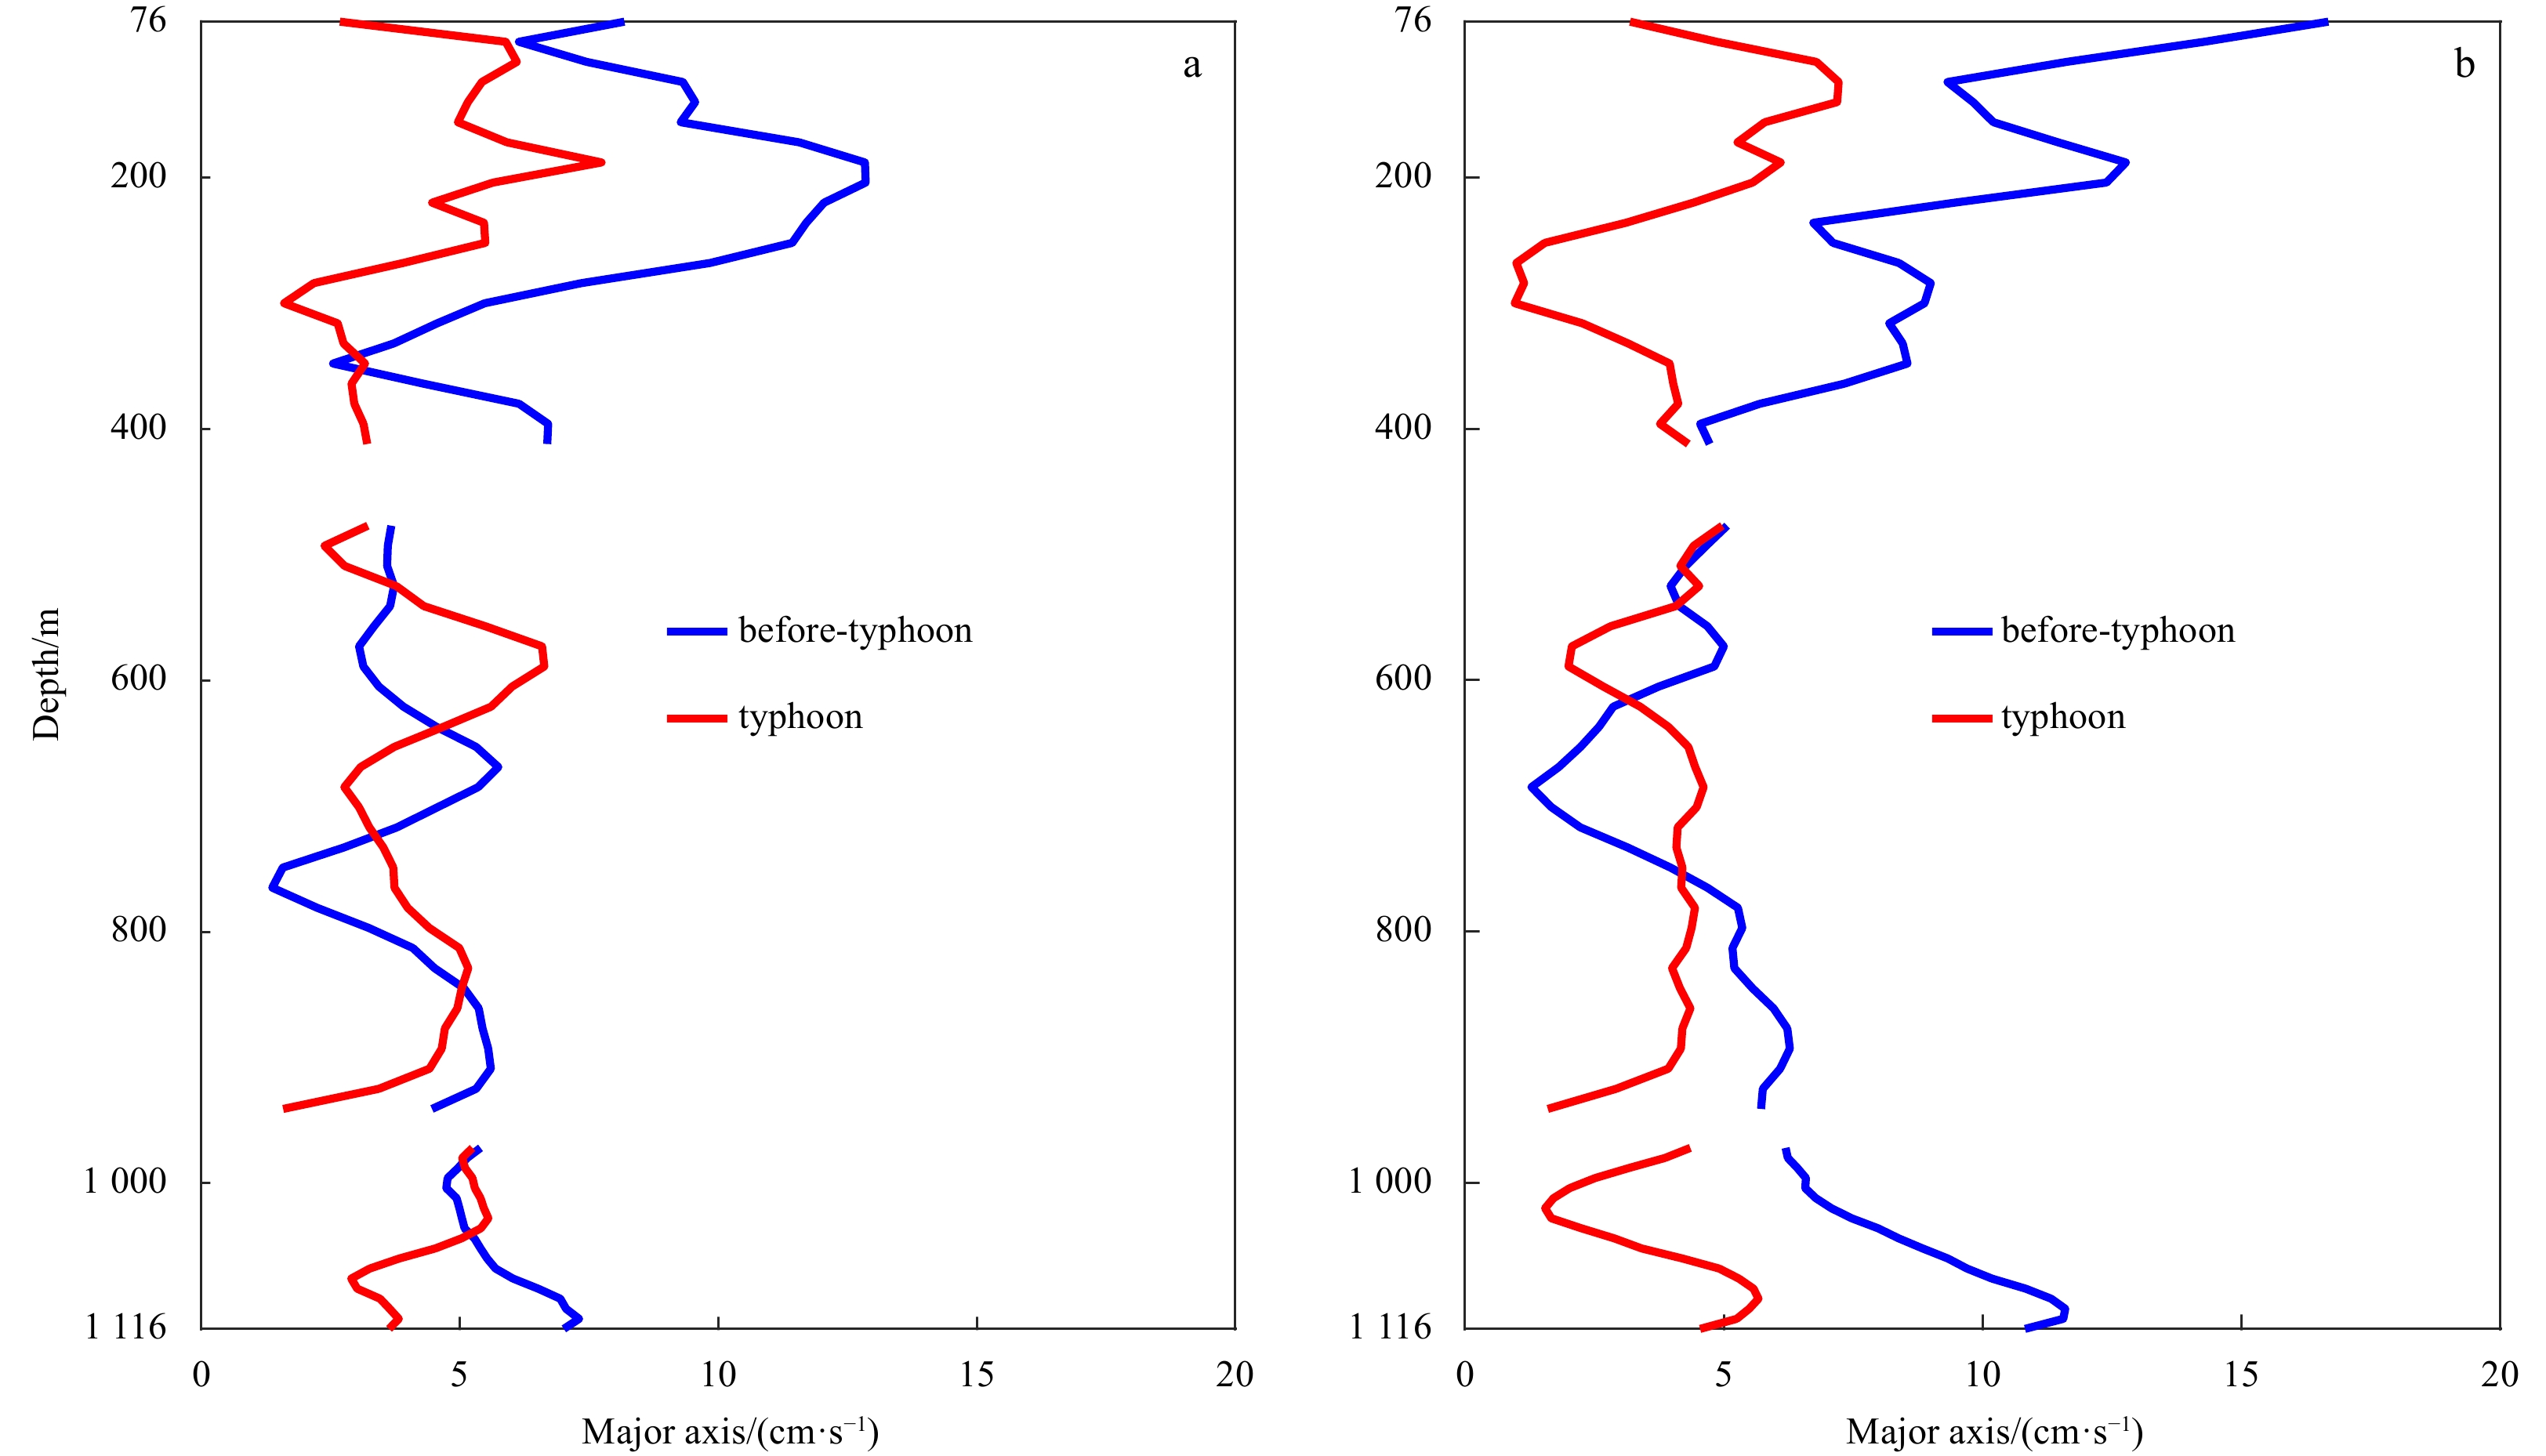

Compared with the pre-typhoon period, the major axis of
Owing to the superposition effect of diurnal tidal components
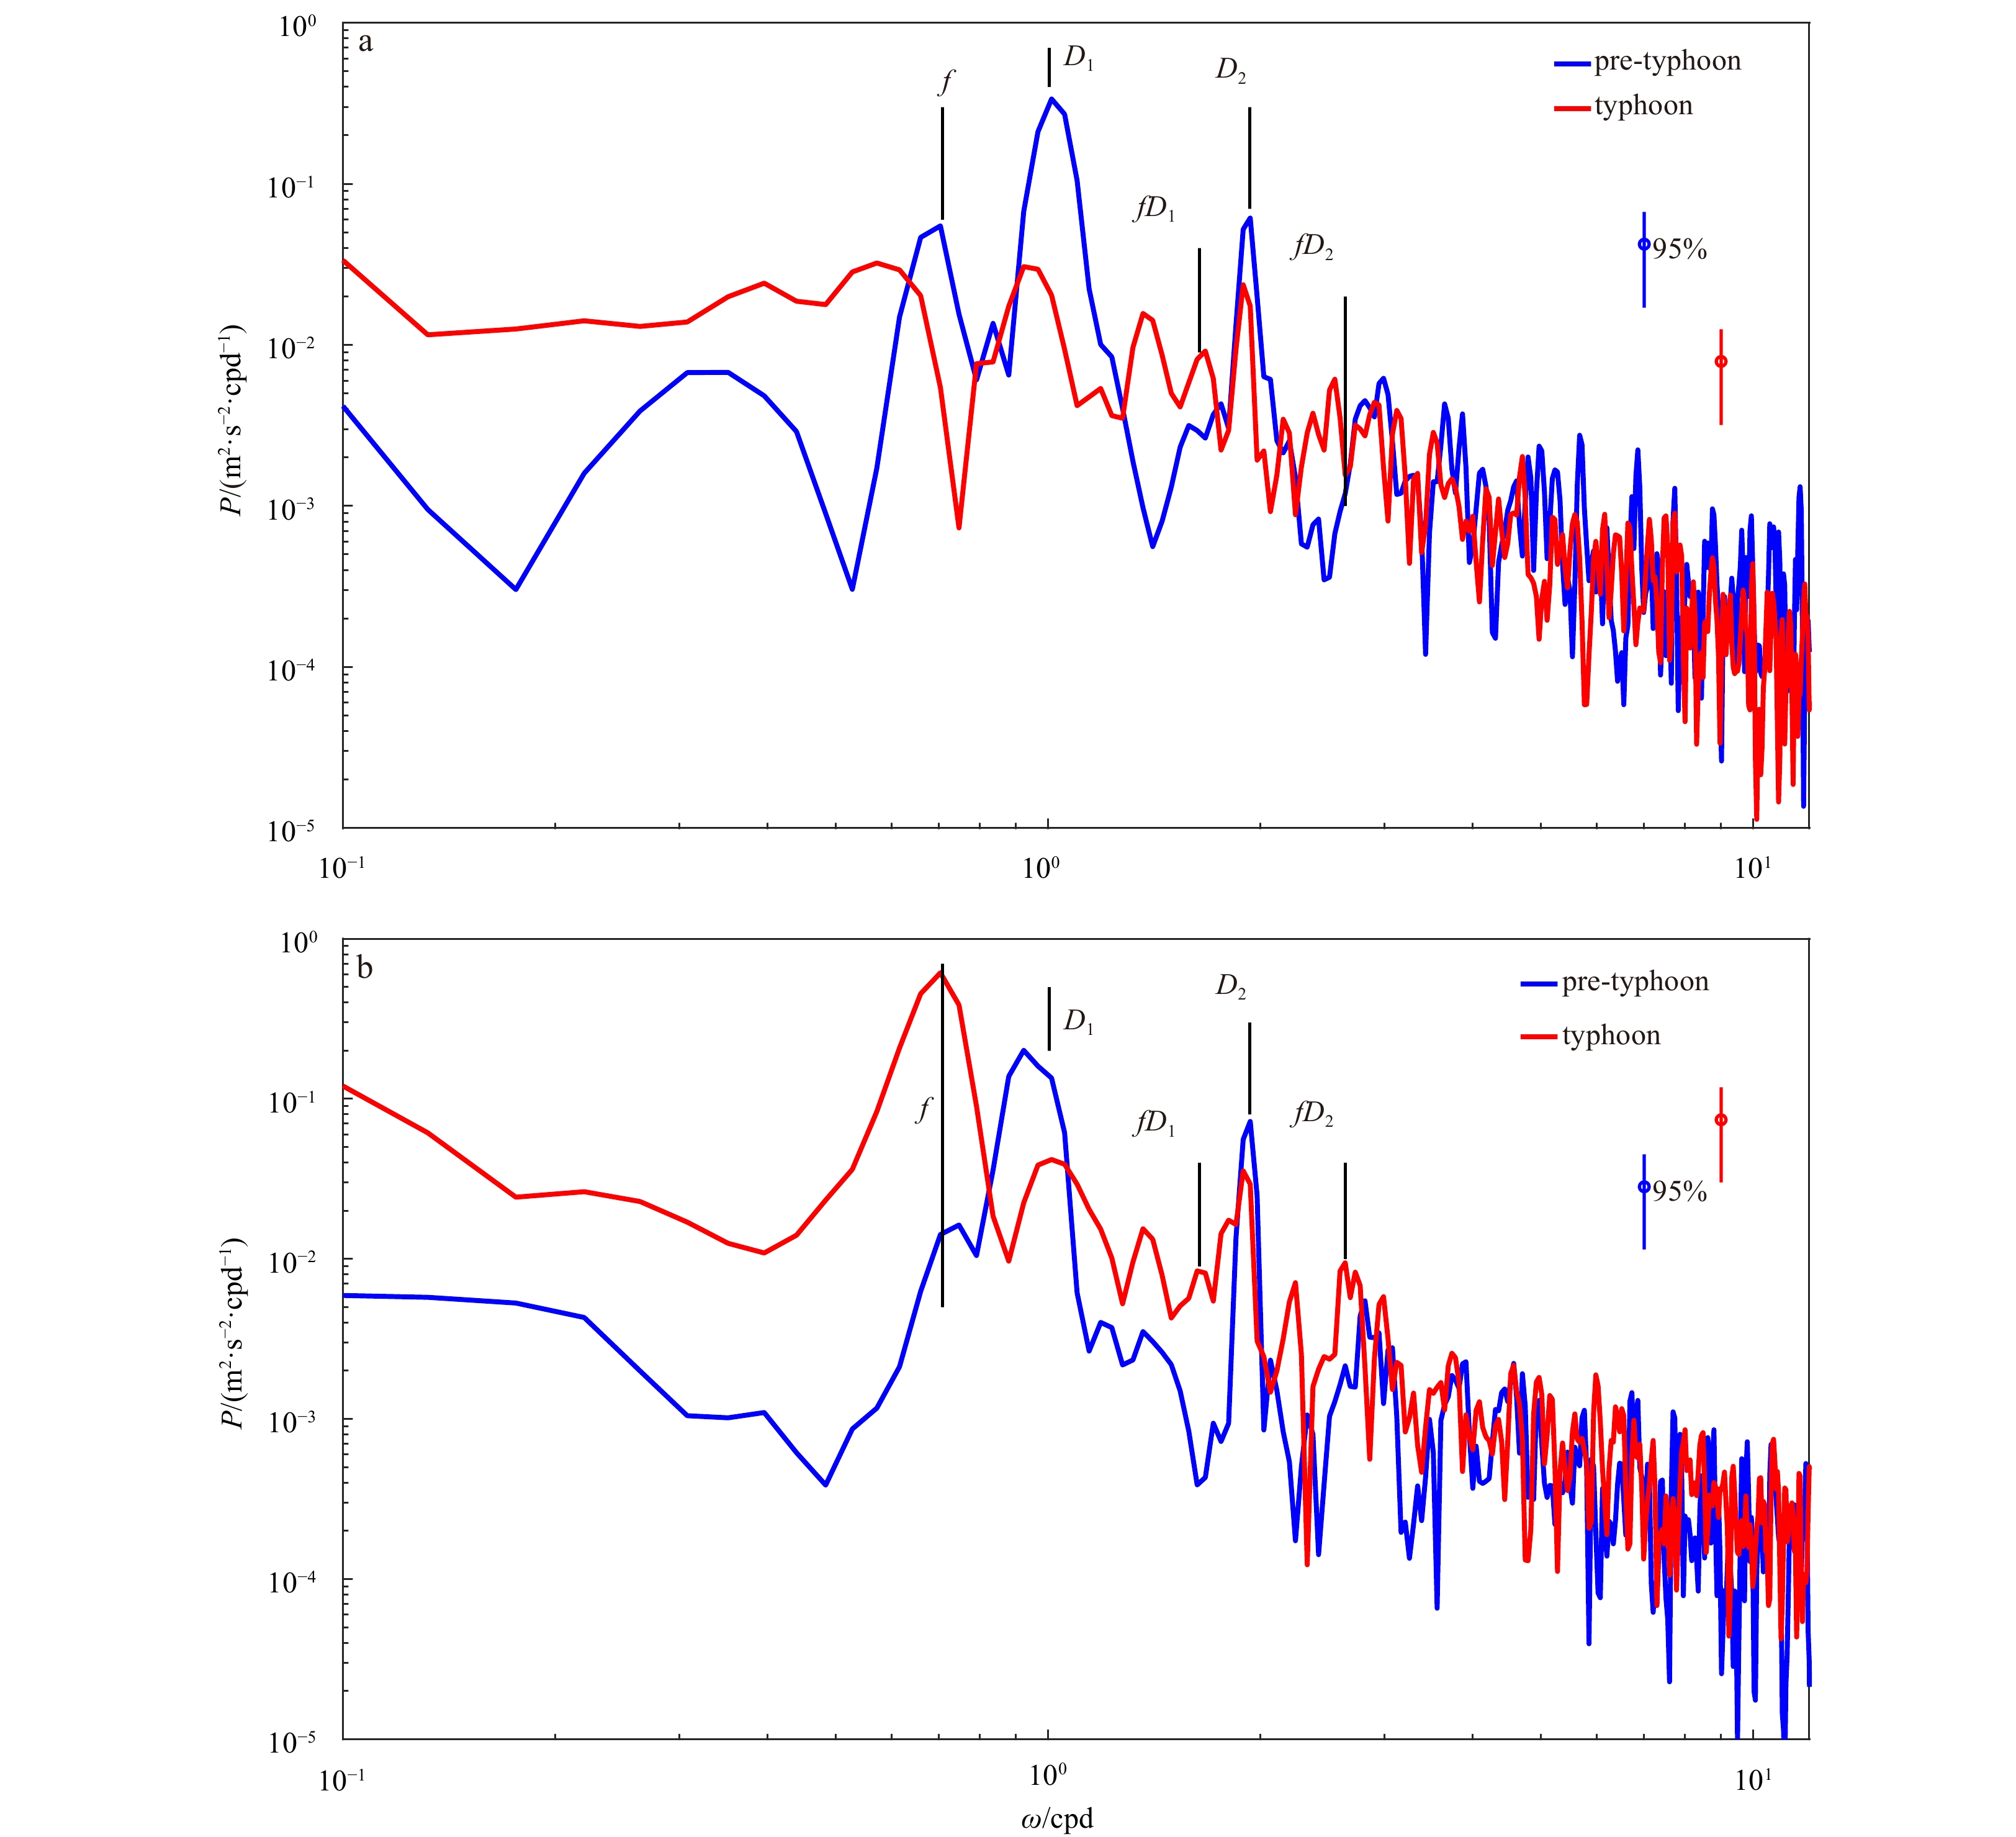
Time-averaged kinetic energy of NIWs during the typhoon period (not given) was markedly increased in the upper 400 m, which meant that the effective depth of influence of Typhoon Kalmaegi was less than 400 m. To determine why diurnal ITs lost more energy than semidiurnal ITs during the typhoon period, we compared the kinetic energy spectra between the pre-typhoon and typhoon periods. In Fig. 6, we compared the kinetic energy spectra during the pre-typhoon and typhoon periods at two different depths. Peaks in the kinetic energy spectra were concentrated at local inertial, diurnal, and semidiurnal frequencies. Due to the limited temporal span of data in the pre-typhoon and typhoon periods, various diurnal and semidiurnal frequencies could not be distinguished in the spectra (displayed as diurnal and semidiurnal frequency bands

To explore clearly the vertical variations of diurnal and semidiurnal ITs, NIWs, fD1 and fD2, we provided depth-time series of their signals (Fig. 7). The large velocity amplitudes of diurnal and semidiurnal ITs were found in a narrow depth range near the surface (Figs 7a and b), and large velocity amplitudes of diurnal ITs were also found near the bottom (Fig. 7a). What’s more, the relatively large velocity amplitudes of diurnal ITs in the upper 300 m and lower 1 000 m showed a clear fortnightly spring-neap cycle (Fig. 7a). However, during the typhoon period, diurnal ITs weakened obviously and the characteristic of fortnightly spring-neap cycle disappeared. In the meantime, velocity amplitudes of NIWs increased between the depths of 100–300 m (Fig. 7c), and velocity amplitudes of fD1 and fD2 also increased at the corresponding depth but with a delay time (Figs 7d and e).

While nonlinear interactions appeared at the mooring site, the reason behind diurnal ITs losing more energy in the nonlinear processes than semidiurnal ITs remains to be answered. The secondary wave
| $$ \frac{\partial {u}_{f{D}_{1}}}{\partial t}\approx -{\left(u\frac{\partial u}{\partial x}\right)}_{f{D}_{1}}-{\left(v\frac{\partial u}{\partial y}\right)}_{f{D}_{1}}-{\left(w\frac{\partial u}{\partial z}\right)}_{f{D}_{1}} ,$$ | (4) |
| $$ \frac{\partial {v}_{f{D}_{1}}}{\partial t}\approx -{\left(u\frac{\partial v}{\partial x}\right)}_{f{D}_{1}}-{\left(v\frac{\partial v}{\partial y}\right)}_{f{D}_{1}}-{\left(w\frac{\partial v}{\partial z}\right)}_{f{D}_{1}}. $$ | (5) |
The same was observed for the secondary wave
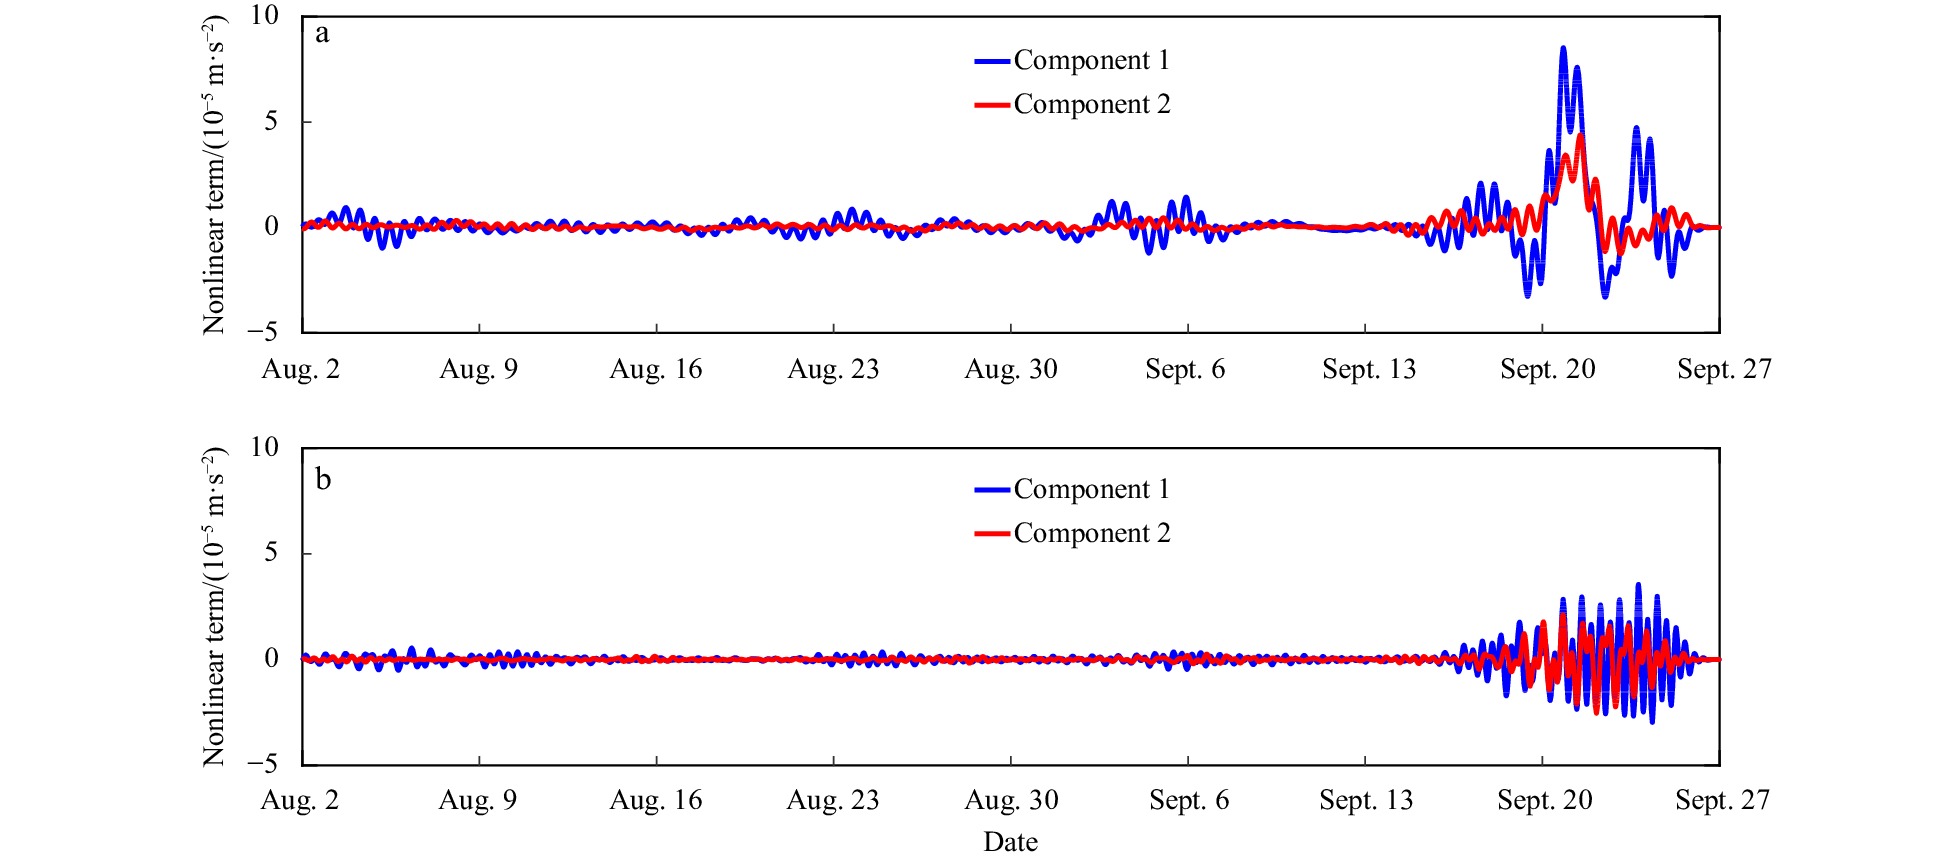
The horizontal nonlinear momentum terms (Terms 1 and 2 on the right side of Eqs (4) and (5)) are beyond computation because there is only a single mooring site in our study. However, Guan and coworkers (Guan et al., 2014) had demonstrated the amplitude of horizontal nonlinear terms to be more than 10 times smaller than that of the vertical nonlinear terms (Term 3 on the right side of Eqs (4) and (5)). Therefore, we only calculated the vertical nonlinear terms (Liu et al., 2018). Furthermore, vertical nonlinear terms for the triad of interactions
A time series of depth-averaged Component 1 and Component 2 is shown in Fig. 8. For interactions
Unfortunately, mooring data were collected only until September 27. If the duration of collection of mooring data had been longer, we could have studied the entire process of the effect of typhoon on IWs and the characteristic change of IWs.
As mentioned in Section 3.1, diurnal ITs have a 14-d cycle during the pre-typhoon period, the regular variation characteristics of which were lost during the typhoon period. This was an important finding that could improve our understanding of the effect of typhoons on ITs in the SCS. The strong shear of NIWs and vertical velocity of diurnal ITs could lead to nonlinear interactions between NIWs and diurnal ITs, consistent with previous observational results (Liu et al., 2018). In addition, our study showed that diurnal ITs lose more energy than semidiurnal ITs during the typhoon period. There can be two possible explanations for the large reduction in diurnal ITs. First, the interactions
Besides the modulations from typhoon, mesoscale eddies or Kuroshio intrusion might refract away the tidal beam emitted from Luzon Strait (Huang et al., 2018; Xu et al., 2021), leading to the absence of internal tidal energy at the observation site. And in presence of strain, there is a permanent energy transfer from mesoscale eddies to near-inertial oscillations forced by isotropic wind stress (Jing et al., 2017). Besides, because of the current and stratification modulations by the eddy pair, the propagation speed of the mode-1 semidiurnal internal tides sped up (slowed down) within the anticyclonic eddy’s (cyclonic eddy’s) southern portion (Huang et al., 2018). The different Kuroshio paths will alter the radiating pattern and local dissipation efficiency of internal tides (Kerry et al., 2014; Xu et al., 2021).
Based on the automatic eddy detection method (Halo et al., 2014; Yu et al., 2017), we have examined the mesoscale variations in the northern SCS from sea level anomaly data (figure not shown). During the observation period, we found that a mesoscale warm eddy formed on September 11 and remained until the end of the observation. The warm eddy center was closest to mooring station on September 21. The vorticity at mooring station reached the maximum on September 8 and then decreased gradually until to zero on September 16. The transition from positive value to negative value of vorticity reflects the influence of the warm eddy on the mooring station. The influence of the warm eddy on the mooring station covers the pre-typhoon and typhoon periods and indicates that Typhoon Kalmaegi and the warm eddy shared overlapping influence at the mooring station. However, due to the limited observation data, it is impossible to separate the influence of Typhoon Kalmaegi and the warm eddy, which still need further research.
There are primarily two types of interactions that have been identified in the ocean, which are termed resonant (weak wave-wave) and nonresonant (strong) interactions, resonant interaction is primarily due to the resonant relationship (e.g., dispersion, frequency, and wave number) among the interaction waves and nonresonant interaction is primarily due to large, nonlinear advection terms from internal wave momentum equations (Liu et al., 2018). McComas and Bretherton (1977) divided the resonant interactions into three distinct classes, namely Induced Diffusion (ID), Parametric Subharmonic Instability (PSI), and Elastic Scattering (ES). ID is an interaction between a pair similar small-scale-high-frequency waves and a largescale-low-frequency wave. ID dominates internal wave spectra at high frequencies (Müller et al., 1986) and ID transferring energy from the high to low frequencies (McComas and Müller, 1981). ES transfers energy between two waves with nearly opposite vertical, but similar horizontal, wavenumbers. In the case of PSI, two internal waves of nearly opposite wavenumbers and nearly equal frequencies resonantly interact with an internal wave of much smaller wavenumber and almost twice the frequency (Onuki and Hibiya, 2014). Many observations have confirmed that semidiurnal (D2) internal tides can transfer energy via PSI to NIWs with frequencies of two subharmonic waves (D2/2) close to the local inertial frequency (Alford, 2008; Xie et al., 2008, 2009). Observations in the northern SCS have suggested that the PSI of D2 internal tides generates NIWs as well as internal waves with frequencies around D2 − f, in which the two subharmonic waves are not equal to half the forcing frequency (Xie et al., 2011). Some observations indicate that the nonresonant interaction also plays an important role in the energy transfer of internal waves, which is found to occur mainly between semidiurnal ITs and typhoon-induced NIWs (Liao et al., 2012) and diurnal ITs and typhoon-induced NIWs (Guan et al., 2014). Our observations found that interaction between typhoon-induced NIWs and diurnal and semidiurnal ITs can occur at the same time and led to the attenuation of diurnal and semidiurnal ITs.
Using in-situ observational data, modal decomposition, spectral analysis, and nonlinear term analysis, we investigated the effect of typhoons on the characteristics of IWs near the Dongsha Islands in the northeastern SCS. Several important conclusions were drawn from the study.
First, during the typhoon period, the modal energy of NIWs increased 5.11 times, mainly due to the increase in high-mode energy. Our observations suggested that typhoons can lead to a rapid rise of atmospheric forcing at the mooring site. The time-averaged modal energy (sum of Modes 1–5) of NIWs was the highest on September 21, which was six days after the day of maximum wind speed. This indicated that the enhancement of NIWs due to atmospheric forcing exhibited a hysteresis effect. Quantitative analysis demonstrated the time-averaged modal energies of NIWs to be 0.62 kJ/m2and 3.79 kJ/m2 during the pre-typhoon and typhoon periods, respectively. Thus, the modal energy of NIWs increased 5.11 times during the typhoon period. Specific to each single mode, all five modes increased during the typhoon period, although the high-mode increased more rapidly than the low-mode. Consequently, the enhancement of NIWs was mainly due to the increase in high-mode energy.
Second, we found that typhoons can lead to a decrease in the modal energy of diurnal and semidiurnal ITs, mainly due to a decrease in the low-mode energy. Quantitative analysis demonstrated that during the pre-typhoon period, the time-averaged modal energies of diurnal and semidiurnal internal tides were 5.66 kJ/m2 and 1.48 kJ/m2, respectively. However, during the typhoon period, the corresponding values were 1.76 kJ/m2 and 1.18 kJ/m2, respectively. It was, therefore, concluded that the modal energies of diurnal and semidiurnal ITs were reduced by 68.9% and 20%, respectively, during the typhoon period. The diurnal and semidiurnal ITs were both dominated by low modes during the pre-typhoon period. However, during the typhoon period, diurnal ITs contained a higher proportion of high modes, since there were larger declines in low modes. The decrease in low-mode energy was also the main reason for the decrease in modal energy of diurnal and semidiurnal ITs during the typhoon period. The significantly reduced diurnal ITs during the typhoon period could be (1) due to the strong nonlinear interaction between diurnal ITs and NIWs and (2) due to a higher proportion of high modes during the typhoon period, which led to a larger energy dissipation.
Finally, our observations led to the interesting and novel finding that typhoons can regulate the 14-d spring-neap cycle of diurnal ITs which result from the modulation of
|
Alford M H. 2003. Redistribution of energy available for ocean mixing by long-range propagation of internal waves. Nature, 423(6936): 159–162. doi: 10.1038/nature01628
|
|
Alford M H. 2008. Observations of parametric subharmonic instability of the diurnal internal tide in the South China Sea. Geophysical Research Letters, 35(15): 596–598. doi: 10.1029/2008gl034720
|
|
Davies A M, Xing J X. 2003. On the interaction between internal tides and wind-induced near-inertial currents at the shelf edge. Journal of Geophysical Research: Oceans, 108(C3): 3099. doi: 10.1029/2002JC001375
|
|
Guan Shoude, Zhao Wei, Huthnance J, et al. 2014. Observed upper ocean response to typhoon Megi (2010) in the Northern South China Sea. Journal of Geophysical Research: Oceans, 119(5): 3134–3157. doi: 10.1002/2013JC009661
|
|
Halo I, Backeberg B, Penven P, et al. 2014. Eddy properties in the Mozambique Channel: A comparison between observations and two numerical ocean circulation models. Deep-Sea Research Part II-Topical Studies in Oceanography, 100: 38–53. doi: 10.1016/j.dsr2.2013.10.015
|
|
Huang Xiaodong, Wang Zhaoyun, Zhang Zhiwei, et al. 2018. Role of mesoscale eddies in modulating the semidiurnal internal tide: observation results in the northern South China Sea. Journal of Physical Oceanography, 48(8): 1749–1770. doi: 10.1175/jpo-d-17-0209.1
|
|
Jing Zhao, Wu Lixin, Ma Xiaohui. 2017. Energy exchange between the mesoscale oceanic eddies and wind-forced near-inertial oscillations. Journal of Physical Oceanography, 47(3): 721–733. doi: 10.1175/jpo-d-16-0214.1
|
|
Kerry C G, Powell B S, Carter G S. 2014. The impact of subtidal circulation on internal tide generation and propagation in the Philippine Sea. Journal of Physical Oceanography, 44(5): 1386–1405. doi: 10.1175/jpo-d-13-0142.1
|
|
Lee I H, Wang Yuhuai, Yang Y, et al. 2012. Temporal variability of internal tides in the northeast South China Sea. Journal of Geophysical Research: Oceans, 117(C2): C02013. doi: 10.1029/2011JC007518
|
|
Li Qiang, Mao Xianzhong, Deng Guotong, et al. 2019. Internal tide generation and dissipation by small periodic topography in Deep Ocean. Journal of Ocean University of China, 18(4): 761–770. doi: 10.1007/s11802-019-3966-7
|
|
Liang Changrong, Chen Guiying, Shang Xiaodong, et al. 2019. Observation of enhanced nonlinear interactions after severe tropical storm Chanchu (2004) in the Western South China Sea. Journal of Geophysical Research: Oceans, 124(6): 3837–3848. doi: 10.1029/2018JC014839
|
|
Liao Guanghong, Yuan Yaochu, Yang Chenghao, et al. 2012. Current observations of internal tides and parametric subharmonic instability in Luzon Strait. Atmosphere-Ocean, 50(S1): 59–76. doi: 10.1080/07055900.2012.742007
|
|
Liu Junliang, He Yinghui, Li Juan, et al. 2018. Cases study of nonlinear interaction between near-inertial waves induced by typhoon and diurnal tides near the Xisha islands. Journal of Geophysical Research: Oceans, 123(4): 2768–2784. doi: 10.1029/2017JC013555
|
|
Liu Qian, Xie Xiaohui, Shang Xiaodong, et al. 2019. Modal structure and propagation of internal tides in the northeastern South China Sea. Acta Oceanologica Sinica, 38(9): 12–23. doi: 10.1007/s13131-019-1473-1
|
|
McComas C H, Bretherton F P. 1977. Resonant interaction of oceanic internal waves. Journal of Geophysical Research, 82(9): 1397–1412. doi: 10.1029/jc082i009p01397
|
|
McComas C H, Müller P. 1981. Time scales of resonant interactions among oceanic internal waves. Journal of Physical Oceanography, 11(2): 139–147. doi: 10.1175/1520-0485(1981)011<0139:tsoria>2.0.co;2
|
|
Müller P, Holloway G, Henyey F, et al. 1986. Nonlinear interactions among internal gravity waves. Reviews of Geophysics, 24(3): 493–536. doi: 10.1029/rg024i003p00493
|
|
Onuki Y, Hibiya T. 2014. Excitation mechanism of near-inertial waves in baroclinic tidal flow caused by parametric subharmonic instability. Ocean Dynamics, 65(1): 107–113. doi: 10.1007/s10236-014-0789-3
|
|
Nash J D, Alford M H, Kunze E. 2005. Estimating internal wave energy fluxes in the ocean. Journal of Atmospheric and Oceanic Technology, 22(10): 1551–1570. doi: 10.1175/JTECH1784.1
|
|
Pawlowicz R, Beardsley B, Lentz S. 2002. Classical tidal harmonic analysis including error estimates in MATLAB using T-TIDE. Computers & Geosciences, 28(8): 929–937. doi: 10.1016/S0098-3004(02)00013-4
|
|
Pickering A, Alford M, Nash J, et al. 2015. Structure and variability of internal tides in Luzon Strait. Journal of Physical Oceanography, 45(6): 1574–1594. doi: 10.1175/JPO-D-14-0250.1
|
|
Shang Xiaodong, Liu Qian, Xie Xiaohui, et al. 2015. Characteristics and seasonal variability of internal tides in the southern South China Sea. Deep-Sea Research Part I: Oceanographic Research Papers, 98: 43–52. doi: 10.1016/j.dsr.2014.12.005
|
|
Vic C, Garabato A C N, Green J A M, et al. 2019. Deep-ocean mixing driven by small-scale internal tides. Nature Communications, 10(1): 2099. doi: 10.1038/s41467-019-10149-5
|
|
Xie Xiaohui, Chen Guiying, Shang Xiaodong, et al. 2008. Evolution of the semidiurnal (M2) internal tide on the continental slope of the northern South China Sea. Geophysical Research Letters, 35(13): L13604. doi: 10.1029/2008GL034179
|
|
Xie Xiaohui, Liu Qian, Zhao Zhongxiang, et al. 2018. Deep sea currents driven by breaking internal tides on the continental slope. Geophysical Research Letters, 45(12): 6160–6166. doi: 10.1029/2018GL078372
|
|
Xie Xiaohui, Shang Xiaodong, van Haren H, et al. 2011. Observations of parametric subharmonic instability-induced near-inertial waves equatorward of the critical diurnal latitude. Geophysical Research Letters, 38(5): L05603. doi: 10.1029/2010GL046521
|
|
Xie Xiaohui, Shang Xiaodong, van Haren H, et al. 2013. Observations of enhanced nonlinear instability in the surface reflection of internal tides. Geophysical Research Letters, 40(8): 1580–1586. doi: 10.1002/grl.50322
|
|
Xie Xiaohui, Shang Xiaodong, Chen Guiying, et al. 2009. Variations of diurnal and inertial spectral peaks near the bi-diurnal critical latitude. Geophysical Research Letters, 36(2): L02606. doi: 10.1029/2008GL036383
|
|
Xing Jiuxing, Davies A M. 2002. Processes influencing the non-linear interaction between inertial oscillations, near inertial internal waves and internal tides. Geophysical Research Letters, 29(5): 1067. doi: 10.1029/2001GL014199
|
|
Xu Zhenhua, Wang Yang, Liu Zhiqiang, et al. 2021. Insight into the dynamics of the radiating internal tide associated with the Kuroshio current. Journal of Geophysical Research: Oceans, 126(6): e2020JC017018. doi: 10.1029/2020JC017018
|
|
Xu Zhenhua, Yin Baoshu, Hou Yijun, et al. 2013. Variability of internal tides and near-inertial waves on the continental slope of the northwestern South China Sea. Journal of Geophysical Research: Oceans, 118(1): 197–211. doi: 10.1029/2012jc008212
|
|
Xu Zhenhua, Yin Baoshu, Hou Yijun, et al. 2014. Seasonal variability and north-south asymmetry of internal tides in the deep basin west of the Luzon Strait. Journal of Marine Systems, 134: 101–112. doi: 10.1016/j.jmarsys.2014.03.002
|
|
Yu Lusha, Bosse A, Fer I, et al. 2017. The Lofoten Basin eddy: three years of evolution as observed by Seagliders. Journal of Geophysical Research: Oceans, 122(8): 6814–6834. doi: 10.1002/2017jc012982
|
|
Zhai Rongwei, Chen Guiying, Liang Changrong, et al. 2020. The influence of ENSO on the structure of internal tides in the Xisha area. Journal of Geophysical Research: Oceans, 125(3): e2019JC015405. doi: 10.1029/2019JC015405
|
|
Zhao Zhongxiang, Alford M H, MacKinnon J A, et al. 2010. Long-range propagation of the semidiurnal internal tide from the Hawaiian Ridge. Journal of Physical Oceanography, 40(4): 713–736. doi: 10.1175/2009JPO4207.1
|
| 1. | Shuqi Zhang, Zhiwu Chen, Haonan Wang, et al. A numerical study on energy transfer between near-inertial internal waves and super-inertial internal waves in the South China Sea under the influence of a typhoon. Continental Shelf Research, 2024. doi:10.1016/j.csr.2024.105240 |

Figures(8) / Tables(2)

Supported by:
Beijing Renhe Information Technology Co. Ltd

Rongwei Zhai, Guiying Chen, Chenjing Shang, Xiaodong Shang, Youren Zheng. The effect of Typhoon Kalmaegi on the modal energy and period of internal waves near the Dongsha Islands (South China Sea)[J]. Acta Oceanologica Sinica, 2023, 42(12): 22-31. doi: 10.1007/s13131-023-2205-7

| Time | The 13.9–17.1 $ \mathrm{m}/\mathrm{s} $ wind radius/km | The 24.5–28.4 $ \mathrm{m}/\mathrm{s} $ wind radius/km | The 32.7–36.9 $ \mathrm{m}/\mathrm{s} $ wind radius/km | Propagation speed/ $(\mathrm{k}\mathrm{m}\cdot{\mathrm{h} }^{-1})$ | Distance to Kalmaegi track/km |
| 2014/09/14 18:00 | 200–350 | 60–120 | 30 | 30 | 350 |
| 2014/09/15 00:00 | 210–400 | 70–110 | 40 | 30 | 304 |
| 2014/09/15 06:00 | 190–450 | 100–110 | 40 | 30 | 305 |
| 2014/09/15 12:00 | 280–480 | 110–120 | 60 | 40 | 401 |
| 2014/09/15 18:00 | 280–480 | 110–120 | 60 | 40 | 534 |
| 2014/09/16 00:00 | 280–480 | 110–120 | 60 | 40 | 534 |
DownLoad:
CSV
| Number of modes | Pre-typhoon | Typhoon | |
| NIWs | Mode 1 | 0.21 | 0.70 |
| Mode 2 | 0.06 | 0.16 | |
| Mode 3 | 0.13 | 0.95 | |
| Mode 4 | 0.09 | 0.95 | |
| Mode 5 | 0.13 | 1.03 | |
| 0.62 | 3.79 | ||
| Diurnal ITs | Mode 1 | 3.08 | 0.46 |
| Mode 2 | 1.11 | 0.38 | |
| Mode 3 | 0.63 | 0.25 | |
| Mode 4 | 0.34 | 0.33 | |
| Mode 5 | 0.50 | 0.34 | |
| 5.66 | 1.76 | ||
| Semidiurnal ITs | Mode 1 | 0.63 | 0.41 |
| Mode 2 | 0.55 | 0.35 | |
| Mode 3 | 0.20 | 0.20 | |
| Mode 4 | 0.03 | 0.10 | |
| Mode 5 | 0.07 | 0.12 | |
| 1.48 | 1.18 | ||
| Note: Bold numbers are total values. | |||
DownLoad:
CSV
| Time | The 13.9–17.1 $ \mathrm{m}/\mathrm{s} $ wind radius/km | The 24.5–28.4 $ \mathrm{m}/\mathrm{s} $ wind radius/km | The 32.7–36.9 $ \mathrm{m}/\mathrm{s} $ wind radius/km | Propagation speed/ $(\mathrm{k}\mathrm{m}\cdot{\mathrm{h} }^{-1})$ | Distance to Kalmaegi track/km |
| 2014/09/14 18:00 | 200–350 | 60–120 | 30 | 30 | 350 |
| 2014/09/15 00:00 | 210–400 | 70–110 | 40 | 30 | 304 |
| 2014/09/15 06:00 | 190–450 | 100–110 | 40 | 30 | 305 |
| 2014/09/15 12:00 | 280–480 | 110–120 | 60 | 40 | 401 |
| 2014/09/15 18:00 | 280–480 | 110–120 | 60 | 40 | 534 |
| 2014/09/16 00:00 | 280–480 | 110–120 | 60 | 40 | 534 |
| Number of modes | Pre-typhoon | Typhoon | |
| NIWs | Mode 1 | 0.21 | 0.70 |
| Mode 2 | 0.06 | 0.16 | |
| Mode 3 | 0.13 | 0.95 | |
| Mode 4 | 0.09 | 0.95 | |
| Mode 5 | 0.13 | 1.03 | |
| 0.62 | 3.79 | ||
| Diurnal ITs | Mode 1 | 3.08 | 0.46 |
| Mode 2 | 1.11 | 0.38 | |
| Mode 3 | 0.63 | 0.25 | |
| Mode 4 | 0.34 | 0.33 | |
| Mode 5 | 0.50 | 0.34 | |
| 5.66 | 1.76 | ||
| Semidiurnal ITs | Mode 1 | 0.63 | 0.41 |
| Mode 2 | 0.55 | 0.35 | |
| Mode 3 | 0.20 | 0.20 | |
| Mode 4 | 0.03 | 0.10 | |
| Mode 5 | 0.07 | 0.12 | |
| 1.48 | 1.18 | ||
| Note: Bold numbers are total values. | |||
 DownLoad:


 DownLoad: