Morphotype dependence of Globigerinoides ruber (white) and Trilobatus sacculifer Mg/Ca ratios in the western tropical Pacific: implications for reconstructing the mixed-layer depth
First Institute of Oceanography, Ministry of Natural Resources, Qingdao 266061, China
2.
Laboratory for Marine Geology, Pilot National Laboratory for Marine Science and Technology (Qingdao), Qingdao 266061, China
Funds:
The National Natural Science Foundation of China under contract Nos 41830539 and 41906063; the Marine S&T Fund of Shandong Province for Pilot National Laboratory for Marine Science and Technology (Qingdao) under contract No. 2022QNLM050203; the Taishan Scholars Project Funding under contract No. ts20190963.
Planktonic foraminifer Globigerinoides ruber (white) and Trilobatus sacculifer are the most frequently used mixed-layer dwelling species for reconstructing past oceanic environments. Specifically, the Mg/Ca ratios of these two foraminiferal species have been used for reconstructing tropical/subtropical changes in sea surface temperature (SST). However, these two species have different morphotypes, of which the spatial and temporal differences in Mg/Ca ratios and their influencing factors are still unclear. Our objective is to investigate the potential differences between the Mg/Ca ratios of these different morphotypes of G. ruber (white) and T. sacculifer in the western Philippine Sea (WPS) and determine their implications for the reconstruction of SST and upper-ocean structure. Mg/Ca measurements are made on two basic morphotypes of G. ruber (white) [sensu stricto (s.s.) and sensu lato (s.l.)] and T. sacculifer [with (w) and without (w/o) a sac-like final chamber] on samples of Site MD06-3047B from the WPS. Our results reveal that Mg/Ca ratios of different G. ruber morphotypes show consistent differences; and those of T. sacculifer morphotypes show staged variations since MIS 3. It is suggested to select a single morphotype for reconstructing SST changes using the Mg/Ca ratios of G. ruber and T. sacculifer in the WPS. Furthermore, the Mg/Ca ratios between G. ruber s.s. and G. ruber s.l. [Δ(Mg/Ca)G.ruber s.s.−s.l.] downcore MD06-3047B covaries with indexes of summer monsoon. Combining with the core-top results, showing regional variation of differences in the Δ(Mg/Ca)G.ruber s.s.−s.l. over the western tropical Pacific, we propose that Δ(Mg/Ca)G.ruber s.s.−s.l. may tend to reflect summer mixed layer depth.
The stable isotope and elemental compositions of planktonic foraminiferal shells are important paleoceanographic proxies (Lea et al., 2000; Mohtadi et al., 2014; Stott et al., 2002). Based on the use of such proxies, a series of important research findings, including significant hydrological changes in the low latitude and the discovery of the super El Niño/Southern Oscillation (ENSO) or ENSO-like cycles have been obtained (Koutavas and Joanides, 2012; Mohtadi et al., 2010; Stott et al., 2002). Globigerinoides ruber (white) and Trilobatus sacculifer are two dominant species in tropical and subtropical oceans, serving as commonly used paleoceanographic proxies (Chowdhury et al., 2003; Jayan et al., 2021; Rippert et al., 2016; Sijinkumar et al., 2010; Steinke et al., 2005). In this respect, a major portion of existing knowledge on past surface seawater characteristics is based on these two surface-dwelling planktonic foraminifera species, G. ruber (white) and T.sacculifer (Gussone et al., 2004; Mohtadi et al., 2010; Steinke et al., 2005). However, the two species both have morphotypes, and the difference of geochemical proxies between these morphological shell types has not been thoroughly examined.
Globigerinoides ruber (white) has two main morphotypes, namely, the sensu stricto (s.s.) and sensu lato (s.l., or “Elongatus morphotypes”) morphotypes, which in most tropical sediments, are usually differentiated using taxonomic criteria (Jayan et al., 2021; Wang, 2000). Specifically, G. ruber s.l. is characterized by a more compact and higher degree of trochospiral coiling than G. ruber s.s. (Wang, 2000; Figs 1a and b). Their different isotopic compositions of these morphotype shells from surface sediments indicate that they inhabit at different water depths, G. ruber s.s. at a shallower depth than that of G. ruber s.l. (Antonarakou et al., 2015; Kawahata, 2005; Steinke et al., 2005; Wang, 2000). Thus, in the last two decades, G. ruber Mg/Ca ratios have been widely used as a proxy for reconstructing sea surface temperature (SST) in tropical and subtropical oceans (Dang et al., 2012; Jia et al., 2018; Lea et al., 2000; Medina-Elizalde and Lea, 2005; Stott et al., 2002). However, some studies have indicated that the Mg/Ca ratios of G. ruber s.s. and G. ruber s.l. in the South China Sea and the eastern Indian Ocean are significantly different (Steinke et al., 2005, 2008). Conversely, the results of some other studies have revealed that the two G. ruber morphotypes have relatively similar Mg/Ca ratios in some areas in the eastern Indian Ocean (Mohtadi et al., 2009, 2010) and western equatorial Pacific Ocean (Tachikawa et al., 2014). It appears that it is still debatable whether or not difference of shell Mg/Ca ratios exists between different morphotypes, hence SST reconstruction. Thereby, whether there are significant differences between the Mg/Ca ratios of G. ruber s.s. and G. ruber s.l. might be important for reconstructing SST changes and upper-ocean structure.
Figure
1.
Scanning electron micrographs of G. ruber (white) and T. sacculifer morphotypes: G. ruber sensu stricto (s.s.) (a), G. ruber sensu lato (s.l.) (b), T. sacculifer (with a sac-like final chamber) (c), and T. sacculifer (without a sac-like final chamber) (d). The foraminferal shells are from core-top sample of Core MD06-3047B. Scale bars (500 μm) are indicated on each image.
Additionally, modern T. sacculifer also has two basic morphotypes, i.e., with (w) and without (w/o) a sac-like final chamber) (André et al., 2013; Bijma and Hemleben, 1994; Spezzaferri et al., 2015). Based on the analysis of sediment samples from the Atlantic Ocean, Elderfield et al. (2002) and Anand et al. (2003) observed that there are slight differences in oxygen-carbon isotope composition and Mg/Ca ratios between T. sacculifer (w) and T. sacculifer (w/o). Nevertheless, great care has been taken to distinguish the two morphotypes of T. sacculifer when this species is used for SST reconstruction in most previous studies (Lynch-Stieglitz et al., 2015; Setiawan et al., 2015). However, few studies have referred whether there is significant difference through geological time. This is important to verify if it is necessary to strictly select the same morphotype of T. sacculifer for downcore Mg/Ca analytical testing.
However, the spatial and temporal differences in Mg/Ca between different morphotypes of G. ruber and T. saccluifer and its influencing factors are still not clear enough. How much the uncertainty of Mg/Ca records of different morphotypes exists is important for deciding whether mixed morphotypes of the two species can be used for SST reconstruction, especially in study areas where there are insufficient single morphotype shells for Mg/Ca testing. In addition, what environmental parameters are responsible for the Mg/Ca differences between different morphotypes can help figure out the potential of the inter-morphotype Mg/Ca differences as indicators for upper-water structure in the western tropical Pacific. The western Philippine Sea (WPS) has become an important area for paleoceanography studies of the western tropical Pacific. Exploring the differences in Mg/Ca ratios between the different morphotypes of G. ruber (white) and T. sacculifer in this area is significant for using their Mg/Ca ratios to reflect changes in SST or thermal structure. In this study, we investigate the differences in Mg/Ca ratios and SST estimations between the different morphotypes of G. ruber (white) and T. sacculifer in the WPS. On this basis, by collecting and comparing relevant data from other sites over the western tropical Pacific, we further discuss the spatial and temporal variations of inter-morphotype G. ruber Mg/Ca between different morphotypes and its potential as indicators of upper-ocean structure.
2.
Materials and methods
2.1
Materials
Core MD06-3047B (17°00.44'N, 124°47.93'E; 2510 m water depth) from the WPS was recovered using a Calypso Giant Piston Corer on board the R/V Marion‒Dufresne vessel during the Marco Polo 2 cruise of the International Marine Global Change Studies Program (IMAGES) in June 2006. The coring site, located on the Benham Rise formed at ~50–45 Ma, is approximately 240 km east off Luzon (Hilde and Lee, 1984). The core sediments primarily consist of yellowish-brown silty clay with no visible evidence of sediment deformation (Jia et al., 2018), and for this study, the sediments were sampled at 4 cm intervals from the upper 60 cm of the core. The age model was established by correlating the benthic foraminiferal δ18O record of this core to LR04 stack (Jia et al., 2018). The 0–60 cm portion of the core provided a continuous record covering the last ~47 ka, spanning from MIS 3 to MIS 1, with a mean temporal resolution of approximately 3 ka (Jia et al., 2018).
2.2
Mg/Ca analyses and seawater temperature estimates
Approximately 30–50 tests of G. ruber s.s., G. ruber s.l., T. sacculifer (w), and T. sacculifer (w/o) (Fig. 1) respectively were hand-picked from the 250–300 μm size fraction to determine Mg/Ca ratios. Samples corresponding to the intervals of 38–39 cm and 42–43 cm were mixed for G. ruber s.s. Mg/Ca testing, as the amounts of G. ruber s.s. specimens in individual samples are insufficient for analysis. These samples for Mg/Ca analysis were cleaned in accordance with previously reported treatment procedures without a reductive step (Barker et al., 2003). Next, the Mg/Ca ratios were analyzed by inductively coupled plasma-optical emission spectrometry (ICP-OES, iCAP6300 radial, Thermo Fisher, Waltham, MA, USA) at the Institute of Oceanology, Chinese Academy of Sciences. The long-term internal reproducibility (SD) is 0.07 mmol/mol based on a consistency standard (Mg/Ca = 3.33 mmol/mol). Additionally, the elemental ratios of Fe/Ca, Al/Ca, and Mn/Ca were analyzed at the same time to monitor any contamination by the oxides of iron and manganese, which could bias the Mg/Ca measurements. Notably, there was no significant positive correlation of Fe/Ca, Al/Ca, and Mg/Ca values, indicating negligible contamination of detrital materials and/or metal-oxides on the Mg/Ca ratios (Fig. 2).
Figure
2.
Fe/Ca (left), Al/Ca (middle) and Mn/Ca (right) versus Mg/Ca of the G. ruber (white) and T. sacculifer. There is no obvious correlation between these records, indicating negligible influence of contamination on Mg/Ca ratios.
First, the Mg/Ca (mmol/mol) ratios were converted to temperature (T, ℃) using a multispecies regression equation (Anand et al., 2003):
$$ T = {\mathrm{ln}} [{\mathrm{Mg}}/{\mathrm{Ca}} /0.38]/0.09. $$
(1)
The error of the temperature reconstruction was estimated by propagating the errors introduced by the Mg/Ca measurements and the Mg/Ca-temperature calibration, as introduced by Mohtadi et al. (2014). The resulting errors were on average of ± 1.0℃, similar to those associated with Mg/Ca-temperature calibration reported in other studies (Anand et al., 2003; Dekens et al., 2002; Sagawa et al., 2012).
For comparison, we also use species-specific equations. including
$$ T = {\mathrm{ln}}[{\mathrm{Mg}}/{\mathrm{Ca}}/0.31]/0.097 \;{\mathrm{for}}\;G.\;ruber\; {\mathrm{s}}.{\mathrm{s}} .$$
(2)
$$ T ={\mathrm{ln}} [{\mathrm{Mg}}/{\mathrm{Ca}} /0.32]/0.097 \;{\mathrm{for}}\; G.\; ruber\; {\mathrm{s}}.{\mathrm{l}}. $$
$$ T = {\mathrm{ln}} [{\mathrm{Mg}}/{\mathrm{Ca}} /0.67]/0.069 \;{\mathrm{for}} \;T.\; sacculifer \;({\mathrm{w}}.).$$
(5)
from Anand et al. (2003). The errors estimated by error propagation are on average of ±2.1℃ and ±2.0℃ for temperature estimates of G. ruber s.s. and G. ruber s.l., ±7.4℃ and ±8.0℃ for that of T. sacculifer (w/o) and T. sacculifer (w), respectively. By comparison of temperature estimates and corresponding differences based on multispecies and species-specific equations, consistent variation trends were observed (Fig. S1). Considering the larger errors from temperature estimate based on species-specific equations, and to facilitate the comparison of temperature estimates from Mg/Ca ratios of different morphotypes of G. ruber (white) and T. sacculifer, we choose to use the estimates using the multispecies equation in the following analysis.
2.3
Data collection
To compare results from our study site with those from other regions across the western tropical Pacific, we collect published Mg/Ca ratios of G. ruber s.s. and G. ruber s.l. of the core-top sediment samples from the South China Sea, Offshore Papua New Guinea, Gulf of Papua, and the WPS (Hollstein et al., 2017; Regoli et al., 2015; Steinke et al., 2005). Then the difference between the Mg/Ca ratios of two morphotypes of G. ruber [Δ(Mg/Ca)G.ruber s.s.−s.l.] are estimated see Table S2. Data of mixed-layer depth (MLD) of annual average, average from June to August, and average from December to February, respectively, are retrieved from Monterey and Levitus (1997).
2.4
Statistical analysis
Welch’s test is performed to analyze the Mg/Ca ratios of the different morphotypes of G. ruber and T. sacculifer. First, for comparison, the mean values of the two sets of data are assumed to be equivalent if the Mg/Ca ratios of G. ruber s.s. and G. ruber s.l., or T. sacculifer (w.) and T. sacculifer (w/o) are similar. Thus, the null hypothesis is accepted (H = H0), indicating no significant difference in Mg/Ca ratios between the different morphotypes of G. ruber and T. sacculifer. If significant mean differences were observed, the null hypothesis would be rejected (H = Ha), indicating significant difference in Mg/Ca ratios between different morphological types of these species.
3.
Results
3.1
Mg/Ca ratios and temperature estimation
The Mg/Ca ratios and temperature estimates of G. ruber s.s., G. ruber s.l., T. sacculifer (w), and T. sacculifer (w/o) generally show similar variation trends since MIS 3 (Fig. 3; Table S1). The core-top Mg/Ca values of G. ruber s.s., G. ruber s.l., T. sacculifer (w), and T. sacculifer (w/o) yields temperature estimates of 27.2℃, 25.6℃, 24. 7℃, 24.5℃, respectively, matching well with previous conclusions that the calcification depth of G. ruber s.s. is shallower than that of G. ruber s.l., and that the calcification depth of G. ruber is shallower than that of T. sacculifer (Hollstein et al., 2017). The overall Mg/Ca ratios of G. ruber s.s. was higher than that of G. ruber s.l., and the Δ(Mg/Ca)G.ruber s.s.−s.l. varied in the range of ~0.05–0.59 mmol/mol, with a mean value of ~0.32 mmol/mol. The differences in temperature estimates based on Mg/Ca ratios of G. ruber s.s. and G. ruber s.l. varied between ~0.2℃ and 1.6℃, with a mean value of ~1.0℃. The difference between the Mg/Ca ratios of the two morphotypes of T. sacculifer [Δ(Mg/Ca)T.sacculifer w/o−w] varies in the range of –0.29 mmol/mol to 0.35 mmol/mol, with a mean value ~0.03 mmol/mol, and an average value of absolute Δ(Mg/Ca)T.sacculifer w/o−w of ~0.13 mmol/mol. The corresponding difference in temperature estimates varied in the range of –1.1–1.3℃, showing a mean difference of ~0.1℃. The variation in Δ(Mg/C)aT.sacculifer w/o−w could be divided into three stages: (1) since ~12.5 ka, Mg/Ca ratios of T. sacculifer (w) and T. sacculifer (w/o) show no obvious differences (the mean difference was only ~0.08 mmol/mol), (2) between ~21.7 ka and 12.5 ka, Mg/Ca of T. sacculifer (w/o) are slightly higher than those of T. sacculifer (w), with a mean difference of ~0.16 mmol/mol, (3) between ~40 ka and 21.7 ka, Mg/Ca ratios of T. sacculifer (w/o) are lower than those of T. sacculifer (w), with a mean difference of ~0.18 mmol/mol. Additionally, during the 47–40 ka period, Mg/Ca of T. sacculifer (w) and T. sacculifer (w/o) show no obvious differences, with a mean difference of ~0.07 mmol/mol.
Figure
3.
Mg/Ca ratios (a, b), and Mg/Ca-based temperature (c, d) estimates (based on the multispecies equation from Anand et al. (2003)) of G. ruber s.s., G. ruber s.l., T. sacculifer (w), and T. sacculifer (w/o) of Core MD06-3047B , and the differences between these records for each species.
3.2
Regional difference of Δ(Mg/Ca)G.ruber s.s.−s.l.
By comparing the Δ(Mg/Ca)G.ruber s.s.−s.l. records obtained from our study and those from core-top samples in other areas across the western tropical Pacific, we found that the Δ(Mg/Ca)G.ruber s.s.−s.l. vary widely from one area to another (Antonarakou et al., 2015; Hollstein et al., 2017; Mohtadi et al., 2010). Based on the collected data, Δ(Mg/Ca)G.ruber s.s.−s.l. offshore Papua New Guinea and in the Gulf of Papua are relatively small, with an average difference of approximately 0.09 mmol/mol. The average Δ(Mg/Ca)G.ruber s.s.−s.l. from the WPS and the South China Sea are larger, with an average of ~0.47 mmol/mol. Generally, Δ(Mg/Ca)G.ruber s.s.−s.l. values from core-top samples collected around the center of western Pacific warm pool (WPWP) are relatively small, while those observed from the northern margin of the WPWP were relatively large (Fig. 4).
Figure
4.
Comparison of Δ(Mg/Ca)G.ruber s.s.−s.l. from core-top sediment samples and the mixed-layer depth (MLD) in the western tropical Pacific. a. Location map showing the sites of the core-top Δ(Mg/Ca)G.ruber s.s.−s.l.. The red dots represent positive Δ(Mg/Ca)G.ruber s.s.−s.l. values, while the white dots indicate negative Δ(Mg/Ca)G.ruber s.s.−s.l. values. The sizes of the symbols denote the magnitude of the absolute values of the Δ(Mg/Ca)G.ruber s.s.−s.l. records. b–e. Plots of Δ(Mg/Ca)G.ruber s.s.−s.l. vs. average annual MLD (b), difference between winter and summer MLD (c), summer MLD (d), and winter MLD (e). Data of the South China Sea and WPS are obtained from Steinke et al. (2005), those in the Gulf of Papua and offshore Papua New Guinea from Hollstein et al. (2017) and Tachikawa et al. (2014). Detailed information regarding the data sites is provided in Table S2. Data of the MLD are from Monterey and Levitus (1997).
4.1
Morphotype dependence of Mg/Ca ratios for G. ruber and T. sacculifer in the WPS
The average value of Δ(Mg/Ca)G.ruber s.s.−s.l. is approximately ~0.32 mmol/mol, with a maximum value of ~0.59 mmol/mol, much larger than the reproducibility of Mg/Ca measurements (±0.07 mmol/mol). The difference between the Mg/Ca-based temperature estimates of these two morphotypes is ~1.0℃ on average, with a maximum difference of 1.6℃, also larger than the error of the temperature reconstructions (±1℃). Based on the results of the Welch’s test performed on the Mg/Ca ratios of G. ruber s.s. and G. ruber s.l. and the estimated water temperatures, we reject the null hypothesis (H = Ha), thus, the G. ruber Mg/Ca ratios and estimated temperatures of different morphotypes show significant difference in the WPS (Table 1). Therefore, when using the Mg/Ca ratios G. ruber for SST reconstruction, a monomorphic type of is better to be selected, to avoid the effect of the Mg/Ca differences between morphotypes on the reconstruction of SSTs. If mixed morphotypes must be used, the difference value (~1.0℃) between different morphotypes should be considered.
Table
1.
Mean values of the Mg/Ca ratios (mmol·mol−1) of G. ruber s.s., G. ruber s.l., T. sacculifer (w), and T. sacculifer (w/o) based on geochemical measurements using Core MD06-3047B with outcomes obtained by performing Welch’s t test at a p < 0.05 significance level.
Mg/Ca
T/℃
Mg/Ca
T/℃
G. ruber s.s.
3.72
25.29
T. sacculifer (w/o)
3.17
23.64
G. ruber s.l.
3.40
24.28
T. sacculifer (w)
3.20
23.53
H
Ha
Ha
H
H0
H0
Note: H = H0 implies the null hypothesis cannot be rejected; H = Ha implies the null hypothesis can be rejected.
Additionally, the Mg/Ca ratios of T. sacculifer (w) and T. sacculifer (w/o) at MD06-3047B and the estimated water temperatures showed relatively small differences. The Δ(Mg/Ca)T.sacculifer w/o−w value is only ~0.03 mmol/mol on average, less than the reproducibility of Mg/Ca measurements (±0.07 mmol/mol). Further, Welch’s test also showed that the Mg/Ca ratios of T. sacculifer (w) and T. sacculifer (w/o) and the estimated temperatures are not significantly different (H = H0) (Table 1). However, the Δ(Mg/Ca)T.sacculifer w/o−w show staged variation, and the Δ(Mg/Ca)T.sacculifer w/o−w values are also greater than the reproducibility of the Mg/Ca measurements (±0.07 mmol/mol) within different periods. This possibly indicates that there are significant differences in the Mg/Ca ratios of T. sacculifer (w) and T. sacculifer (w/o) during different geological periods. Thus, when reconstructing water temperature using the Mg/Ca ratios of T. sacculifer in the WPS, it is better to use data based on a monomorphic type of T. sacculifer if the sedimentary records span over glacial-interglacial stages.
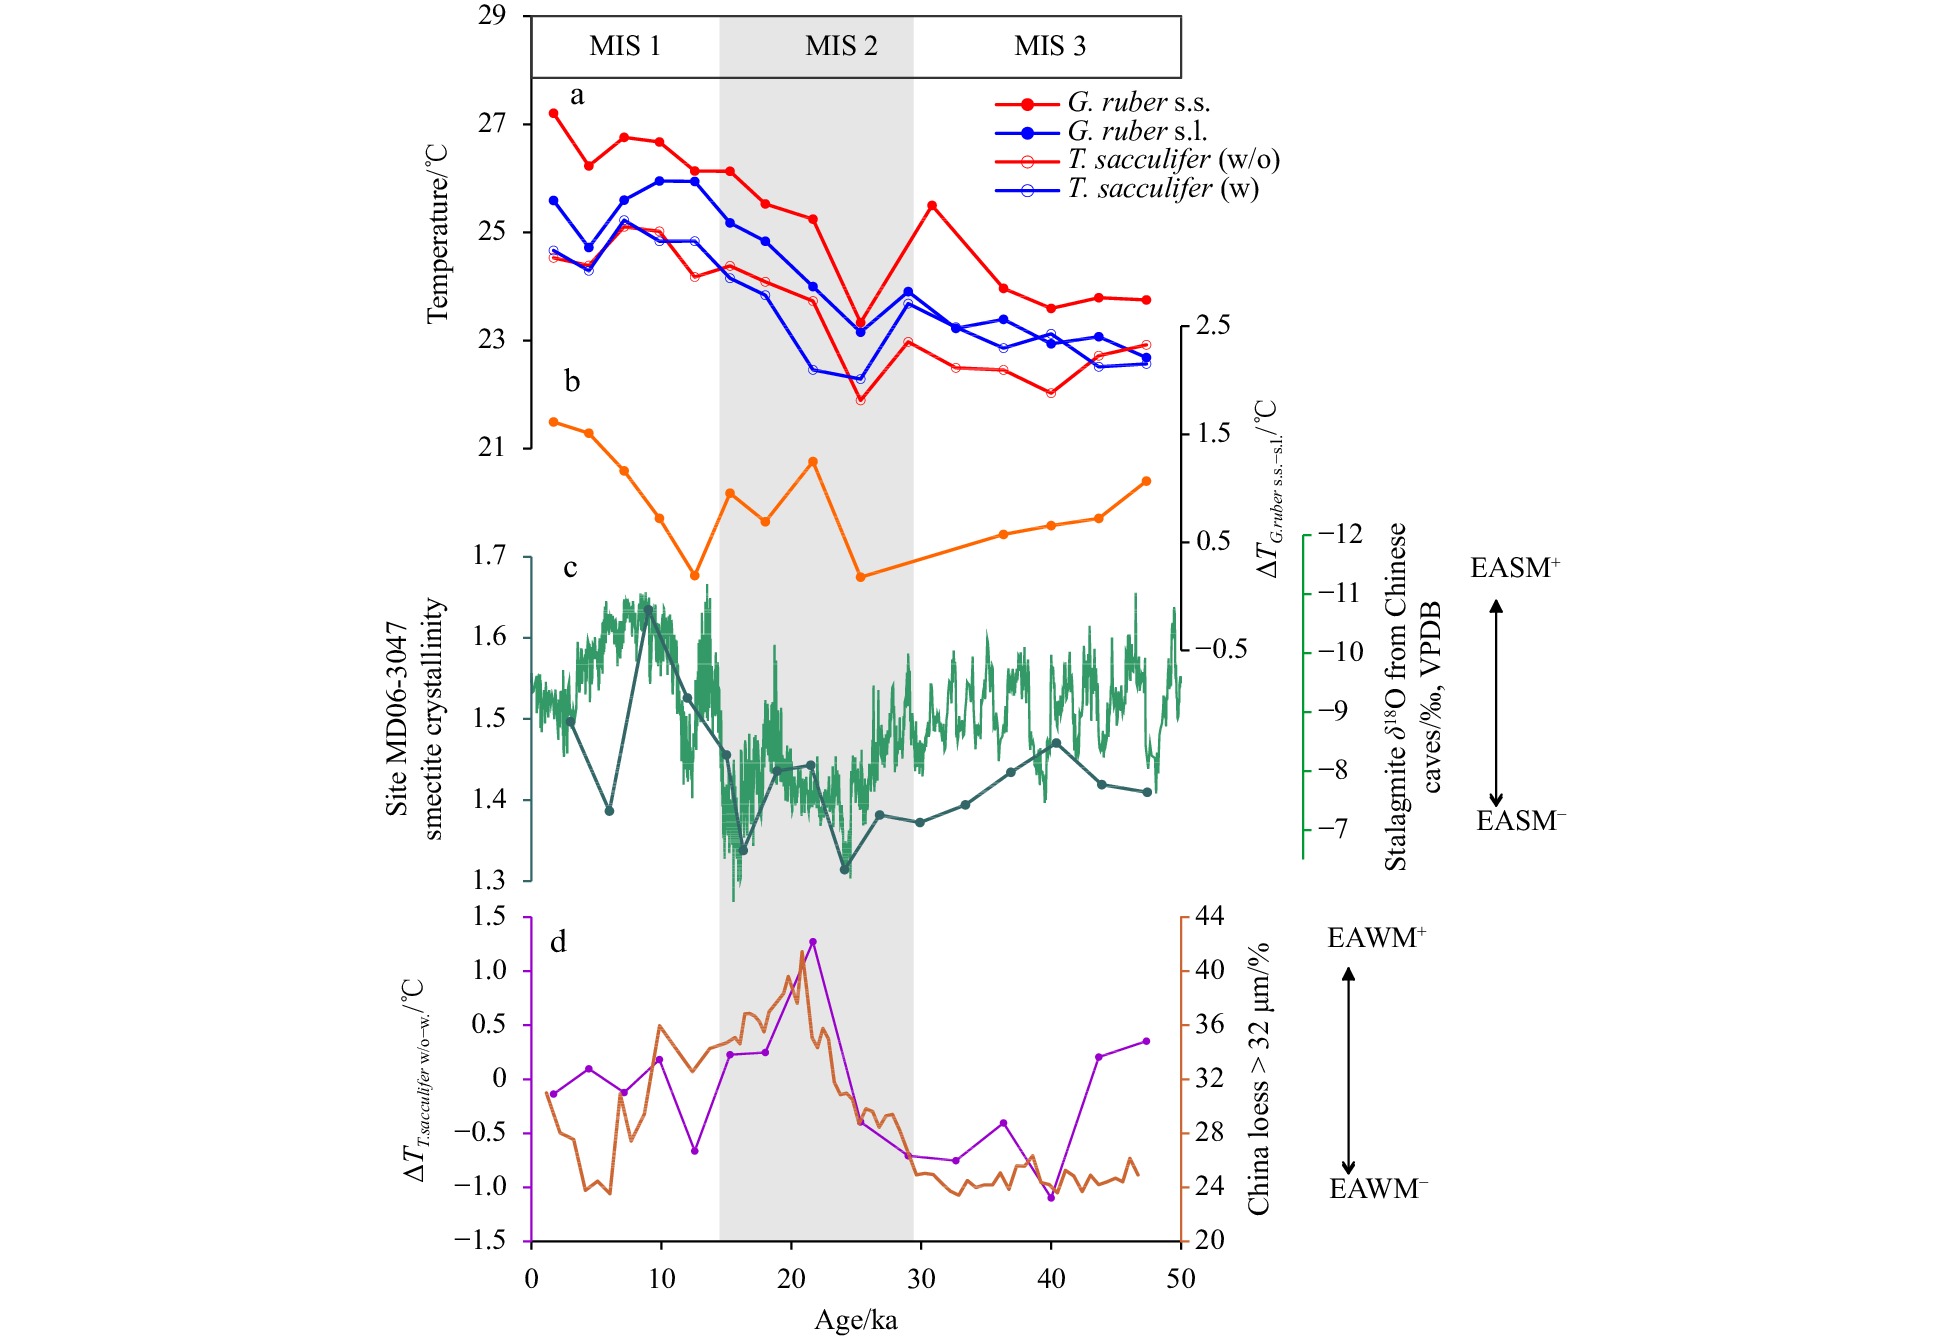
A question is, “what causes the staged variation of Δ(Mg/Ca)T.sacculifer w/o-w.?”. In a previous study, it was observed that the abundance of the T. sacculifer (w) morphotype increases with increasing temperature compared with that of T. sacculifer (w/o) (André et al., 2013), possibly indicating a higher calcification temperature of T. sacculifer (w) than that of T. sacculifer (w/o). However, this feature cannot explain the step-wise negative/positive variations in the Δ(Mg/Ca)T.sacculifer w/o−w of MD06-3047B. Modern research indicated that there are little or no genetic differences between T. sacculifer morphotypes, and the development of the sac-like final chamber is just considered as a phenotype (André et al., 2013; Darling and Wade, 2008). However, based on fossil records, the two morphotypes have different ecological preferences (Spezzaferri et al., 2015). Thus, it seemed more complicated when the habitats of the different T. sacculifer morphotypes through geological time were considered. According to δ18O and Mg/Ca records of the two morphotypes from Anand et al. (2003), the calcification depth of T. sacculifer (w/o) seems shallower (deeper) than T. sacculifer (w) during winter (summer), which may be due to the different sensitivity of the two morphotypes to seasonal variation. Thus, we speculate that the staged negative/positive variations of ΔTT.sacculifer w/o−w since ~47 ka might be associated with alternate stronger winter/summer monsoons (Fig. 5; Cheng et al., 2016; Guo et al., 2009). That is higher (lower) ΔTT.sacculifer w/o−w corresponds to stronger (weaker) East Asian winter monsoon (EAWM) and weaker (stronger) East Asian summer monsoon (EASM) (Figs 5a, c and d). This seems conflict with the modern observation that deeper mixed layer depth and smaller vertical thermal gradient are developed during winter than summer around our study area (Locarnini et al., 2013). Thus, the relationship between ΔTT.sacculifer w/o−w and upper-ocean structure might be more complicated, that needs to be fully examined by further studies on core-top sediment, sediment trap and/or culture experiments.
Figure
5.
Estimated water temperatures based on the Mg/Ca ratios of G. ruber s.s., G. ruber s.l., T. sacculifer (w), and T. sacculifer (w/o) (a). Differences in estimated temperatures based on the Mg/Ca ratios of G. ruber s.s. and G. ruber s.l. (b). Smectite crystallinity values of Core MD06-3047 (Xu et al., 2012) and the speleothem δ18O records from caves in China (Cheng et al., 2016) (c). Differences in estimated temperatures based on the Mg/Ca ratios of T. sacculifer (w/o) and T. sacculifer (w), and loess grain-size changes (content of the >32 μm fraction) from Xifeng Section, Loess Plateau of China (Guo et al., 2009). EASM and EAWM means East Asian summer and winter monsoons, respectively."+" means stronger monsoon, "-" means weaker monsoon.
4.2
Factors affecting regional differences of ΔMg/CaG.ruber s.s.−s.l.values
Considering that G. ruber predominantly inhabits in the mixed layer, we assumed that the regional distribution of core-top Δ(Mg/Ca)G.ruber s.s.−s.l. could be attributed to variability in the MLD of the upper-ocean. Accordingly, the core-top Δ(Mg/Ca)G.ruber s.s.−s.l. from the western tropical Pacific are compared with the annual mean MLD and the seasonal difference of MLD between winter and summer at these sites (Fig. 4b and c). As shown in Fig. 4b, no correlation is observed between the core-top Δ(Mg/Ca)G.ruber s.s.−s.l. and the annual mean MLD (R2 = 0.00004), indicating little influence of annual mean MLD on the Δ(Mg/Ca)G.ruber s.s.−s.l.. We also observed a negative relationship between the core-top Δ(Mg/Ca)G.ruber s.s.−s.l. and the difference between MLD in winter and summer (R2 = 0.269), possibly suggesting a certain role played by the seasonal fluctuation of MLD on the Δ(Mg/Ca)G.ruber s.s.−s.l. values. For further analysis, we plotted the core-top Δ(Mg/Ca)G.ruber s.s.−s.l. against the winter and summer MLD (Figs 4d and e), from which it can be observed that the Δ(Mg/Ca)G.ruber s.s.−s.l. are more significantly correlated with summer MLD (R2 = 0.523) than winter MLD (R2 = 0.001). This observation implies that changes in summer MLD may be the major factor for the Δ(Mg/Ca)G.ruber s.s.−s.l. over the western tropical Pacific.
The negative relationship between the core-top Δ(Mg/Ca)G.ruber s.s.−s.l. and summer MLD indicates that larger Δ(Mg/Ca)G.ruber s.s.−s.l. might be related to a shallower summer MLD. Although there is evidence that G. ruber can generally reflect annual surface water conditions (Dekens et al., 2002; Lea et al., 2000), a plankton tow study indicates high abundance of G. ruber (white) in the warm summer surface waters of the western tropical Pacific (Troelstra and Kroon, 1989). Additionally, the two morphotypes of G. ruber (G. ruber s.s. and G. ruber s.l.) show different vertical distributions (Kuroyanagi and Kawahata, 2004), as G. ruber s.s. is consistently calcified in warmer waters to a greater degree than G. ruber s.l., due to the shallower habitat depth or a more summer-weighted seasonal distribution of G. ruber s.s (Antonarakou et al., 2015). It has also been reported that in the South China Sea, G. ruber s.s. is predominant in summer and in shallower water layers (0–40 m), while G. ruber s.l. predominant in deeper water layers (40–60 m) (Zhang et al., 2020). Thus, we could speculate that the summer-weighted seasonal distribution and different vertical distributions of G. ruber morphotypes can lead to relatively strong negative correlation between Δ(Mg/Ca)G.ruber s.s.−s.l. and summer MLD in the western tropical Pacific. This relationship lends strong support to propose that Δ(Mg/Ca)G.ruber s.s.−s.l. and the corresponding differences in Mg/Ca-based temperatures between G. ruber s.s. and G. ruber s.l. (ΔTG.ruber s.s.−s.l.) are indicators of changes in summer mixed-layer depth.
To verify whether Δ(Mg/Ca)G.ruber s.s.−s.l. and ΔTG.ruber s.s.−s.l. records can reflect summer MLD in geological history, we compared the ΔTG.ruber s.s.−s.l. records from Core MD06-3047B since 47 ka with records reflecting changes in EASM, including the smectite crystallinity values from Site MD06-3047 (Xu et al., 2012) and the speleothem δ18O records from caves in China (Cheng et al., 2016). As shown in Fig. 5, the ΔTG.ruber s.s.−s.l. records show overall covariance with EASM, with higher values corresponding to a stronger EASM. In the WPS, a stronger EASM can lead to a shallower summer MLD (Hao et al., 2012; Qu, 2003; Tozuka et al., 2002), as in the boreal summer, the prevailing westly/southwesterly wind may produce a positive wind stress curl that results in Ekman divergence and upwelling in the study area (Xiong et al., 2022). Thus, in the WPS, the significant difference between estimated temperatures based on downcore Mg/Ca ratios of G. ruber s.s. and G. ruber s.l. might be affected by EASM-driven summer MLD changes. This result provides further evidence for the potential of ΔTG.ruber s.s.−s.l. records to serve as indicators of changes in summer MLD at orbital timescale. The higher Δ(Mg/Ca)G.ruber s.s.−s.l. indicates shallower MLD and stronger EASM. More records of the MLD and summer monsoon in this area are needed for further validation.
5.
Conclusions
In this study, we present the Mg/Ca records of G. ruber s.s., G. ruber s.l., T. sacculifer (w), and T. sacculifer (w/o) in the upper 60 cm of Core MD06-3047B obtained from the WPS. Based on the results obtained, we arrived at the following conclusions:
(1) Since MIS 3, significant consistent differences exist in the Mg/Ca ratios and the estimated temperatures between the morphotypes of G. ruber from Site MD06-3047B; while staged changes in the differences of Mg/Ca ratios are observed between the morphotypes of T. sacculifer. We suggest that when reconstructing SST changes using the Mg/Ca ratios of G. ruber and T. sacculifer in the WPS, it should be better to select one single morphotype.
(2) Systematic patterns are observed in the core-top Δ(Mg/Ca)G.ruber s.s.−s.l. across the western tropical Pacific, which show negative correlation with summer MLD. Combining with the covariance between downcore ΔTG.ruber s.s.−s.l. records of Core MD06-3047B and summer monsoon changes, we propose that Δ(Mg/Ca)G.ruber s.s.−s.l. may serve as a potential indicator of summer MLD changes.
Acknowledgements:
We thank the chief scientist Carlo Laj, the captain and the crew of R/V Marion Dufresne, and the French Polar Institute for their efforts and support during the IMAGES XIV-MD155-Marco Polo 2 cruise.
Anand P, Elderfield H, Conte M H. 2003. Calibration of Mg/Ca thermometry in planktonic foraminifera from a sediment trap time series. Paleoceanography, 18(2): 1050. doi: 10.1029/2002PA000846
André A, Weiner A, Quillévéré F, et al. 2013. The cryptic and the apparent reversed: lack of genetic differentiation within the morphologically diverse plexus of the planktonic foraminifer Globigerinoides sacculifer. Paleobiology, 39(1): 21–39. doi: 10.1666/0094-8373-39.1.21
Antonarakou A, Kontakiotis G, Mortyn P G, et al. 2015. Biotic and geochemical ( δ18O, δ13C, Mg/Ca, Ba/Ca) responses of Globigerinoides ruber morphotypes to upper water column variations during the last deglaciation, Gulf of Mexico. Geochimica et Cosmochimica Acta, 170: 69–93. doi: 10.1016/j.gca.2015.08.003
Barker S, Greaves M, Elderfield H. 2003. A study of cleaning procedures used for foraminiferal Mg/Ca paleothermometry. Geochemistry, Geophysics, Geosystems, 4(9): 8407.
Bijma J, Hemleben C. 1994. Population dynamics of the planktic foraminifer Globigerinoides sacculifer (Brady) from the central Red Sea. Deep-Sea Research Part I: Oceanographic Research Papers, 41(3): 485–510. doi: 10.1016/0967-0637(94)90092-2
Cheng Hai, Edwards R L, Sinha A, et al. 2016. The Asian monsoon over the past 640, 000 years and ice age terminations. Nature, 534(7609): 640–646. doi: 10.1038/nature18591
Chowdhury K R, Haque M, Nasreen N, et al. 2003. Distribution of planktonic foraminifera in the northern Bay of Bengal. Sedimentary Geology, 155(3–4): 393–405. doi: 10.1016/S0037-0738(02)00189-6
Dang Haowen, Jian Zhimin, Bassinot F, et al. 2012. Decoupled Holocene variability in surface and thermocline water temperatures of the Indo-Pacific Warm Pool. Geophysical Research Letters, 39(1): L01701. doi: 10.1029/2011GL050154
Darling K F, Wade C M. 2008. The genetic diversity of planktic foraminifera and the global distribution of ribosomal RNA genotypes. Marine Micropaleontology, 67(3–4): 216–238. doi: 10.1016/j.marmicro.2008.01.009
Dekens P S, Lea D W, Pak D K, et al. 2002. Core top calibration of Mg/Ca in tropical foraminifera: Refining paleotemperature estimation. Geochemistry, Geophysics, Geosystems, 3(4): 1–29
Elderfield H, Vautravers M, Cooper M. 2002. The relationship between shell size and Mg/Ca, Sr/Ca, δ18O, and δ13C of species of planktonic foraminifera. Geochemistry, Geophysics, Geosystems, 3(8): 1–13
Guo Zhengtang, Berger A, Yin Qiuzhen, et al. 2009. Strong asymmetry of hemispheric climates during MIS-13 inferred from correlating China loess and Antarctica ice records. Climate of the Past, 5(1): 21–31. doi: 10.5194/cp-5-21-2009
Gussone N, Eisenhauer A, Tiedemann R, et al. 2004. Reconstruction of Caribbean Sea surface temperature and salinity fluctuations in response to the Pliocene closure of the Central American Gateway and radiative forcing, using δ44/40Ca, δ18O and Mg/Ca ratios. Earth and Planetary Science Letters, 227(3–4): 201–214. doi: 10.1016/j.jpgl.2004.09.004
Hao Jiajia, Chen Yongli, Wang Fan, et al. 2012. Seasonal thermocline in the China Seas and northwestern Pacific Ocean. Journal of Geophysical Research: Oceans, 117(C2): C02022. doi: 10.1029/2011JC007246
Hilde T W C, Lee Chao-Shing. 1984. Origin and evolution of the West Philippine Basin: a new interpretation. Tectonophysics, 102(1–4): 85–104. doi: 10.1016/0040-1951(84)90009-X
Hollstein M, Mohtadi M, Rosenthal Y, et al. 2017. Stable oxygen isotopes and Mg/Ca in planktic foraminifera from modern surface sediments of the western Pacific Warm Pool: implications for thermocline reconstructions. Paleoceanography, 32(11): 1174–1194. doi: 10.1002/2017PA003122
Jayan A K, Sijinkumar A V, Nath B N. 2021. Paleoceanographic significance of Globigerinoides ruber (white) morphotypes from the Andaman Sea. Marine Micropaleontology, 165: 101996. doi: 10.1016/j.marmicro.2021.101996
Jia Qi, Li Tiegang, Xiong Zhifang, et al. 2018. Hydrological variability in the western tropical Pacific over the past 700 kyr and its linkage to northern Hemisphere climatic change. Palaeogeography, Palaeoclimatology, Palaeoecology, 493: 44–54
Kawahata H. 2005. Stable isotopic composition of two morphotypes of Globigerinoides ruber (white) in the subtropical gyre in the North Pacific. Paleontological Research, 9(1): 27–35. doi: 10.2517/prpsj.9.27
Koutavas A, Joanides S. 2012. El Niño-southern Oscillation extrema in the Holocene and Last Glacial Maximum. Paleoceanography, 27(4): PA4208. doi: 10.1029/2012pa002378
Kuroyanagi A, Kawahata H. 2004. Vertical distribution of living planktonic foraminifera in the seas around Japan. Marine Micropaleontology, 53(1–2): 173–196. doi: 10.1016/j.marmicro.2004.06.001
Lea D W, Pak D K, Spero H J. 2000. Climate impact of late quaternary equatorial pacific sea surface temperature variations. Science, 289(5485): 1719–1724. doi: 10.1126/science.289.5485.1719
Locarnini R A, Mishonov A V, Antonov J I, et al. 2013. World Ocean Atlas 2013. Volume 1, Temperature. Silver Spring, Maryland: National Oceanic and Atmospheric Administration, 40
Lynch-Stieglitz J, Polissar P J, Jacobel A W, et al. 2015. Glacial-interglacial changes in central tropical Pacific surface seawater property gradients. Paleoceanography, 30(5): 423–438. doi: 10.1002/2014PA002746
Medina-Elizalde M, Lea D W. 2005. The mid-Pleistocene transition in the tropical Pacific. Science, 310(5750): 1009–1012. doi: 10.1126/science.1115933
Mohtadi M, Prange M, Oppo D W, et al. 2014. North Atlantic forcing of tropical Indian Ocean climate. Nature, 509(7498): 76–80. doi: 10.1038/nature13196
Mohtadi M, Steinke S, Groeneveld J, et al. 2009. Low-latitude control on seasonal and interannual changes in planktonic foraminiferal flux and shell geochemistry off South Java: a sediment trap study. Paleoceanography, 24(1): PA1201. doi: 10.1029/2008pa001636
Mohtadi M, Steinke S, Lückge A, et al. 2010. Glacial to Holocene surface hydrography of the tropical eastern Indian Ocean. Earth and Planetary Science Letters, 292(1–2): 89–97. doi: 10.1016/j.jpgl.2010.01.024
Monterey G I, Levitus S. 1997. Seasonal variability of mixed layer depth for the world ocean. Washington: U. S. Dept. of Commerce, National Oceanic and Atmospheric Administration, National Environmental Satellite, Data, and Information Service, 96
Qu Tangdong. 2003. Mixed layer heat balance in the western North Pacific. Journal of Geophysical Research: Oceans, 108(C7): 3242. doi: 10.1029/2002jc001536
Regoli F, de Garidel-Thoron T, Tachikawa K, et al. 2015. Progressive shoaling of the equatorial Pacific thermocline over the last eight glacial periods. Paleoceanography, 30(5): 439–455. doi: 10.1002/2014PA002696
Rippert N, Nürnberg D, Raddatz J, et al. 2016. Constraining foraminiferal calcification depths in the western Pacific warm pool. Marine Micropaleontology, 128: 14–27. doi: 10.1016/j.marmicro.2016.08.004
Sagawa T, Yokoyama Y, Ikehara M, et al. 2012. Shoaling of the western equatorial Pacific thermocline during the last glacial maximum inferred from multispecies temperature reconstruction of planktonic foraminifera. Palaeogeography, Palaeoclimatology, Palaeoecology, 346–347: 120–129
Setiawan R Y, Mohtadi M, Southon J, et al. 2015. The consequences of opening the Sunda Strait on the hydrography of the eastern tropical Indian Ocean. Paleoceanography, 30(10): 1358–1372. doi: 10.1002/2015PA002802
Sijinkumar A V, Nath B N, Guptha M V S. 2010. Late Quaternary record of pteropod preservation from the Andaman Sea. Marine Geology, 275(1–4): 221–229. doi: 10.1016/j.margeo.2010.06.003
Spezzaferri S, Kucera M, Pearson P N, et al. 2015. Fossil and genetic evidence for the polyphyletic nature of the planktonic foraminifera “ Globigerinoides”, and description of the new genus Trilobatus. PLoS One, 10(5): e0128108. doi: 10.1371/journal.pone.0128108
Steinke S, Chiu Han-Yi, Yu Paisen, et al. 2005. Mg/Ca ratios of two Globigerinoides ruber (white) morphotypes: implications for reconstructing past tropical/subtropical surface water conditions. Geochemistry, Geophysics, Geosystems, 6(11): Q11005.
Steinke S, Kienast M, Groeneveld J, et al. 2008. Proxy dependence of the temporal pattern of deglacial warming in the tropical South China Sea: toward resolving seasonality. Quaternary Science Reviews, 27(7–8): 688–700. doi: 10.1016/j.quascirev.2007.12.003
Stott L, Poulsen C, Lund S, et al. 2002. Super ENSO and global climate oscillations at millennial time scales. Science, 297(5579): 222–226. doi: 10.1126/science.1071627
Tachikawa K, Timmermann A, Vidal L, et al. 2014. CO2 radiative forcing and intertropical convergence zone influences on western Pacific warm pool climate over the past 400 ka. Quaternary Science Reviews, 86: 24–34. doi: 10.1016/j.quascirev.2013.12.018
Tozuka T, Kagimoto T, Masumoto Y, et al. 2002. Simulated multiscale variations in the western Tropical Pacific: the mindanao dome revisited. Journal of Physical Oceanography, 32(5): 1338–1359. doi: 10.1175/1520-0485(2002)032<1338:SMVITW>2.0.CO;2
Troelstra S R, Kroon D. 1989. Note on extant planktonic foraminifera from the Banda Sea, Indonesia (Snellius-II Expedition, cruise G5). Netherlands Journal of Sea Research, 24(4): 459–463. doi: 10.1016/0077-7579(89)90123-3
Wang Luejiang. 2000. Isotopic signals in two morphotypes of Globigerinoides ruber (white) from the South China Sea: implications for monsoon climate change during the last glacial cycle. Palaeogeography, Palaeoclimatology, Palaeoecology, 161(3–4): 381–394
Xiong Zhifang, Li Tiegang, Hönisch B, et al. 2022. Monsoon-and ENSO-driven surface-water pCO2 variation in the tropical West Pacific since the Last Glacial Maximum. Quaternary Science Reviews, 289: 107621. doi: 10.1016/j.quascirev.2022.107621
Xu Zhaokai, Li Tiegang, Wan Shiming, et al. 2012. Evolution of East Asian monsoon: clay mineral evidence in the western Philippine Sea over the past 700 kyr. Journal of Asian Earth Sciences, 60: 188–196. doi: 10.1016/j.jseaes.2012.08.018
Zhang Yanan, Xiang Rong, Tang Linggang, et al. 2020. Vertical distribution of planktonic foraminifera in the southern South China Sea in the summer, 2007. Quaternary Sciences (in Chinese), 40(3): 791–800
Table
1.
Mean values of the Mg/Ca ratios (mmol·mol−1) of G. ruber s.s., G. ruber s.l., T. sacculifer (w), and T. sacculifer (w/o) based on geochemical measurements using Core MD06-3047B with outcomes obtained by performing Welch’s t test at a p < 0.05 significance level.
Mg/Ca
T/℃
Mg/Ca
T/℃
G. ruber s.s.
3.72
25.29
T. sacculifer (w/o)
3.17
23.64
G. ruber s.l.
3.40
24.28
T. sacculifer (w)
3.20
23.53
H
Ha
Ha
H
H0
H0
Note: H = H0 implies the null hypothesis cannot be rejected; H = Ha implies the null hypothesis can be rejected.
Figure 1. Scanning electron micrographs of G. ruber (white) and T. sacculifer morphotypes: G. ruber sensu stricto (s.s.) (a), G. ruber sensu lato (s.l.) (b), T. sacculifer (with a sac-like final chamber) (c), and T. sacculifer (without a sac-like final chamber) (d). The foraminferal shells are from core-top sample of Core MD06-3047B. Scale bars (500 μm) are indicated on each image.
Figure 2. Fe/Ca (left), Al/Ca (middle) and Mn/Ca (right) versus Mg/Ca of the G. ruber (white) and T. sacculifer. There is no obvious correlation between these records, indicating negligible influence of contamination on Mg/Ca ratios.
Figure 3. Mg/Ca ratios (a, b), and Mg/Ca-based temperature (c, d) estimates (based on the multispecies equation from Anand et al. (2003)) of G. ruber s.s., G. ruber s.l., T. sacculifer (w), and T. sacculifer (w/o) of Core MD06-3047B , and the differences between these records for each species.
Figure 4. Comparison of Δ(Mg/Ca)G.ruber s.s.−s.l. from core-top sediment samples and the mixed-layer depth (MLD) in the western tropical Pacific. a. Location map showing the sites of the core-top Δ(Mg/Ca)G.ruber s.s.−s.l.. The red dots represent positive Δ(Mg/Ca)G.ruber s.s.−s.l. values, while the white dots indicate negative Δ(Mg/Ca)G.ruber s.s.−s.l. values. The sizes of the symbols denote the magnitude of the absolute values of the Δ(Mg/Ca)G.ruber s.s.−s.l. records. b–e. Plots of Δ(Mg/Ca)G.ruber s.s.−s.l. vs. average annual MLD (b), difference between winter and summer MLD (c), summer MLD (d), and winter MLD (e). Data of the South China Sea and WPS are obtained from Steinke et al. (2005), those in the Gulf of Papua and offshore Papua New Guinea from Hollstein et al. (2017) and Tachikawa et al. (2014). Detailed information regarding the data sites is provided in Table S2. Data of the MLD are from Monterey and Levitus (1997).
Figure 5. Estimated water temperatures based on the Mg/Ca ratios of G. ruber s.s., G. ruber s.l., T. sacculifer (w), and T. sacculifer (w/o) (a). Differences in estimated temperatures based on the Mg/Ca ratios of G. ruber s.s. and G. ruber s.l. (b). Smectite crystallinity values of Core MD06-3047 (Xu et al., 2012) and the speleothem δ18O records from caves in China (Cheng et al., 2016) (c). Differences in estimated temperatures based on the Mg/Ca ratios of T. sacculifer (w/o) and T. sacculifer (w), and loess grain-size changes (content of the >32 μm fraction) from Xifeng Section, Loess Plateau of China (Guo et al., 2009). EASM and EAWM means East Asian summer and winter monsoons, respectively."+" means stronger monsoon, "-" means weaker monsoon.


 DownLoad:


 DownLoad:


 DownLoad: