Zixuan Li, Chao Xu, Minfang Zheng, Mengya Chen, Yusheng Qiu, Hantao Zhou, Min Chen, Run Zhang. Nitrate isotope dynamics in the lower euphotic-upper mesopelagic zones of the western South China Sea[J]. Acta Oceanologica Sinica, 2023, 42(1): 1-11. doi: 10.1007/s13131-022-2091-4
Citation:
Zixuan Li, Chao Xu, Minfang Zheng, Mengya Chen, Yusheng Qiu, Hantao Zhou, Min Chen, Run Zhang. Nitrate isotope dynamics in the lower euphotic-upper mesopelagic zones of the western South China Sea[J]. Acta Oceanologica Sinica, 2023, 42(1): 1-11. doi: 10.1007/s13131-022-2091-4
Zixuan Li, Chao Xu, Minfang Zheng, Mengya Chen, Yusheng Qiu, Hantao Zhou, Min Chen, Run Zhang. Nitrate isotope dynamics in the lower euphotic-upper mesopelagic zones of the western South China Sea[J]. Acta Oceanologica Sinica, 2023, 42(1): 1-11. doi: 10.1007/s13131-022-2091-4
Citation:
Zixuan Li, Chao Xu, Minfang Zheng, Mengya Chen, Yusheng Qiu, Hantao Zhou, Min Chen, Run Zhang. Nitrate isotope dynamics in the lower euphotic-upper mesopelagic zones of the western South China Sea[J]. Acta Oceanologica Sinica, 2023, 42(1): 1-11. doi: 10.1007/s13131-022-2091-4
College of Ocean and Earth Sciences, Xiamen University, Xiamen 361102, China
Funds:
The National Natural Science Foundation of China under contract Nos 42076042 and 41721005; the Science and Technology Basic Resources Investigation Program of China under contract No. 2017FY201403.
The dual isotopes (N and O) of nitrate were measured using a denitrifier bacterial method in the western South China Sea (WSCS) during September 2015 to elucidate key information during N transformation in the lower euphotic zone (LEZ)-upper mesopelagic zone (UMZ, down to 500 m in this study) continuum, which is a vital sub-environment for marine N cycle and sequestration of atmospheric CO2 as well. The N isotopic composition (δ15N) of nitrate generally decreased from 500 m toward the base of the euphotic zone (~100 m), reaching a value of ~4.6‰ (vs. air N2) at the base of the LEZ, suggesting the imprint of remineralization (nitrification) of isotopically light N from atmospheric source. The δ15N and δ18O of nitrate only generally conform to a 1:1 line at 50 m and 75 m, suggesting that nitrate assimilation is a dominant process to shape nitrate isotope signature in this light-limited and relatively N-replete lower part of the euphotic zone. The fractionation factors of N and O isotopes during nitrate fractionation (15εASSIM, 18εASSIM) using a steady-state model were estimated to be 4.0‰±0.3‰ and 5.4‰±0.3‰, respectively. The occurrence of nitrification at the base of the LEZ and most of the UMZ is corroborated by the decoupling of δ15N and the oxygen isotopic composition (δ18O) of nitrate. Our results will provide insights for better understanding N cycle in the South China Sea from a perspective of present and past.
The availability of nitrogen (N) nutrients in the surface ocean acts as an important control on primary production and the sequestration of atmospheric CO2 in the ocean (Sigman et al., 2010). In low latitude oligotrophic oceans, N is commonly a limiting factor for primary production in the euphotic zone due to limited input nitrate from subsurface under highly stratified condition of the upper water column (Moore et al., 2013). Besides, N2 fixation and atmospheric deposition also play a complementary role by providing new N for the ecosystem and thus contribute to the export of organic matter out of the euphotic zone (Karl et al., 1997). Post formation in the euphotic zone, a portion of the organic N, largely in the form of sinking particle N, will be exported downward undergo remineralization at intermediate depth and recycle back to nitrate pool (Kao et al., 2012).
For the stratified oligotrophic regimes, a layered structure of euphotic zones with respect to the rates of chemical scavenging and elemental transport may be a general and ubiquitous feature globally (Cai et al., 2008; Dore and Karl, 1996; Dore et al., 2008). It had been elucidated by 234Th:238U disequilibria that the oceanic stratified euphotic zone can separated into two layers, i.e., an upper oligotrophic zone (UEZ) contributing to majority of the primary production but low net export, and a lower eutrophic zone (LEZ) contributing less to primary production but has much more intense scavenging (Coale and Bruland, 1987). Indeed, the oligotrophic regions are featured by remineralization-intensive ecosystems where most of the organic matter there is recycled rapidly especially for the UEZ (Karl et al., 2021). Thus, the LEZ acts as the interface connecting the UEZ and the upper portion of the mesopelagic zone (UMZ), within which key microbial remineralization and nutrient recycling reactions occur with the degradation of sinking particulate organic material (Peters et al., 2018).
The LEZ-UMZ continuum is a key sub-environment for understanding N cycle in the ocean at least for the following reasons. First, in the UEZ dissolved inorganic N (DIN) is depleted, while in the LEZ there is usually a non-negligible concentration of unused nitrate left (like in the South China Sea (SCS)) (Zhang et al., 2020). Hence, any variability in N assimilation will have the potential to affect the net export of N and its isotopic composition (δ15N). Second, relative to UEZ, LEZ is much more influenced directly by nutrient injections from the bordering UMZ. Last but not least, LEZ is characterized by low ambient light intensity but elevated nitrate concentration, and a non-negligible fraction of primary production occurring in the LEZ of the oligotrophic regimes (e.g., ~20% at Station ALOHA in the North Pacific Subtropical Gyre; Karl et al., 2021). Considering that the index of carbon export efficiency, i.e., e-ratio (particulate carbon export at export interface/depth-integrated primary production), is typically low in oligotrophic oceanic regions (e.g., ~0.052 at Station ALOHA; Karl et al., 2021), most organic matter produced in the euphotic zone will have been remineralized before being exported out of the euphotic zone. Moreover, a large fraction of the organic matter exported will be remineralized back to nitrate in the UMZ and replenished the euphotic zone nutrient via physical mechanisms. Interestingly, a recent review compiling 30-a data at the Station ALOHA shows a sustained, unexpected increasing trend in chlorophyll a concentrations in LEZ (75−125 m) and suggests that the LEZ accounts for approximately one-half of the increase in euphotic zone primary production (Karl et al., 2021), implying that the LEZ in oligotrophic regions is highly sensitive to climatic/oceanic shift and plays a disproportionately important role in marine N biogeochemistry. Undoubtedly, the variability relevant to N dynamics in the LEZ-UMZ is in urgent need to be discovered, especially for those low-latitude oceanic regions with distinct characteristics relative to subtropical gyres.
Natural variations in the dual N and O isotopes of nitrate provide a powerful tool for tracing N cycle processes in the ocean (Sigman and Fripiat, 2019). Nitrate from the subsurface water is the source of fixed N for phytoplankton growth in euphotic zone. Phytoplankton preferentially take up isotopically lighter 14N- and 16O-bearing nitrate during nitrate assimilation, causing the residual nitrate pool to be relatively enriched in 15N and 18O (Casciotti et al., 2002; Sigman et al., 1999). The isotope effects of N and O isotopes during ${{\rm {NO}}_3^-} $ assimilation (15εASSIM and 18εASSIM, respectively) are a function of the ratio of the reaction rates (k) for the molecules containing the two isotopes:
where k is the first order rate constants for ${{\rm {NO}}_3^-} $ reduction (Mariotti et al., 1981). Field studies in the low-latitude oceanic regions had confirmed that nitrate assimilation by phytoplankton will elevate the δ15N and δ18O of nitrate, evidenced by an increase from the shallow subsurface into the euphotic zone as the concentration of nitrate decreases (Fawcett et al., 2015; Yang et al., 2018). Interestingly, the occurrence of nitrification (microbial oxidation of recycled ammonium to nitrite and then nitrate) in the euphotic zone (Yool et al., 2007), if any, will complicate the understanding of the nitrate isotope dynamics in the upper water column (Fawcett et al., 2015). Fortunately, dual measurements of the δ15N and δ18O allows us to separate processes (like nitrate assimilation and nitrification) that overprint due to the difference between the N and O isotopes of nitrate that undergo (Sigman et al., 2005). In brief, δ15N and δ18O of nitrate will be elevated in unison (1:1) during nitrate assimilation, while nitrification decouples the two isotope systems (Stephens et al., 2020). Thus, examining nitrate isotope dynamics will substantially improve our understanding of production regime (i.e., new vs. regenerated) in the upper ocean column.
The largest tropical/subtropical marginal sea of the western North Pacific Ocean, i.e., the SCS, is strongly influenced by the Asian monsoon, with southwesterly winds prevailing in summer (June−September) and northeasterly in winter (November−March) (Liu et al., 2010). The SCS provides an ideal site for examining N dynamics of the LEZ-UMZ from an isotopic perspective at least for the following reasons. First, the SCS generally has typical tropical/subtropical oligotrophic features with a shallow mixed layer (Liu et al., 2010). Nevertheless, the SCS also has environmental conditions that are distinct from other tropical and subtropical open ocean areas. The SCS is featured by upwelling and verting mixing on a seasonal basis, resulting in a relatively rapid nutrient supply/turnover (Bai et al., 2019; Yang et al., 2017). Second, the SCS is also an ecosystem characterized by intensive remineralization, with lower euphotic zone contributes relatively large part of the export production characterized of a two-layered euphotic zone as evidenced by the radionuclides 234Th/238U disequilibria (Cai et al., 2008). Last but not least, since the nitracline depth is typically much shallower than the base of euphotic zone (~100 m, 1% or 0.1% of photosynthetically active radiation (PAR) at surface; Shang et al., 2011), it is reasonable to propose that some magnitude of isotope fractionation may be occurring in the LEZ, thereafter exerting non-negligible influence on the isotopic signature of exported organic matter. Unfortunately, our understanding of nitrate isotope dynamics in the LEZ-UMZ of the SCS is quite insufficient to date. Few prior studies generally focused on nitrate δ15N in the SCS (Loick et al., 2007; Yang et al., 2017, 2018), while coupled nitrate δ18O data are much more lacking and are restricted to the continental shelf of the northern SCS (Chen et al., 2020; Lao et al., 2019). Moreover, reported data of isotope fractionation factor (either for 15N or 18O) during nitrate assimilation are scarce so far for the SCS open oceanic region euphotic zone to the best of our knowledge, hindering us from better understanding N isotope dynamics in the upper water column and possibly the interpretation and reconstruction of past N dynamic variability based on sedimentary record. Interestingly, prior study in the LEZ-UMZ of the North Atlantic (Sargasso Sea) had revealed a vertical decoupling of nitrate assimilation and nitrification based on dual isotopes (15N and 18O) of nitrate (Fawcett et al., 2015), implying that nitrate assimilation is a good proxy for export production in the Sargasso Sea. It thus calls for a close look at the N cycle of the SCS LEZ-UMZ from an isotopic perspective.
In the present study, we conducted sampling in the western SCS (WSCS), a hydrographically and biogeochemically dynamic region. A northeastward jet in the WSCS usually creates an environment somewhat more favorable for phytoplankton growth compared to the central or northern SCS during summertime (Liang et al., 2018; and references therein). We aim to (1) explore and obtain the nitrate isotope (δ15N and δ18O) distribution patterns in the LEZ-UMZ of the WSCS; (2) evaluate the isotope effect during nitrate assimilation in the LEZ; and (3) examine the link between major N cycling processes from an isotope perspective. This study will provide important implications not only for understanding the N biogeochemical cycle in the SCS both at present and past.
2.
Materials and methods
2.1
Field sampling
Samplings were conducted in the WSCS during September 2015 onboard the R/V Shiyan 3, covering a spatial range of 10°−15°N, 110°−114°E. Seawater samples were collected from fixed depth (5 m, 25 m, 50 m, 75 m, 100 m, 150 m, 200 m, 300 m, 500 m) using 12 L Niskin bottles attached to a Seabird SBE 911 Plus CTD rosette. All samples were filtered through Millipore polycarbonate filters (pore size, 0.2 μm) into 60 mL HDPE bottles, and then preserved at −20℃ for later analysis in land laboratory. Temperature and salinity were recorded in situ by the CTD sensors.
Figure
1.
Sampling locations in the western South China Sea. Arrows indicate mean sea surface geostrophic current during the period of the cruise (data source: Archiving, Validation and Interpretation of Satellite Oceanographic Data).
The concentration of nitrate+nitrite was determined by the chemiluminescence method (Braman and Hendrix, 1989). Briefly, nitrate+nitrite was reduced to nitric oxide in an acidic solution of vanadium (V3+, 95℃) for later analysis on a Teledyne chemiluminescence analyzer. The detection limit for nitrate+nitrite was 0.01 μmol/L, and the average precision based on replicate measurements was 3%.
2.3
Isotopic composition of nitrate+nitrite
A bacterial method was used to convert nitrate and nitrite to nitrous oxide (N2O) for later isotope analysis (Sigman et al., 2001). The bacterial strain Pseudomonas chlororaphis subsp. aureofaciens (ATCC 13985) that lacks N2O reductase enzyme is used. The N and oxygen (O) isotope of N2O was subsequently measured by a Thermo MAT 253 isotope ratio mass spectrometer coupled to a N2O extraction system. The international reference materials, IAEA-NO-3 and USGS-34 were used and run in parallel with samples. The N and O isotope compositions are expressed in δ notation (δ15N and δ18O):
where R is the isotope ratio (15N/14N concentration ratio for N, 18O/16O concentration ratio for O) of sample and standard. N2 in the air and the Vienna Standard Mean Ocean Water (VSMOW) are chosen as the standards for N and O isotope analysis, respectively. The standard deviation of the δ15N measurements on sample replicates averages less than 0.1‰.
3.
Results
3.1
Hydrological properties
The temperature-salinity diagram potential temperature vs. practical salinity in the WSCS is presented in Fig. 2. The surface water of our sampling stations has a characteristic of high temperature and low salinity, with the mean temperature of 29.67℃ and the mean salinity of 33.22. The vertical changes of temperature and salinity are consistent with other studies, with the subsurface water (σθ, 24.0−26.0 kg/m3) of high temperature and salinity, and intermediate water (σθ, 26.0−27.0 kg/m3) with low temperature and salinity, respectively. The temperature and salinity ranges for each water mass are from Li et al. (2018). Depth profiles of temperature, practical salinity and density anomaly were also shown (Fig. 2).
Figure
2.
Temperature-salinity diagram (a); depth profiles of temperature (b), practical salinity (c), and density anomaly (d) in the upper 500 m of the western South China Sea (during sampling period). Major water masses include the near-shore surface water (SW), the surface water of the SCS (SCSSW), the subsurface water (SSW), and the intermediate water (IW), respectively. The grey line in a is isopycnal. σ0: potential density. The colorful lines and shapes of the dots in the figure represent different sampling stations.
The vertical distributions of nitrate+nitrite concentration ([${\rm{NO}}_3^- $]+[${\rm{NO}}_2^- $]) in the WSCS during sampling period are shown in Fig. 3a. Nitrate and nitrite in the UEZ (~upper 50 m) is generally below detection limit (Fig. 3b). The nitracline (defined as the depth where the nitrate concentration is 0.1 μmol/L; Chen et al., 2008) generally occurs between 50 m and 75 m in sampling profiles. Nitrate+nitrite concentration increased drastically below the nitracline. At the depths of 75 m and 100 m, the average nitrate concentration reaches 7.1 μmol/L and 10.7 μmol/L, respectively. In the open waters of the SCS, the depth of the euphotic zone is ~100 m during summer (Shang et al., 2011). Thus, we here define the depth range from below 50 m through 100 m as the LEZ. The UEZ and LEZ adopted here roughly corresponds to the so-called “N depleted layer” and “N replete layer” (Du et al., 2017), respectively. In the upper portion of the UMZ, nitrate+nitrite concentration keeps elevating with depth and reach an average of ~32.6 μmol/L at 500 m.
Figure
3.
Depth profiles of nitrate+nitrite concentration (a, b), δ15N (c, d) and δ18O (e, f) in the upper 500 m and the upper 150 m, specifically. UEZ: upper oligotrophic zone; LEZ: lower euphotic zone. The colorful lines and shapes of the dots in the figure represent different sampling stations.
The δ15N for measured nitrate+nitrite samples (concentration>0.5 μmol/L) fell in a range of 4.0‰ and 6.9‰ (Figs 3c, d). A most prominent feature of the vertical distribution pattern of nitrate+nitrite δ15N is an evident shallow subsurface minimum, with values decreasing upward from ~6.0‰ at 500 m to ~4.6‰ at ~100 m. Above the shallow subsurface δ15N minimum layer, nitrate+nitrite δ15N increased toward the surface, reaching values as high as 6.9‰ for few measurable samples at 50 m.
3.4
The δ18O of nitrate+nitrite
Measured δ18O values for nitrate+nitrite ranged between 1.8‰ and 5.2‰ for the upper 500 m during sampling period (Figs 3e, f). Unlike δ15N of nitrate+nitrite, there did not appear an evident shallow subsurface minimum for δ18O. However, δ18O of nitrate+nitrite did decrease from 500 m to 100 m and increased upward thereafter as well. The relatively high values of δ15N and δ18O in the upper mesopelagic water may be attributed to the invasion of the North Pacific Ocean seawater which is typically high in δ15N and δ18O (Xu, 2021).
3.5
Δ(15-18)
The parameter Δ(15-18) had been raised to examine the deviation of N and O isotopes besides nitrate assimilation (Rafter et al., 2013; Sigman et al., 2005):
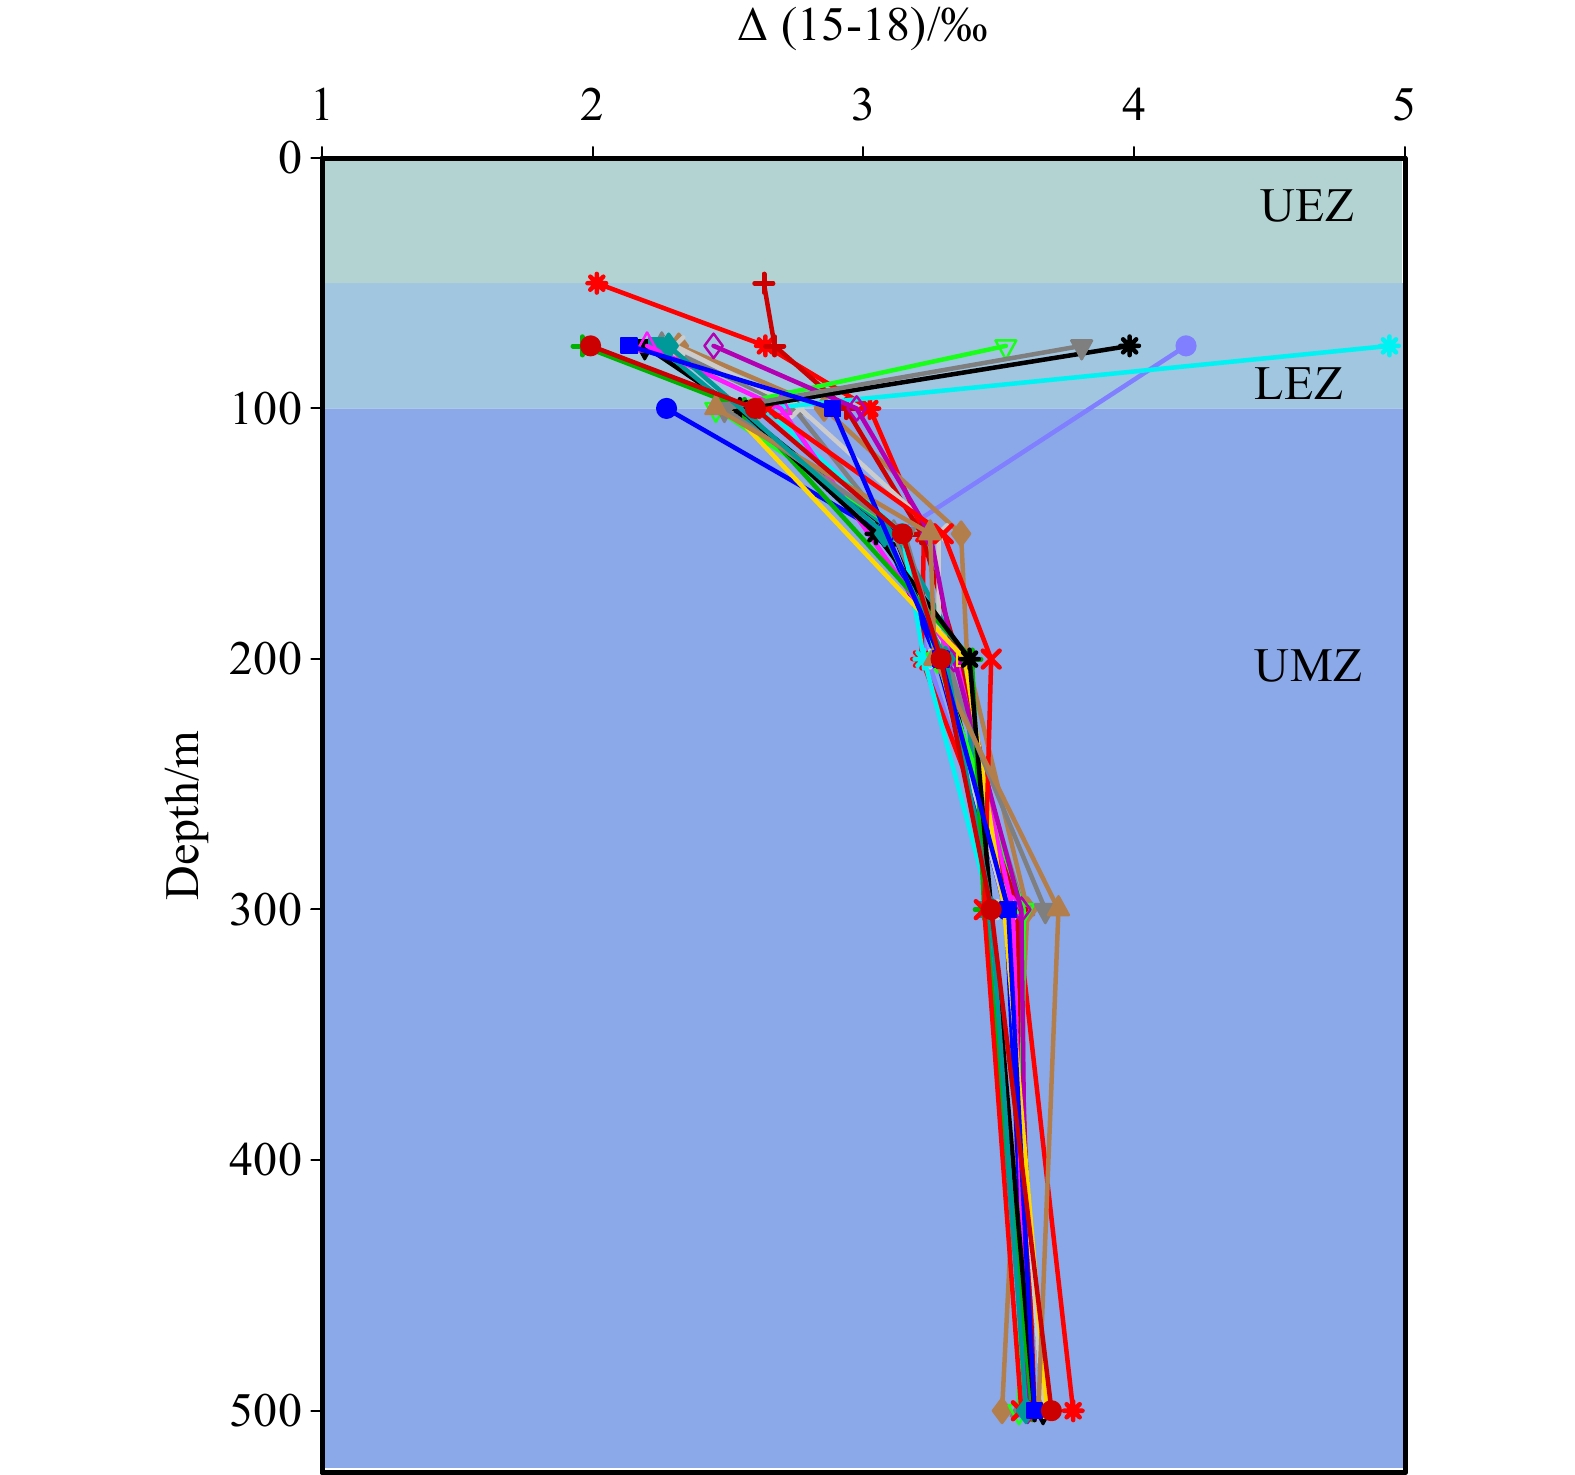
where ${\mathrm{\delta }}^{15}{\mathrm{N}}_{{\mathrm{N}\mathrm{O}}_{3}^-} $ and ${\mathrm{\delta }}^{18}{\mathrm{N}}_{{\mathrm{N}\mathrm{O}}_{3}^-} $ are the isotopic composition in a given sample and 15εASSIM:18εASSIM is the N-to-O isotope effect ratio during nitrate assimilation, which is assumed to be ~1 (Granger et al., 2010). Thus, Δ(15-18) is simplified to be the relative difference in nitrate δ15N and δ18O in this study as usual. For those samples at 50 m and 75 m, values of δ15N and δ18O had been corrected for nitrite. See Section 4.1 for details. The value of Δ(15-18) generally decreased upward from ~3.3‰ at 500 m to ~2.1‰ at 100 m, in accordance with the pattern of δ15N within this depth range (Fig. 4). Above 100 m, Δ(15-18) continued to increase upward for most stations, reaching values as low as ~1.3‰ for measurable sample.
Figure
4.
Depth profile of Δ(15-18) in the upper 500 m. For those samples at 50 m and 75 m, values of δ15N and δ18O had been corrected for nitrite. See Section 4.1 for details. UEZ: upper oligotrophic zone; LEZ: lower euphotic zone; UMZ: upper portion of mesopelagic zone. The colorful lines and shapes of the dots in the figure represent different sampling stations.
Although nitrite is typically in low concentrations for most portion of the tropical/subtropical oligotrophic oceanic regions, there is a ubiquitous accumulation of nitrite at the base of the euphotic zone, i.e., the primary nitrite maximum (PNM) layer (Chen et al., 2021; Zakem et al., 2018). The causes for PNM in oligotrophic oceanic regions generally remain unsolved (Chen et al., 2021; Zakem et al., 2018). Although the concentration of nitrite even at PNM (~75 m) did not exceed 0.2 μmol/L in the SCS in general (Chen et al., 2021; Wong et al., 2007), its impact on nitrate+nitrite isotope values should not simply be neglected. Interestingly, nitrite had been found to have distinct δ15N values from nitrate, possibly due to its active participation in complex biotic and abiotic processes in the ocean (Casciotti, 2016b; Chen et al., 2021; Kemeny et al., 2016). Therefore, to better examine the isotope dynamics of nitrate, it is necessary to deduct the isotope signal of nitrite especially for those samples (50−75 m, around the PNM layer) that may be isotopically imprinted to a large extent by the presence of nitrite. The concentration of nitrite is much lower while nitrate increases dramatically for samples at 100 m or below (Chen et al., 2021), and the isotopic values of nitrate+nitrite will mainly reflect the signature of nitrate only.
Nitrite in the SCS is in low concentrations even at the PNM layer (Chen et al., 2021; Wong et al., 2007), making it difficult to measure its isotopic composition directly. Nitrite in the Southern Ocean showed a wide range of δ values, and the enzyme-level interconversion of nitrate and nitrite had been attributed as the main cause (e.g., −58‰±52‰ for δ15N; Kemeny et al., 2016). In contrast, Chen et al. (2021) reported the first data set of nitrite isotope values at PNM in the SCS, showing a much narrower range (−4.2‰±0.6‰ for δ15N, 11.5‰±0.8‰ for δ18O, respectively) in the basin. For samples at 50 m and 75 m, which δ values (δ15N and δ18O) of nitrate only may be imprinted by nitrite notably, a simplified correction for nitrite is applied based on mass balance as following:
where the subscripts N+N and ${{\rm {NO}}_3^-} $ denote nitrate+nitrite and nitrate-only, respectively. Note that the constant 25% is adopted to compensate for the underestimation of ${\text{δ}}^{18}{\rm{O}}_{{\rm{NO}}_2^-}$ due to the chosen reference materials (IAEA-NO-3, USGS-34) in practice (Casciotti, 2016a). The concentration of nitrite ([${{\rm {NO}}_2^-} $]) was chosen at 0.2 μmol/L as per PNM values in the SCS (Chen et al., 2021; Wong et al., 2007). The δ15N and δ18O of nitrite is taken as −4.2‰ and 11.0‰, respectively (Chen et al., 2021). For δ18O, there is an additional constraint, i.e., the equilibrium fractionation between nitrite and ambient water (Buchwald and Casciotti, 2013). An empirical equation is adopted for such consideration (Buchwald and Casciotti, 2013):
where 18εep is the nitrite-water equilibrium isotope effect, T is the absolute temperature of the seawater, and $\delta^{18} {\rm{O}}_{{\rm{H}}_{2} {\rm{O}}} $ is the oxygen isotopic composition of the ambient seawater, respectively. A $\delta^{18} {\rm{O}}_{{\rm{H}}_{2} {\rm{O}}} $ value of 0.02‰ in the SCS surface layers (Wu et al., 2021) is adopted. The calculated δ18O of nitrite when only abiotic process (equilibrium fractionation with ambient seawater) exists is 13‰, somewhat higher than the values in situ (Chen et al., 2021), likely implying the influence of biological processes. In the Arabian Sea the measured δ18O of nitrite is relatively close to the equilibrium value (Buchwald and Casciotti, 2013). We propose that the value of $\delta^{18} {\rm{O}}_{{\rm{NO}}_{2}^-}$ variability generally has minor influence on δ18O of nitrate only. In general, the above correction for nitrite will result an elevation of ~0.6‰ for $\delta^{15} {\rm{N}}_{{\rm{NO}}_{3}^-}$ and ~1.0‰ for $\delta^{18} {\rm{O}}_{{\rm{NO}}_{3}^-}$, respectively.
4.2
The occurrence of nitrification inferred from N and O isotope decoupling
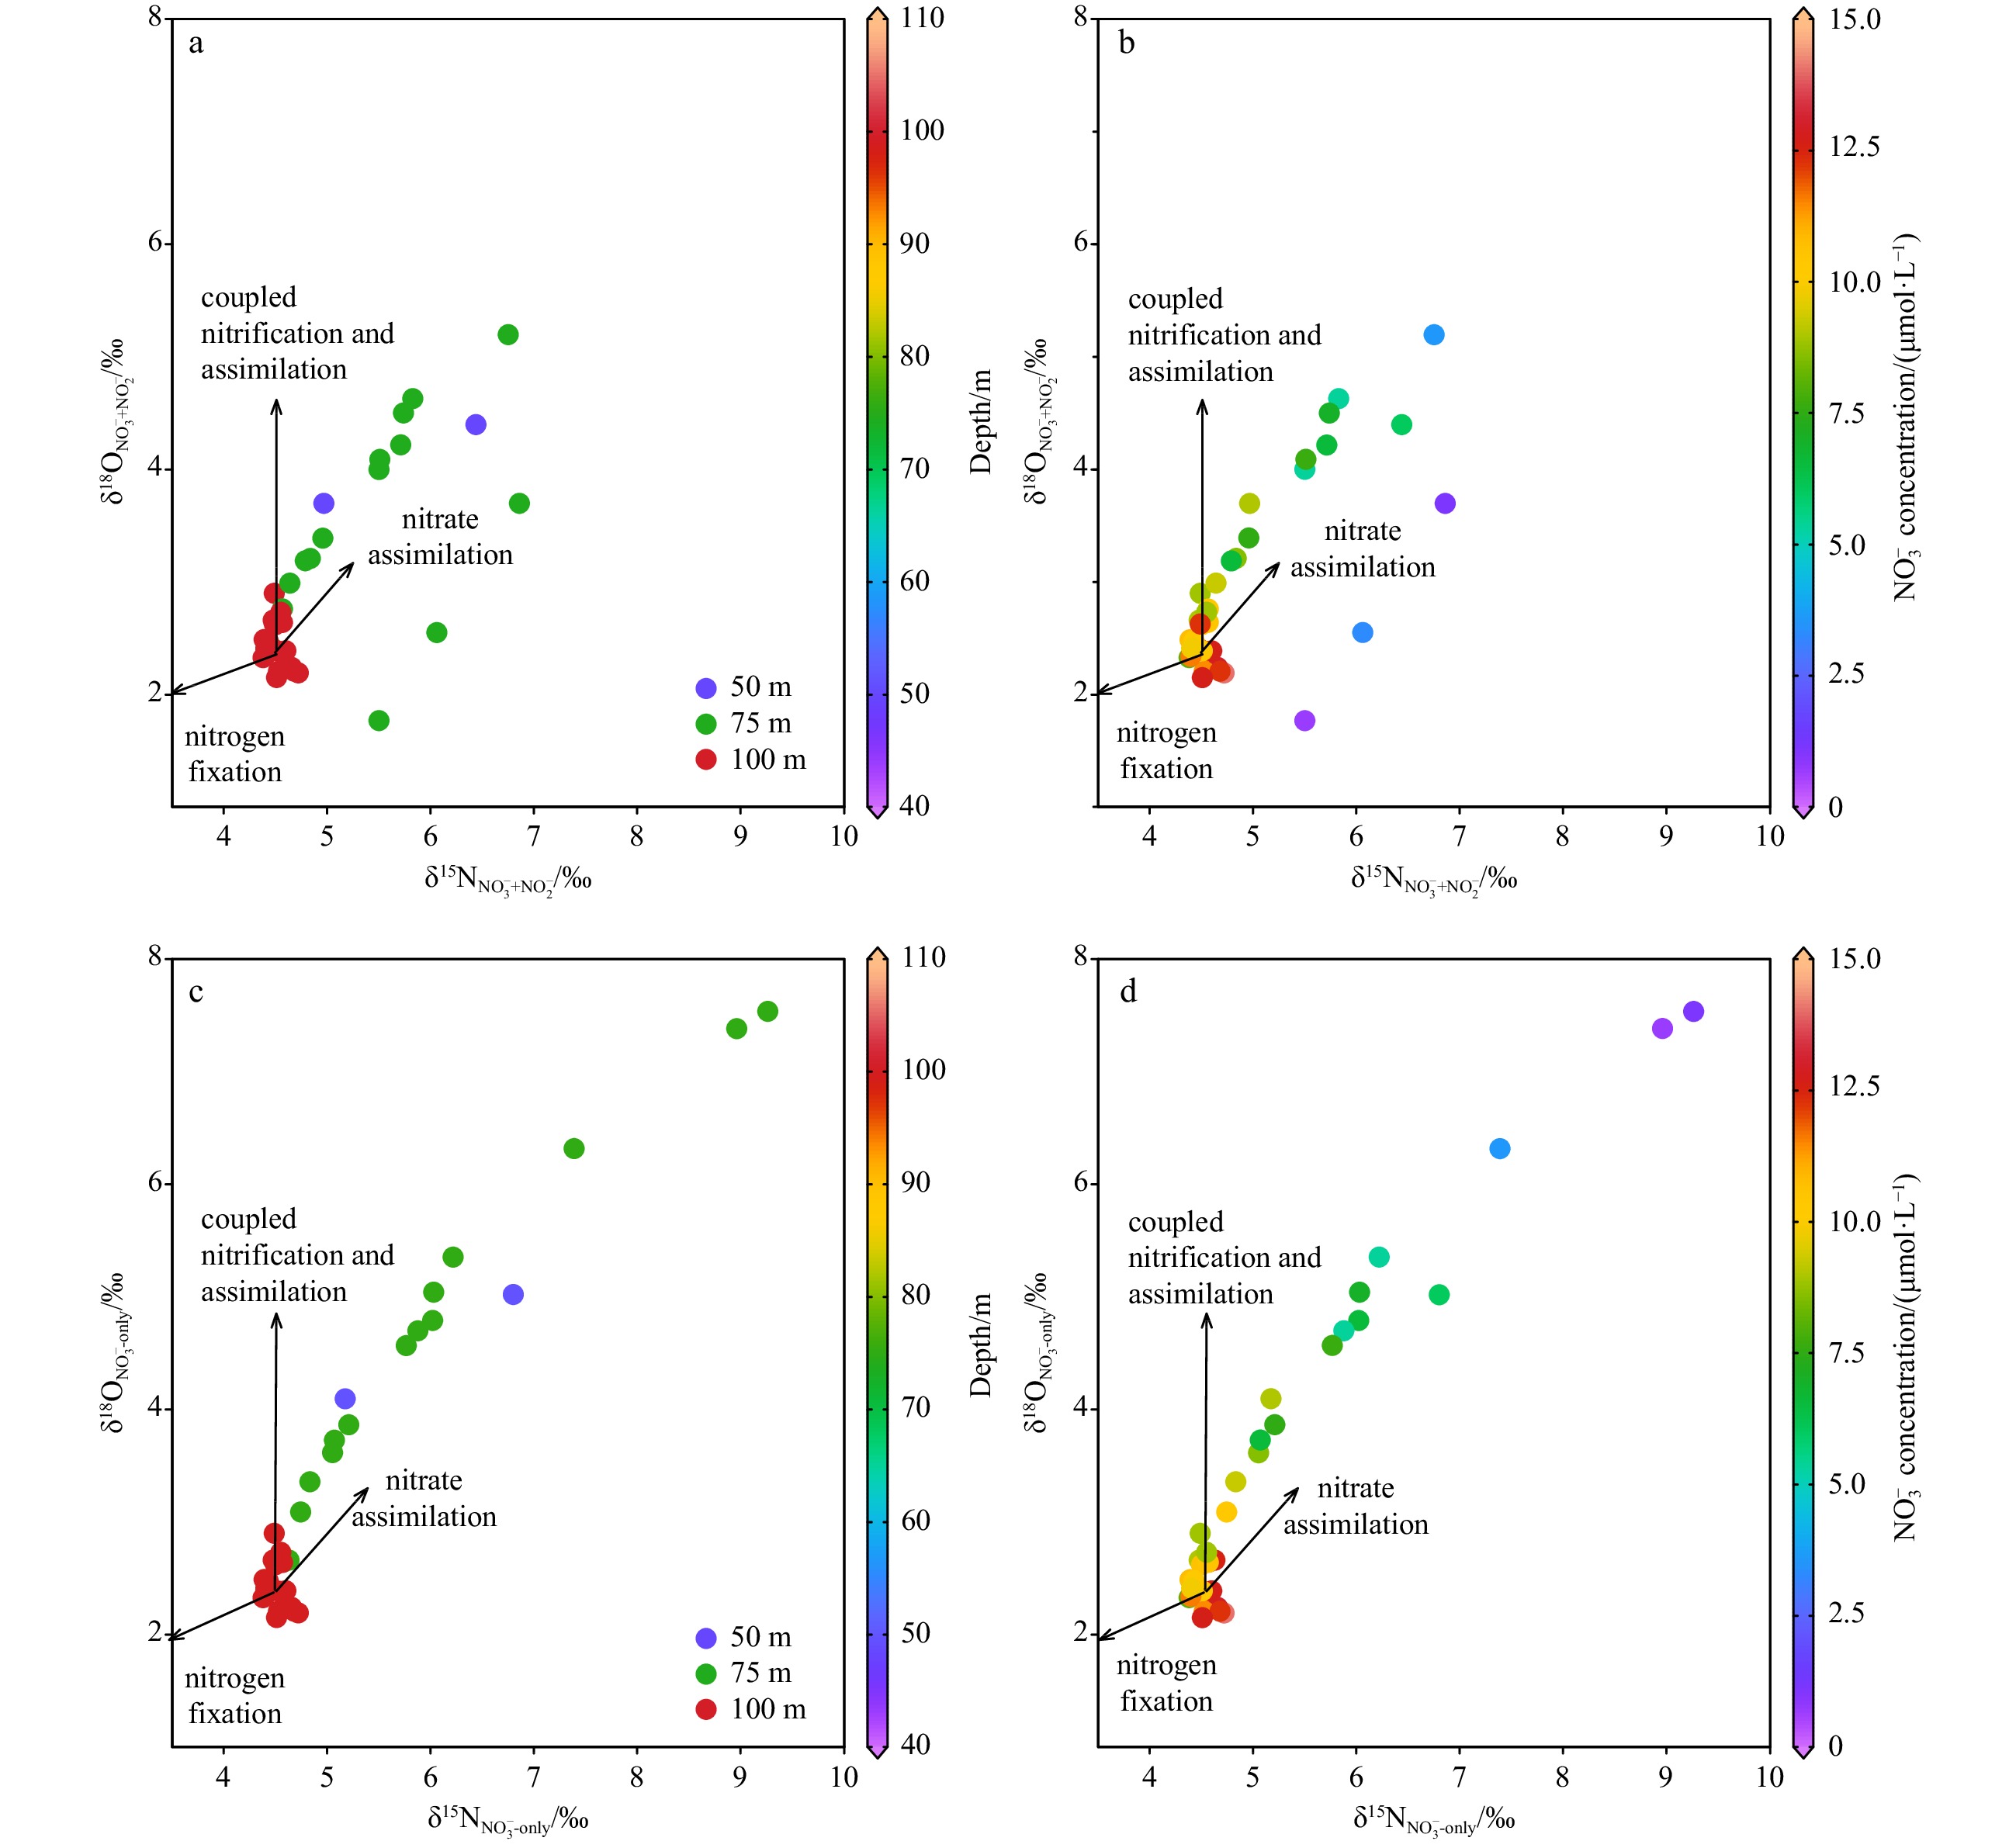
The relationships for δ15N and δ18O of nitrate+nitrite or nitrate in the LEZ (50−100 m) only are shown in Fig. 5. In general, the values of δ15N and δ18O for nitrate only at 50 m and 75 m fit the 1:1 line very well after correcting for nitrite, implying that such data points are mainly subject to the isotopic enrichment during nitrate assimilation (Sigman and Fripiat, 2019). In contrast, the $ \delta^{15} {\rm{N}}_{{\rm{NO}}_{3}^-} $ and $ \delta^{18} {\rm{O}}_{{\rm{NO}}_{3}^-} $ deviates from the 1:1 line much at 100 m. We suggest that such deviation can be explained by the combined results of negligible nitrate assimilation in the presence of relatively active nitrification at the base of the euphotic zone. Indeed, unlike in the North Atlantic subtropical gyre Station BATS where euphotic zone nitrification appeared negligible (Fawcett et al., 2015), nitrification had been confirmed in the SCS euphotic zone (Wan et al., 2018). During nitrification, the N and O isotope systems are decoupled, i.e., the δ18O of nitrate will be largely reset by nitrification, while the δ15N of nitrate is mainly dependent on the source N to be nitrified (Casciotti et al., 2011).
Figure
5.
Relationship of δ15N and δ18O of nitrate+nitrite and nitrate only in the LEZ. Nitrite correction is applied for samples at 50–75 m water column. The correlation for nitrate-only isotope ratios at 50 m and 75 m yields a linear relationship (δ18O=1.0×δ15N–1.4, R2=0.95, p<0.05). N2 in the air (x-axis) and the Vienna Standard Mean Ocean Water (y-axis) are chosen as the standards for N and O isotope analysis, respectively.
Theoretically, the light inhibition on nitrite oxidation (second step of canonical nitrification) will likely be relieved with depth, making the deeper layers a more favorable environment for microbial nitrification. In fact, the non-unison change of N and O isotopes also exists for the UMZ as inferred from the vertical distribution pattern of Δ(15-18) (Fig. 4) or the δ15N vs. δ18O relationship (figure not shown), suggesting an isotopic imprint of remineralization on nitrate pool.
Interestingly, there appears a possibility that salinity change may have played an additional role on shaping the δ18O of nitrate derived from nitrification. The δ18O of seawater is not constant in the ocean’s water column, rather, it co-varies well with salinity in the ocean (Craig and Gordon, 1964). Nevertheless, the correction practice will likely elevate nitrate δ18O relative δ15N and further enlarge (rather than reduce) the deviation of N and O isotopes as salinity generally increased with depth in this study (Fig. 2c), further corroborating the importance of nitrification in influencing Δ(15-18).
4.3
The isotope fractionation during nitrate assimilation in the LEZ
Considering the disproportionate importance of LEZ in contributing to export production (Karl et al., 2021), isotope fractionation during nitrate assimilation in the LEZ represents a key constraint for interpreting the δ15N variability of N export. Previous study in the Southern Ocean had suggested that the isotope effect calculated from δ15N of nitrate+nitrite better reflects N assimilation in the euphotic zone (Fripiat et al., 2019). Nevertheless, in tropical/subtropical regions like the SCS, the δ15N of nitrite is much more dominated by relevant nitrite processes like nitrite oxidizing and nitrite reduction (Chen et al., 2021), rather than nitrate-nitrite interconversion dominated in low temperature environment like the Southern Ocean (Kemeny et al., 2016). Therefore, we propose that the isotope effect calculated from δ15N of nitrate only is probably a better measure of isotope fractionation during N assimilation in the SCS euphotic zone.
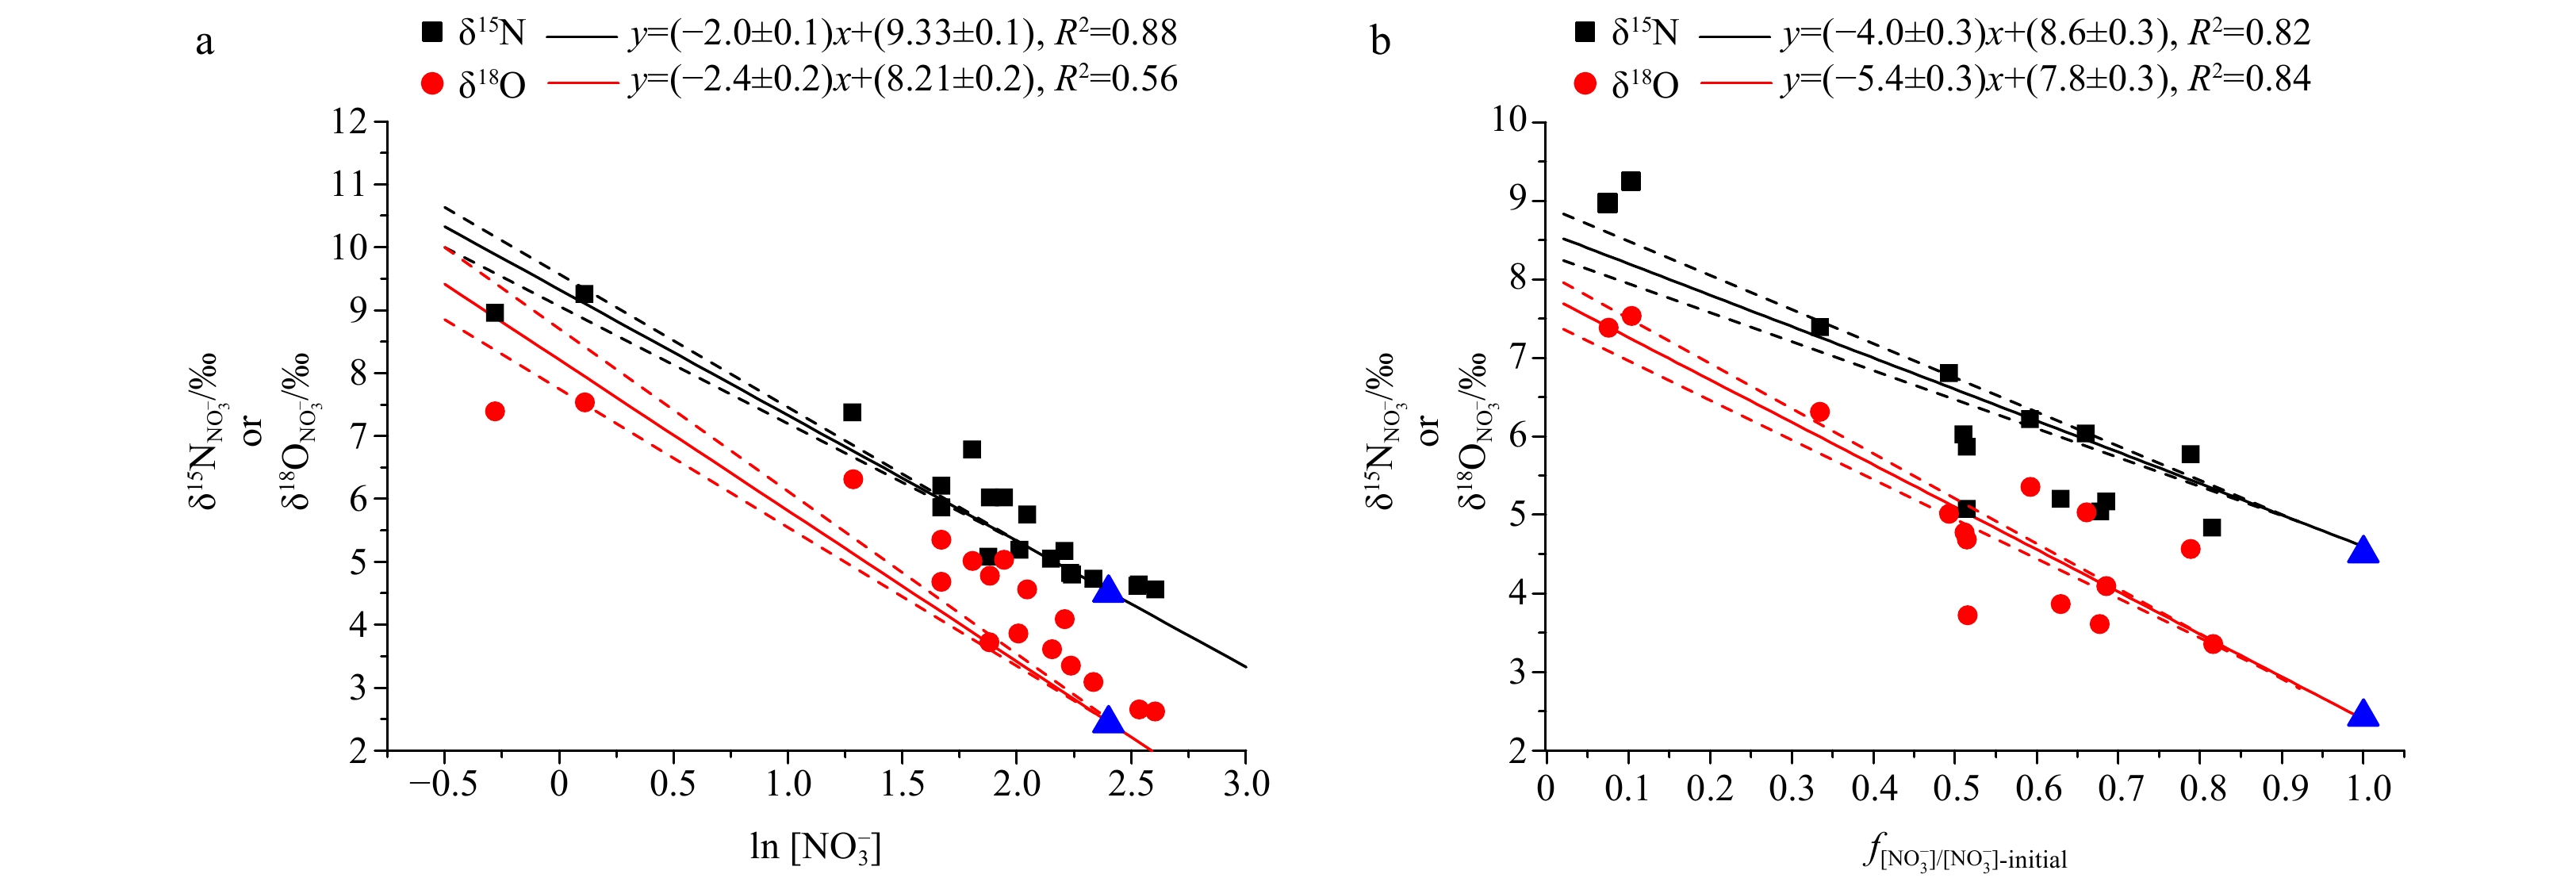
At 50 m and 75 m of the LEZ, the $\delta^{18} {\rm{O}}_{{\rm{NO}}_{3}^-} $ vs. $\delta^{15} {\rm{N}}_{{\rm{NO}}_{3}^-} $ of nitrate conform well to the 1:1 line (Fig. 5), implying that nitrate assimilation may be the major process regulating nitrate isotope variability there (Deman et al., 2021). Assuming that nitrate assimilation proceeds with a constant isotope effect (15εASSIM and 18εASSIM, respectively), we can estimate 15εASSIM and 18εASSIM from $\delta^{18} {\rm{O}}_{{\rm{NO}}_{3}^-} $, $\delta^{15} {\rm{N}}_{{\rm{NO}}_{3}^-} $, and nitrate concentration based on two system settings, i.e., the Rayleigh and steady-state fractionation systems, respectively. For the Rayleigh (closed) fractionation model, the N and O isotopic composition of the reactants can be expressed as:
$$ \delta^{18} {\rm{O}}_{\rm{reactant}}=\delta^{18}{\rm{O}}_{\rm{initial}}+{ }^{18}\varepsilon_{\rm{ASSIM}} \times {\rm{ln}}\; f , $$
(10)
where f means the ratio of the remaining reactant and initial reactant. The subscripts “reactant” and “initial” refer to the reactant remaining reactant and initial reactant, respectively (Sigman and Fripiat, 2019). The mean values of $ \delta^{15} {\rm{N}}_{{\rm{NO}}_{3}^-} $, $ \delta^{18} {\rm{O}}_{{\rm{NO}}_{3}^-} $ and concentration of nitrate at the base of the euphotic zone (100 m) are chosen as the starting point of the regression lines. While for the steady-state (open) model, the counterpart equations are as follows:
Interestingly, the LEZ (75 m mainly) data in this study appear to fit the Rayleigh closed model and the steady-state model both well, especially for nitrate N isotope (Fig. 6). The steady-state model yields fractionation factors of 15εASSIM=4.0‰±0.3‰ and 18εASSIM=5.4‰±0.3‰ during nitrate assimilation, falling in the reported value range of ε during nitrate assimilation by phytoplankton (15εASSIM 2‰−6‰, 18εASSIM 2‰−6‰; Fawcett et al., 2015; Fripiat et al., 2019; Kemeny et al., 2016). In contrast, the Rayleigh closed model will yield seemingly inexplicable much lower ε values (15εASSIM=2.0‰±0.1‰, 18εASSIM=2.4‰±0.2‰) for this region. Based on ε results, we suggest that a steady-state model may be more suitable for describing isotope fractionation during nitrate assimilation in the WSCS LEZ at least for two reasons. First, in the LEZ where light is a limiting factor for primary production, 15εASSIM during nitrate assimilation by phytoplankton tends to be elevated rather than decreased (Needoba and Harrison, 2004). The main cause is the changed relative rates of ${{\rm {NO}}_3^-} $ uptake and efflux from phytoplankton cells will increase under low light conditions, thus elevating the 15εASSIM (Needoba and Harrison, 2004). Second, though Fe-replete condition may favor nitrate uptake rates and reduce isotope fractionation during nitrate assimilation process (Karsh et al., 2003), this is unlikely for the SCS, as dissolved Fe (dFe) had been observed to be in low concentrations (<0.3 nmol/L) in the upper water column of the SCS (Wu et al., 2003).
Figure
6.
The N and O isotope fractionation during nitrate assimilation in Rayleigh (a) or steady-state (b) models. Data points of 50 m and 75 m are used for regression. The blue triangles represent the mean endmember value at 100 m. The standard deviation is 0.10‰ and 0.20‰ for δ15N and δ18O at 100 m, respectively. The dotted lines represent the confidence interval of 95%. The f means the ratio of the remaining reactant and initial reactant.
Interestingly, calculated 18εASSIM was higher than 15εASSIM either for Rayleigh or steady-state models in this study (Fig. 6), indicating a decoupling of N and O isotopes during nitrate assimilation in the SCS LEZ. On the other hand, prior studies had shown normal kinetic isotope fractionation and the δ15N and δ18O of the residual nitrate pool increase in parallel (15εASSIM≈18εASSIM) (Granger et al., 2010; Karsh et al., 2012). We propose that such seemingly discrepancy may have resulted from the influence of nitrification. Unlike N isotopes which experience almost zero net isotope effect from source to product nitrate, nitrate produced by nitrification will have a δ18O signal of ~1.1‰ higher than the ambient seawater (Sigman et al., 2009). Surface layers seawater δ18O is around 0‰ in the SCS (Wu et al., 2021). In this case, even the lower 18εASSIM (2.4‰±0.1‰) from steady-state fractionation model will yield a δ18O of 4.8‰ for the reactant remaining, further corroborating the role of nitrification at the base of the LEZ. Thus, the calculated fractionation factors from both models are “apparent” value especially for O isotope, which is governed by complex physical and biological processes.
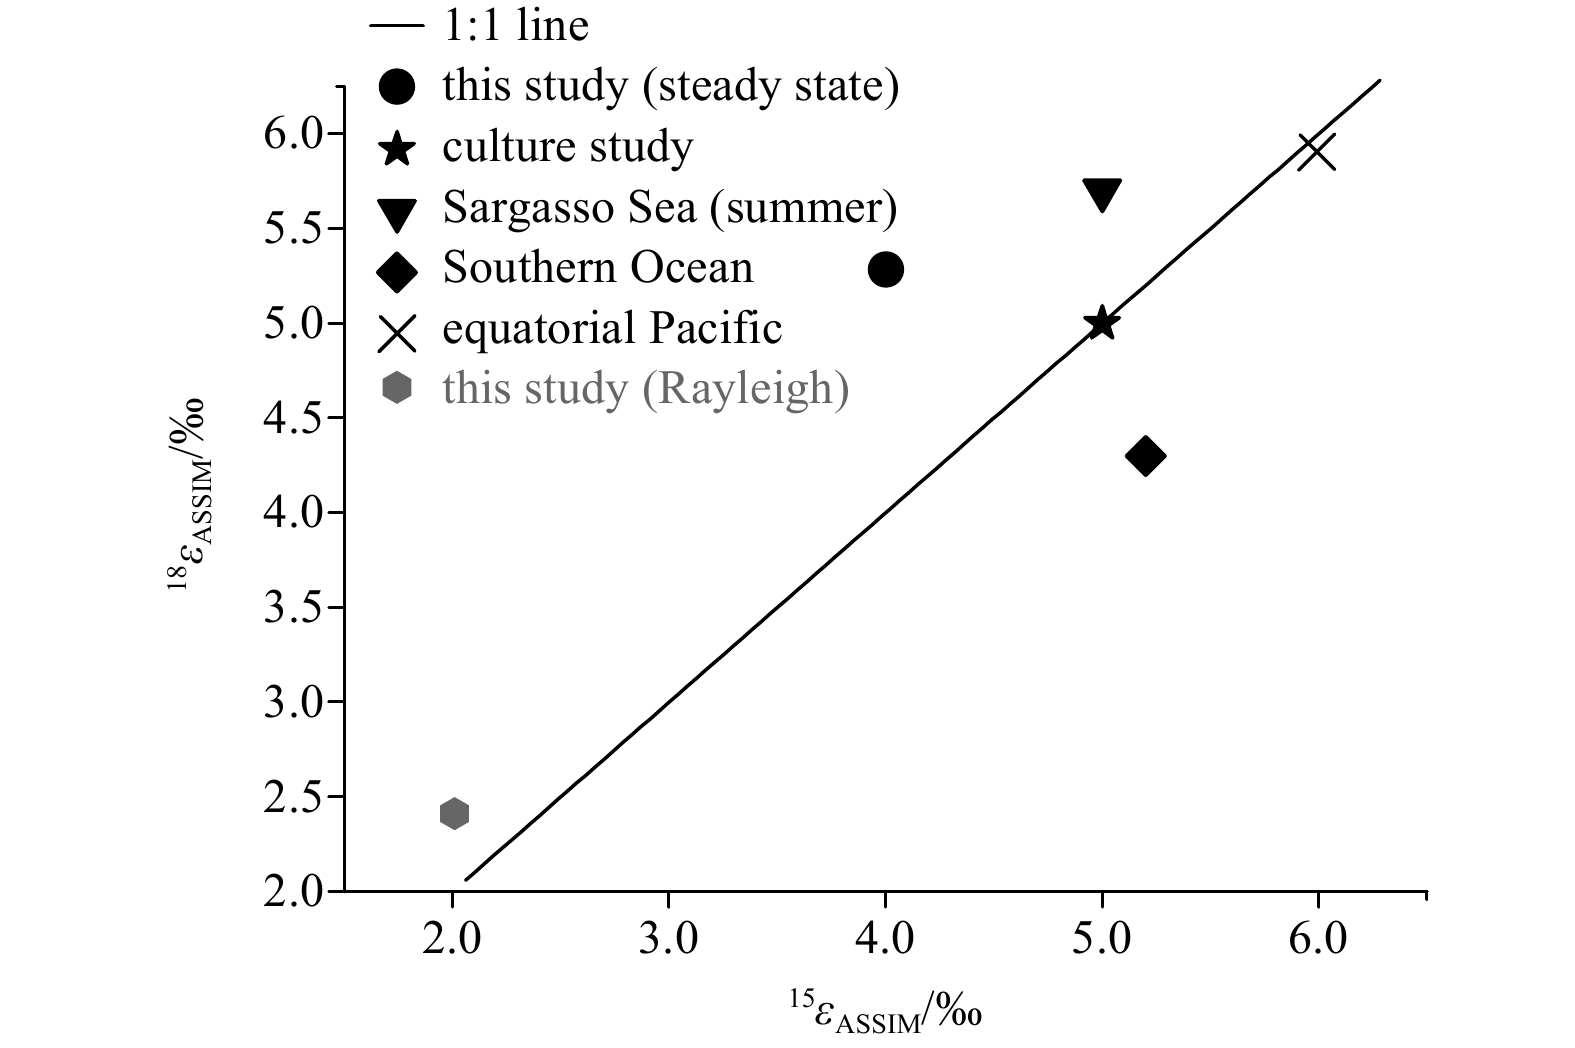
A short compilation of 18εASSIM and 15εASSIM across different oceanic regions is shown in Fig. 7. It is evident that most data points from field studies do not strictly conform to the 1:1 line, implying that the isotope effect during nitrate assimilation by phytoplankton may be imprinted by complex processes like nitrification (occurring in situ or “preformed” elsewhere). It is probably not surprising that relatively high εASSIM values can be found in N-replete oceanic regions, like the equatorial upwelling (Rafter and Sigman, 2016) and the Southern Ocean (Fripiat et al., 2019). It should also be noted that non-negligible εASSIM values may also be applied to some sub-environment in the so-called oligotrophic oceanic regions, like the SCS where N is relatively replete in at least the LEZ (this study).
4.4
Export of organic matter and its remineralization in mesopelagic waters
The export of organic matter (mainly in the form of sinking particulate matter) is a key process that channels element cycle in the euphotic zone and deep ocean, thus exerting fundamental role on the sequestration of atmospheric CO2 (Eppley and Peterson, 1979). Here we tentatively estimate the δ15N of exported matter out of the euphotic zone based on a 1-D mass balance box model:
where FEX, ${F}_{{\rm{NO}}_3^-} $, ${F}_{{\rm{N}}_{2}} $ and FATM represent the fluxes of N export, upward nitrate from subsurface via physical pathways, N2 fixation and atmospheric deposition of N, respectively. The δ15NEX, $\delta ^{15}{\rm{N}}_{{\rm{NO}}_3^-} $, $\delta ^{15}{\rm{N}}_{{\rm{N}}_{2}} $ and δ15NATM represent the N isotopic compositions of each flux, respectively. The shallow subsurface minimum of $\delta ^{15}{\rm{N}}_{{\rm{NO}}_3^-} $ at 100 m (~4.6‰) is chosen as the endmember value, as it turns to be a year-round feature for the SCS (Ren et al., 2017; Yang et al., 2017, 2018). Other endmember values are chosen as follows: ${F}_{{\rm{NO}}_3^-} $=(204±40) mmol/(m2·a) (in terms of N) (Ren et al. 2017; references therein), ${F}_{{\rm{N}}_{2}} $=20 mmol/(m2·a) (in terms of N) (Kao et al., 2012; Voss et al., 2006; Zhang et al., 2015), FATM=50 mmol/(m2·a) (in terms of N) (Yang et al., 2017), $\delta ^{15}{\rm{N}}_{{\rm{N}}_{2}} $=−1.0‰ (Montoya et al., 2002), and δ15NATM=1.1‰ (Xiao et al., 2018). Above calculation will yield a value of 3.7‰ for δ15NEX. It should be noted that the estimated δ15NEX is relatively coarse and needs to be treated with caution, considering that relatively large range for most F and δ values of the endmembers. If the value of δ15NEX here is solid, it thus implies that N export from the euphotic zone may be ~1‰ lower than the $\delta ^{15}{\rm{N}}_{{\rm{NO}}_3^-} $ of the shallow subsurface nitrate source on an annual basis.
Ammonium assimilation in the LEZ appears to be another constraint that will influence the δ15N of exported N at first sight, mainly because ammonium is generally assumed to have relatively low δ15N due to recycling processes (Sigman and Fripiat, 2019). However, we propose that this is unlikely a significant factor for the δ15N of exported N for following reasons. First, ammonium concentration in the SCS basin water column is generally at nanomolar level (Zhu et al., 2021). Second, though ammonium assimilation proceeds with a normal kinetic isotope effect (Ward, 2005) and will likely cause the produced PN relatively high in δ15N, any ammonium remaining will soon be assimilated and transformed to PN, roughly resulting in no net effect. Indeed, active ammonium oxidation had been reported in the SCS (Wan et al., 2018).
A caveat of such mass balance model is the neglection of possible lateral flux. Although a lateral homogeneity of dissolved inorganic nitrogen is generally valid for the SCS (Du et al., 2017), the spatial variability of dissolved organic N (DON) recently reported (Zhang et al., 2020) implies that DON may also represent an overlooked new N source for the SCS water column. Indeed, the production and consumption of DON in the SCS is active from an isotopic perspective (Zhang et al., 2020). More studies are called for to take DON (concentration, isotope ratio, bioavailability, etc.) into account when examining N cycle in the SCS.
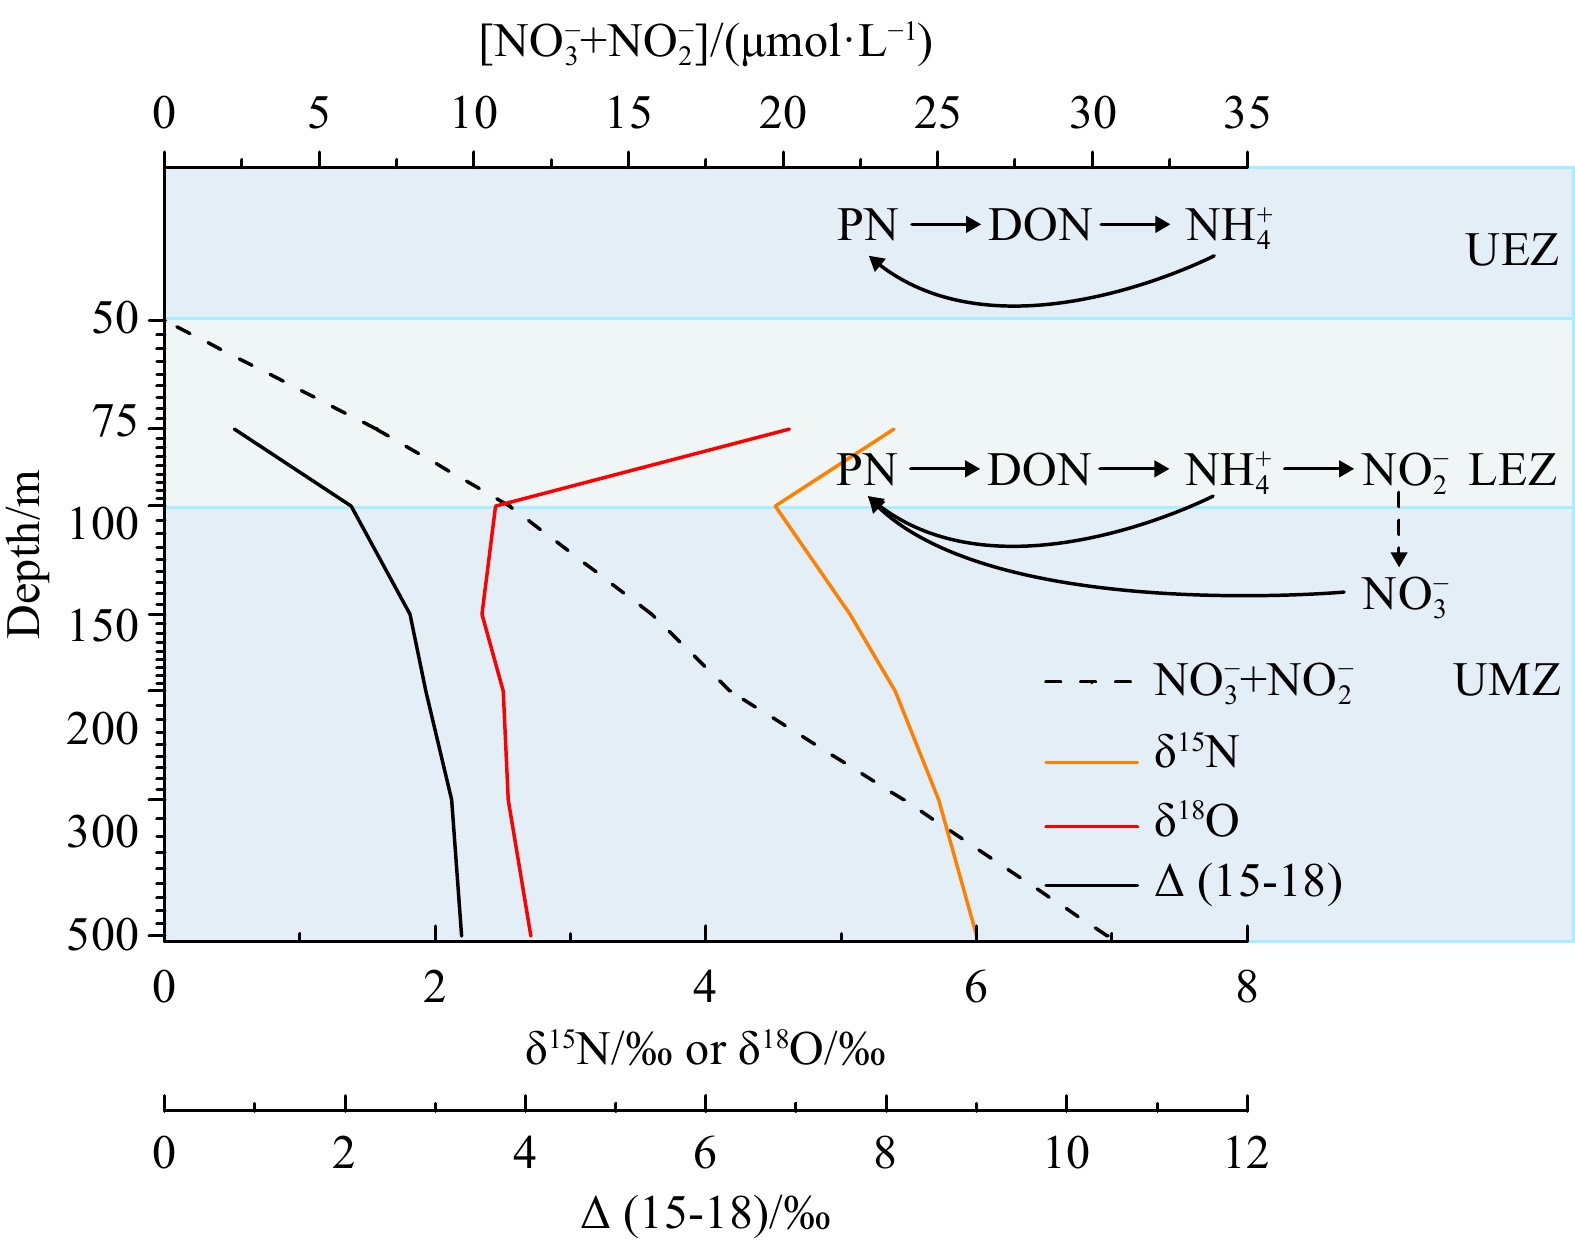
A schematic of N cycle as implied by our nitrate isotope data for the WSCS EZ-UMZ is shown in Fig. 8. In the UMZ, an isotopic signal of the remineralization of the exported organic N is evidenced by the decoupling of δ15N and δ18O. Such signal is largely overprinted when depth increases, where the characteristics (higher δ15N) of the western Pacific-sourced nitrate becomes dominant (Xu, 2021; Yang et al., 2018).
Figure
8.
Schematic of N cycle as inferred from nitrate isotopes in the upper 500 m of the western South China Sea. Depth profiles of nitrate+nitrite concentration, δ15N, δ18O and Δ(15-18) are based on the mean values from this study. The vertical patterns of NH4+ uptake rate and nitrification rate based on isotope tracer assay are considered (Wan et al., 2018). N2 in the air and the Vienna Standard Mean Ocean Water are chosen as the standards for N and O isotope analysis, respectively. UEZ: upper oligotrophic zone; LEZ: lower euphotic zone; UMZ: upper portion of mesopelagic zone.
In this study, we examine the nitrate isotope dynamics in the LEZ-UMZ continuum of the WSCS, aiming to elucidate the major N processes in this key sub-environment. Although the UEZ is depleted in nitrate, the LEZ provides a relatively N-replete sub-environment for nitrate assimilation, yielding an isotope effect of 4.0‰±0.3‰ for 15εASSIM and 5.4‰±0.3‰ for 18εASSIM from a steady-state model, respectively. A minimum of nitrate δ15N (~4.6‰) at ~100 m is consistent with prior studies in the SCS, suggesting that such phenomenon is a year-round feature and deserves to be further explored in the future. A notable decoupling of nitrate δ15N and δ18O from 100 m downward suggest the role of nitrification in shaping the isotopic composition of dissolved inorganic pool. Based on a mass balance method, the N isotopic composition of the exported N (δ15NEX) was estimated to be ~3.7‰, which is lower than the shallow subsurface nitrate δ15N minimum. In the UMZ, an isotopic signal of the remineralization of the exported organic N is evidenced by the decoupling of δ15N and δ18O. This study likely provides insights for understanding N dynamics in the SCS for both present and past.
Bai Peng, Yang Jingling, Zhang Shuwen, et al. 2019. Upwelling off the west coast of Hainan Island: sensitivity to wave-mixing. Acta Oceanologica Sinica, 38(11): 11–19. doi: 10.1007/s13131-019-1494-3
Braman R S, Hendrix S A. 1989. Nanogram nitrite and nitrate determination in environmental and biological materials by vanadium (III) reduction with chemi luminescence detection. Analytical Chemistry, 61(24): 2715–2718. doi: 10.1021/ac00199a007
Buchwald C, Casciotti K L. 2013. Isotopic ratios of nitrite as tracers of the sources and age of oceanic nitrite. Nature Geoscience, 6(4): 308–313. doi: 10.1038/ngeo1745
Cai Pinghe, Chen Weifang, Dai Minhan, et al. 2008. A high-resolution study of particle export in the southern South China Sea based on 234Th: 238U disequilibrium. Journal of Geophysical Research: Oceans, 113: C04019
Casciotti K L. 2016a. Nitrite isotopes as tracers of marine N cycle processes. Philosophical Transactions of the Royal Society A: Mathematical, Physical and Engineering Sciences, 374(2081): 20150295
Casciotti K L. 2016b. Nitrogen and oxygen isotopic studies of the marine nitrogen cycle. Annual Review of Marine Science, 8: 379–407. doi: 10.1146/annurev-marine-010213-135052
Casciotti K L, Buchwald C, Santoro A E, et al. 2011. Assessment of nitrogen and oxygen isotopic fractionation during nitrification and its expression in the marine environment. Methods in Enzymology, 486: 253–280
Casciotti K L, Sigman D M, Hastings M G, et al. 2002. Measurement of the oxygen isotopic composition of nitrate in seawater and freshwater using the denitrifier method. Analytical Chemistry, 74(19): 4905–4912. doi: 10.1021/ac020113w
Chen Yangjun, Bardhan P, Zhao Xiufeng, et al. 2021. Nitrite cycle indicated by dual isotopes in the northern South China Sea. Journal of Geophysical Research: Biogeosciences, 126(7): e2020JG006129
Chen Yuh-ling Lee, Chen Houng-Yung, Tuo Sing-how, et al. 2008. Seasonal dynamics of new production from Trichodesmium N2 fixation and nitrate uptake in the upstream Kuroshio and South China Sea basin. Limnology and Oceanography, 53(5): 1705–1721. doi: 10.4319/lo.2008.53.5.1705
Chen Fajin, Lao Qibin, Zhang Shuwen, et al. 2020. Nitrate sources and biogeochemical processes identified using nitrogen and oxygen isotopes on the eastern coast of Hainan Island. Continental Shelf Research, 207: 104209. doi: 10.1016/j.csr.2020.104209
Coale K H, Bruland K W. 1987. Oceanic stratified euphotic zone as elucidated by 234Th: 238U disequilibria. Limnology and Oceanography, 32(1): 189–200. doi: 10.4319/lo.1987.32.1.0189
Craig H, Gordon L. 1964. Deuterium and Oxygen 18 Variations in the Ocean and Marine Atmosphere. Pisa: Laboratorio di Geologia Nucleare, 277–374
Deman F, Fonseca-Batista D, Roukaerts A, et al. 2021. Nitrate supply routes and impact of internal cycling in the North Atlantic Ocean inferred from nitrate isotopic composition. Global Biogeochemical Cycles, 35(4): e2020GB006887
Dore J E, Karl D M. 1996. Nitrification in the euphotic zone as a source for nitrite, nitrate, and nitrous oxide at Station ALOHA. Limnology and Oceanography, 41(8): 1619–1628. doi: 10.4319/lo.1996.41.8.1619
Dore J E, Letelier R M, Church M J, et al. 2008. Summer phytoplankton blooms in the oligotrophic North Pacific Subtropical Gyre: Historical perspective and recent observations. Progress in Oceanography, 76(1): 2–38. doi: 10.1016/j.pocean.2007.10.002
Du Chuanjun, Liu Zhiyu, Kao Shuh-Ji, et al. 2017. Diapycnal fluxes of nutrients in an oligotrophic oceanic regime: The South China Sea. Geophysical Research Letters, 44(22): 11510–11518. doi: 10.1002/2017GL074921
Eppley R W, Peterson B J. 1979. Particulate organic matter flux and planktonic new production in the deep ocean. Nature, 282(5740): 677–680. doi: 10.1038/282677a0
Fawcett S E, Ward B B, Lomas M W, et al. 2015. Vertical decoupling of nitrate assimilation and nitrification in the Sargasso Sea. Deep-Sea Research Part I: Oceanographic Research Papers, 103: 64–72. doi: 10.1016/j.dsr.2015.05.004
Fripiat F, Martínez-García A, Fawcett S E, et al. 2019. The isotope effect of nitrate assimilation in the Antarctic Zone: Improved estimates and paleoceanographic implications. Geochimica et Cosmochimica Acta, 247: 261–279. doi: 10.1016/j.gca.2018.12.003
Granger J, Sigman D M, Needoba J A, et al. 2004. Coupled nitrogen and oxygen isotope fractionation of nitrate during assimilation by cultures of marine phytoplankton. Limnology and Oceanography, 49(5): 1763–1773. doi: 10.4319/lo.2004.49.5.1763
Granger J, Sigman D M, Rohde M M, et al. 2010. N and O isotope effects during nitrate assimilation by unicellular prokaryotic and eukaryotic plankton cultures. Geochimica et Cosmochimica Acta, 74(3): 1030–1040. doi: 10.1016/j.gca.2009.10.044
Kao Shuh-Ji, Yang Jin-Yu Terence, Liu Kon-Kee, et al. 2012. Isotope constraints on particulate nitrogen source and dynamics in the upper water column of the oligotrophic South China Sea. Global Biogeochemical Cycles, 26(2): GB2033
Karl D M, Letelier R M, Bidigare R R, et al. 2021. Seasonal-to-decadal scale variability in primary production and particulate matter export at Station ALOHA. Progress in Oceanography, 195: 102563. doi: 10.1016/j.pocean.2021.102563
Karl D, Letelier R, Tupas L, et al. 1997. The role of nitrogen fixation in biogeochemical cycling in the subtropical North Pacific Ocean. Nature, 388(6642): 533–538. doi: 10.1038/41474
Karsh K L, Granger J, Kritee K, et al. 2012. Eukaryotic assimilatory nitrate reductase fractionates N and O isotopes with a ratio near unity. Environmental Science & Technology, 46(11): 5727–5735
Karsh K L, Trull T W, Lourey M J, et al. 2003. Relationship of nitrogen isotope fractionation to phytoplankton size and iron availability during the Southern Ocean Iron Release Experiment (SOIREE). Limnology and Oceanography, 48(3): 1058–1068. doi: 10.4319/lo.2003.48.3.1058
Kemeny P C, Weigand M A, Zhang R, et al. 2016. Enzyme-level interconversion of nitrate and nitrite in the fall mixed layer of the Antarctic Ocean. Global Biogeochemical Cycles, 30(7): 1069–1085. doi: 10.1002/2015GB005350
Lao Qibin, Chen Fajin, Liu Guoqiang, et al. 2019. Isotopic evidence for the shift of nitrate sources and active biological transformation on the western coast of Guangdong Province, South China. Marine Pollution Bulletin, 142: 603–612. doi: 10.1016/j.marpolbul.2019.04.026
Li Denghui, Zhou Meng, Zhang Zhaoru, et al. 2018. Intrusions of Kuroshio and shelf waters on northern slope of South China Sea in summer 2015. Journal of Ocean University of China, 17(3): 477–486. doi: 10.1007/s11802-018-3384-2
Liang Wenzhao, Tang Danling, Luo Xin. 2018. Phytoplankton size structure in the western South China Sea under the influence of a ‘jet-eddy system’. Journal of Marine Systems, 187: 82–95. doi: 10.1016/j.jmarsys.2018.07.001
Liu Kon-Kee, Atkinson L, Quiñones P R, et al. 2010. Carbon and Nutrient Fluxes in Continental Margins: A Global Synthesis. Berlin, Heidelberg: Springer, 423–493
Loick N, Dippner J, Doan H N, et al. 2007. Pelagic nitrogen dynamics in the Vietnamese upwelling area according to stable nitrogen and carbon isotope data. Deep-Sea Research Part I: Oceanographic Research Papers, 54(4): 596–607. doi: 10.1016/j.dsr.2006.12.009
Mariotti A, Germon J C, Hubert P, et al. 1981. Experimental determination of nitrogen kinetic isotope fractionation: Some principles; illustration for the denitrification and nitrification processes. Plant and Soil, 62(3): 413–430. doi: 10.1007/BF02374138
Montoya J P, Carpenter E J, Capone D G. 2002. Nitrogen fixation and nitrogen isotope abundances in zooplankton of the oligotrophic North Atlantic. Limnology and Oceanography, 47: 1617–1628
Moore C M, Mills M M, Arrigo K R, et al. 2013. Processes and patterns of oceanic nutrient limitation. Nature Geoscience, 6(9): 701–710. doi: 10.1038/ngeo1765
Needoba J A, Harrison P J. 2004. Influence of low light and a light: Dark cycle on ${{\rm {NO}}_3^-} $ uptake, intracellular ${{\rm {NO}}_3^-} $, and nitrogen isotope fractionation by marine phytoplankton. Journal of Phycology, 40: 505–516
Peters B D, Lam P J, Casciotti K L. 2018. Nitrogen and oxygen isotope measurements of nitrate along the US GEOTRACES Eastern Pacific Zonal Transect (GP16) yield insights into nitrate supply, remineralization, and water mass transport. Marine Chemistry, 201: 137–150. doi: 10.1016/j.marchem.2017.09.009
Rafter P A, DiFiore P J, Sigman D M. 2013. Coupled nitrate nitrogen and oxygen isotopes and organic matter remineralization in the Southern and Pacific Oceans. Journal of Geophysical Research: Oceans, 118(10): 4781–4794. doi: 10.1002/jgrc.20316
Rafter P A, Sigman D M. 2016. Spatial distribution and temporal variation of nitrate nitrogen and oxygen isotopes in the upper equatorial Pacific Ocean. Limnology and Oceanography, 61(1): 14–31. doi: 10.1002/lno.10152
Ren Haojia, Chen Yichi, Wang Xingchen T, et al. 2017. 21st-century rise in anthropogenic nitrogen deposition on a remote coral reef. Science, 356(6339): 749–752. doi: 10.1126/science.aal3869
Shang Shaoling, Lee Z, Wei Guomei. 2011. Characterization of MODIS-derived euphotic zone depth: Results for the China Sea. Remote Sensing of Environment, 115(1): 180–186. doi: 10.1016/j.rse.2010.08.016
Sigman D M, Altabet M A, McCorkle D C, et al. 1999. The δ15N of nitrate in the Southern Ocean: Consumption of nitrate in surface waters. Global Biogeochemical Cycles, 13(4): 1149–1166. doi: 10.1029/1999GB900038
Sigman D M, DiFiore P J, Hain M P, et al. 2009. The dual isotopes of deep nitrate as a constraint on the cycle and budget of oceanic fixed nitrogen. Deep-Sea Research Part I: Oceanographic Research Papers, 56(9): 1419–1439. doi: 10.1016/j.dsr.2009.04.007
Sigman D M, Fripiat F. 2019. Nitrogen isotopes in the ocean. In: Cochran J K, Bokuniewicz H J, Yager P L, eds. Encyclopedia of Ocean Sciences. 3rd ed. Oxford: Academic Press, 263–278
Sigman D M, Granger J, DiFiore P J, et al. 2005. Coupled nitrogen and oxygen isotope measurements of nitrate along the eastern North Pacific margin. Global Biogeochemical Cycles, 19(4): GB4022
Sigman D M, Hain M P, Haug G H. 2010. The polar ocean and glacial cycles in atmospheric CO2 concentration. Nature, 466(7302): 47–55. doi: 10.1038/nature09149
Stephens B M, Wankel S D, Beman J M, et al. 2020. Euphotic zone nitrification in the California Current Ecosystem. Limnology and Oceanography, 65(4): 790–806. doi: 10.1002/lno.11348
Voss M, Bombar D, Loick N, et al. 2006. Riverine influence on nitrogen fixation in the upwelling region off Vietnam, South China Sea. Geophysical Research Letters, 33(7): L07604
Wan Xianhui Sean, Sheng Huaxia, Dai Minhan, et al. 2018. Ambient nitrate switches the ammonium consumption pathway in the euphotic ocean. Nature Communications, 9: 915. doi: 10.1038/s41467-018-03363-0
Ward B B. 2005. Temporal variability in nitrification rates and related biogeochemical factors in Monterey Bay, California, USA. Marine Ecology Progress Series, 292: 97–109. doi: 10.3354/meps292097
Wong G T F, Tseng Chun-Mao, Wen Liang-Saw, et al. 2007. Nutrient dynamics and N-anomaly at the SEATS station. Deep-Sea Research Part II: Topical Studies in Oceanography, 54(14–15): 1528–1545
Wu Jingfeng, Chung Shi-Wei, Wen Liang-Saw, et al. 2003. Dissolved inorganic phosphorus, dissolved iron, and Trichodesmium in the oligotrophic South China Sea. Global Biogeochemical Cycles, 17(1): 1008
Wu Jinhui, Lao Qibin, Chen Fajin, et al. 2021. Water mass processes between the South China Sea and the western Pacific through the Luzon Strait: insights from hydrogen and oxygen Isotopes. Journal of Geophysical Research: Oceans, 126(8): e2021JC017484
Xiao Hongwei, Xiao Huayun, Luo Li, et al. 2018. Stable carbon and nitrogen isotope compositions of bulk aerosol samples over the South China Sea. Atmospheric Environment, 193: 1–10. doi: 10.1016/j.atmosenv.2018.09.006
Xu Chao. 2021. Nitrogen and oxygen isotopic compositions of nitrate in the South China Sea and the western North Pacific (in Chinese)[dissertation]. Xiamen: Xiamen University
Yang Zhi, Chen Jianfang, Chen Min, et al. 2018. Sources and transformations of nitrogen in the South China Sea: insights from nitrogen isotopes. Journal of Oceanography, 74(1): 101–113. doi: 10.1007/s10872-017-0443-z
Yang Jin-Yu Terence, Kao Shuh-Ji, Dai Minhan, et al. 2017. Examining N cycling in the northern South China Sea from N isotopic signals in nitrate and particulate phases. Journal of Geophysical Research: Biogeosciences, 122(8): 2118–2136. doi: 10.1002/2016JG003618
Yool A, Martin A P, Fernández C, et al. 2007. The significance of nitrification for oceanic new production. Nature, 447(7147): 999–1002. doi: 10.1038/nature05885
Zakem E J, Al-Haj A, Church M J, et al. 2018. Ecological control of nitrite in the upper ocean. Nature Communications, 9: 1206. doi: 10.1038/s41467-018-03553-w
Zhang Run, Chen Min, Yang Qing, et al. 2015. Physical-biological coupling of N2 fixation in the northwestern South China Sea coastal upwelling during summer. Limnology and Oceanography, 60(4): 1411–1425. doi: 10.1002/lno.10111
Zhang Run, Wang Xingchen T, Ren Haojia, et al. 2020. Dissolved organic nitrogen cycling in the South China Sea from an isotopic perspective. Global Biogeochemical Cycles, 34(12): e2020GB006551
Zhu Yifan, Liu Jing, Mulholland M R. 2021. Dynamics of ammonium biogeochemistry in an oligotrophic regime in the South China Sea. Marine Chemistry, 237: 104040
Zixuan Li, Chao Xu, Minfang Zheng, Mengya Chen, Yusheng Qiu, Hantao Zhou, Min Chen, Run Zhang. Nitrate isotope dynamics in the lower euphotic-upper mesopelagic zones of the western South China Sea[J]. Acta Oceanologica Sinica, 2023, 42(1): 1-11. doi: 10.1007/s13131-022-2091-4
Zixuan Li, Chao Xu, Minfang Zheng, Mengya Chen, Yusheng Qiu, Hantao Zhou, Min Chen, Run Zhang. Nitrate isotope dynamics in the lower euphotic-upper mesopelagic zones of the western South China Sea[J]. Acta Oceanologica Sinica, 2023, 42(1): 1-11. doi: 10.1007/s13131-022-2091-4
Figure 1. Sampling locations in the western South China Sea. Arrows indicate mean sea surface geostrophic current during the period of the cruise (data source: Archiving, Validation and Interpretation of Satellite Oceanographic Data).
Figure 2. Temperature-salinity diagram (a); depth profiles of temperature (b), practical salinity (c), and density anomaly (d) in the upper 500 m of the western South China Sea (during sampling period). Major water masses include the near-shore surface water (SW), the surface water of the SCS (SCSSW), the subsurface water (SSW), and the intermediate water (IW), respectively. The grey line in a is isopycnal. σ0: potential density. The colorful lines and shapes of the dots in the figure represent different sampling stations.
Figure 3. Depth profiles of nitrate+nitrite concentration (a, b), δ15N (c, d) and δ18O (e, f) in the upper 500 m and the upper 150 m, specifically. UEZ: upper oligotrophic zone; LEZ: lower euphotic zone. The colorful lines and shapes of the dots in the figure represent different sampling stations.
Figure 4. Depth profile of Δ(15-18) in the upper 500 m. For those samples at 50 m and 75 m, values of δ15N and δ18O had been corrected for nitrite. See Section 4.1 for details. UEZ: upper oligotrophic zone; LEZ: lower euphotic zone; UMZ: upper portion of mesopelagic zone. The colorful lines and shapes of the dots in the figure represent different sampling stations.
Figure 5. Relationship of δ15N and δ18O of nitrate+nitrite and nitrate only in the LEZ. Nitrite correction is applied for samples at 50–75 m water column. The correlation for nitrate-only isotope ratios at 50 m and 75 m yields a linear relationship (δ18O=1.0×δ15N–1.4, R2=0.95, p<0.05). N2 in the air (x-axis) and the Vienna Standard Mean Ocean Water (y-axis) are chosen as the standards for N and O isotope analysis, respectively.
Figure 6. The N and O isotope fractionation during nitrate assimilation in Rayleigh (a) or steady-state (b) models. Data points of 50 m and 75 m are used for regression. The blue triangles represent the mean endmember value at 100 m. The standard deviation is 0.10‰ and 0.20‰ for δ15N and δ18O at 100 m, respectively. The dotted lines represent the confidence interval of 95%. The f means the ratio of the remaining reactant and initial reactant.
Figure 8. Schematic of N cycle as inferred from nitrate isotopes in the upper 500 m of the western South China Sea. Depth profiles of nitrate+nitrite concentration, δ15N, δ18O and Δ(15-18) are based on the mean values from this study. The vertical patterns of NH4+ uptake rate and nitrification rate based on isotope tracer assay are considered (Wan et al., 2018). N2 in the air and the Vienna Standard Mean Ocean Water are chosen as the standards for N and O isotope analysis, respectively. UEZ: upper oligotrophic zone; LEZ: lower euphotic zone; UMZ: upper portion of mesopelagic zone.


 DownLoad:


 DownLoad:


