Figure
1.
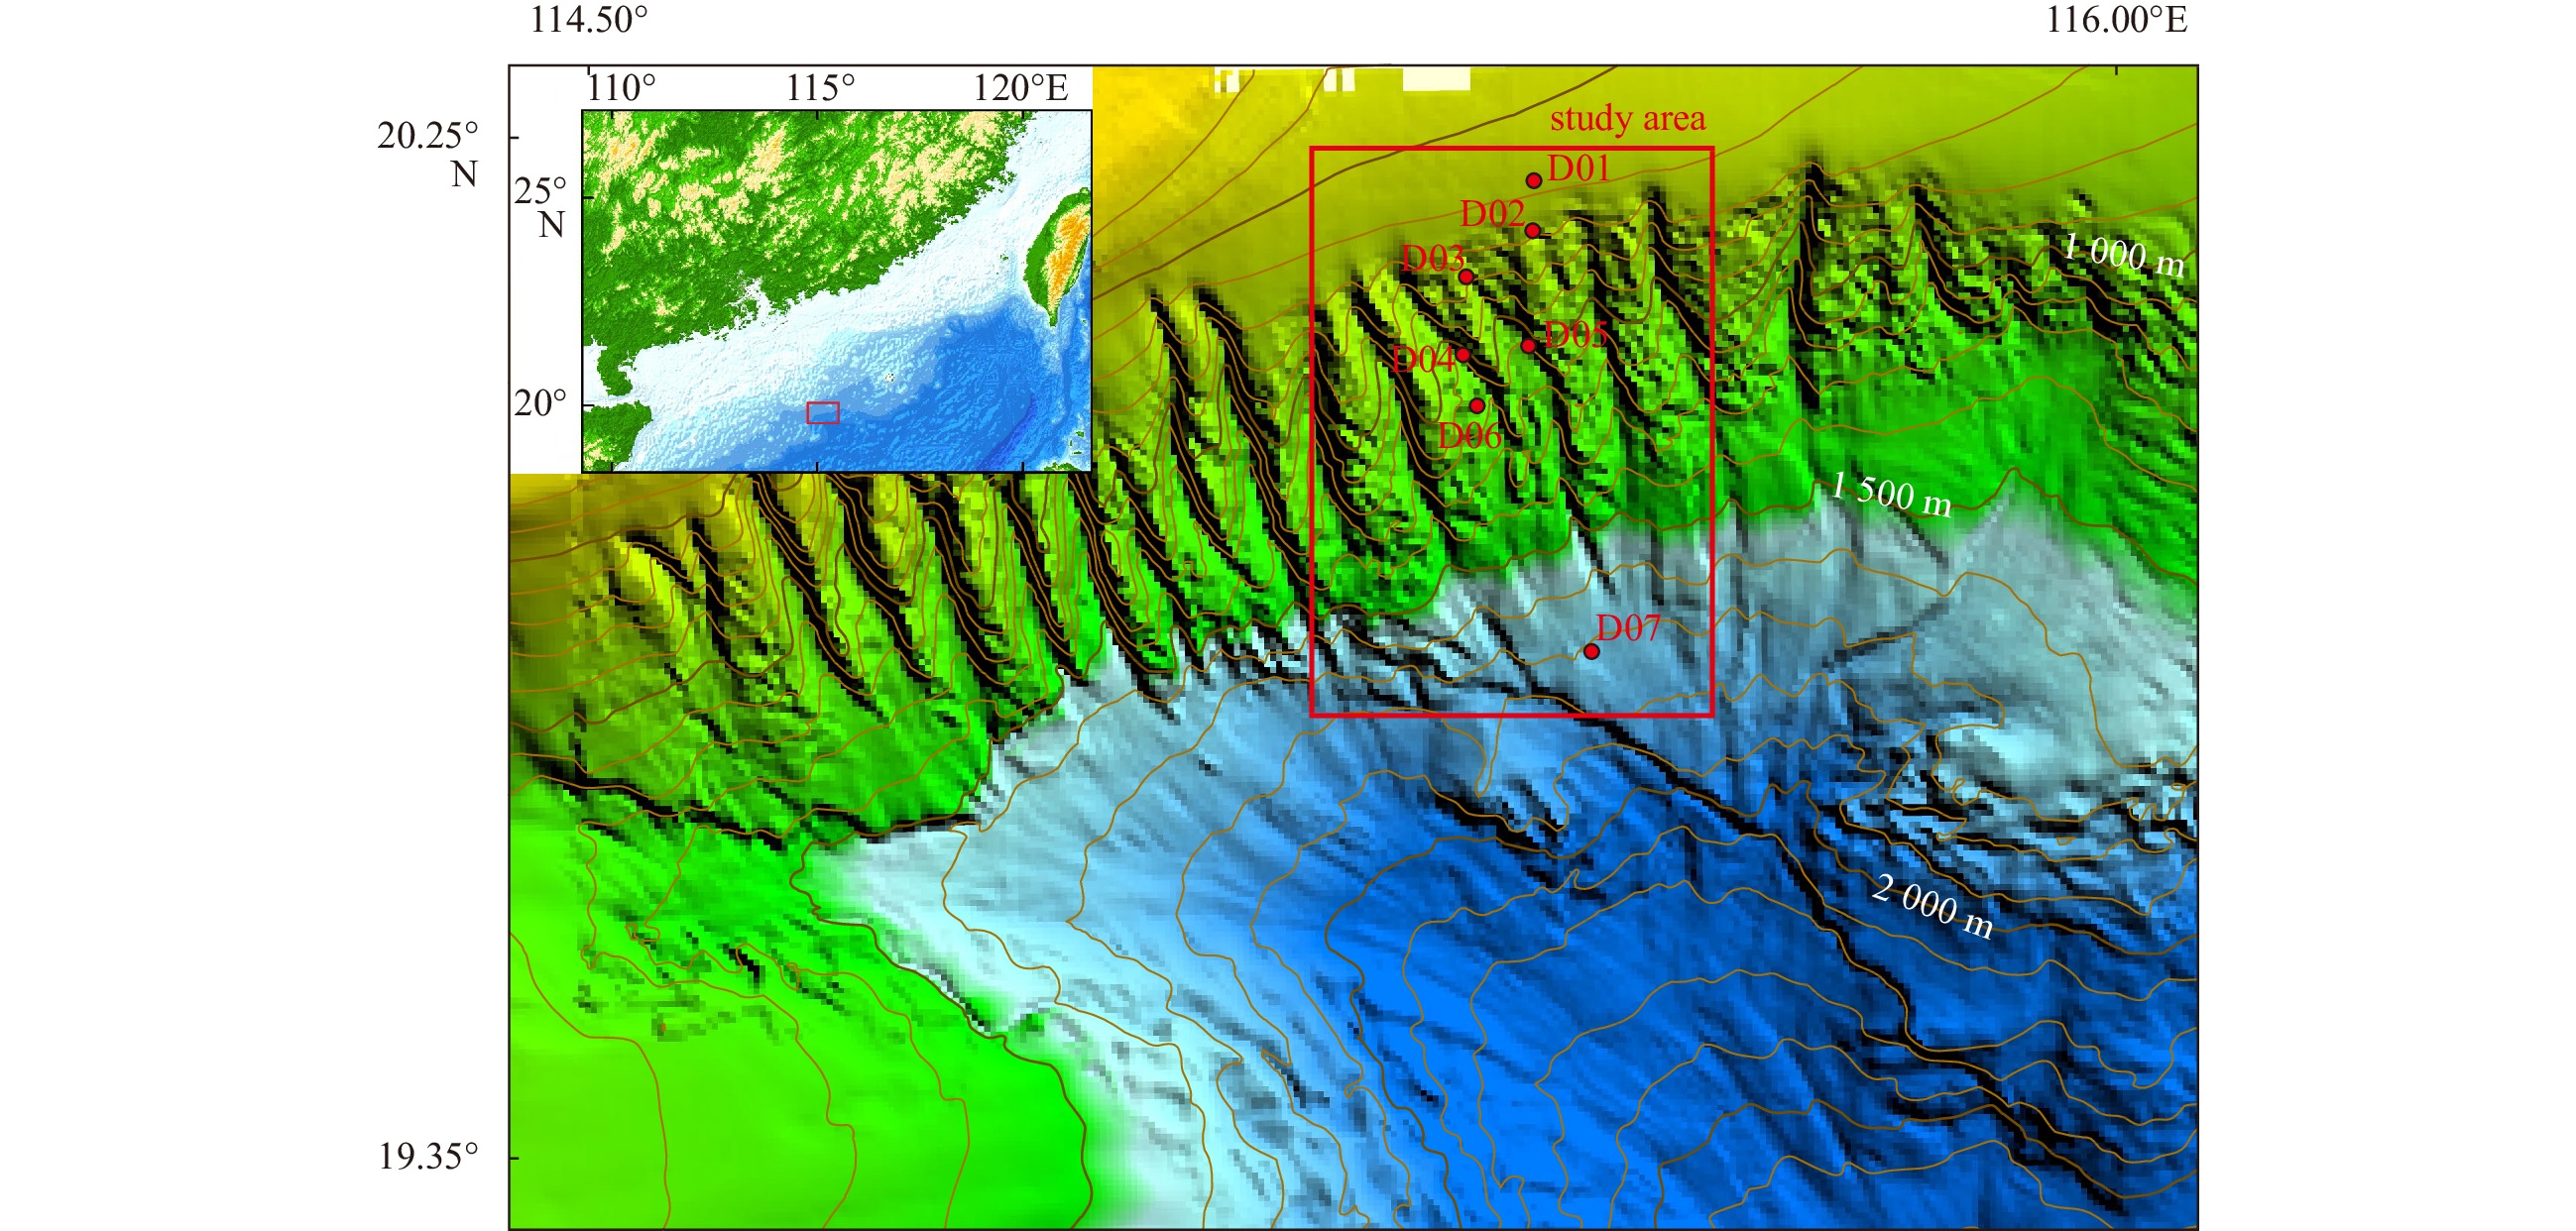
Geographical locations of the study area and sediment sampling points. Red dots denote boreholes. White numbers denote the value of the water depth contour line.
| Citation: | Jie Liu, Lejun Liu, Ping Li. Physical-mechanical properties of sediments and their correlation with near seafloor seismic amplitude in the Liwan canyon area, northern South China Sea[J]. Acta Oceanologica Sinica, 2023, 42(5): 130-138. doi: 10.1007/s13131-022-2070-9

|
Advances in exploration and development technology are making it possible to exploit oil and gas fields in deep-sea areas. Along with the experimental exploration and development of natural gas hydrates, deep-water oil and gas resources are becoming a major part of the growth of global oil and gas reserves. Compared with terrestrial or shallow-water oil and gas exploitation, deep-water oil and gas development faces more risks and challenges, including the instability of seafloor sediments (Seyyedattar et al., 2020). This instability may lead to hazards including submarine landslides, turbidity currents, and even tsunamis, which may destroy infrastructure facilities such as offshore platforms and submarine cables (Randolph et al., 2010; Yamada et al., 2012; Yuan et al., 2015; Li et al., 2019b). Prior to marine engineering construction, it is essential to understand the seafloor conditions, and this requires large-scale surveys including bathymetric measurements, geophysical surveys, and sediment sampling (Zhang et al., 2020). However, because of factors such as water depth, technology, and cost, drilling in deep-water areas is costly and difficult. It is, therefore, unrealistic to assess the physical-mechanical properties of sediments over an entire oil and gas field using geotechnical testing technology for core samples. Sampling and assessment are usually carried out only in potentially dangerous areas. Such incomplete and discontinuous surveys may lead to biases in our understanding of sediment properties and stability across the field and, thus, result in potential risks to safe oil and gas exploitation in deep-water areas.
The undrained shear strength of shallow strata is a critical parameter for safety design in deep-water operations (Li et al., 2019a). Laboratory and in situ test of undrained shear strength, and the decrease of sample disturbance effects are emphasized (Lunne and Andersen, 2007). Many empirical methods have been proposed for the evaluation of undrained shear strength of cohesive soils from Cone Penetration Test cone resistance data (Zein, 2017). In order to obtain more undrained shear strength data, a neural network computer program was used to estimate undrained shear strength based on a learned relationship between undrained shear strength measurements and the Multi-Sensor Core Logger and downhole wireline log data available (Paulson et al., 2006). With the increasing application of geophysical exploration, the relationship between undrained shear strength and geophysical data, such as chirp data, seismic data and acoustic impedance data, were gradually studied (Brand et al., 2003; Schock, 2004; Li et al., 2017; Zhou et al., 2020).
Existing geophysical data contain a wealth of information on the physical-mechanical properties of sediments (Davis et al., 2002; Kim et al., 2013; Wang et al., 2019). Currently, research indicates that there are significant correlations between acoustic parameters (such as acoustic frequency, acoustic impedance, echo intensity, and P-wave velocity) and physical-mechanical properties (such as sediment type, density, and shear strength), although the specific relationship may vary across different sea areas (Kim et al., 2001; Liu et al., 2004; Du and Chen, 2007; Hou et al., 2018; Wang et al., 2022). In seismic data, the seafloor usually corresponds to the first strong positive polarity reflection of each seismic trace (Evans et al., 2007). The intensity of near seafloor seismic amplitude is closely related to the acoustic impedance and shear strength of shallow sediments below the seafloor (Brand et al., 2003). On the basis of seismic and core testing data, it is possible to reveal the relationship between relevant seismic data parameters and sediment physical-mechanical properties and, thereby, use seismic data for the estimation of sediment physical-mechanical properties.
Our aim is to develop an economically feasible method for large-scale, full-coverage assessment of physical-mechanical sediment properties in deep-water areas and then use it in site selection for follow-up geological drilling. This method will be of scientific and economical significance for understanding the physical-mechanical properties of sediments in deep-water areas and ensuring the safe development of deep-water oil and gas fields. In this study, we carried out a preliminary investigation of the physical-mechanical properties of sediments, the distribution of near seafloor seismic amplitude, and their correlation, in the Liwan canyon study area. We used core sediment data collected at seven stations near the canyon area on the northern continental slope of the South China Sea and near seafloor seismic amplitude data from the study area. We propose a methodology to estimate the shear strength of marine sediments based on seismic data, to provide guidance for the selection of sampling sites and the evaluation of sediment stability in future research.
The South China Sea is located at the southern margin of the East Asian continent. The northern part of this sea is a passive continental margin with a series of submarine canyons (Fig. 1). These form complex topographic and geomorphic units and provide important channels for sediments from the Zhujiang River to enter the South China Sea basin via the continental shelf (Li et al., 2016; Lin et al., 2018; Su et al., 2020). The sedimentary evolution of the canyons is influenced by a combination of tectonic movements, monsoons, sea level change, and dynamic marine environmental change (Zhuo et al., 2019). The northern South China Sea is rich in oil and gas resources, and many petroliferous basins have developed in this region. The largest is the Zhujiang River Mouth Basin with a total area of ~26×104 km2 (He et al., 2017). The effect of sediment stability, gravity currents, and contour currents in the canyon area off the Zhujiang River mouth on the exploration and development of oil and gas resources has been recognized (Zhou et al., 2015; Jiang et al., 2017; Wang et al., 2018). Many submarine landslides of differing sizes have been identified in this region (He et al., 2014; Li et al., 2020), and these are one of the main factors influencing the formation and evolution of the canyon area. It is likely that more submarine landslides will occur, which poses new challenges to oil and gas development and marine engineering construction in this region (Xiu et al., 2015; Liu et al., 2019). The Liwan gas field is China’s first large-scale deep-water oil and gas field and it is also a demonstration project for deep-sea oil and gas development. Offshore platforms and submarine gas pipelines from the Liwan gas field are found near the submarine canyon area. Submarine slope stability and geological hazards such as submarine landslides are key risk factors that should be considered during the development of oil and gas resources in this region.
We obtained seven core sediment samples in the study area. The sampling locations are shown in Fig. 1, and the drilling depths were all over 40 m. All sediment samples were subjected to a set of standard laboratory tests for natural unit weight (density), water content, P-wave velocity, and undrained shear strength. The natural unit weight was measured using the ring sampler method. The water content was measured using the gravimetric method. The undrained shear strength was obtained using the electric vane shear tester.
The undrained shear strength of shallow strata is a critical parameter for safety design in deep-water operations (Li et al., 2019a), which refers to the ultimate capacity of sediment to resist shear failure. Water content refers to the ratio of the weight of water in sediment to the weight of sediment particles, which is affected by consolidation duration, burial depth, tidal current and other factors. It can reflect the state of sediment accumulation and the strength of interaction between sediment particles, and is calculated by the following formula:
| $$ \omega =(W_1-W_2)/W_1\times 100\%, $$ | (1) |
where ω is the water content (%); W1 is the weight of natural samples before drying (g); W2 is the weight of samples after drying (g).
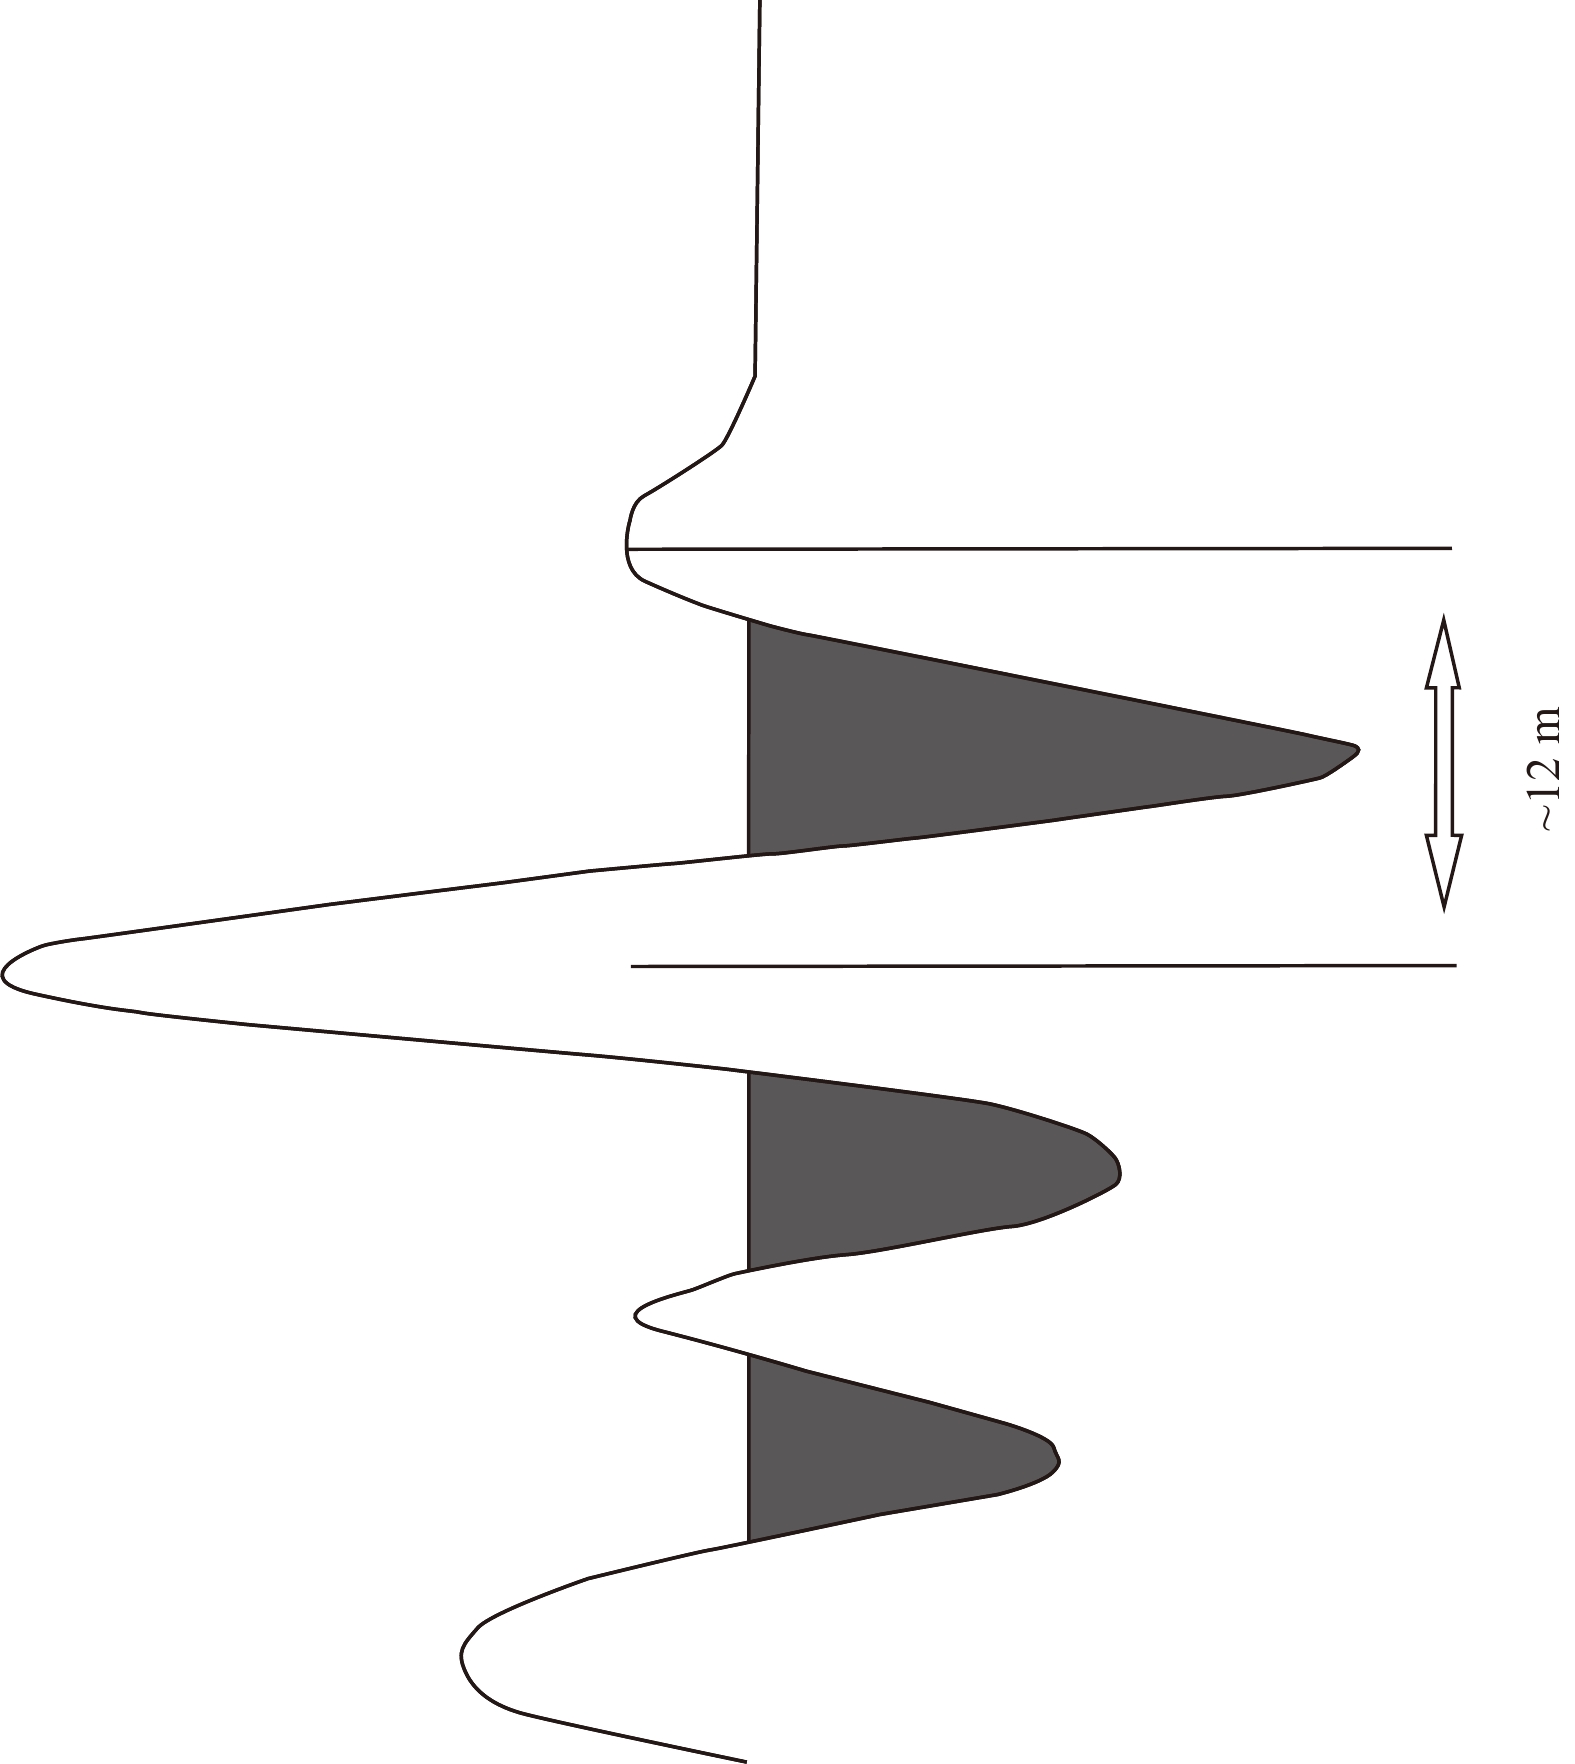
We also collected a large amount of three-dimensional (3D) seismic data covering the entire study area, from which we extracted near seafloor seismic amplitude data. In 3D seismic data, the seafloor usually corresponds to the first strong positive polarity reflection. Regardless of the influence of changes in water properties, for each seismic trace, the intensity of near seafloor seismic amplitude is closely related to the physical-mechanical properties of the sediments within a certain thickness under seabed. The thickness is confined by the dominant frequency of seismic records, and is approximately half of the dominant wavelength (the velocity divided by the dominant frequency) (Neidell and Poggiagliolmi, 1977; Li et al., 2017).
The dominant frequency of seismic data we used is 65 Hz, and the measured P-wave velocity of shallow sediments is between 1 377 m/s and 1 670 m/s in the study area (Li et al., 2017), so that half of dominant wavelength is ~12 m for a given P-wave velocity of 1 600 m/s and dominant frequency of 65 Hz in shallow sediments. Therefore, the near seafloor seismic amplitude used in this study can reflect the physical-mechanical properties of sediments up to ~12 m below the seafloor (mbsf; Fig. 2), and we focused on characterizing the physical-mechanical properties of core sediment samples in this layer and their relationship with near seafloor seismic amplitude.

A good correlation was found between the water content and bulk density and between the shear strength and the penetration resistance of sediments, but the sediment water content was not well correlated with shear strength in the boreholes in the study area. To understand the variation in the physical-mechanical sediment properties as a function of buried depth in different parts of the study area, and considering the correlations between various physical-mechanical parameters, we plotted the trend lines for the sediment water content and shear strength in each borehole as a function of buried depth (Fig. 3). Overall, the shear strength of sediments increased linearly with increasing buried depth. As the water depth of the boreholes increased, the growth rate of shear strength with increasing buried depth gradually decreased. In contrast, the water content of sediments decreased linearly with increasing buried depth. However, at Stations D01 and D03, the water content of sediments above 12 mbsf showed little variation with increasing buried depth, and the growth rate of sediment water content as a function of buried depth was not influenced by the location and water depth of the boreholes.
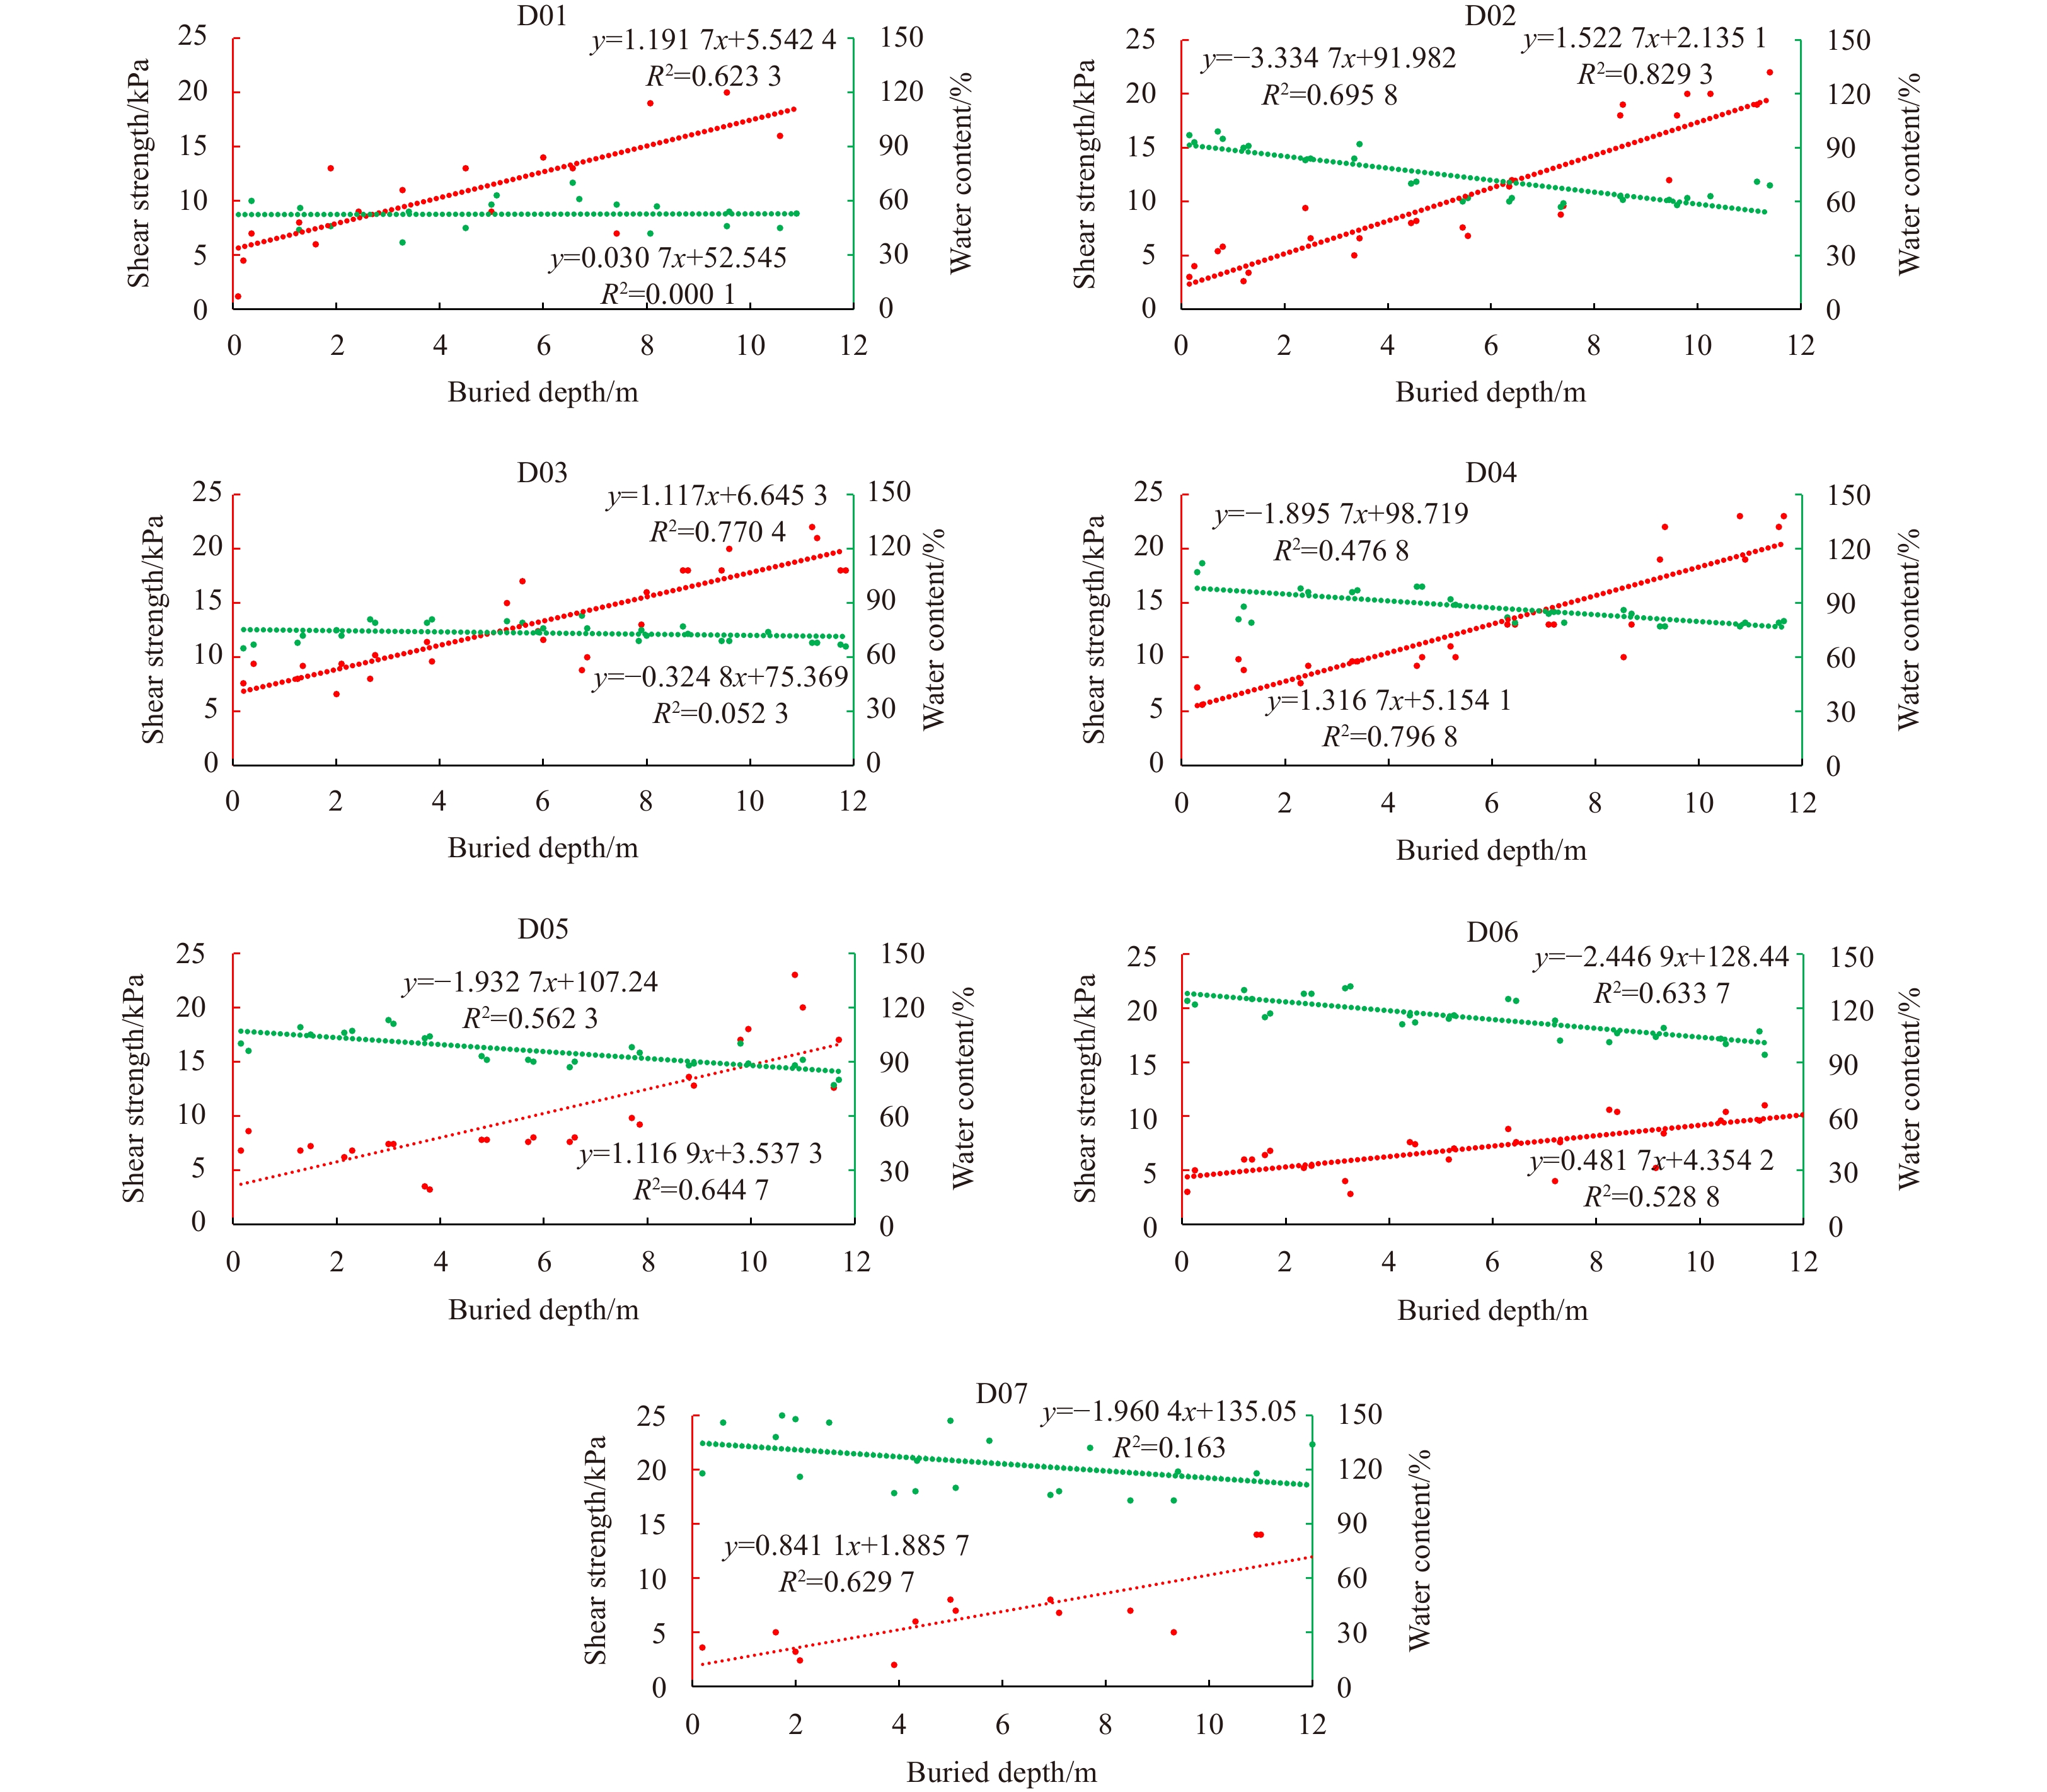
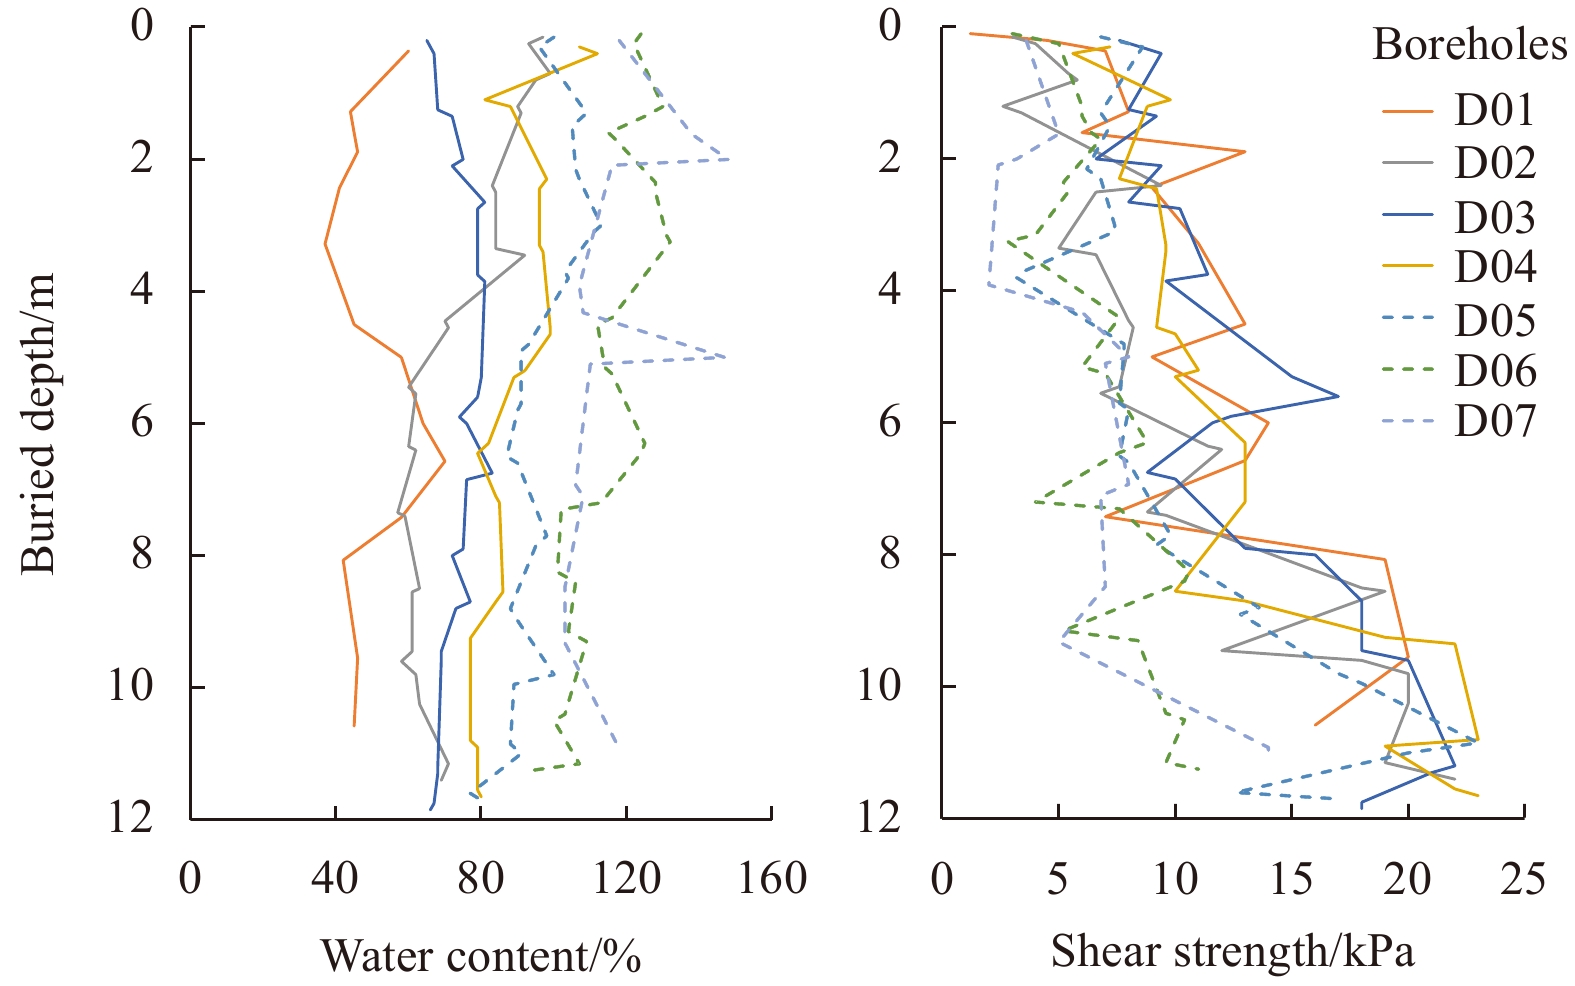
Figure 3 shows that the shear strength of sediments had different variations in the boreholes as a function of burial depth. To further understand these variations in relation to the boreholes drilled at different locations in the canyon area, we examined the trend lines of sediment shear strength as a function of buried depth in the seven boreholes in the study area (Fig. 4), which allowed a better analysis of the separate characteristics of sediment mechanical properties. We found that Boreholes D01, D02, D03, and D04 were of a similar type. All of them had a relatively large rate of variation in sediment shear strength as a function of buried depth, between 1.1 kPa/m and 1.5 kPa/m. Boreholes D06 and D07 belonged to a different type and both had a relatively small rate of variation in sediment shear strength as a function of buried depth, between 0.5 kPa/m and 0.8 kPa/m. Borehole D05 was located in the transition zone between the above two groups of boreholes; above 8 mbsf, there was little variation in the shear strength of sediments as a function of buried depth, whereas below 8 mbsf, the shear strength of sediments increased rapidly with greater buried depth.
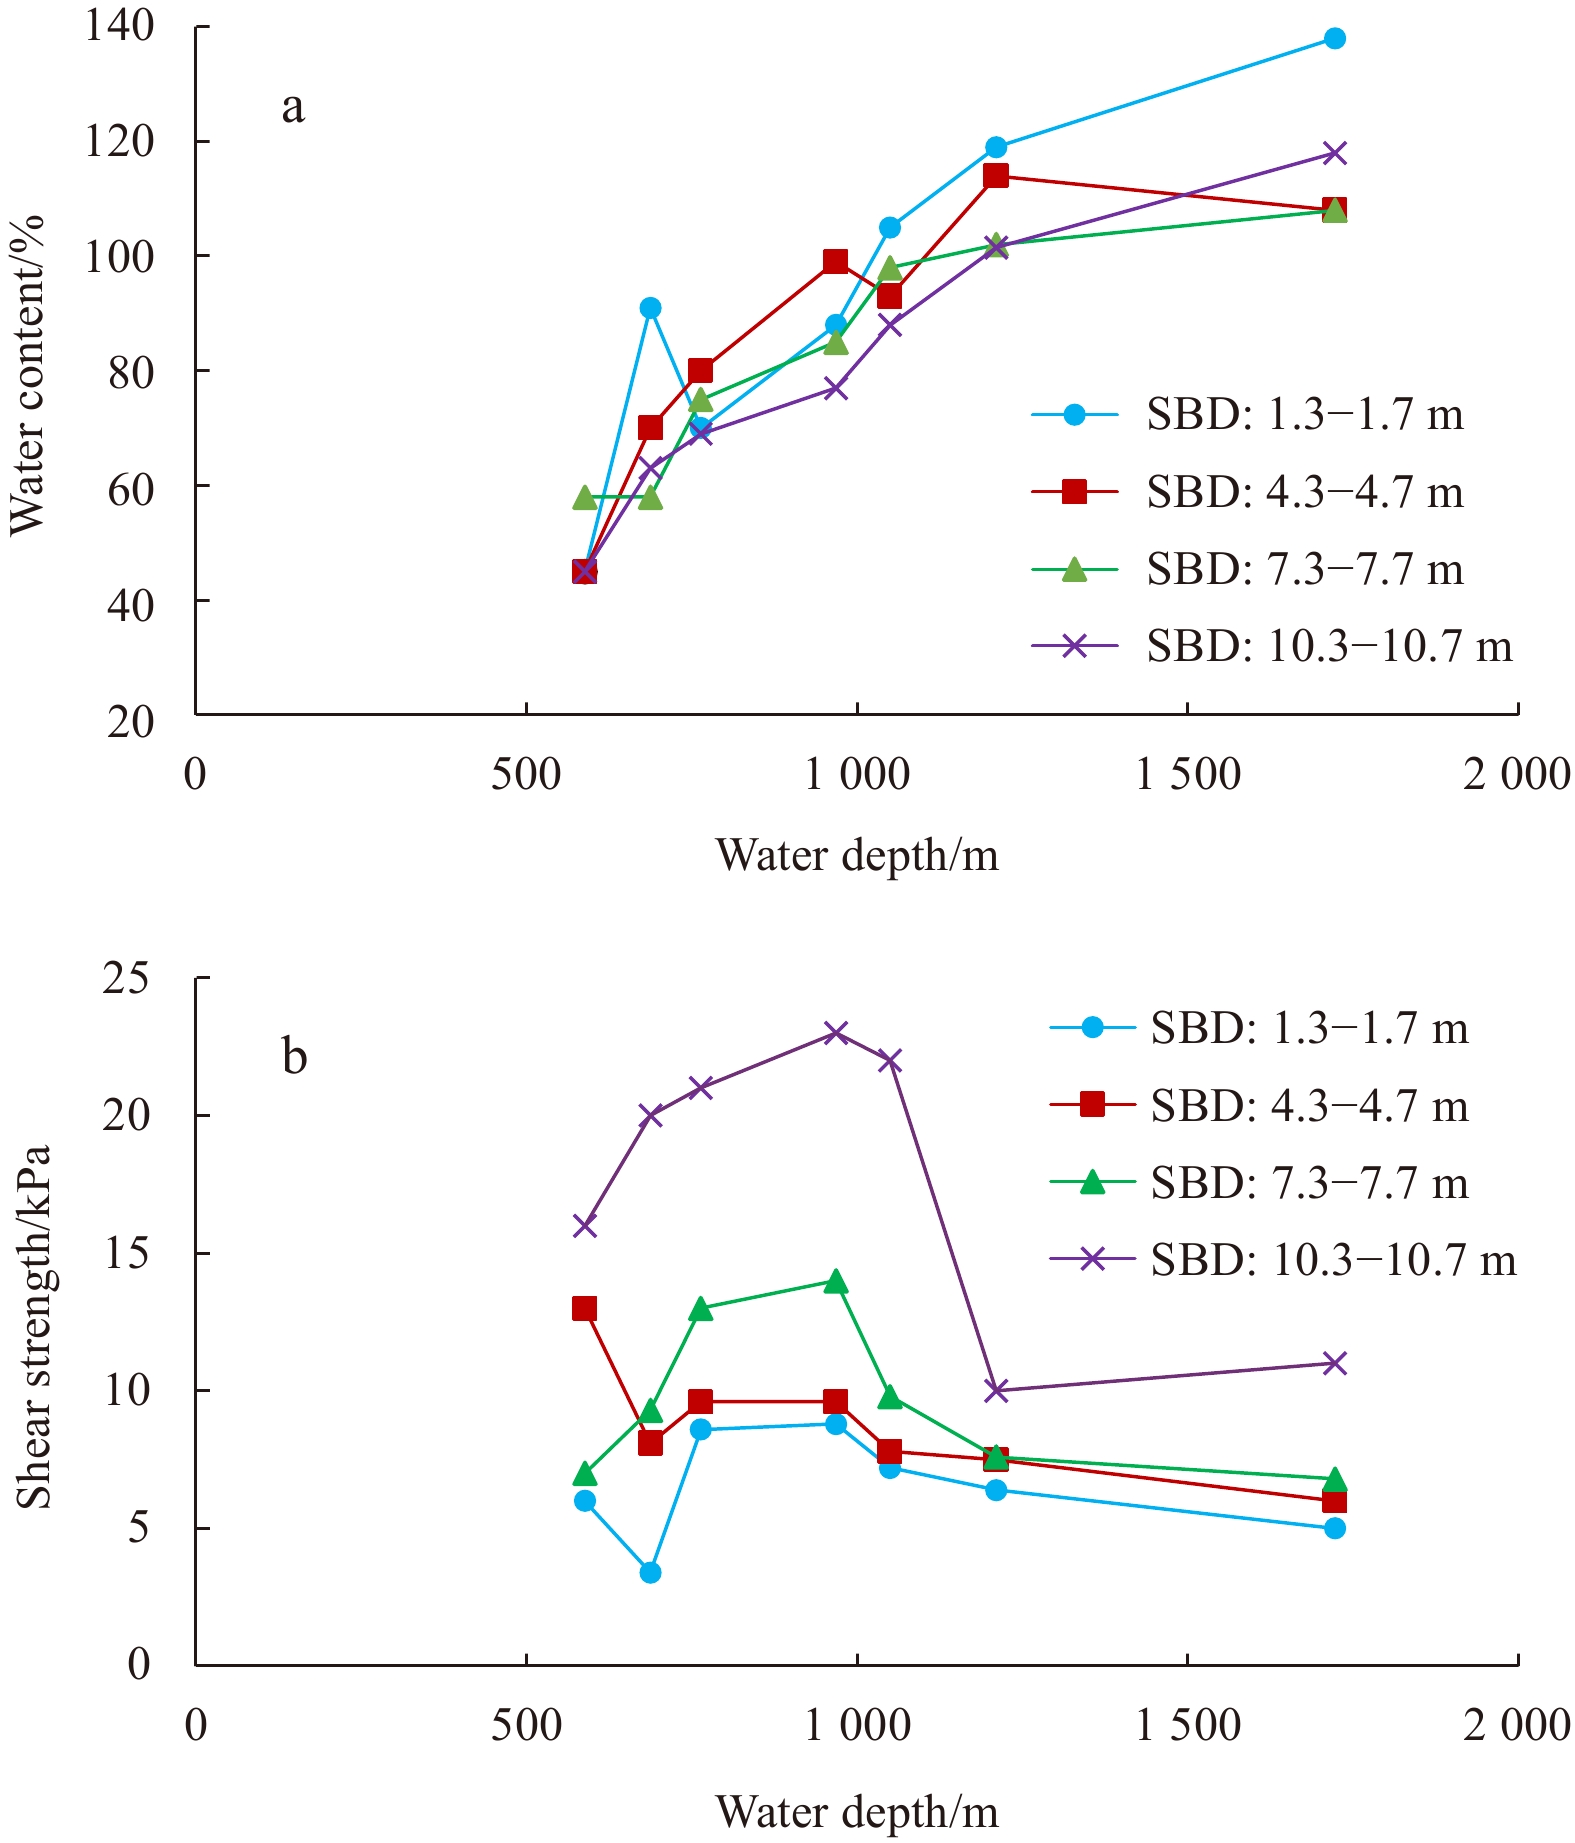
To illustrate the characteristics of sediment shear strength and water content in the boreholes drilled at different water depths more clearly, we plotted the undrained shear strength and water content of different buried depth above 12 mbsf against water depth of the boreholes (Fig. 5). These two parameters had different correlations with the water depth of the boreholes. With increasing water depth, the water content of different buried depth showed a significant logarithmic growth trend, and they were highly correlated. In contrast, the undrained shear strength had no strong correlation with increasing water depth, although there was an evident trend of variation. Compared with deeper water, the values of undrained shear strength in the same buried depth were greater when the water depth was less than 1 000 m. Within water depths of 1 000–1 300 m, the undrained shear strength of sediments decreased rapidly with increasing water depth, especially when the buried depth was 10.3–10.7 m. These results indicated that the shear strength of sediments above 12 mbsf showed completely different characteristics depending on the water depth ranges.

The intensity of near seafloor seismic amplitude has a close relationship with the acoustic impedance and shear strength of shallow sediments below the seafloor. To develop an estimation method for the mean shear strength of sediments above 12 mbsf, based on near seafloor seismic amplitude, first required us to establish a correlation between the mean shear strength of sediments above 12 mbsf and the corresponding near seafloor seismic amplitude. Because the tests for sediment shear strength and water content were not performed by sampling at equal intervals, we could not simply average all the test data of shear strength and water content from a borehole to calculate their mean values. Figure 3 shows that the shear strength and water content of sediments varied linearly as a function of buried depth in the boreholes. In particular, the correlation coefficients between the shear strength and buried depth of sediments were all above 0.7. Therefore, we calculated the mean shear strength and water content of sediments in the 12 mbsf layer of the boreholes based on linear correlation equations for the shear strength, water content, and buried depth of sediments in the respective boreholes (Table 1). The seven boreholes were distributed in two canyons at water depths of 600–1 700 m. Above 12 mbsf, there were mainly fine-grained sediments in the study area, and the main sediment type was silty clay. Boreholes D02 and D04 partially contained a clay layer. With increasing water depth, the mean water content gradually increased, whereas the mean shear strength decreased rapidly at water depths below 1 000 m. However, the variation in near seafloor seismic amplitude as a function of water depth lacked a regular pattern.
| Boreholes | Main sediment type | Water depth/m | Gradient angle/(°) | Mean water content/% | Mean shear strength/kPa | Seismic amplitude |
| D01 | silty clay | 588 | 0.96 | 52.73 | 12.69 | 114 828 |
| D02 | silty clay-clay | 682 | 1.99 | 71.97 | 11.27 | 92 948 |
| D03 | silty clay | 763 | 9.43 | 73.42 | 13.35 | 149 033 |
| D04 | silty clay-clay | 965 | 5.71 | 87.33 | 13.05 | 123 957 |
| D05 | silty clay | 1 046 | 7.73 | 95.64 | 10.24 | 58 980 |
| D06 | silty clay | 1 208 | 2.89 | 113.76 | 7.24 | 115 207 |
| D07 | silty clay | 1 722 | 1.15 | 123.29 | 6.93 | 137 348 |
 DownLoad:
CSV
DownLoad:
CSV
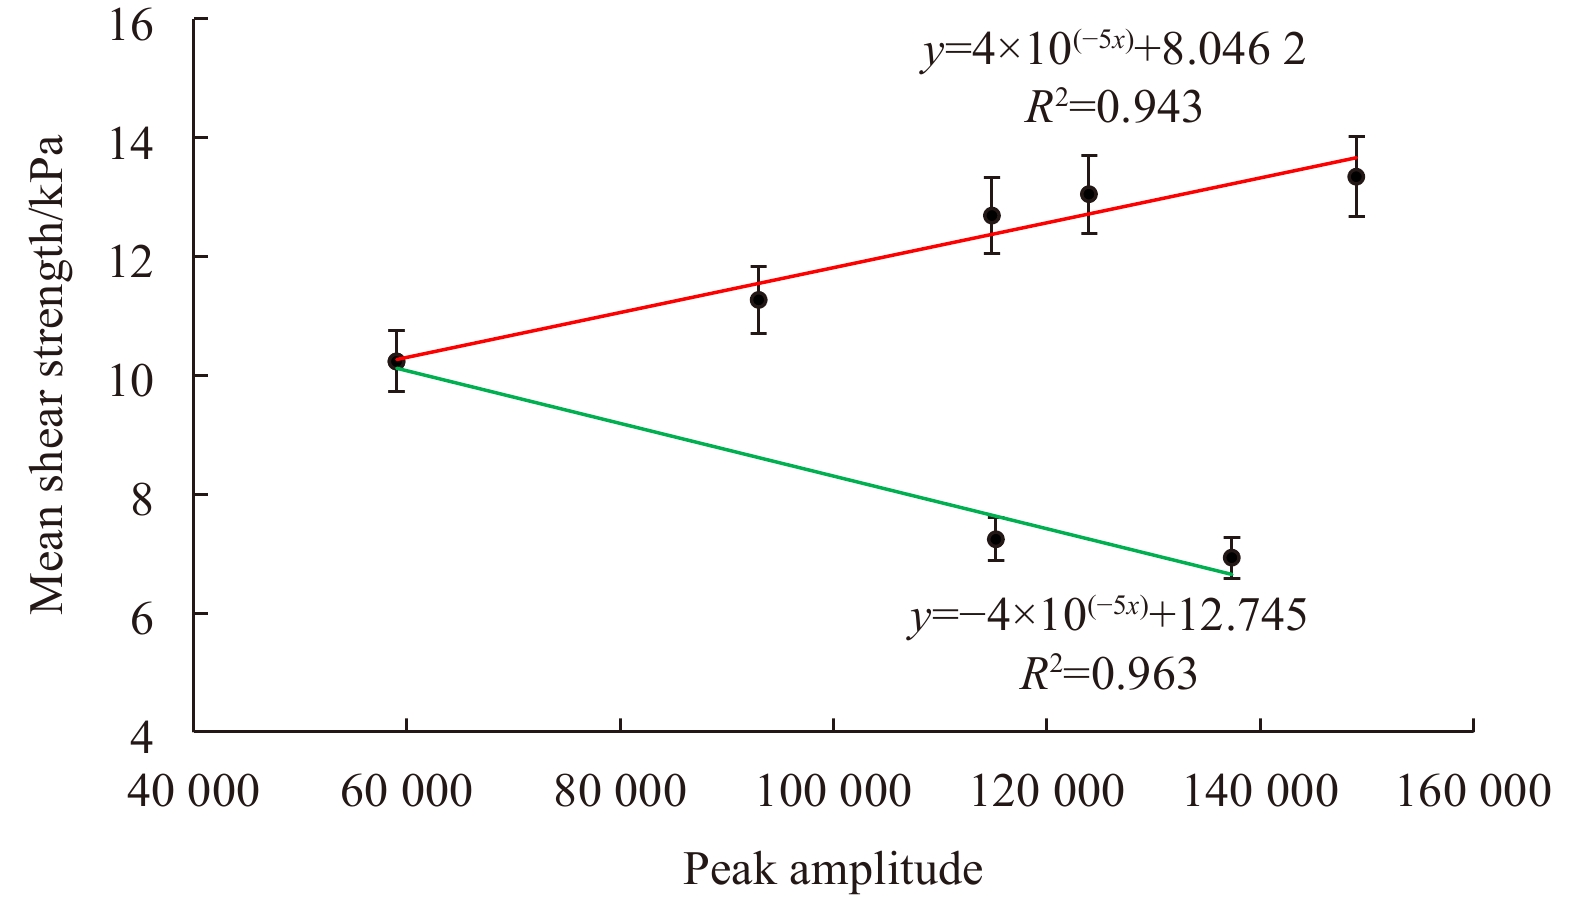
To establish the correlation between the mean shear strength of sediments above 12 mbsf and near seafloor seismic amplitude, we created a scatter plot of these two variables in the boreholes in the study area (Fig. 6). As the shear strength increased from 6 kPa to 14 kPa, the near seafloor seismic amplitude first decreased and then increased, with an inflection point observed at the mean shear strength of 10 kPa. When the mean shear strength was greater than 10 kPa, this parameter had a significant positive correlation with the near seafloor seismic amplitude; when the mean shear strength was less than 10 kPa, this parameter had a significant negative correlation with the near seafloor seismic amplitude. The results indicated that above 12 mbsf, the boundary of mean shear strength greater than and less than 10 kPa was located at a water depth of ~1 000 m in the study area. Therefore, we obtained a preliminarily correlation between the mean shear strength of sediments above 12 mbsf and near seafloor seismic amplitude in the study area as follows:

| $$ \begin{split}&{\tau _f} = 4 \times {10^{ - 5A}} + 8.046\;2\\ &({\rm{applicable}}\; {\rm{for}}\; {\rm{sediments}}\; {\rm{with}}\; {\rm{water}}\; {\rm{depth}} \leqslant 1\; 000\;{\rm{m}}), \end{split}$$ | (2) |
| $$ \begin{split}&{\tau _f} = - 4 \times {10^{ - 5A}} + 12.745\\ &({\rm{applicable}}\; {\rm{for}}\; {\rm{sediments}}\; {\rm{with}}\; {\rm{water}}\; {\rm{depth}} > 1\; 000\; {\rm{m}}),\end{split} $$ | (3) |
where
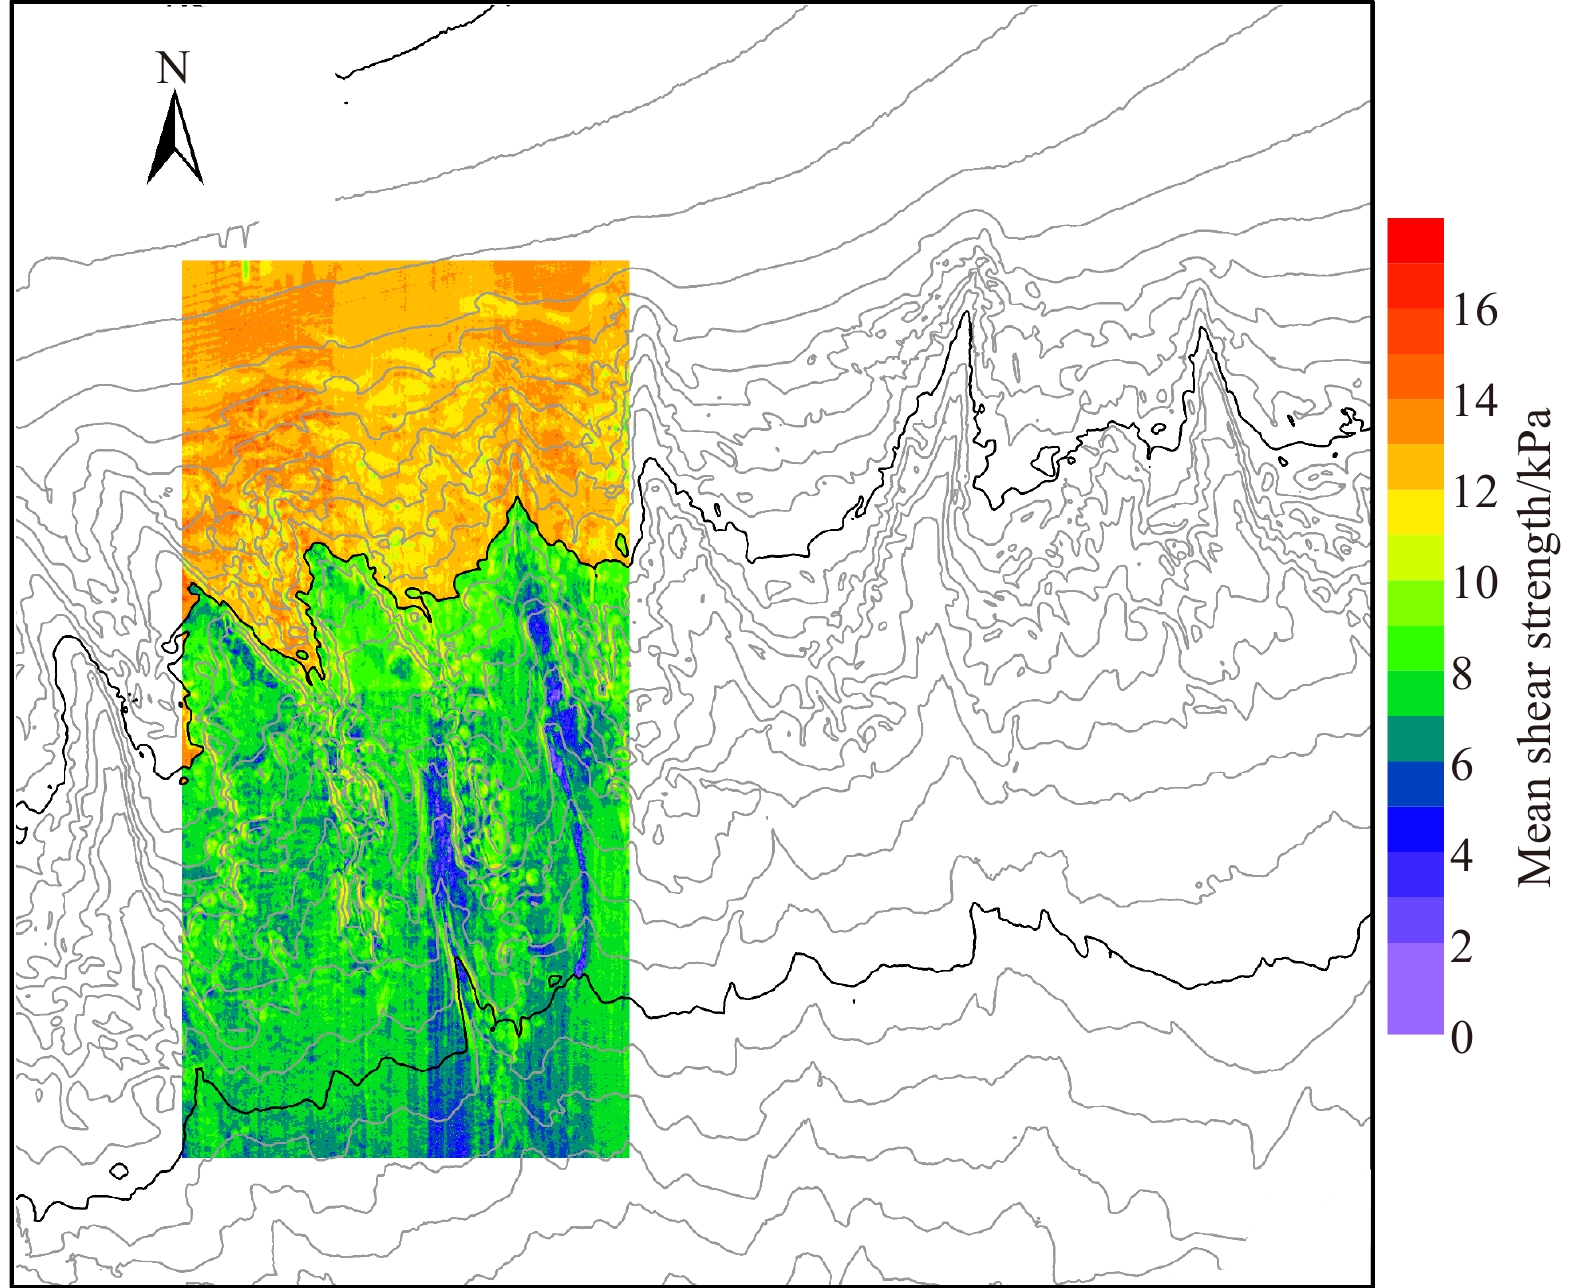
Based on the near seafloor seismic amplitude data from the study area, we draw a superposed graph of near seafloor seismic amplitude and bathymetric contour (Fig. 7). In the study area, the near seafloor seismic amplitude basically varied in the range 5 000–25 000, with relatively large values in the lower part of the canyon area as a whole. Larger seismic amplitude appeared along the extension direction of the canyons outside their entrances, whereas slightly smaller values were evenly distributed in the shelf area of the upper canyon. The near seafloor seismic amplitude showed large variation across the canyon area. For a single canyon, the near seafloor seismic amplitude was considerably smaller on both sides of the canyon walls with a larger submarine slope gradient, whereas the amplitude values at the bottom of the canyon with a small slope gradient were significantly larger than on the canyon walls.

By comparing the mean shear strength of sediments above 12 mbsf of each core with the corresponding value of near seafloor seismic amplitude, we established the correlation between the two parameters. With increasing values of mean shear strength, the near seafloor seismic amplitude first decreased and then increased, with an inflection point observed at the mean shear strength of 10 kPa. Combined with the correlation between the mean shear strength of sediments above 12 mbsf and water depth of the boreholes (Fig. 5), we found that when the water depth was less than 1 000 m, the areas with lower near seafloor seismic amplitude corresponded to shallow sediments with smaller shear strength values, whereas the areas with high near seafloor seismic amplitude corresponded to greater shear strength values. When the water depth was greater than 1 000 m, the correlation between the two parameters was completely reversed. Near seafloor seismic amplitude spectra were calibrated using the measured shear strength data from the cores in the study area to obtain a distribution map of shear strength based on estimation from the near seafloor seismic amplitude. For the sake of caution, we only show the spectra of shear strength in the two canyons where the seven boreholes were located (Fig. 8). In the study area, the mean shear strength of shallow sediments gradually decreased with increasing water depth. At the head of the canyons, the shear strength of sediments was considerably larger than lower down, whereas on the flat seafloor at the bottom of the canyons, the shear strength of sediments was generally low. Inside the canyons, the shear strength of sediments was characterized by larger values in the canyon walls on both sides and smaller values at the bottom of the canyons. This result is consistent with the theory of infinite slope stability, whereby in areas with a larger submarine slope gradient, sediments have a higher strength to maintain a comparatively stable state.
In 3D seismic data, the seafloor usually corresponds to the first strong positive polarity reflection. This strong reflection is produced because of the large density and velocity differences of the media above and below the interface between seawater and seafloor sediments (Painter et al., 1995; Nibbelink and Martinez, 1998). The amplitude of the reflected wave relative to the incident wave is dependent on the acoustic impedance of the two materials (Sheriff, 1975; Brand et al., 2003), expressed by the reflection coefficient as follows:
| $$ R{\text{ = }}\frac{{{A_R}}}{{{A_I}}} = \frac{{{I_2} - {I_1}}}{{{I_2} + {I_1}}} = \frac{{{\rho _2}{V_2} - {\rho _1}{V_1}}}{{{\rho _2}{V_2} + {\rho _1}{V_1}}} , $$ | (4) |
where R is the reflection coefficient (−1 to +1); I is the acoustic impedance, which equals the product of velocity (V) and density (ρ); ρ1 and ρ2 are the densities of the media above and below the interface, respectively; and V1 and V2 are the velocities of the media above and below the interface, respectively.
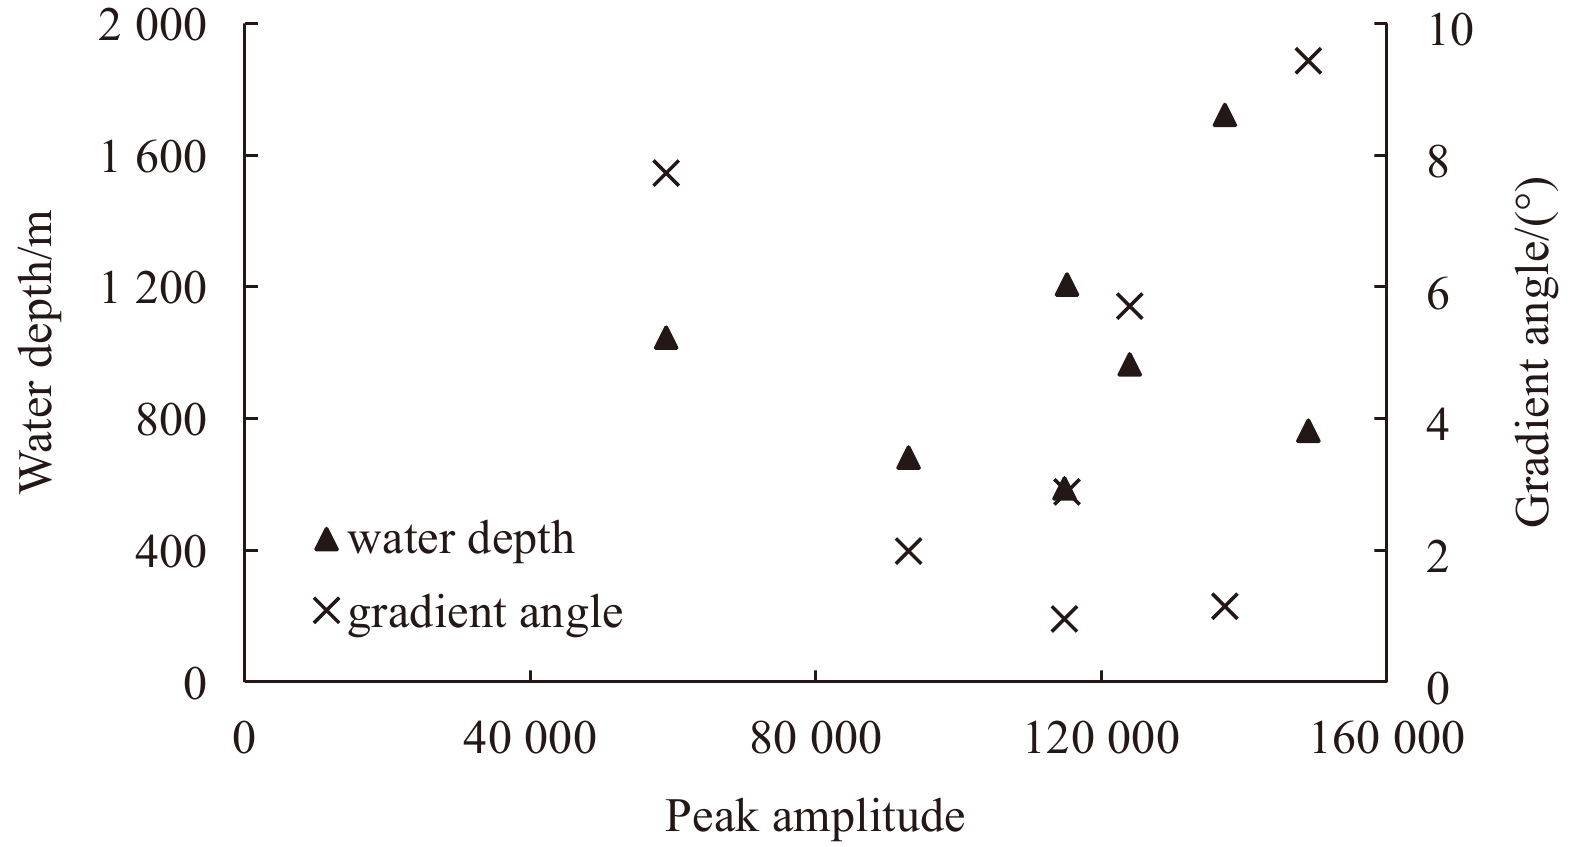
Based on the equations for the amplitude of the reflected wave relative to the incident wave, the near seafloor seismic amplitude mainly depends on the differences in the density and wave velocity of the two media in the case of constant incident wave amplitude because the density and wave velocity of water change very little. Therefore, regardless of the influence of water, for each seismic trace, the intensity of near seafloor seismic amplitude is closely related to the physical-mechanical properties of seafloor shallow sediments and is less influenced by water depth and submarine slope gradient. When establishing the correlation between near seafloor seismic amplitude and the mean shear strength of shallow sediments, we can ignore the influences of water depth and topography on their relationship. To verify this, we analyzed the data of near seafloor seismic amplitude, water depth, and submarine slope gradient at the locations of the seven boreholes and drew scatter plots of their correlations (Fig. 9). No significant correlation was found between near seafloor seismic amplitude and water depth or submarine slope gradient. Among the seven characteristic point locations analyzed in this study, both the maximum and minimum values of near seafloor seismic amplitude appeared at the two points with the largest slope gradient. The scatter plot of near seafloor seismic amplitude against water depth was even more disorderly. All these results indicate that in the case of constant incident wave, the inherent properties of shallow sediments are the main factors influencing the near seafloor seismic amplitude in a specific area.
In this study, we first conducted tests of the indices of physical-mechanical properties of borehole sediments obtained from the study area and then selected two characteristic indices—water content and shear strength—to explore their vertical and horizontal distribution. We found that the mean shear strength of sediments above 12 mbsf tended to decrease rapidly at a water depth of 1 000 m. Moreover, according to the analysis of near seafloor seismic amplitude and the mean shear strength in the boreholes, with the 1 000-m depth contour as the boundary, the near seafloor seismic amplitude on each side of the boundary showed a completely opposite correlation with the mean sediment shear strength of corresponding sediments. Therefore, linear correlation Eqs (2) and (3) were derived. Using these two equations, we performed an estimation of the horizontal distribution characteristics of mean shear strength of shallow sediments in areas near the boreholes based on the near seafloor seismic amplitude data from the study area. The methods and results reported in this study are innovative to some extent.
Owing to limitations from factors such as sampling cost, this study analyzed the correlation between near seafloodr seismic amplitude and mean shear strength using the data from only seven boreholes. Although the obtained correlations were very strong, with correlation coefficients close to 1, the representativeness of the equations needs to be further verified. Previous research has indicated that near seafloor seismic amplitude has a linear positive correlation with the mean wave impedance of sediments, whereas the mean shear strength of sediments is exponentially positively correlated with their mean wave impedance (Brand et al., 2003; Li et al., 2017). However, the scatter plots provided by the previous research showed that the mean wave impedance of sediments had two distinct inflection points at the mean shear strength values of 11 kPa and 700 pounds per square foot (psf), respectively. In other words, the mean wave impedance of sediments, the near seafloor seismic amplitude, and the mean shear strength had different correlations on each side of the mean shear strength values of 11 kPa and 700 psf. This finding indirectly corroborates the conclusion in our present study. The results of our study can be used as a quantitative approach to determine the initial distribution of physical-mechanical sediment properties in the study area. The proposed estimation method can also be verified during future research. Moreover, the correlation between the two parameters can be further verified during depth prediction for future gravity core sediment sampling and the acquisition of new geological samples and data in the study area.
A large amount of high-resolution, full-coverage 3D seismic data can be obtained during submarine oil and gas resource exploration and marine engineering construction. Using geological data and seismic data from existing boreholes in the study area, this study revealed the correlation between near seafloor seismic amplitude and the mean shear strength of shallow sediments in this area, and developed an estimation method to estimate the mean shear strength of shallow sediments based on near seafloor seismic amplitude. The distribution of the shear strength of shallow sediments across the entire area was obtained by calibrating the near seafloor seismic amplitude spectra in a specific area with part of the borehole data. The results directly provide full-coverage input parameters for regional sediment stability assessment and numerical simulation. This can be used to accurately predict the location, area, critical thickness, and landslide volume of possible shallow slope instability failure in the study area. This could enable oilfield and marine engineering construction personnel to identify the location and potential risk of shallow slope failure, thereby reducing the impact of such hazards.
When applying the present results to another sea area, the correlation between 3D near seafloor seismic amplitude and the shear strength of shallow sediments may vary because different seismic data will be used. Therefore, using the present estimation method for the mean shear strength of shallow sediments based on near seafloor seismic amplitude to formulate sediment borehole sampling schemes in the study area may result in biases. Nonetheless, after calibrating the correlation between near seafloor seismic amplitude and shallow sediment shear strength with the field survey data from several cores obtained at the initial stage, it is possible to quickly obtain a shear strength dataset of shallow sediments in the study area based on estimation from seismic data. Then, the horizontal distribution characteristics of shear strength in the study area can be used to guide the design of sediment sampling stations and predict the sample size, penetration depth, and sediment core recovery required for sampling at specific stations with relative accuracy.
(1) The strength values of sediments increased linearly with increasing buried depth, and the water content showed an inverse trend in the seven boreholes in the study area. The mean shear strength of sediments in the upper 12 mbsf of the boreholes decreased rapidly at a water depth of 1 000 m, whereas the mean water content tended to increase gradually with increasing water depth.
(2) The near seafloor seismic amplitude data used in the study were able to reflect the characteristics of mean shear strength of sediments above 12 mbsf. When the mean shear strength was greater than 10 kPa or the water depth was less than 1 000 m, a significant linear positive correlation was found between mean shear strength and near seafloor seismic amplitude. Otherwise, a significant linear negative correlation was observed between mean shear strength and near seafloor seismic amplitude.
(3) On the basis of the near seafloor seismic amplitude data, an estimation for the distribution characteristics of sediment shear strength in the study area was implemented. Generally, the mean shear strength of sediments above 12 mbsf decreased with increasing water depth in the study area. Inside the canyons, the mean shear strength of sediments was characterized by larger values in the canyon walls on both sides and smaller values at the bottom of the canyon.
|
Brand J R, Lanier D L, Berger W J III, et al. 2003. Relationship between near seafloor seismic amplitude, impedance, and soil shear strength properties and use in prediction of shallow seated slope failure. In: Proceedings of the 35th Offshore Technology Conference (OTC). Houston, TX: OTC
|
|
Davis A, Haynes R, Bennell J, et al. 2002. Surficial seabed sediment properties derived from seismic profiler responses. Marine Geology, 182(1–2): 209–223
|
|
Du Dewen, Chen Yongqi. 2007. Investigation of the relationship between seafloor echo strength and sediment type—a case study in Jiaozhou Bay, China. Geo-Marine Letters, 27(5): 339–344. doi: 10.1007/s00367-007-0056-4
|
|
Evans R J, Stewart S A, Davies R J. 2007. Phase-reversed seabed reflections in seismic data: examples related to mud volcanoes from the South Caspian Sea. Geo-Marine Letters, 27(2–4): 203–212
|
|
He Ye, Zhong Guangfa, Wang Liaoliang, et al. 2014. Characteristics and occurrence of submarine canyon-associated landslides in the middle of the northern continental slope, South China Sea. Marine and Petroleum Geology, 57: 546–560. doi: 10.1016/j.marpetgeo.2014.07.003
|
|
He Min, Zhuo Haiteng, Chen Weitao, et al. 2017. Sequence stratigraphy and depositional architecture of the Pearl River Delta system, northern South China Sea: An interactive response to sea level, tectonics and paleoceanography. Marine and Petroleum Geology, 84: 76–101. doi: 10.1016/j.marpetgeo.2017.03.022
|
|
Hou Zhengyu, Chen Zhong, Wang Jingqiang, et al. 2018. Acoustic impedance properties of seafloor sediments off the coast of southeastern Hainan, South China Sea. Journal of Asian Earth Sciences, 154: 1–7. doi: 10.1016/j.jseaes.2017.12.003
|
|
Jiang Jing, Shi Hesheng, Lin Changsong, et al. 2017. Sequence architecture and depositional evolution of the Late Miocene to quaternary northeastern shelf margin of the South China Sea. Marine and Petroleum Geology, 81: 79–97. doi: 10.1016/j.marpetgeo.2016.12.025
|
|
Kim H S, Cho G C, Lee J Y, et al. 2013. Geotechnical and geophysical properties of deep marine fine-grained sediments recovered during the second Ulleung Basin Gas Hydrate expedition, East Sea, Korea. Marine and Petroleum Geology, 47: 56–65. doi: 10.1016/j.marpetgeo.2013.05.009
|
|
Kim D C, Sung J Y, Park S C, et al. 2001. Physical and acoustic properties of shelf sediments, the South Sea of Korea. Marine Geology, 179(1–2): 39–50
|
|
Li Wei, Alves T M, Rebesco M, et al. 2020. The Baiyun Slide Complex, South China Sea: A modern example of slope instability controlling submarine-channel incision on continental slopes. Marine and Petroleum Geology, 114: 104231. doi: 10.1016/j.marpetgeo.2020.104231
|
|
Li Yanlong, Hu Gaowei, Wu Nengyou, et al. 2019a. Undrained shear strength evaluation for hydrate-bearing sediment overlying strata in the Shenhu area, northern South China Sea. Acta Oceanologica Sinica, 38(3): 114–123. doi: 10.1007/s13131-019-1404-8
|
|
Li Xishuang, Liu Baohua, Liu Lejun, et al. 2017. Prediction for potential landslide zones using seismic amplitude in Liwan gas field, northern South China Sea. Journal of Ocean University of China, 16(6): 1035–1042. doi: 10.1007/s11802-017-3308-6
|
|
Li Linlin, Shi Fengyan, Ma Gangfeng, et al. 2019b. Tsunamigenic Potential of the Baiyun Slide Complex in the South China Sea. Journal of Geophysical Research: Solid Earth, 124(8): 7680–7698. doi: 10.1029/2019JB018062
|
|
Li Xishuang, Zhou Qingjie, Su Tianyun, et al. 2016. Slope-confined submarine canyons in the Baiyun deep-water area, northern South China Sea: variation in their modern morphology. Marine Geophysical Research, 37(2): 95–112. doi: 10.1007/s11001-016-9269-0
|
|
Lin Changsong, He Min, Steel R J, et al. 2018. Changes in inner- to outer-shelf delta architecture, Oligocene to Quaternary Pearl River shelf-margin prism, northern South China Sea. Marine Geology, 404: 187–204. doi: 10.1016/j.margeo.2018.07.009
|
|
Liu Jie, Liu Lejun, Li Ping, et al. 2019. Geotechnical properties and stability of the submarine canyon in the northern South China Sea. Acta Oceanologica Sinica, 38(11): 91–98. doi: 10.1007/s13131-019-1501-8
|
|
Liu Jin-Yuan, Tsai Sheng-Hsiung, Wang Chau-Chang, et al. 2004. Acoustic wave reflection from a rough seabed with a continuously varying sediment layer overlying an elastic basement. Journal of Sound and Vibration, 275(3–5): 739–755
|
|
Lunne T, Andersen K H. 2007. Soft clay shear strength parameters for deepwater geotechnical design. In: Proceedings of the 6th International Offshore Site Investigation and Geotechnics Conference: Confronting New Challenges and Sharing Knowledge. London: Society for Underwater Technology, 151–176
|
|
Neidell N S, Poggiagliolmi E. 1977. Stratigraphic modeling and interpretation-geophysical principles and techniques: Section 3. Stratigraphic models from seismic data. In: Seismic Stratigraphy-Applications to Hydrocarbon Exploration. Tulsa, OK: AAPG Memoir, 389–416
|
|
Nibbelink K, Martinez J. 1998. 3-D seismic coherence, amplitude and bathymetry data definition of pleistocene to recent sediments along the sigsbee escarpment, southeast green canyon, Gulf of Mexico, USA. Gulf Coast Association of Geological Societies Transactions, 48: 289–299
|
|
Painter S, Beresford G, Paterson L. 1995. On the distribution of seismic reflection coefficients and seismic amplitudes. Geophysics, 60(4): 1187–1194. doi: 10.1190/1.1443847
|
|
Paulson M, Ressler J, Moran K, et al. 2006. Prediction of sediment undrained shear strength from geophysical logs using neural networks. In: Proceedings of the 38th Offshore Technology Conference (OTC). Houston, TX: OTC
|
|
Randolph M F, Seo D, White D J. 2010. Parametric Solutions for Slide Impact on Pipelines. Journal of Geotechnical and Geoenvironmental Engineering, 136(7): 940–949. doi: 10.1061/(ASCE)GT.1943-5606.0000314
|
|
Schock S G. 2004. Remote estimates of physical and acoustic sediment properties in the South China Sea using chirp sonar data and the biot model. IEEE Journal of Oceanic Engineering, 29(4): 1218–1230. doi: 10.1109/JOE.2004.842253
|
|
Seyyedattar M, Zendehboudi S, Butt S. 2020. Technical and non-technical challenges of development of offshore petroleum reservoirs: Characterization and production. Natural Resources Research, 29(3): 2147–2189. doi: 10.1007/s11053-019-09549-7
|
|
Sheriff R E. 1975. Factors affecting seismic amplitudes. Geophysical Prospecting, 23(1): 125–138. doi: 10.1111/j.1365-2478.1975.tb00685.x
|
|
Su Ming, Lin Zhixuan, Wang Ce, et al. 2020. Geomorphologic and infilling characteristics of the slope-confined submarine canyons in the Pearl River Mouth Basin, northern South China Sea. Marine Geology, 424: 106166. doi: 10.1016/j.margeo.2020.106166
|
|
Wang Yang, Han Dehua, Zhao Luanxiao, et al. 2022. Static and dynamic bulk moduli of deepwater reservoir sands: Influence of pressure and fluid saturation. Lithosphere, 2022: 4266697
|
|
Wang Jiliang, Wu Shiguo, Zhao Luanxiao, et al. 2019. An effective method for shear-wave velocity prediction in sandstones. Marine Geophysical Research, 40(4): 655–664. doi: 10.1007/s11001-019-09396-4
|
|
Wang Xingxing, Zhuo Haiteng, Wang Yingmin, et al. 2018. Controls of contour currents on intra-canyon mixed sedimentary processes: Insights from the Pearl River Canyon, northern South China Sea. Marine Geology, 406: 193–213. doi: 10.1016/j.margeo.2018.09.016
|
|
Xiu Zongxiang, Liu Lejun, Xie Qiuhong, et al. 2015. Runout prediction and dynamic characteristic analysis of a potential submarine landslide in Liwan 3–1 gas field. Acta Oceanologica Sinica, 34(7): 116–122. doi: 10.1007/s13131-015-0697-2
|
|
Yamada Y, Kawamura K, Ikehara K, et al. 2012. Submarine mass movements and their consequences. In: Proceedings of the 5th International Symposium. Advances in Natural and Technological Hazards Research. Dordrecht: Springer, 1–12
|
|
Yuan Feng, Li Lingling, Guo Zhen, et al. 2015. Landslide impact on submarine pipelines: Analytical and numerical analysis. Journal of Engineering Mechanics, 141(2): 04014109. doi: 10.1061/(ASCE)EM.1943-7889.0000826
|
|
Zein A K M. 2017. Estimation of undrained shear strength of fine grained soils from cone penetration resistance. International Journal of Geo-Engineering, 8(1): 9. doi: 10.1186/s40703-017-0046-y
|
|
Zhang Kai, Li Qianqian, Zhu Hongchun, et al. 2020. Acoustic deep-sea seafloor characterization accounting for heterogeneity effect. IEEE Transactions on Geoscience and Remote Sensing, 58(5): 3034–3042. doi: 10.1109/TGRS.2019.2946986
|
|
Zhou Qingjie, Li Xishuang, Liu Lejun, et al. 2020. Physical properties of the seabed inversed based on Chirp data and the Biot-Stoll model in the northern continental slope of the South China Sea. Haiyang Xuebao (in Chinese), 42(3): 72–82
|
|
Zhou Wei, Wang Yingmin, Gao Xianzhi, et al. 2015. Architecture, evolution history and controlling factors of the Baiyun submarine canyon system from the middle Miocene to Quaternary in the Pearl River Mouth Basin, northern South China Sea. Marine and Petroleum Geology, 67: 389–407. doi: 10.1016/j.marpetgeo.2015.05.015
|
|
Zhuo Haiteng, Wang Yingmin, Sun Zhen, et al. 2019. Along-strike variability in shelf-margin morphology and accretion pattern: An example from the northern margin of the South China Sea. Basin Research, 31(3): 431–460. doi: 10.1111/bre.12329
|


Figures(9) / Tables(1)

Supported by:
Beijing Renhe Information Technology Co. Ltd

Jie Liu, Lejun Liu, Ping Li. Physical-mechanical properties of sediments and their correlation with near seafloor seismic amplitude in the Liwan canyon area, northern South China Sea[J]. Acta Oceanologica Sinica, 2023, 42(5): 130-138. doi: 10.1007/s13131-022-2070-9

| Boreholes | Main sediment type | Water depth/m | Gradient angle/(°) | Mean water content/% | Mean shear strength/kPa | Seismic amplitude |
| D01 | silty clay | 588 | 0.96 | 52.73 | 12.69 | 114 828 |
| D02 | silty clay-clay | 682 | 1.99 | 71.97 | 11.27 | 92 948 |
| D03 | silty clay | 763 | 9.43 | 73.42 | 13.35 | 149 033 |
| D04 | silty clay-clay | 965 | 5.71 | 87.33 | 13.05 | 123 957 |
| D05 | silty clay | 1 046 | 7.73 | 95.64 | 10.24 | 58 980 |
| D06 | silty clay | 1 208 | 2.89 | 113.76 | 7.24 | 115 207 |
| D07 | silty clay | 1 722 | 1.15 | 123.29 | 6.93 | 137 348 |
DownLoad:
CSV
 DownLoad:


 DownLoad: