Qiangqiang Zhong, Linwei Li, Viena Puigcorbé, Dekun Huang, Tao Yu, Jinzhou Du. Contrasting behaviors of 210Po, 210Pb and 234Th in the East China Sea during a severe red tide: Enhanced scavenging and promoted fractionation[J]. Acta Oceanologica Sinica, 2022, 41(8): 5-21. doi: 10.1007/s13131-021-1958-0
Citation:
Qiangqiang Zhong, Linwei Li, Viena Puigcorbé, Dekun Huang, Tao Yu, Jinzhou Du. Contrasting behaviors of 210Po, 210Pb and 234Th in the East China Sea during a severe red tide: Enhanced scavenging and promoted fractionation[J]. Acta Oceanologica Sinica, 2022, 41(8): 5-21. doi: 10.1007/s13131-021-1958-0
Qiangqiang Zhong, Linwei Li, Viena Puigcorbé, Dekun Huang, Tao Yu, Jinzhou Du. Contrasting behaviors of 210Po, 210Pb and 234Th in the East China Sea during a severe red tide: Enhanced scavenging and promoted fractionation[J]. Acta Oceanologica Sinica, 2022, 41(8): 5-21. doi: 10.1007/s13131-021-1958-0
Citation:
Qiangqiang Zhong, Linwei Li, Viena Puigcorbé, Dekun Huang, Tao Yu, Jinzhou Du. Contrasting behaviors of 210Po, 210Pb and 234Th in the East China Sea during a severe red tide: Enhanced scavenging and promoted fractionation[J]. Acta Oceanologica Sinica, 2022, 41(8): 5-21. doi: 10.1007/s13131-021-1958-0
Third Institute of Oceanography, Ministry of Natural Resources, Xiamen 361005, China
2.
State Key Laboratory of Estuarine and Coastal Research, East China Normal University, Shanghai 200241, China
3.
School of Science, Centre for Marine Ecosystems Research, Edith Cowan University, Joondalup, Western Australia 6027, Australia
Funds:
The Science Research Foundation of Third Institute of Oceanography, Ministry of Natural Resources under contract Nos 2017017 and 2019004; the China Postdoctoral Science Foundation under contract No. 2021M693780; the Foundation of Xiamen Institute of Marine Development under contract No. K201301; the Science and Technology Plan Projects of Guangxi Zhuang Autonomous Region under contract No. 2017AB30024.
210Po, 210Pb, and 234Th were determined in water columns of the East China Sea (ECS) to investigate their biogeochemical behaviors during a severe red tide event. Dissolved 210Po, 210Pb, and 234Th accounted for large fractions of the total phases. The abnormally high concentrations of dissolved 210Pb were observed. Partition behaviors of these radionuclides were influenced by particle content effect and particle composition based on distribution coefficient (Kd) vs. total suspended matter (TSM) content and Kd vs. ratios of particulate organic carbon and total suspended matter contents (POC/TSM content ratios). The peaks of mass specific activities of 210Po, 210Pb, and 234Th indicated that degraded particles could have an intensified enrichment ability for radionuclides compared with the surficial suspended matters. Fractionation factor of 210Po and 210Pb (FPo/Pb) (>1) and fractionation factor of 210Po and 234Th (FPo/Th) (>1) were much higher at algal blooming regions than that at non-blooming stations, indicating that algal blooms promoted the fractionation of 210Po against 210Pb and 234Th, and proving that 210Po exhibited a stronger affinity for biogenic particles than 210Pb and 234Th when POC content increased in the sea. POC/210Po, POC/210Pb and POC/234Th ratios (content/activity ratios) sharply decreased with depth in both algal bloom and non-bloom stations. The outbreak of algal bloom promoted the complexity of suspended particles and increased the variability of POC/tracer ratios (content/activity ratios) in the different depth of the shallow seas. More considerations should be taken to the difficulty of the selection of export interface and the suitable tracers when algal blooming occurs.
Due to the constant production rates, particle affinity and relatively short half-life, three radionuclides of 238U decay-series, 234Th, 210Po, and 210Pb are found to be suitable to examine biologically mediated seasonal changes in particle dynamics, and have been extensively used as powerful tracers on upper ocean biogeochemical processes such as colloidal and particulate removal rates/residence time (Bacon et al., 1976; Nozaki et al., 1991; Kim and Kim, 2012; Mudbidre et al., 2014) and particulate organic carbon (POC) export (Buesseler et al., 1992; Shimmield et al., 1995; Murray et al., 2005; Cai et al., 2008; Roca-Martí et al., 2016). The inherent differences between 210Po/210Pb and 234Th/238U activity ratios have been interpreted as a result of half-lives difference of 210Po and 234Th, and the different particle affinities of the three particle-reactive radionuclides (210Po, 210Pb and 234Th) (Murray et al., 2005; Verdeny et al., 2009). 234Th is particle-reactive while 238U is highly soluble in seawater, on the contrary, both 210Po and 210Pb are particle-reactive but have different geochemical behaviors. 210Pb becomes quickly adsorbed onto particle surfaces and is related to biogenic silica and lithogenic particles but would not be metabolized by phytoplankton (Bacon et al., 1976; Friedrich and van der Loeff, 2002; Stewart et al., 2005), whereas 210Po can be incorporated by biological uptake into the cytoplasm and cell wall of some species of phytoplankton, participating in proteins and sulfur-containing compounds (Fisher et al., 1983; Stewart and Fisher, 2003; Carvalho et al., 2011). Generally, the biogeochemical behaviors of 210Po, 210Pb and 234Th in marine environment, especially during phytoplankton blooming, can help us to understand the differences of POC flux estimated by these two radionuclide pairs 210Po/210Pb and 234Th/238U activity ratios.
Phytoplankton contribute about half of all photosynthetic activity on Earth (Field et al., 1998), sustaining the aquatic food web and its biogeochemical cycles. Interannual and decadal variability in the timing and magnitude of phytoplankton blooms is postulated to have significant impacts on, for example, the timing of zooplankton development and larval fish survival. With increasing global climate change and anthropogenic impacts, phytoplankton blooms have emerged as a global phenomenon affecting offshore and coastal areas over the past few decades (Anderson et al., 2012). During phytoplankton bloom, large amount of POC and dissolved organic carbon (DOC) was produced, which would affect the behavior of those radionuclides. In addition, phytoplankton concentrates some trace metals, such as Fe, Mn, Co, Ni, Cu and Zn (Twining et al., 2015) to sustain its growth and metabolism and subsequently affect the biogeochemical cycles of other nutrient elements such as C, N, P, S, and Si (Morel and Price, 2003). Thus, tracing the influence of algal bloom on radionuclides can also help to understand the biogeochemical cycle of metal and nutrients in the coastal environment during algal blooming. However, very few studies (Santschi et al., 1979; Kim and Yang, 2004; Wei et al., 2009, 2012; Uddin et al., 2018) focused on geochemical cycling of 234Th, 210Po, and 210Pb under a red tide environment where the contents of POC can be relatively high. Besides, the relationship between POC and the geochemical behavior of 234Th, 210Pb and 210Po is not well understood.
The East China Sea (ECS) is the most seriously affected by harmful algal blooms, compared to the Bohai Sea, the Yellow Sea and the South China Sea, in terms of the recorded number of red-tide events and the red-tide influenced area (http://www.nmdis.org.cn/gongbao/huanjing/). In the Changjiang River Estuary (CRE) and its adjacent sea area of the ECS, phytoplankton community is mainly composed of diatoms and dinoflagellates (Zhou and Yu, 2007). Seasonally, the diatoms are the most dominant phytoplankton group, which will form blooms in early spring (March to April), but intensive dinoflagellate blooms mainly occur during the period between late spring and mid-summer (May to July) (Zhou et al., 2017). Since 2000 AD, large-scale dinoflagellate blooms have progressively replaced diatom as dominant algae due to changes of environmental factors that have affected the competition and succession between diatom and dinoflagellate (Zhou et al., 2017). During July 2016, 31 of 87 stations within the ECS region were found with serious phytoplankton outbreaks, with red patches of various sizes floating on the sea surface (Fig. 1b). Water samples were taken both from sites with and without red tides. And dissolved and particulate 234Th, 210Pb and 210Po were determined. The objectives of this study are to investigate the biological effect on removal processes and to compare the fractionation behaviors of 234Th, 210Po, and 210Pb during an algal bloom event. The results of this study can help to understand the biogeochemical cycle of metal elements in the coastal environment especially during algal blooming.
Figure
1.
Map showing the locations of the stations in the Changjiang River Estuary and East China Sea in July 2016 (a). Red stars are four stations where radionuclides were measured, with two stations (A1-5 and A3-9) affected by algal blooms (b), and two no-bloom stations (A6-11 and A8-7) (c). The regional currents during summer are included: Changjiang Dilute water (CDW), Zhejiang-Fujian Coast Current (ZFCC), Yellow Sea Coastal Current (YSCC) and Taiwan Warm Current (TWC). Black dots in red dashed boxes represent the locations where algal blooms were observed.
The ECS has significant circulations and water masses (Fig. 1a), which was described in Su (2001) and Wang et al. (2018b). At the mouth of the Changjiang River, the Changjiang Diluted Water (CDW) flows northeastward in summer. In the southern portion of the study area, there are two northward currents: (1) the inshore branch of the Taiwan Warm Current (TWC), generated from the warm and salty Kuroshio Current (KC), which flows along the 50 m isobath; and (2) the Zhejiang-Fujian Coastal Current (ZFCC), which is a branch from the TWC flowing northeastward along the China coast and has a weak flow potential in summer due to the monsoon climate (Jiang et al., 2017; Wang et al., 2016). There is the southeastern Yellow Sea Coastal Current (YSCC) in the north, which contains high contents of suspended particles.
Samples were collected at four stations in the ECS off the CRE along a defined section in July 2016 on board of the R/V Runjiang II. (Fig. 1a). In this survey, 31 of 87 stations were found with serious phytoplankton outbreaks, with red patches of various sizes floating on the sea surface (Fig. 1b). The dominant species observed was Noctiluca scintillans (Qi et al., 2019), a cosmopolitan red tide forming heterotrophic dinoflagellate (Zhang et al., 2017). Stations A1-5 and A3-9 were located on algal blooming regions, with water depths less than 50 m. Outer Stations A6-11 and A8-7 were as control stations since they were not influenced by red tide (Fig. 1c).
A total of 4−6 discrete water samples (depended on water depth) were collected from the surface to bottom using 30 L Go-Flo bottles. The 30 L samples were subdivided into 20 L, to determine 210Po and 210Pb activities, 4 L for 234Th activity analyses and 6 L were allocated to total suspended matter (TSM), POC and particulate nitrogen (PN) contents, and δ13C analyses. In order to determine the activities of 210Po, 210Pb, and 234Th in the dissolved and the particulate fractions, immediately after collection, the 20 L for 210Po and 210Pb analyses were filtered through a 142-mm mixed cellulose ester membrane (0.45 μm) mounted in a Plexiglas filter holder, and the 4 L for 234Th measurements were filtered through 25-mm diameter QMA filters.
2.2
Salinity, temperature, dissolved oxygen (DO), chlorophyll a (Chl a), and dissolved nutrient measurement
The concentrations of Chl a and five dissolved nutrients (${\rm{NO}}_2^-$, ${\rm{NO}}_3^{\text{−}}$, ${\rm{NH}}_4^{\text{+}} $, ${\rm{PO}}_4^{3-} $ and ${\rm{SiO}}_3^{2-} $) in the CRE and the adjacent sea area of the ECS were determined. A Conductivity-Temperature-Depth (CTD) sensor (SBE 9/11, Sea-Bird Electronics, USA) was used to record the salinity and temperature in seawater column. For measurement of DO concentration, seawater samples were fixed and titrated onboard following the classic Winkler procedure, which has a precision of ±1 μmol/L (Wang et al., 2018a). The method for Chl a concentration determination was described in Gao et al. (2015) and Zhu et al. (2018). In brief, 300 mL seawater was filtered through a Q-MA filter (Whatman, Germany) under low vacuum, and Chl a was immediately extracted using 10 mL of 90% acetone under cool, dark condition for >12 h. After centrifuging, the supernatant was determined with a Hitachi F-4500 fluorescence spectrophotometer (Japan). Samples for nutrient determinations were filtered immediately through a Q-MA filter, and the filtrate was sterilized with saturated HgCl2 solution and stored below 4°C. The five dissolved inorganic nutrient concentrations were analyzed using an auto-analyzer (Skalar SANplus, the Netherlands) (Liu et al., 2016).
2.3
210Po and 210Pb activities analysis
210Po and 210Pb activities were analysed from the 20 L subsamples following the procedures described in Zhong et al. (2019). Briefly, the filtrate sample was acidified with concentrated HCl to pH 1−2 and spiked with a known amount of 209Po (No. 7299, Eckert & Ziegler Isotope Products) and stable ${\rm{Pb}}^{2+} $ used as yield monitors to quantify any subsequent losses of Po and Pb. A total of 100 mg ${\rm{Fe}}^{3+} $ was also added to the sample and allowed to equilibrate for 6 h to 12 h. The pH was then adjusted to approximately 8−9, using concentrated NH4OH to form Fe(OH)3 precipitate. After settling for 8 h to 12 h, the precipitate was transferred into 1.5 L polyethylene bottle and stored on board for processing upon arrival to shore. Two weeks later, the precipitate was centrifuged and dissolved in 6 mol/L HCl solution in a clean Teflon beaker (pH, ~1). After adding 0.3 g ascorbic acid, 1 mL 25% sodium citrate and 1 mL 20% hydroxylamine hydrochloride, 210Po and 209Po were auto-deposited onto silver disc. The membrane filters that contained particulate fraction of the samples were digested with HF, HNO3 and HClO4, spiked with known quantities of 209Po and ${\rm{Pb}}^{2+} $ to monitor the recovery of 210Po and 210Pb and plated onto silver discs, as described above for the dissolved samples.
In order to reduce the influence of the residual Po on 210Pb determination, a second plating was conducted to assure complete removal of Po (Bacon et al., 1988). After that, the same sample solution was stored for ~12 months to allow ingrowth of 210Po from 210Pb, and then, re-spiked with 209Po yield tracer and plated onto silver discs. The recovery of 210Pb was determined by measuring the added ${\rm{Pb}}^{2+} $ via ICP-OES (iCAP-7400, Thermo Fisher Scientific CO., Ltd, USA). The activities of 210Po and 209Po were determined by an alpha spectrometer (7200, Canberra, Australia) and were decay corrected back to the time of sampling, following recommended protocols (Baskaran et al., 2013; Rigaud et al., 2013; Su et al., 2017).
2.4
234Th activity analysis
234Th activity analysis were conducted for the dissolved fraction following the small-volume MnO2 co-precipitation method with addition of 230Th spike (Benitez-Nelson et al., 2001; Pike et al., 2005; Cai et al., 2006). Briefly, the filtered 4-L seawater was acidified to pH 1−2 with 6 mL of concentrated HNO3. Approximately 66 mBq of 230Th were added to the solution as a yield tracer. The sample was mixed vigorously and allowed to equilibrate for over 12 h. Then, pH was adjusted back to 8−9 with concentrated NH4OH. Later, KMnO4 solution and MnCl2 solution were added to form a MnO2 co-precipitation. The sample was heated in a hot-water bath (80°C) for 2−3 h and allowed to cool to room temperature, the suspension of MnO2 was filtered onto a 25 mm diameter Q-MA filter. Finally, the filtered MnO2 precipitate was dried and processed for beta counting with Mylar and two aluminum foils. The particulate 234Th sample was collected on a 25-mm diameter Q-MA filter without prior treatment, dried for 4 h at 60°C and prepared for beta counting as done for the dissolved fraction samples.
All samples were beta-counted on board with a gas-flow proportional low-level RISØ beta counters (Model GM-5-25, RISØ National Laboratory, Denmark). Returning to the land lab, samples were re-measured for 5 times in the next 6 months to trace the decay of 234Th and to quantify background activities. After the final background counting, the recovery analyses were conducted by adding 66 mBq 229Th as recovery assessment tracer and then dissolving the precipitate and conducting an isolation and radiochemical purification of 230Th and 229Th according to Pike et al. (2005). Finally, Th isotopes were electrodeposited onto a stainless-steel disc. The disc was counted by alpha spectrometry. Recoveries for all these dissolved samples were generally higher than 70% (n=20). Concentrations of 238U (Bq/m3) were derived from salinity using the relationship of [238U]= 4.73×10⁻³×salinity−0.019 (Owens et al., 2011).
2.5
TSM, POC, δ13C, and PN analyses
The 6-L seawater sample was taken from Go-Flo bottle, and immediately filtered through a pre-combusted (450°C) and pre-weighed Q-MA filter to determine TSM, POC, and PN contents and the corresponding δ13C. All samples were freeze dried and treated via concentrated HCl vapor to remove inorganic carbon (Zhang et al., 2007) and were packed tightly into tin cans after dryness before measurements were conducted with a DELTA Plus XP isotopic ratio mass spectrometer (Thermo Electron Corporation, Germany) (Gao et al., 2014). δ13C is reported as ‰-deviation from the carbon isotope composition of the international Vienna Pee Dee Belemnite standard. The precision of the analysis is ±0.2‰ for δ13C (Wu et al., 2003).
3.
Results
3.1
Features of hydrography and general water chemistry during algal blooming in the study area
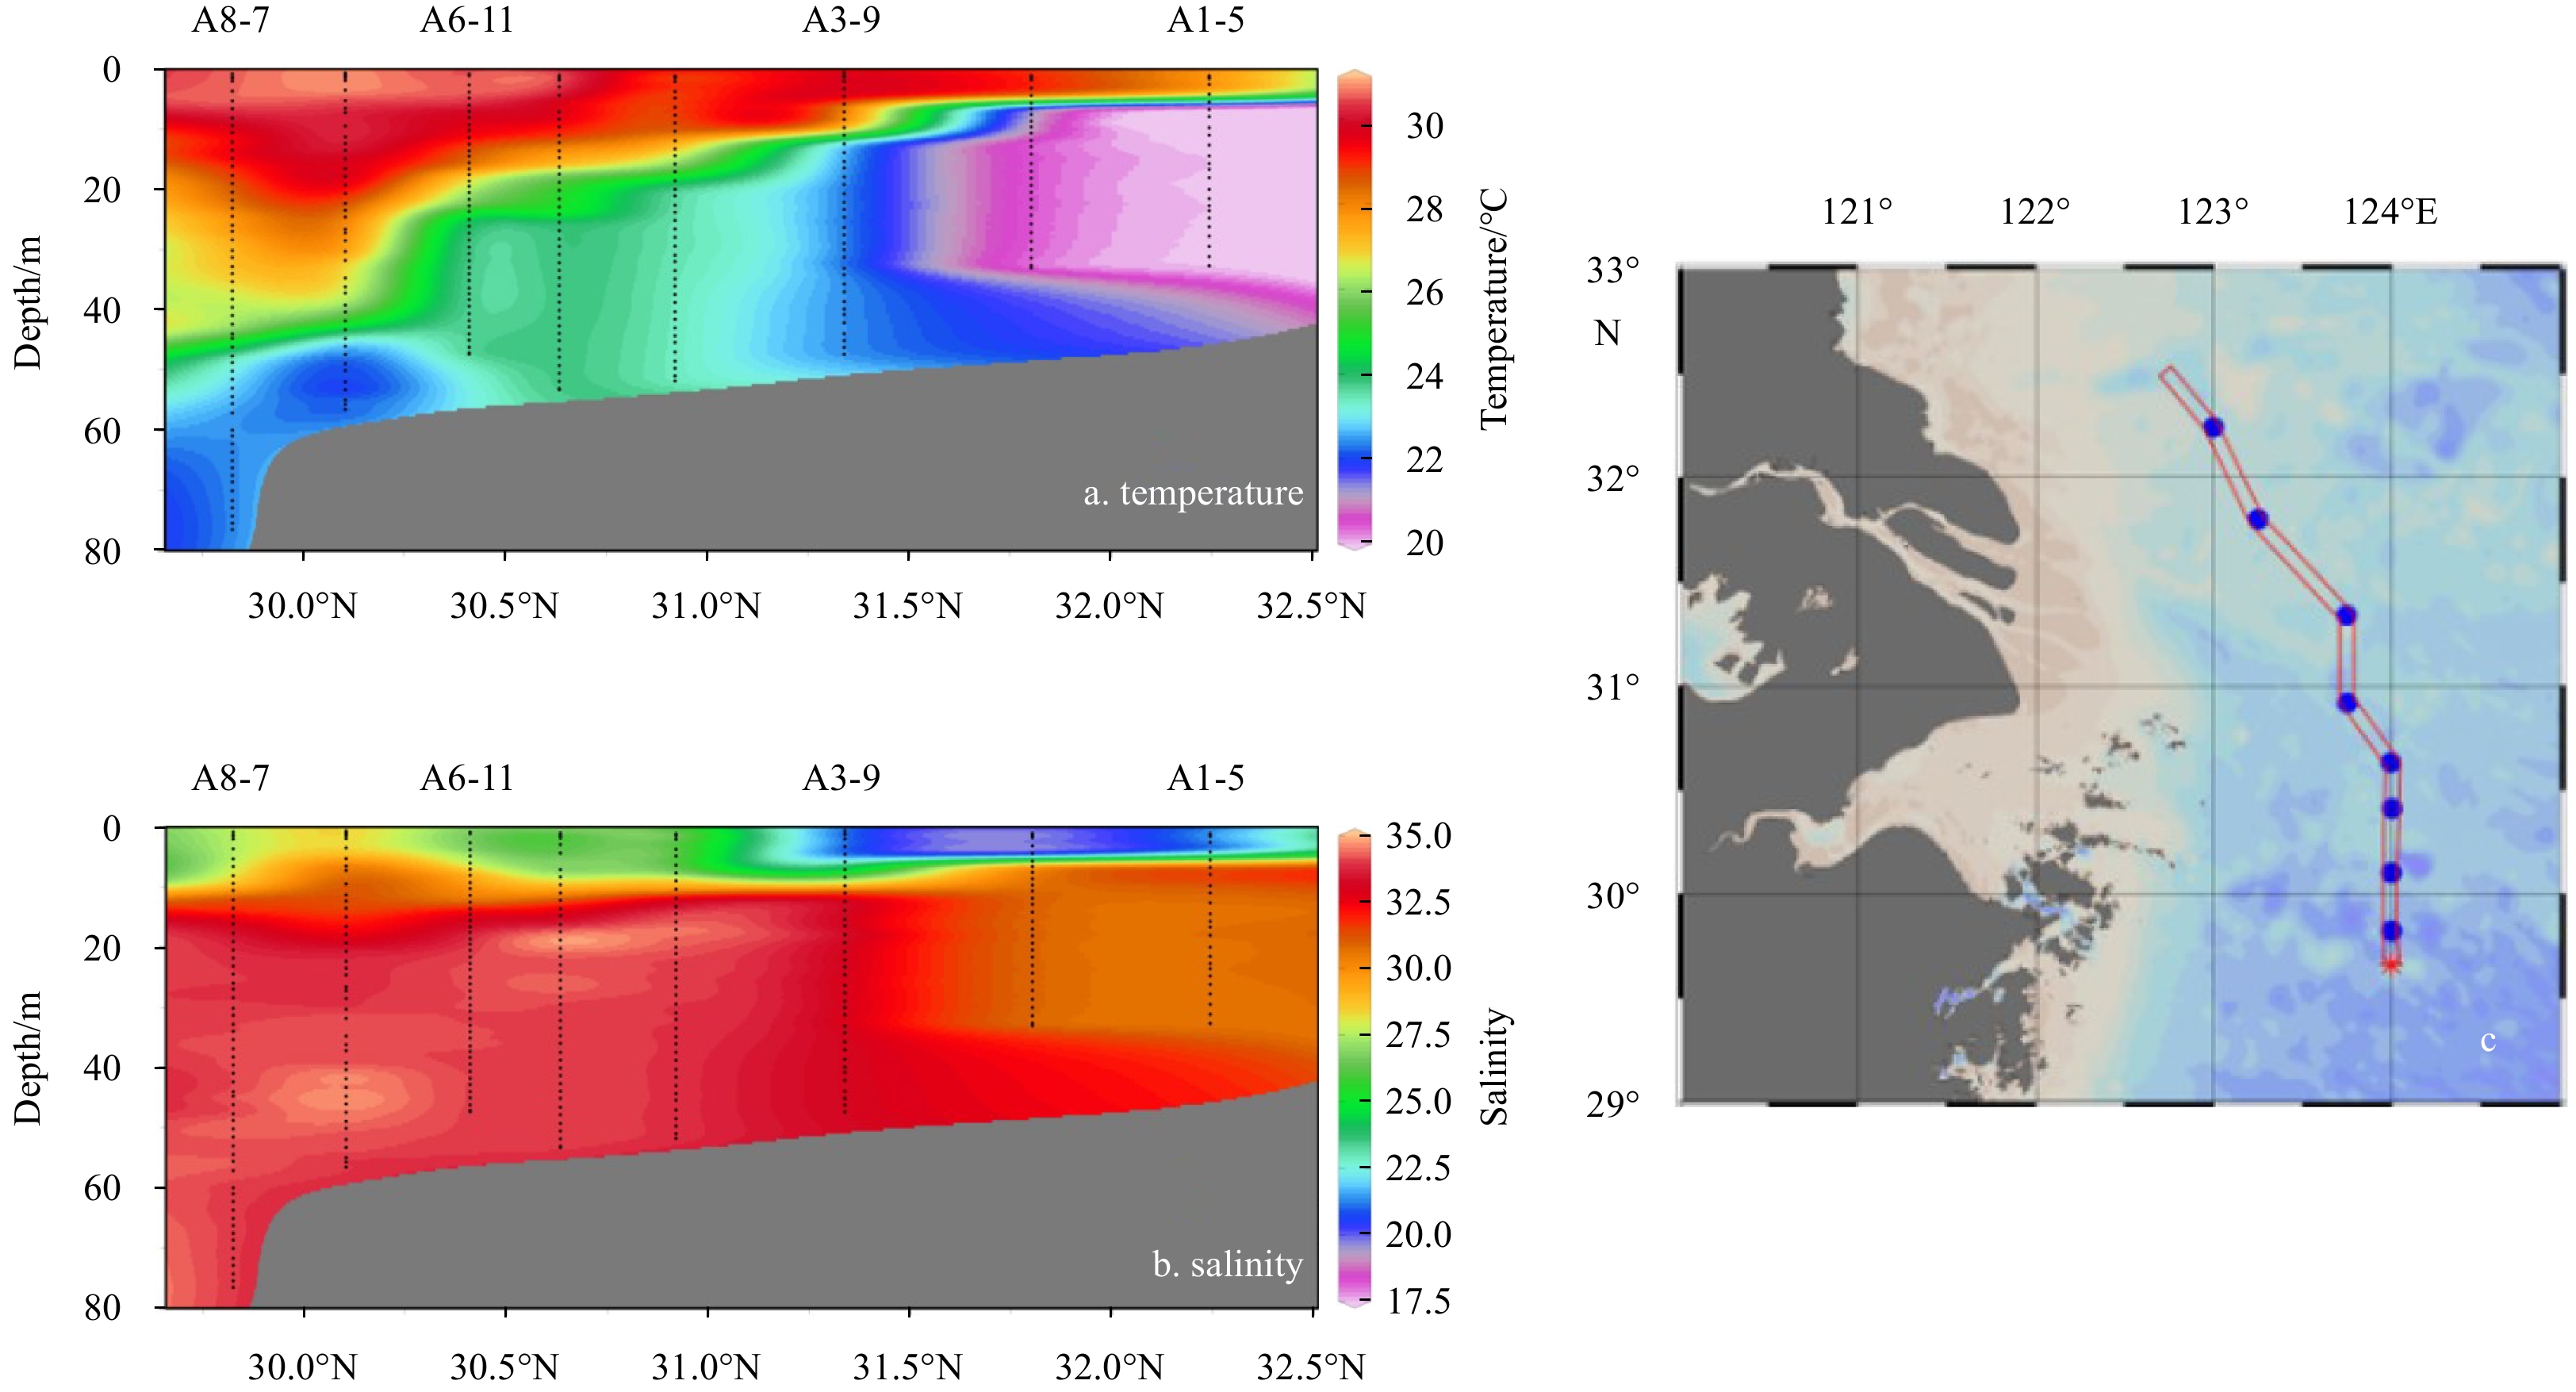
Overall, temperature varied from 20.0°C to 30.6°C, and gradually increased southward towards Station A8-7, and decreased with depth (Fig. 2). The salinity changed from 21.38 to 34.34, with a tongue-like saline water mass invaded from offshore area to nearshore station in the bottom layer (Fig. 2). The study area had experienced an intense stratification during sampling (Fig. 2), which provided a stable physical environment for the subsequent sinking and degradation of biogenic particles during algal blooms.
Figure
2.
Vertical distribution plots of temperature (°C) (a) and salinity (b) along the defined section (c) of the East China Sea off the Changjiang River Estuary in July 2016.
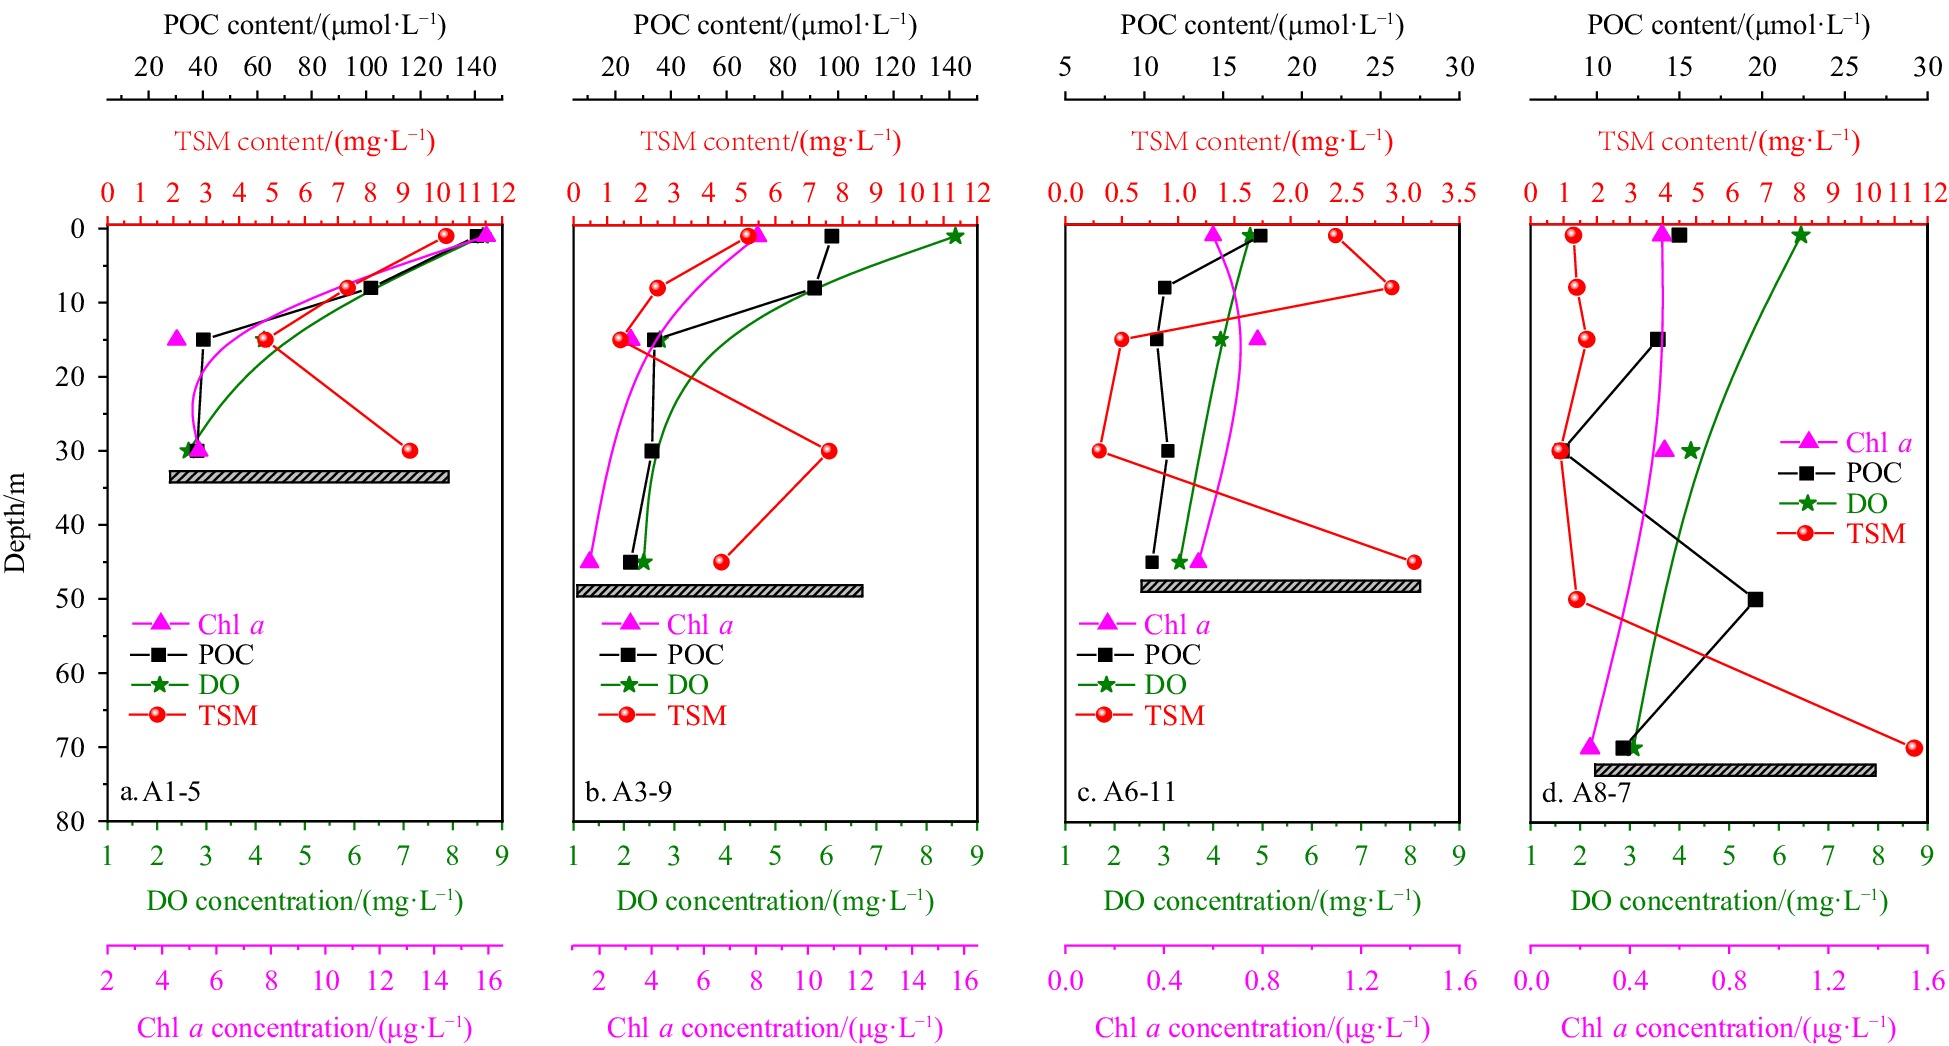
Chl a concentration and POC content in the surface waters of Stations A1-5 and A3-9 were nearly ten times higher than that of Stations A6-11 and A8-7 (Table 1, Fig. 3). A decrease trend of DO concentration occurred with increasing depth and DO concentrations at bottom layers were lower than 3 mg/L at all the stations (Fig. 3). The water columns exhibited a variation of TSM content from 0.3 mg/L to 11.6 mg/L, with contents gradually decreasing with depth, but dramatically increasing near the seafloor (Fig. 3).
Table
1.
Vertical profiles of dissolved and particulate 210Po, 210Pb and 234Th activities, activity ratios of dissolved fraction vs. total suspended matter (TSM), particulate organic carbon (POC) and particulate nitrogen (PN) contents, and δ13C
Station
Depth/ m
DPo/ (Bq·m−3)
PPo/ (Bq·m−3)
(DPo/TPo)/ %
DPb/ (Bq·m−3)
PPb/ (Bq·m−3)
(DPb/TPb)/ %
DTh/ (Bq·m−3)
PTh/ (Bq·m−3)
(DTh/TTh)/ %
TSM/ (mg·L−1)
POC/ (μmol·L−1)
PN/ (μmol·L−1)
${\text{δ} }$13C/ ‰
A1-5
1
0.57 ± 0.20
1.13 ± 0.08
34
11.9 ± 1.35
1.67 ± 0.15
88
17.7 ± 0.83
4.17 ± 0.17
81
10.3
140.8
21.7
−21.8
6
0.75 ± 0.17
0.90 ± 0.05
46
11.5 ± 1.12
1.30 ± 0.12
90
8.00 ± 0.33
2.17 ± 0.17
78
7.3
101.8
15.0
−21.5
15
0.77 ± 0.08
1.32 ± 0.08
37
4.57 ± 0.35
2.98 ± 0.27
61
8.67 ± 0.50
1.00 ± 0.17
88
4.8
40.2
8.9
−21.4
30
0.88 ± 0.25
2.57 ± 0.17
26
16.7 ± 1.83
3.40 ± 0.30
83
9.33 ± 0.50
3.83 ± 0.33
70
9.2
37.9
15.7
−18.9
A3-9
1
0.55 ± 0.10
0.75 ± 0.05
43
7.10 ± 0.67
1.85 ± 0.15
79
11.7 ± 0.67
1.17 ± 0.17
90
5.2
97.8
15.6
−19.2
6
1.02 ± 0.17
0.73 ± 0.05
59
8.07 ± 0.82
1.73 ± 0.15
82
12.3 ± 0.67
2.50 ± 0.17
83
2.5
91.6
15.0
−20.4
15
0.62 ± 0.15
0.90 ± 0.08
41
12.6 ± 1.22
2.47 ± 0.30
84
8.67 ± 0.50
3.67 ± 0.33
70
1.4
34.1
7.3
−22.0
30
0.72 ± 0.05
1.05 ± 0.07
41
3.48 ± 0.25
2.08 ± 0.20
63
8.83 ± 0.50
2.17 ± 0.17
80
7.6
33.2
5.0
−22.4
45
0.90 ± 0.13
1.55 ± 0.08
37
8.02 ± 0.73
2.40 ± 0.23
77
10.3 ± 0.50
9.17 ± 0.50
53
4.4
25.5
6.3
−21.3
A6-11
1
0.77 ± 0.05
0.43 ± 0.03
64
4.08 ± 0.37
0.48 ± 0.07
89
8.33 ± 0.33
9.33 ± 0.50
47
2.4
17.4
4.1
−24.1
6
0.73 ± 0.05
0.27 ± 0.02
74
4.12 ± 0.32
0.52 ± 0.05
89
15.2 ± 0.67
3.83 ± 0.17
80
2.9
11.3
5.7
−23.6
15
0.55 ± 0.05
0.32 ± 0.02
64
5.55 ± 0.43
0.72 ± 0.07
89
10.5 ± 0.50
5.67 ± 0.33
65
0.5
10.8
3.1
−18.6
30
0.55 ± 0.08
0.63 ± 0.03
47
13.1 ± 1.45
0.65 ± 0.08
95
6.67 ± 0.33
3.50 ± 0.17
65
0.3
11.5
4.1
−17.6
45
0.88 ± 0.05
0.90 ± 0.05
50
2.27 ± 0.17
1.23 ± 0.15
65
10.3 ± 0.50
8.67 ± 0.50
54
3.1
10.5
5.7
−20.6
A8-7
1
0.82 ± 0.07
0.20 ± 0.02
80
1.92 ± 0.17
0.40 ± 0.05
83
7.00 ± 0.33
1.83 ± 0.17
80
1.3
15.0
3.7
−23.3
6
0.93 ± 0.08
0.30 ± 0.02
76
3.18 ± 0.27
0.42 ± 0.05
89
7.33 ± 0.33
2.67 ± 0.17
74
1.4
NA
NA
−20.1
15
1.00 ± 0.15
0.30 ± 0.02
77
4.90 ± 0.47
0.50 ± 0.05
91
6.50 ± 0.17
3.50 ± 0.17
65
1.7
13.7
3.7
−23.7
30
1.33 ± 0.15
0.43 ± 0.03
76
4.83 ± 0.48
0.58 ± 0.07
89
11.2 ± 0.50
7.50 ± 0.33
60
0.9
7.9
1.9
−21.2
45
0.72 ± 0.08
0.37 ± 0.03
67
3.68 ± 0.32
0.68 ± 0.05
84
7.83 ± 0.33
5.67 ± 0.33
58
1.4
19.6
5.7
−21.6
70
1.03 ± 0.07
2.25 ± 0.10
32
2.37 ± 0.22
2.13 ± 0.25
53
12.8 ± 0.67
10.7 ± 0.50
54
11.6
11.6
4.2
−21.6
Note: T, D and P denotes total, dissolved, and particulate phases, respectively; NA denotes data not available. Errors are 1 sigma values based on counting uncertainties.
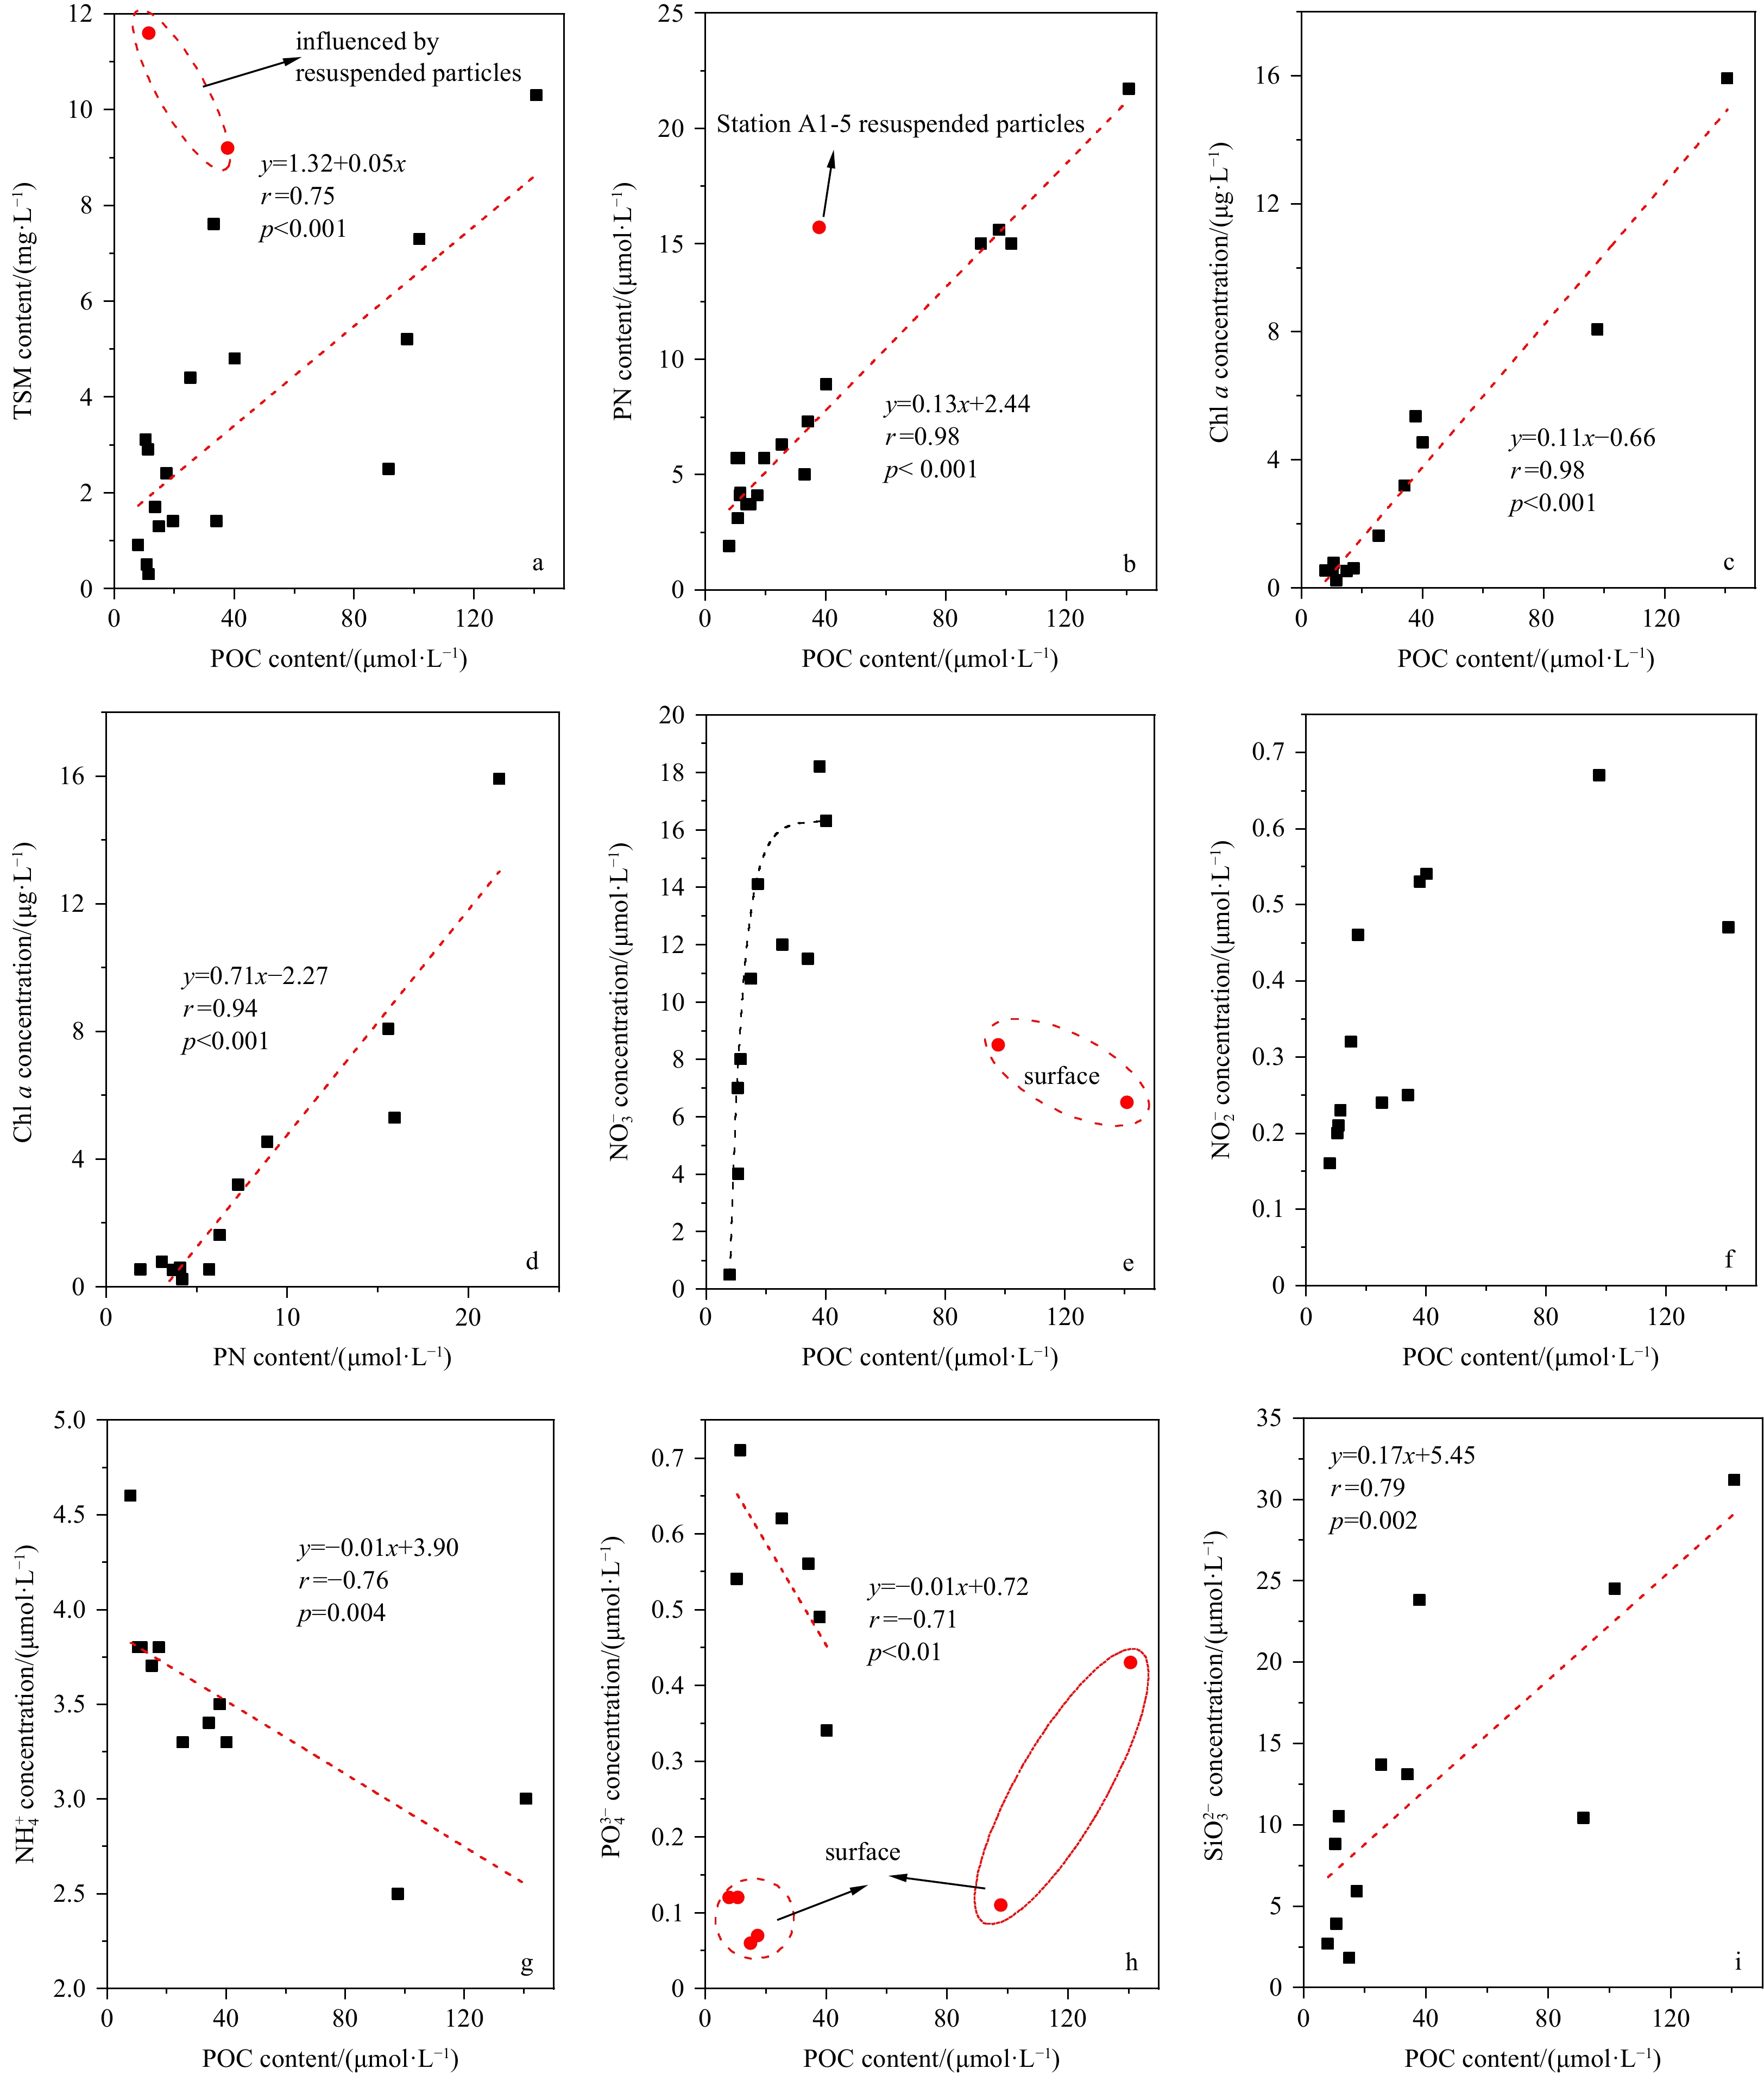
TSM and POC contents showed a linear correlation (Fig. 4a; R=0.75, P<0.001). Similar strong positive correlations were found between POC, PN and Chl a in Figs 4b-d. The ${\rm{NH}}^{+}_4 $ and ${\rm{PO}}_4^{3-}$ concentrations decreased with increasing in POC content (Figs 4g, h), and low concentrations of ${\rm{NH}}_4^{+}$, ${\rm{NO}}_3^{-}$, and ${\rm{PO}}_4^{3-}$ were found in surface layer (Stations A1-5 and A3-9) where Chl a concentrations were higher (Table A1). The negative relationships between ${\rm{NH}}_4^{+} $ and ${\rm{PO}}_4^{3-} $ concentration and POC content indicated a strong absorption of ${\rm{NH}}_4^{+} $ and ${\rm{PO}}_4^{3-} $ by plankton during the algal blooming season. A strong positive relationship was observed between ${\rm{SiO}}_3^{2-} $ concentration and POC content (Fig. 4i). The positive relation between ${\rm{SiO}}_3^{2-} $ concentration and POC content might be related to the dominated species (N. scintillans) during this severe red tide and the influence of CDW. In Fig. 4i, the points with high POC contents represent the samples collected at algal blooming Stations A1-5 and A3-9. And from the vertical distribution of salinity in Fig. 2b, we can find that these two stations are influenced by the Changjiang River, which has very high ${\rm{SiO}}_3^{2-} $ concentration.
Figure
4.
Relationships between POC and TSM (a), POC and PN (b), POC and Chl a (c), POC and five nutrients (${\rm{NO}}_3^{-} $ (e), ${\rm{NO}}_2^{-} $ (f), ${\rm{NH}}_4^{+} $ (g), ${\rm{PO}}_4^{3-} $ (h), ${\rm{SiO}}_3^{2-} $ (i)) and between PN and Chl a (d) during algal blooming in July 2016. The dotted lines indicate the correlation between the two parameters and the equation is presented in the corresponding panel. Red symbols indicate outliers of the general trend due to particularities of those specific samples, as described in each graphic.
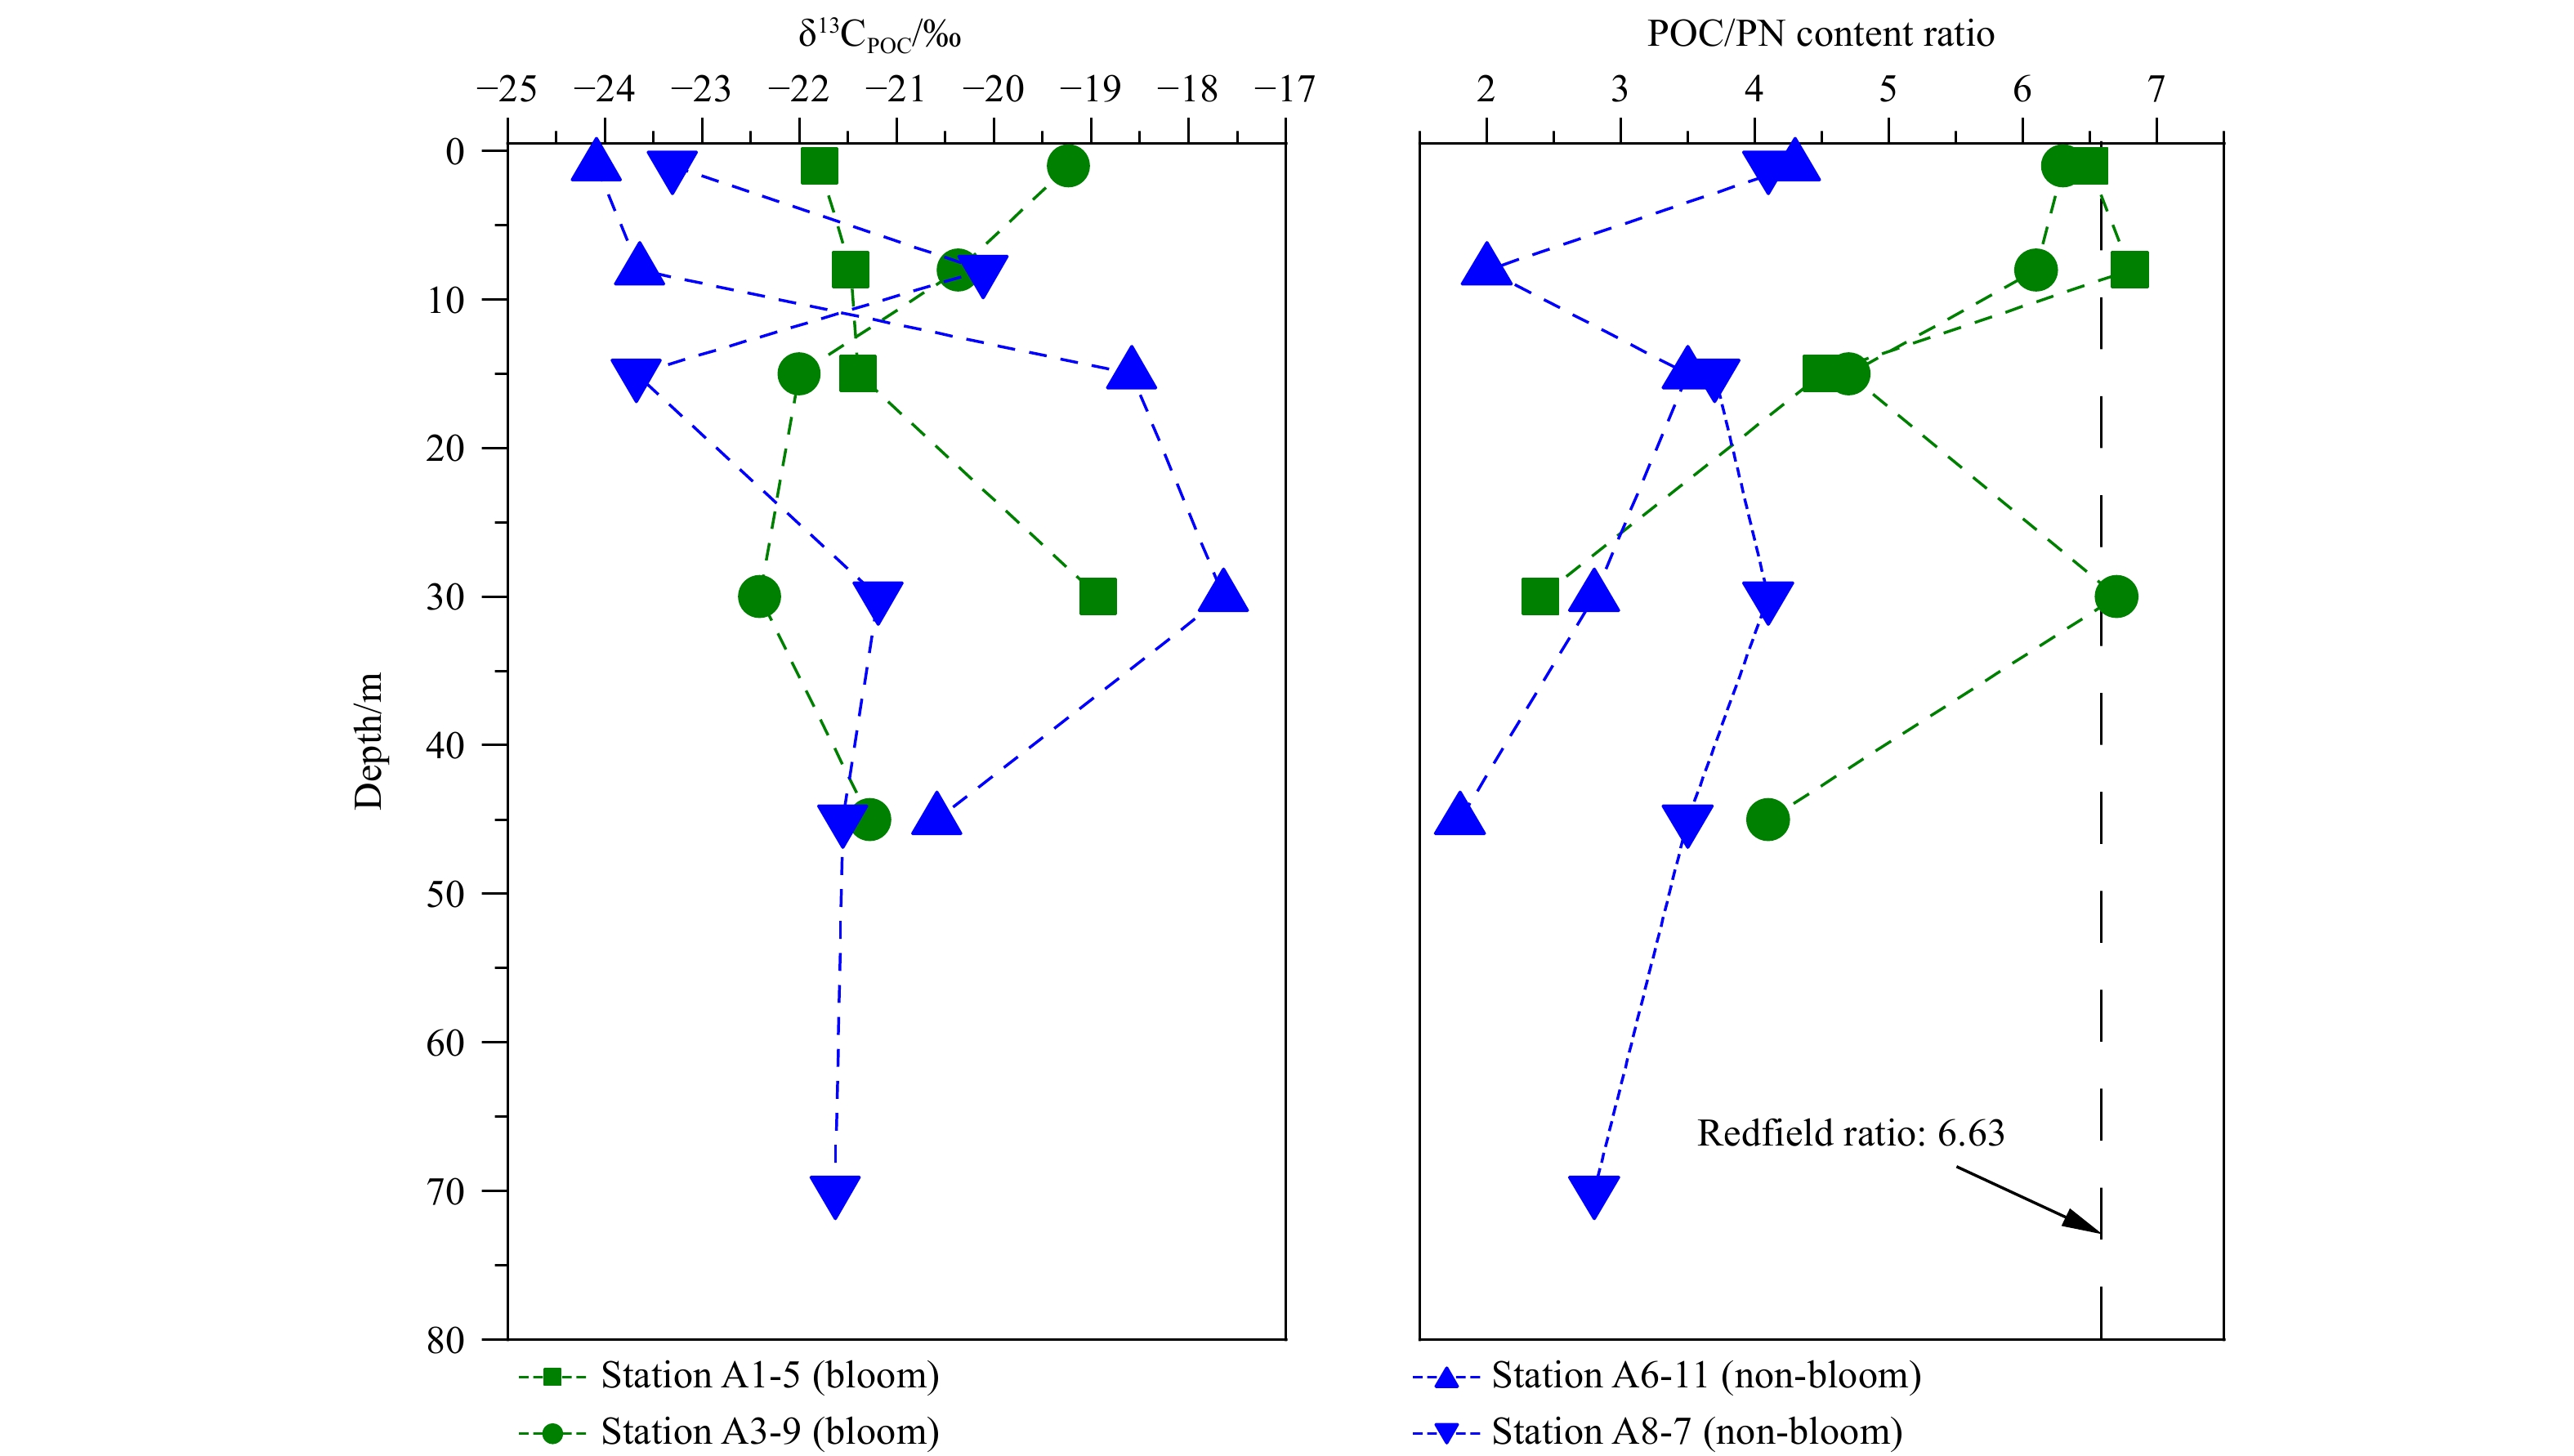
The δ13C values in suspended particles ranged from −24.1‰ to −18.9‰, with the lowest value in surface water at Station A6-11 (Fig. 5). Similar values were reported by Wu et al. (2003) with δ13C compositions at PN section of the ECS varied from −31‰ to −19‰ in autumn of 2000. Besides, Gao et al. (2014) reported a range of δ13C values from −28.4‰ to −16.6‰ in the CRE and the adjacent ECS. POC/PN molar content ratios decreased from surface (4.3) to bottom (1.8) at non-bloom Stations A6-11 and A8-7. At algal blooming Stations A1-5 and A3-9, POC/PN molar content ratios also decreased with depths, from 6.8 (surface) to 2.4 (bottom), with surface layer ratios being very similar to the Redfield ratio (6.63) (Fig. 5).
Figure
5.
Variations of stable organic carbon isotopic ratio (δ13C) and organic carbon and nitrogen content ratio (POC/PN content ratio) in particles collected in bloom (green) and non-bloom (blue) stations.
3.3
Dissolved and particulate 210Po, 210Pb and 234Th activities in seawater
The dissolved 210Po activities ranged from (0.55±0.10) Bq/m3 to (1.33±0.15) Bq/m3, representing 26%−80% of total 210Po activity (Table 1, Fig. 6). Our results were comparable to the activities measured in a section of the ECS in autumn, 2013 (0.48−1.53 Bq/m3, Su et al., 2017). The vertical profiles of dissolved 210Po concentrations exhibited similar distribution features at all four stations with lowest activity in the surface waters (<10 m depth) and increasing activity with depth.
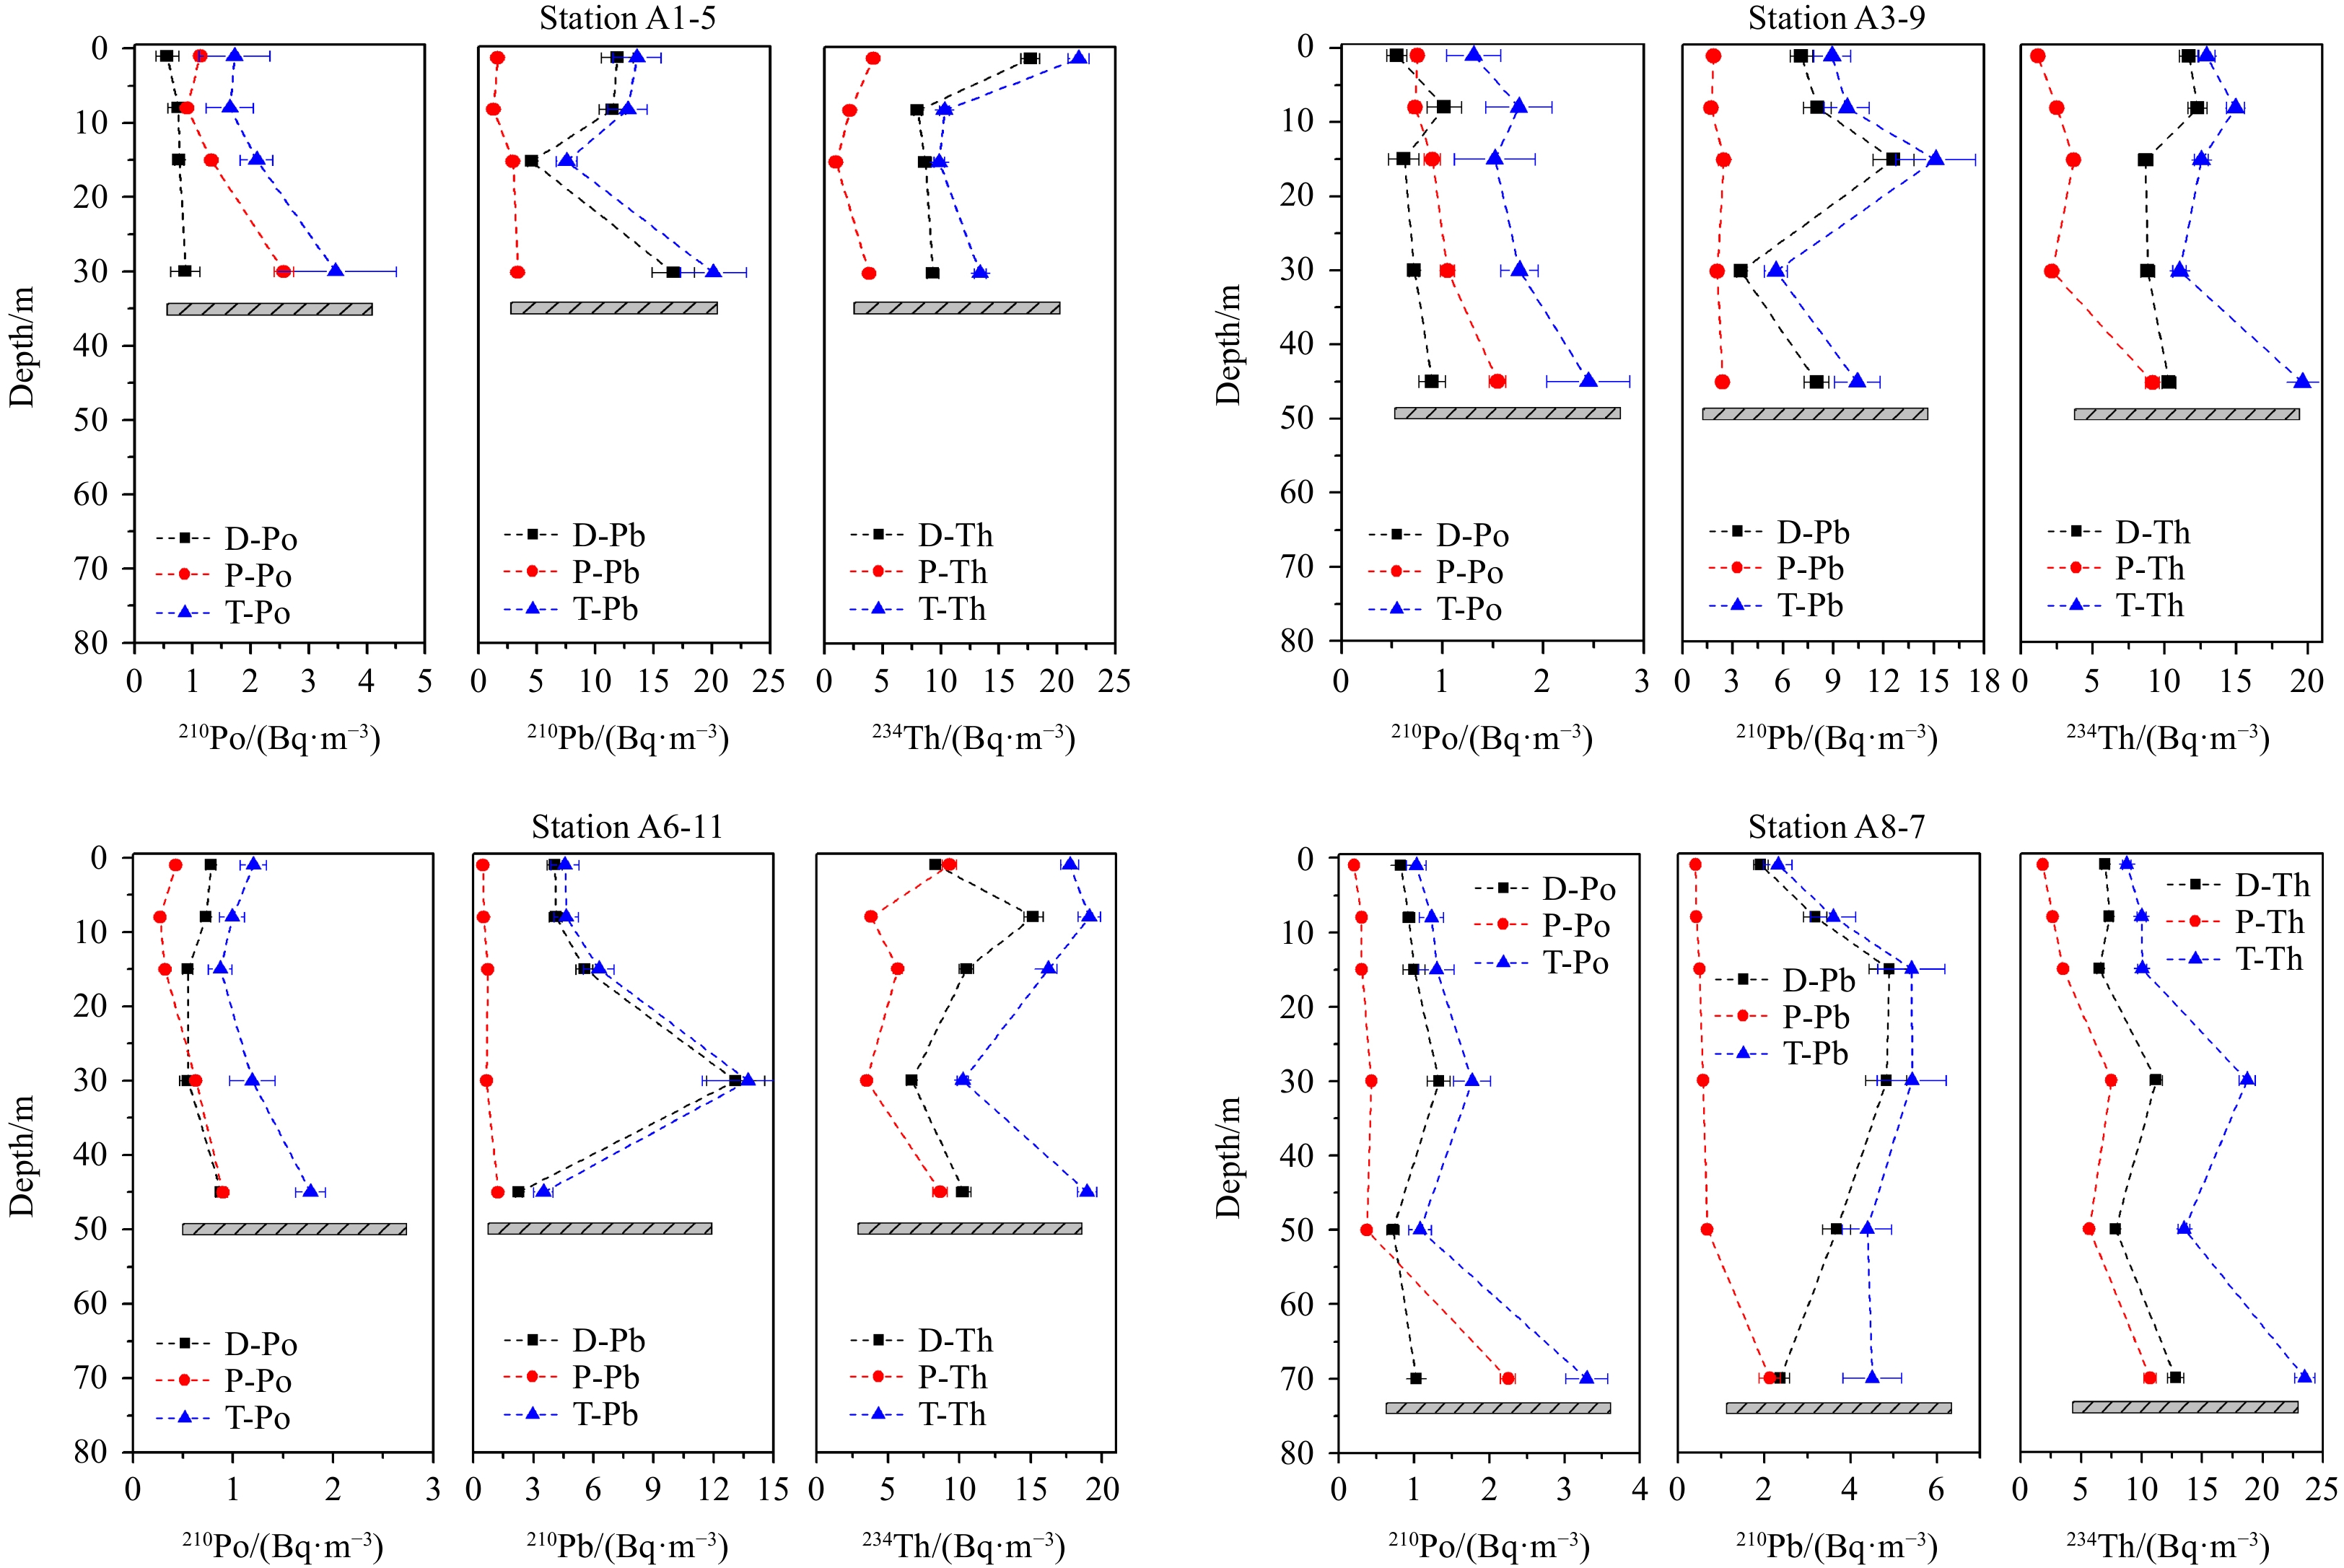
Figure
6.210Po, 210Pb, and 234Th activity profiles for the dissolved (D, black squares), particulate (P, red dots), and total (dissolved+particulate; T, blue triangles) phases. Horizonal twill line indicated the bottom depth.
The dissolved fraction of 210Pb represented 53%−95% of the total (Table 1), with 210Pb concentrations ranging from (1.92±0.17) Bq/m3 to (16.7±1.83) Bq/m3. At Stations A1-5 and A3-9 the dissolved 210Pb were roughly two times higher than that of Stations A6-11 and A8-7 (Fig. 6), thus decreasing with increasing the distance off shore. This trend is opposite to the observation made in the Chukchi Sea (Lepore et al., 2009), but was similar to the distribution feature reported by Su et al. (2017) in the ECS. Interestingly, the highest dissolved 210Pb activities were found in the middle layers or near the bottom (30 m layer at Station A1-5, (16.7±1.83) Bq/m3; 15 m layer at Station A3-9, (12.6±1.22) Bq/m3; 30 m layer at Station A6-11, (13.1±1.45) Bq/m3; 15−30 m layer at Station A8-7, (4.90± 0.47) Bq/m3), indicating an additional input of 210Pb below the surface.
Typical ranges of 234Th activities were (6.5±0.17) Bq/m3 to (17.7±0.83) Bq/m3 in the dissolved phase. The fraction of dissolved to total 234Th varied from 47% to 90% (Table 1). This fraction can vary significantly but it is similar to other studies conducted in coastal sea areas. The results of this study were lower than that measured at the Jinhae Bay (67%−88%; Kim and Yang, 2004), the Black Sea (65%−94%; Wei and Murray, 1994) and the Middle Atlantic Bight (65%−90%; Santschi et al., 1999), but close to that determined in the Hung-Tsai Trough (39%−93%; Wei et al., 2009). Dissolved 234Th profiles showed minimum values in surface and intermediate waters (down to 6 m or 15 m) at all the stations.
Particulate Activities of 210Po and 210Pb changed from (0.20±0.02) Bq/m3 to (2.57±0.17) Bq/m3 and from (0.40±0.05) Bq/m3 to (3.40±0.30) Bq/m3, respectively (Table 1, Fig. 6), which are within the range usually reported in the literature (the Tagus Estuary, Portugal: 0.83−4.6 Bq/m3 for 210Po and 0.10−4.0 Bq/m3 for 210Pb (Carvalho, 1997); the Delaware Estuary, USA: 0.18−3.0 Bq/m3 for 210Po and 0.07−10 Bq/m3 for 210Pb (Marsan et al., 2014); the mouth of the Yellow Sea: 0.77−9.9 Bq/m3 (Hong et al., 1999); and the CRE: 0.14−11 Bq/m3 (Huang et al., 2013)). Significantly higher particulate 210Po and 210Pb contents were found at Stations A1-5 and A3-9, which were around 5−10 times higher than those at Stations A6-11 and A8-7. Vertically, both particulate 210Po and 210Pb contents generally displayed lowest activity in the subsurface and increased with depth with highest values near the bottom (Fig. 6).
Particulate 234Th activities varied from (1.00±0.17) Bq/m3 to (10.7±0.50) Bq/m3 (Table 1, Fig. 6), which can be compared to other coastal seawaters such as the Narragansett Bay, USA (0.50−15.8 Bq/m3; Santschi et al., 1979) and the Hung-Tsai Trough (1.00-15.8 Bq/m3; Wei et al., 2009). Particulate 234Th activities decreased with depth at Stations A1-5, A3-9, and A6-11, but increased with depth at Station A8-7 (Fig. 6).
4.
Discussion
4.1
Reasoning for the observed high dissolved 210Pb in bottom waters of the nearshore stations
Dissolved 210Pb activity was generally high close to the sea bottom, particularly at the nearshore stations, and the highest dissolved 210Pb concentration reported in this work is up to (16.7±1.83) Bq/m3. Obviously, the dissolved 210Pb values in this work were around 2−3 times higher than those values in some marginal seas and open oceans (Kim and Kim, 2012; Roca-Martí et al., 2016; Tang et al., 2019). However, some other studies in coastal waters have also reported relatively high concentrations of dissolved 210Pb, such as, in the Baffin Bay (15.8 Bq/m3; Baskaran and Santschi, 1993), a salt marsh wetland located in the Spanish Mediterranean coast (up to 13.3−22.5 Bq/m3, salinity>20; Garcia-Orellana et al., 2013) and some freshwater systems (Benoit and Hemond, 1990; Jweda et al., 2008).
The abnormally high 210Pb activity in dissolved phases implied that there were supplementary sources of 210Pb to the intermediate and bottom waters. And additional inputs of high 210Pb activity in nearshore seawaters could be due to such as: (1) submarine groundwater discharge (SGD), (2) river, (3) lateral inputs, (4) remobilization from the sinking particles, (5) ingrowth from 222Rn decay and (6) release/remobilization from the bottom sediment.
(1) SGD is one potential pathway to increase the 210Pb activity, because very high dissolved 210Pb were often observed in groundwaters (>826 Bq/m3 (n=14), Dickson and Herczeg, 1992; 108 Bq/m3, Harada et al., 1989; >78 Bq/m3 (n=7), Ruberu et al., 2007). However, there is no research data about 210Pb activity in groundwaters of the CRE coastal zone. Guo et al. (2020) found an important submarine groundwater discharge in 2018 in the same study area, which have an important influence on hypoxia by adding groundwater enriched in various elements to the bottom of the water column. Hence, the contribution of SGD-discharged 210Pb might be important.
(2) As for the influence of the high 210Pb laden Changjiang River water, we have no direct observations of 210Pb activity in the river water in July, 2016. Bi (2013) reported high 210Pb activity ((15.1±2.12) Bq/m3) in Xuliujing of Changjiang River in July, 2012 based on the one-year time-series observation. But the CDW only influences the upper 10−15 m depth of the water column (low salinities, Fig. 2), hence, high 210Pb laden Changjiang River might not have a contribution to the observed high 210Pb activity ((16.7±1.83) Bq/m3) at bottom layer of the Stations A1-5 and A3-9.
(3) The contribution of the lateral inputs from other seawater masses with high 210Pb activity was excluded because no seawaters masses with high 210Pb activity (>6.67 Bq/m3; Su et al., 2017) were reported in the eastern China waters.
(4) Remobilization of 210Pb from the sinking particles seems negligible due to the increase of the particulate 210Pb with depth in the water columns (Fig. 6), meaning that particles absorb 210Pb as they sink.
(5) In situ production from 222Rn in the fluids also appears to be an unlikely source of dissolved 210Pb in the bottom waters, because, after considering the bottom water residence time of several months to a year, it would require an average activity of 222Rn of (3.6±0.4)×104 Bq/m3, which is very unlikely in the ECS off the CRE.
(6) Another reason of the high dissolved 210Pb activities is likely a consequence of release and/or remobilization from the bottom sediments. Benoit and Hemond (1990) reported that dissolved 210Pb activities were 11.2 Bq/m3 and 11.7 Bq/m3 in the hypolimnion of Bickford Reservoir due to dissolved oxygen dropped below 1 mg/L at the sediment-water interface, which implied that 210Pb could be remobilized from sediments to the water column in significant amounts under reducing conditions. Here, the DO concentrations decreased to nearly 2 mg/L (2.64 mg/L and 2.39 mg/L) at the near-bottom water (30 m and 35 m for Stations A1-5 and A3-9, Fig. 3). The concurrence of high 210Pb activity and hypoxia might support the interpretation that 210Pb is released from sediments under the influence of reducing conditions.
According to the above discussion, it can be deduced that the most important cause for the high dissolved 210Pb activity was the release and/or remobilization from the bottom sediment or submarine groundwater discharge. In marine systems, Po and Ra. exhalation from sediments have been reported frequently (Hong et al., 1999; Kim et al., 2005; Jones et al., 2015; Kipp et al., 2018), which also indirectly indicated that the release of 210Pb from sediment could be an important explanation to the high dissolved 210Pb in deep seawater. Without further information, the reason for why the 210Pb released from the sediments under hypoxia condition was not clear. A similar study in Bickford Reservoir (Benoit and Hemond, 1990) found that 210Po and 210Pb were released to the anoxic and suboxic waters in the hypolimnion during summer and 210Pb and 210Po cycling were closely linked with that of iron and manganese, thus, we inferred that the release of 210Pb in the ECS could be also linked to the cycling of the transition metals, like Fe and Mn.
Assuming that the high dissolved 210Pb is totally derived from the release/remobilization from the bottom sediment, then, vertical eddy diffusion coefficient (Kz) and benthic 210Pb flux (FPb-210) can be estimated by a simple 1-D diffusion model. Let’s take data of Station A1-5 for example, the Kz of bottom seawater (between 15 m and 30 m) at Station A1-5 can be calculated based on the vertical gradient of dissolved 210Pb activities in the water column using this following equation (Kim et al., 2005):
where C1 and C2 are the dissolved 210Pb activities at the two depths (15 m and 30 m); z is the depth interval; λPb is the decay constant of 210Pb; and Kz is the vertical eddy diffusivity. With these assumptions, the vertical eddy diffusivity was measured to be 1.14×10⁻² m2/d.
Using the obtained estimates of Kz and dissolved 210Pb activity gradient, dissolved 210Pb flux from a unit area of seabed into the overlying water column (FPb-210) can be calculated by the following Eq. (2):
Generally, when using 210Pb dating, the assumption that sediment records the atmospheric deposition flux of 210Pb was used. Based on Eq. (2), dissolved 210Pb flux from a unit area of seabed into the overlying water column at Station A1-5 was estimated to be 9.3×10⁻³ Bq/(m2·d), which is far below the atmospheric deposition flux of 210Pb in Shanghai (~1.05 Bq/(m2·d); Du et al., 2015) and Xiamen (0.35−0.50 Bq/(m2·d); Chen et al., 2016). Obviously, this release flux of 210Pb from sediments is quite possible, because the release flux of 210Pb from sediment would account for less than 1% of the atmospheric deposition flux of 210Pb.
4.2
Features of chemical parameters and radionuclides during algal blooming
When algal blooming occurred, there were some significant features. Firstly, much higher concentrations of Chl a, contents of PN and POC in algal bloom stations than those in non-bloom stations were found (Fig. 3), which indicated that plankton increased remarkably. Secondly, concentrations of $ {\rm{NH}}_4^{+} $, $ {\rm{PO}}_4^{3-} $, and $ {\rm{NO}}_3^{-} $ decreased, especially in the surface layers of water columns (Figs 4e, g and h). However, the dinoflagellates (especially, N. Scintillan) were the dominant species in this study area, the concentration of $ {\rm{SiO}}_3^{2-} $ did not decrease with phytoplankton increasing (Fig. 4i). In addition, in the stations with algal blooms, particles showed higher POC/PN content ratios along the entire water column (Fig. 5).
As expected, the activities of particulate 210Po (P-Po) and 210Pb (P-Pb) in algal blooming areas were 2 or 3 times higher than those in non-blooming areas (Table 2), showing the enrichment of Po and Pb by plankton (Stewart and Fisher, 2003; Stewart et al., 2005). Interestingly, contents of particulate 234Th in blooming stations were lower than those in non-blooming stations, showing the different behaviors between Th and Po or Pd. 210Po/210Pb activity ratios in particulate phases were lower than 1 (Table 2), and the particulate 210Po deficits relative to 210Pb in bloom stations were stronger than those in non-bloom stations, suggesting that plankton growth enhances the disequilibrium of 210Po relative to 210Pb. Total 234Th/238U activity ratios were similar in both bloom and non-bloom station, but lower than unity.
Table
2.
Comparison of activities (average±SD) of radionuclides (210Po, 210Pb and 234Th), 210Po/210Pb and 234Th/238U activity ratios between bloom and non-bloom stations
D-Po/ (Bq·m−3)
P-Po/ (Bq·m−3)
D-Pb/ (Bq·m−3)
P-Pb/ (Bq·m−3)
D-Th/ (Bq·m−3)
P-Th/ (Bq·m−3)
D-(210Po/210Pb)
P-(210Po/210Pb)
T-(210Po/210Pb)
T-(234Th/238U)
Bloom (n=9)
0.77±0.17
1.22±0.58
9.3±4.2
2.20±0.67
10.7±3.0
3.3±2.5
0.10±0.06
0.55±0.15
0.19±0.07
0.48±0.22
Non-bloom (n=11)
0.85±0.23
0.58±0.58
4.5±3.0
0.75±0.52
9.5±2.8
5.7±3.0
0.25±0.13
0.70±0.21
0.32±0.18
0.43±0.14
Note: D refers to dissolved fraction; P, particulate fraction; and T, dissolved fraction plus particulate fraction; n denotes the sample number in entire water columns.
4.3
Enhanced enrichments of 210Po, 210Pb and 234Th by degraded particles
In order to understand the important role of biogenic particles in regulating the scavenging behavior of radionuclides in the study area during algal blooming, we examined the relationships between POC and particulate 210Po, 210Pb, and 234Th (Figs 7a-c). Here, particles in surface, middle and bottom waters were distinguished based on water depth and TSM content. Firstly, particles collected at 1 m and 6 m depth of all four water columns were defined as the surface samples. In Table 1 and Fig. 3, TSM contents in bottom waters are 2−13 times higher than that in 15−30 m layer waters, hence, we judged the particles collected at the near bottom layer were defined as the bottom samples which were influenced by the benthic nepheloid layer or resuspension of sediments. Except for the two layers defined above, the particulate matters in the remaining layers were defined as the middle layer samples. Significant positive linear correlations between POC and particulate 210Po and 210Pb were observed (Figs 7a, b) along the entire water column, indicating that POC showed a significant influence on scavenging these two radionuclides (210Po and 210Pb). Based on the slopes of the regression lines, middle and bottom waters tended to be more sensitive to the increment of POC contents as compared to surface particles (Figs 7a, b). Particulate 234Th content displayed a negative relationship to POC content (Fig. 7c), suggesting that the increase of contents of POC did not enhance the particle affinity of 234Th and instead dilute the 234Th content.
Figure
7.
Relationships between POC content and particulate 210Po (a), 210Pb (b) and 234Th (c) activity in surface (black squares), middle (red dots), and bottom (blue triangles) waters.
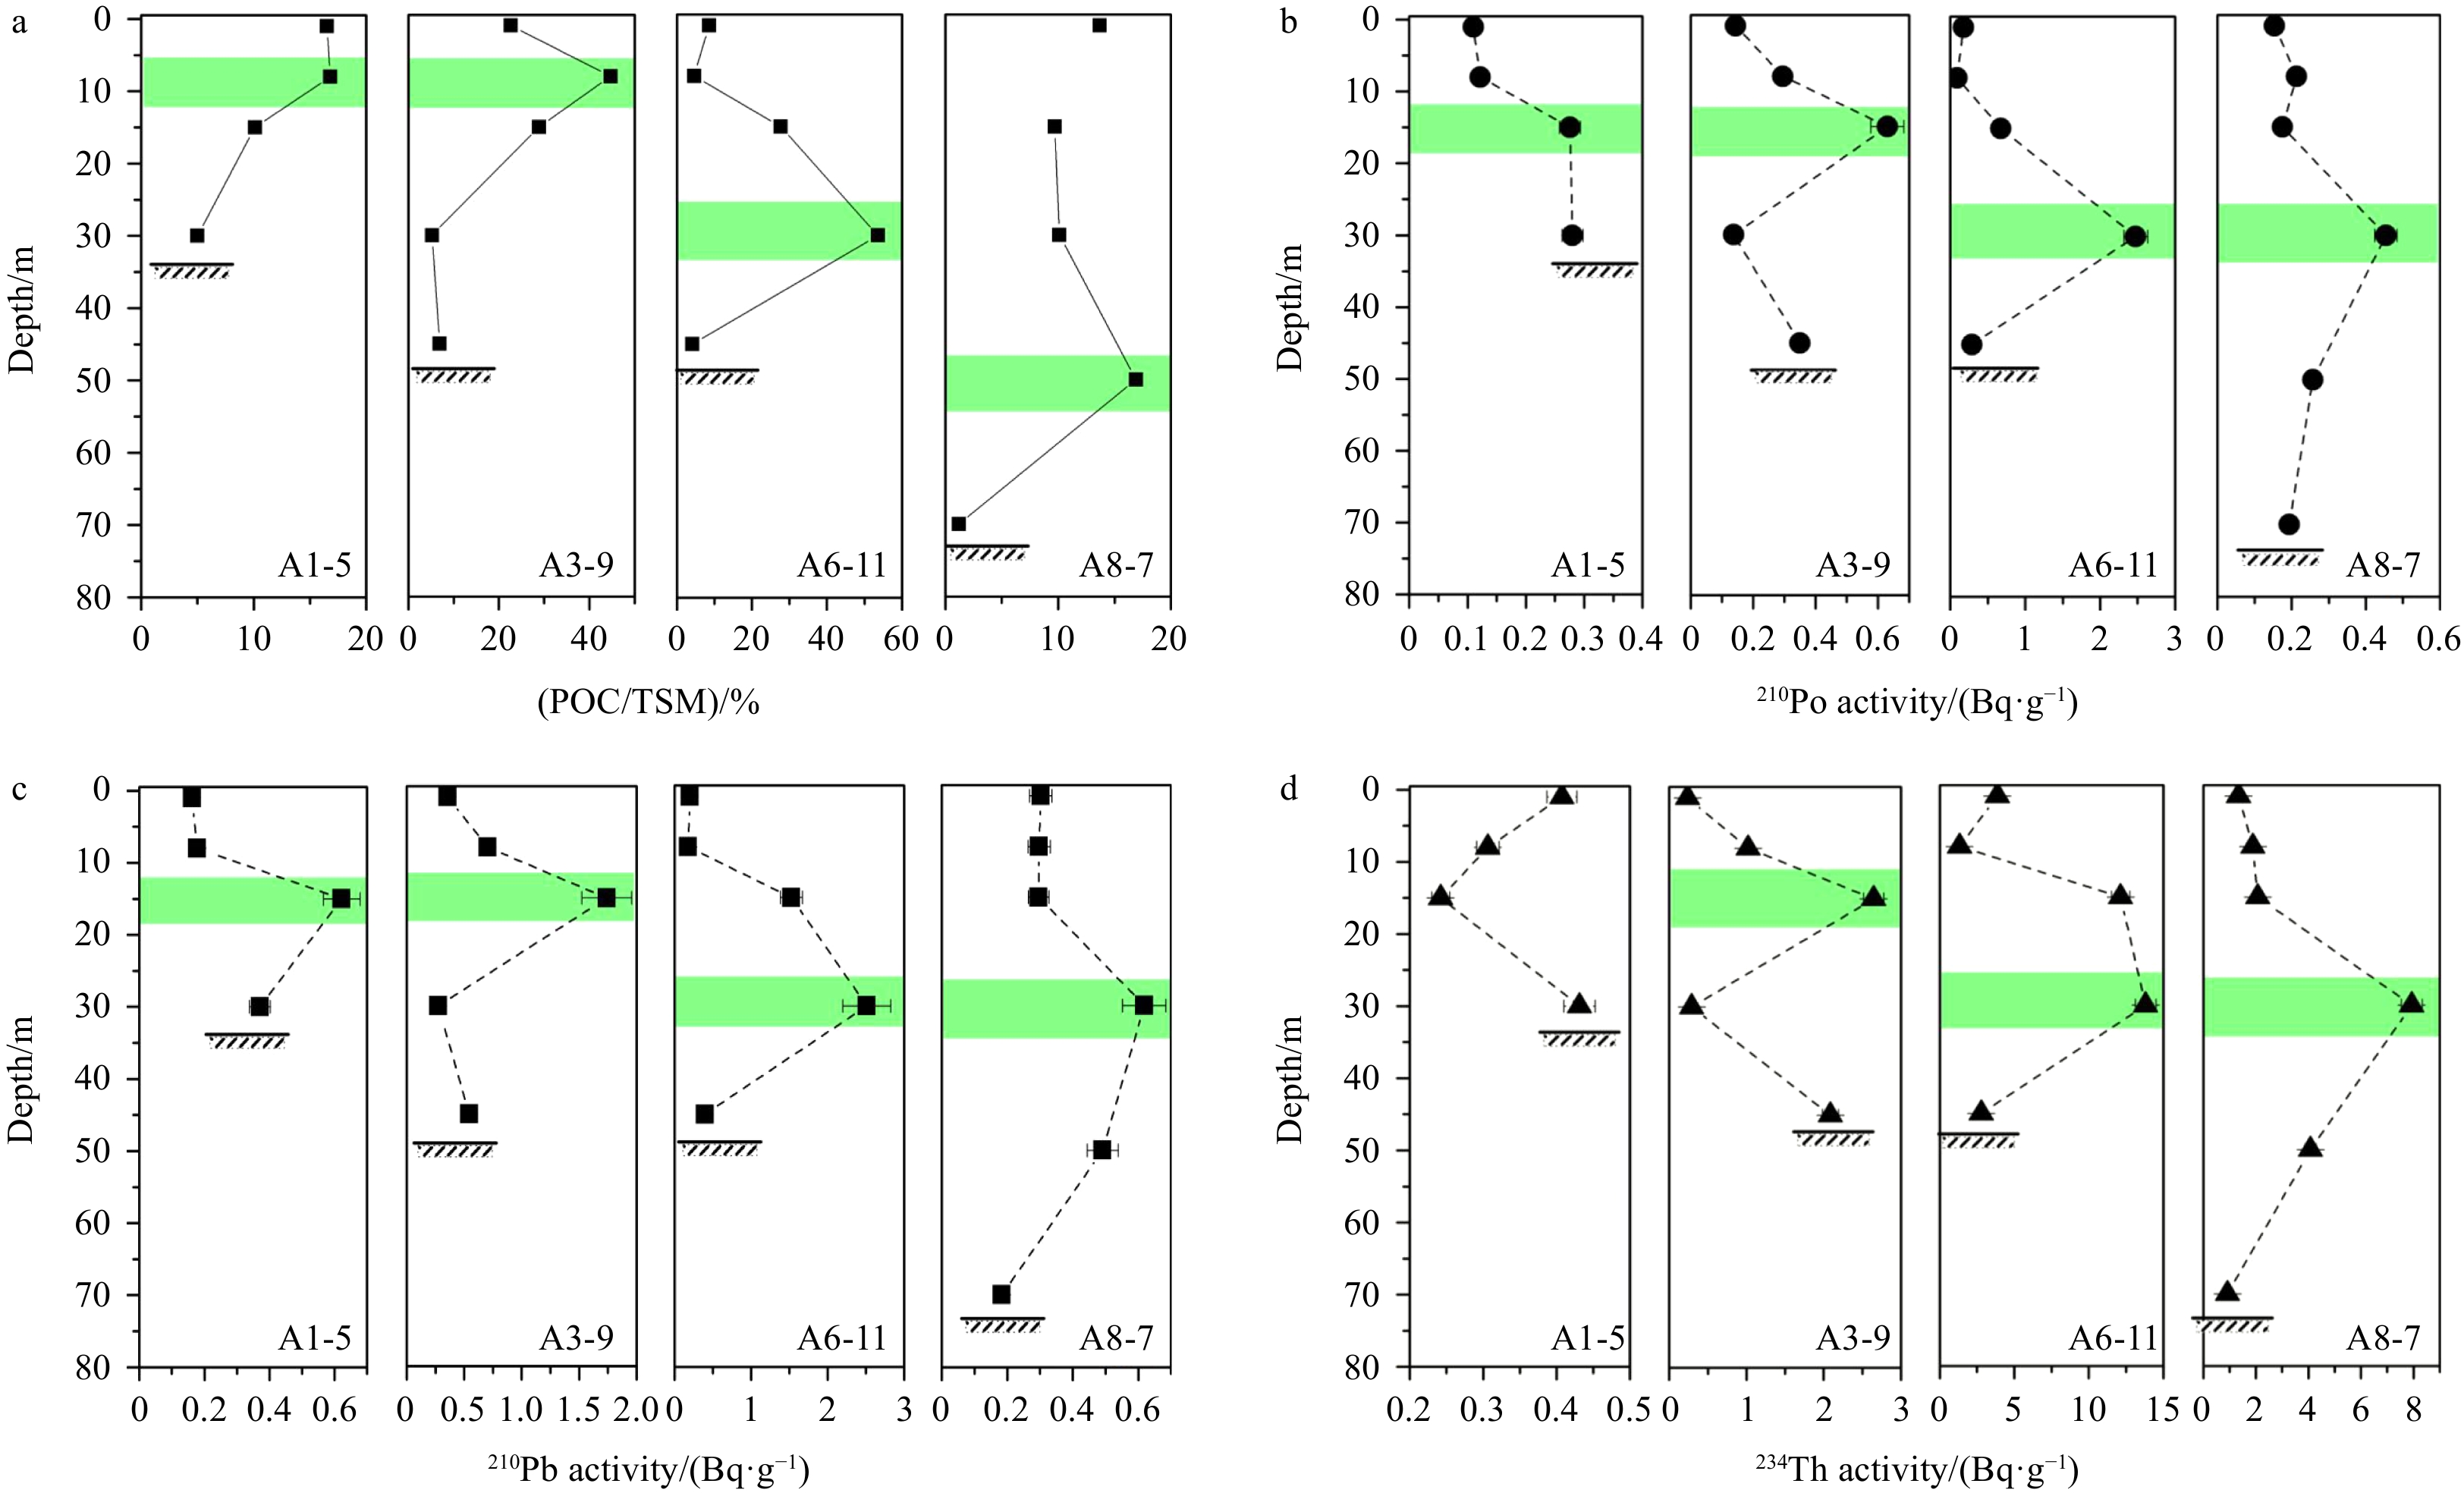
Furthermore, we can examine the existence of enhanced scavenging of Po, Pb, and Th based on the correspondence between the mass specific activity and organic carbon content (POC/TSM content ratio, in %) in particles. Here, the mass specific activity of radionuclide is calculated from the following equation:
where Am is the mass specific activity (Bq/g) of 210Po or 210Pb or 234Th; Ap is the content of the particulate 210Po or 210Pb or 234Th; and TSM denotes the content of total suspended matter. The profiles of POC/TSM content ratios are displayed in Fig. 8a. The calculated mass specific activities of 210Po, 210Pb and 234Th are presented in Table 3 and Figs 8b-d. The mass specific activity of 210Po ranged from 0.088 Bq/g to 2.47 Bq/g and that of 210Pb varied from 0.162 Bq/g to 2.51 Bq/g along the entire water columns. 234Th mass specific activity ranged from 0.238 Bq/g to 13.8 Bq/g for all four stations. 210Po, 210Pb and 234Th activities in the suspended particles of the middle layer waters are significantly higher than those of surface waters and bottom waters (Table 3, Figs 8b-d). From Figs 8a-d, it could be seen that the peaks of the mass specific activities of 210Po, 210Pb, and 234Th appeared in the middle layers of water columns, corresponding to the peaks of POC/TSM content ratios in the middle layers of water columns. Hence, we judged that the particles in the middle layer had a stronger enrichment capacity for particle-reactive radionuclides than particles from the surface and bottom waters.
Figure
8.
Profiles of the POC/TSM content ratio (a) and mass specific activities of 210Po (b), 210Pb (c), and 234Th (d) at the four stations. The green highlighted regions represent the peaks of mass specific activity of 210Po, 210Pb and 234Th in water columns.
From Fig. 5, we can obtain some information for interpretation of the peaks of mass specific activities of 210Po, 210Pb and 234Th in the middle layers. Firstly, we can see that δ13C values increased with depth at most stations, this variation may reflect the degradation of sinking organic matter in deep water (Gao et al., 2014). Then, the POC/PN content ratios are often indicative as the predominant source of organic matter in a system. And the POC/PN content ratios ranged from 1.8 to 6.8 throughout the water columns in this study area, with higher values (proximal to the Redfield ratio of 6.63) at blooming stations (A1-5 and A3-9), indicating the contribution of organic matter from in situ primary production. Besides, we also found that the POC/PN content ratios of particulate organic particles decreased with depth (Fig. 5), which may be related to the decomposition processes (autolysis, leaching and microbial mineralization) (Wu et al., 2003). Therefore, it can be deduced that the particles in the middle and bottom layers have experienced a certain of degradation based on the profiles of POC/PN content ratio and δ13C values (Fig. 5). In summary, although the degradation of particles in the middle water occurs, the 210Po, 210Pb and 234Th contents of these particles in the middle layer have been improved. In other words, as these biogenic particles settle down, the biodegradable components of the particles are lost, but the radionuclides in the particles are not.
But why are the mass specific activities of 210Po, 210Pb and 234Th of bottom particles lower than that of middle layer particles? The most likely explanation pointed to the influence of the resuspension of bottom sediments. Wang et al. (2016) reported that the activities of 234Thex and 210Pbex in the ECS surficial mobile muds ranged from 0.007 Bq/g to 0.162 Bq/g (mean: (0.085±0.054) Bq/g) and 0.005 Bq/g to 0.171 Bq/g (mean: (0.063±0.041) Bq/g), respectively. However, the activities of 234Th and 210Pb in the TSM of bottom water in our study were (0.37±0.13) Bq/g and (1.56±0.93) Bq/g, respectively (Table 3), much higher than those value from the ECS mobile mud. Hence, very fine sediment particles were re-suspended from the seabed and this process further increased the TSM content in the bottom water (Fig. 3). Finally, the dilution of low-activity sediments decreased the mass specific activities of 210Po, 210Pb and 234Th of the suspended particles in the bottom water.
The peaks of mass specific activities of 210Po, 210Pb and 234Th in the water column indicated that the sinking particles in the middle water have accumulated more particle-reactive radionuclides relative to the surface biogenic particles. Based on these results, we can describe the whole scavenging-removal processes as following. When these phytoplankton cells were alive and growing, they weakly accumulated trace metals and some radionuclides. After they die, they would sink, and subsequently, the settling phytoplankton detritus could be further disassembled and degraded by marine bacteria, viruses, and zooplankton. The gradual loss of biogenic particles leads to the loss of TSM weight in the middle waters. And the organic matter bound radionuclides or siliceous or calcareous bound radionuclides would be regenerated and the remaining radionuclides versus TSM weight contents becomes larger. It is precise this process that leads to the observed peaks of mass specific activities of Po, Pb, and Th in particles of intermediate and bottom waters. As the sinking particles continue to settle down, resuspension of the fine sediments finally reduces the mass specific activities of 210Po, 210Pb and 234Th in the particles in the bottom water once these two particles mix with each other.
4.4
Distribution coefficient and particle content effect
The distribution cofficient (Kd) of particle-reactive radionuclides are useful for describing their affinity to marine particles (Baskaran and Santschi, 1993; Wei et al., 2012; Su et al., 2017; Tang et al., 2017). To understand the important role of suspended matter in regulating the fate of trace metals (in this case Pb, Po and Th) during an algal bloom, the Kd values (mL/g) of the three radionuclides of interest, 210Po, 210Pb and 234Th, were calculated using the equation:
where AP and AD represent the nuclide activities in the particulate and the dissolved phases, respectively.
The Kd values for the 210Po and 210Pb, varied from 1.2×10⁵ mL/g to 4.5×10⁶ mL/g and from 1.4×10⁴ mL/g to 2.8×10⁵ mL/g, respectively. The Kd values suggested that 210Po has a higher particle affinity than 210Pb. The Kd values of 210Po and 210Pb are similar to values reported by Masqué et al. (2002) (105.58−105.97 mL/g and 104.90−105.08 mL/g for 210Po and 210Pb, respectively). The Kd values of 234Th varied from 2.0×10⁴ mL/g to 2.1×10⁶ mL/g, which is one magnitude higher than those values determined for the surface waters in the Jinhae Bay during a red tide event (0.6×10⁴−1.3×10⁵ mL/g, Kim and Yang, 2004). Furthermore, the values of distribution (log10Kd) versus total suspended matter content (log10TSM) were plotted in Fig. 9a, which shows that the Kd of 210Po was generally higher than that of 210Pb, in agreement with previous results (Zuo and Eisma, 1993; Hong et al., 1999), and slightly higher than that of 234Th. And most of the particulate matter in open sea system is biogenic particle which has stronger affinity for Po than for Pb. The slopes of the regression lines showed in Fig. 9a for 210Po and 210Pb are nearly the same (−0.56 for 210Po and −0.57 for 210Pb), which indicates the similar sorption efficiency of 210Po and 210Pb for TSM (Kim and Yang, 2004). However, 234Th has the strongest “particle content effect” compared to 210Po and 210Pb because the slope of 234Th’s regression line is the lowest (−1.17, Fig. 9a).
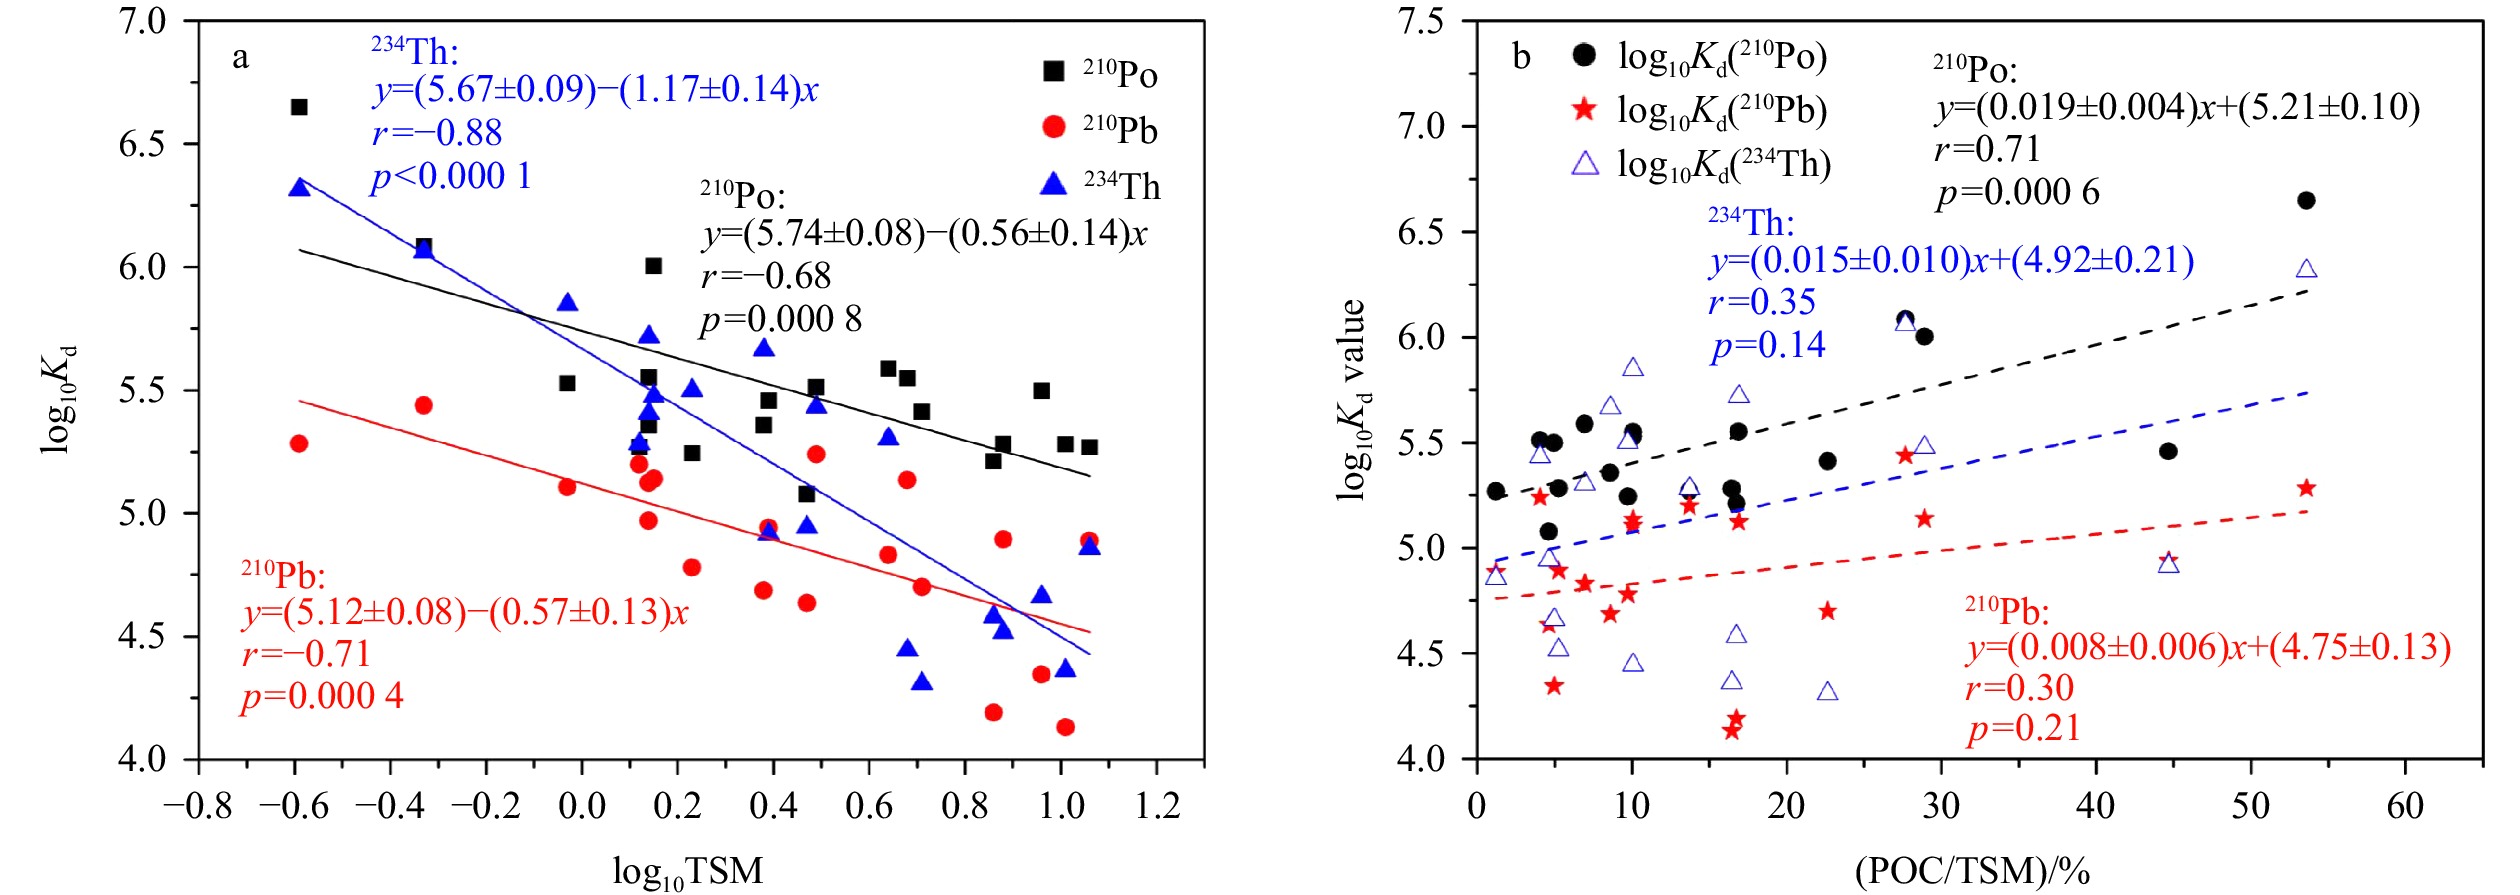
Figure
9.
Relationships between the variation in the distribution coefficient (log10Kd, mL/g) for 210Po, 210Pb, and 234Th and the particle content (log10TSM) (a), and organic carbon content in TSM (b).
Over a range of nearly two orders of magnitude of TSM contents, an inverse correlation between log10Kd and log10TSM was also observed for all three radionuclides (Fig. 9a) as reported by previous field and laboratory observations (Baskaran et al., 1992; Guo et al., 1997; Wei and Murray, 1994). Such negative correlation is known as the “particle content effect”. And this “particle content effect” could be due to the presence of colloidal materials which can scavenge radionuclides (Honeyman and Santschi, 1989). The colloids provide sorption sites available for particle-reactive radionuclides within the <0.45 μm dissolved phase. Increases in particle content are related to increases in the quantity of colloidal radionuclides (Tang et al., 2017). Increases in phytoplankton biomass have associated with a rise in phytoplankton detritus, colloids, bacterioplankton and viruses (Wildgust et al., 1998). Baskaran et al. (1992) found the percentage of 234Th associated with the colloidal material could be 14%−78% for the surface waters collected from the shelf and slope of the Gulf of Mexico. In addition, Baskaran and Santschi (1993) reported that 32% of 234Th and 16.8% of 210Pb was associated with the colloidal fraction for coastal waters off Galveston, Texas. Hence, the colloidal radionuclides might result in an overestimate of the dissolved radionuclide fraction (AD) and leading to the inverse relationship between log10Kd and log10TSM.
To examine the influence of chemical composition of the particles on the Kd values, relationships between distribution coefficients (log10Kd) and organic carbon contents were examined in Fig. 9b. 210Po exhibited a higher affinity for POC than 210Pb, supporting the use of 210Po disequilibrium from 210Pb as a tracer of the POC export in the sea. But the result revealed a scatter relation for 234Th, which implied that there were some additional factors influencing the distribution behavior of 234Th. The results implied that the organic carbon contents also play an important role in scavenging radionuclides (Friedrich and van der Loeff, 2002).
4.5
Intensified fractionation between radionuclides during algal bloom
More insight on the geochemical behaviors of 210Po, 210Pb and 234Th can be obtained from the fractionation factors:
which are the ratios of the Kd values of the interested radionuclides. Vertical distributions of the ratio of Kd values of the three radionuclides are shown in Fig. 10. The FPo/Pb values were all >1 in all four stations, indicating a stronger preference for scavenging of 210Po over 210Pb. At the algal blooming stations (A1-5 and A3-9), most FPo/Pb values were 2−4 times higher than that of non-blooming stations (A6-11 and A8-7) (Fig. 10a), suggesting that the phytoplankton bloom could intensify the fractionation of Po and Pb. Similarly, most FPo/Th values were >1 (Fig. 10b), and much higher FPo/Th were found in water columns where algal blooms occurred (2−13 for Stations A1-5 and A3-9 compared to 0.5−2.5 for Stations A6-11 and A8-7), indicating a preferential uptake of Po by phytoplankton relative to Th. However, Kd(234Th) tended to exceed Kd(210Pb) leading to fractionation factors (FPb/Th) close to or less than unity (Fig. 10c). Based on the comparison of the fractionation factors of these three radionuclides, it could be concluded that three radionuclides’ particle affinity is Po>Th>Pb, with intensified differences when an algal bloom was occurring (Stations A1-5 and A3-9).
Figure
10.
Fractionation factors of 210Po to 210Pb (a), 210Po to 234Th (b) and 210Pb to 234Th (c) at the four sampling stations.
4.6
Indication of POC content/tracer activity ratios in the settling particles
The 210Po and 234Th are good tracers for evaluating the POC export fluxes from the upper ocean. The determination of POC fluxes (new production) from natural radionuclides (234Th and 210Po) involves obtaining the magnitude of the deficits of the radionuclide with respect to its parent, as well as the POC/234Th (POC content/234Th activity, by analogy) or POC/210Po ratio on the particles responsible for the deficit. Assuming a steady-state model and negligible advection and diffusion, the export of total 210Po and 234Th from the euphotic layers can be calculated using
$$ {J}_{z}^{D}={\text{λ} }_{{\rm{dau}}}{\int }_{ 0}^{z}\left({A}_{{\rm{Par}}}-{A}_{{\rm{dau}}}\right){\rm{d}} z , $$
(8)
where Adau is the total daughter (234Th or 210Po) activity; APar is the total parent (238U or 210Pb) activity; λdau is the decay constant of the daughter isotope; $J_z^D $ is the flux of 234Th or 210Po removed from the depth interval and z indicates the depth horizon. POC fluxes are estimated by multiplying the value of $J_z^D $ by the POC/234Th or POC/210Po ratio in sinking particles at z layer:
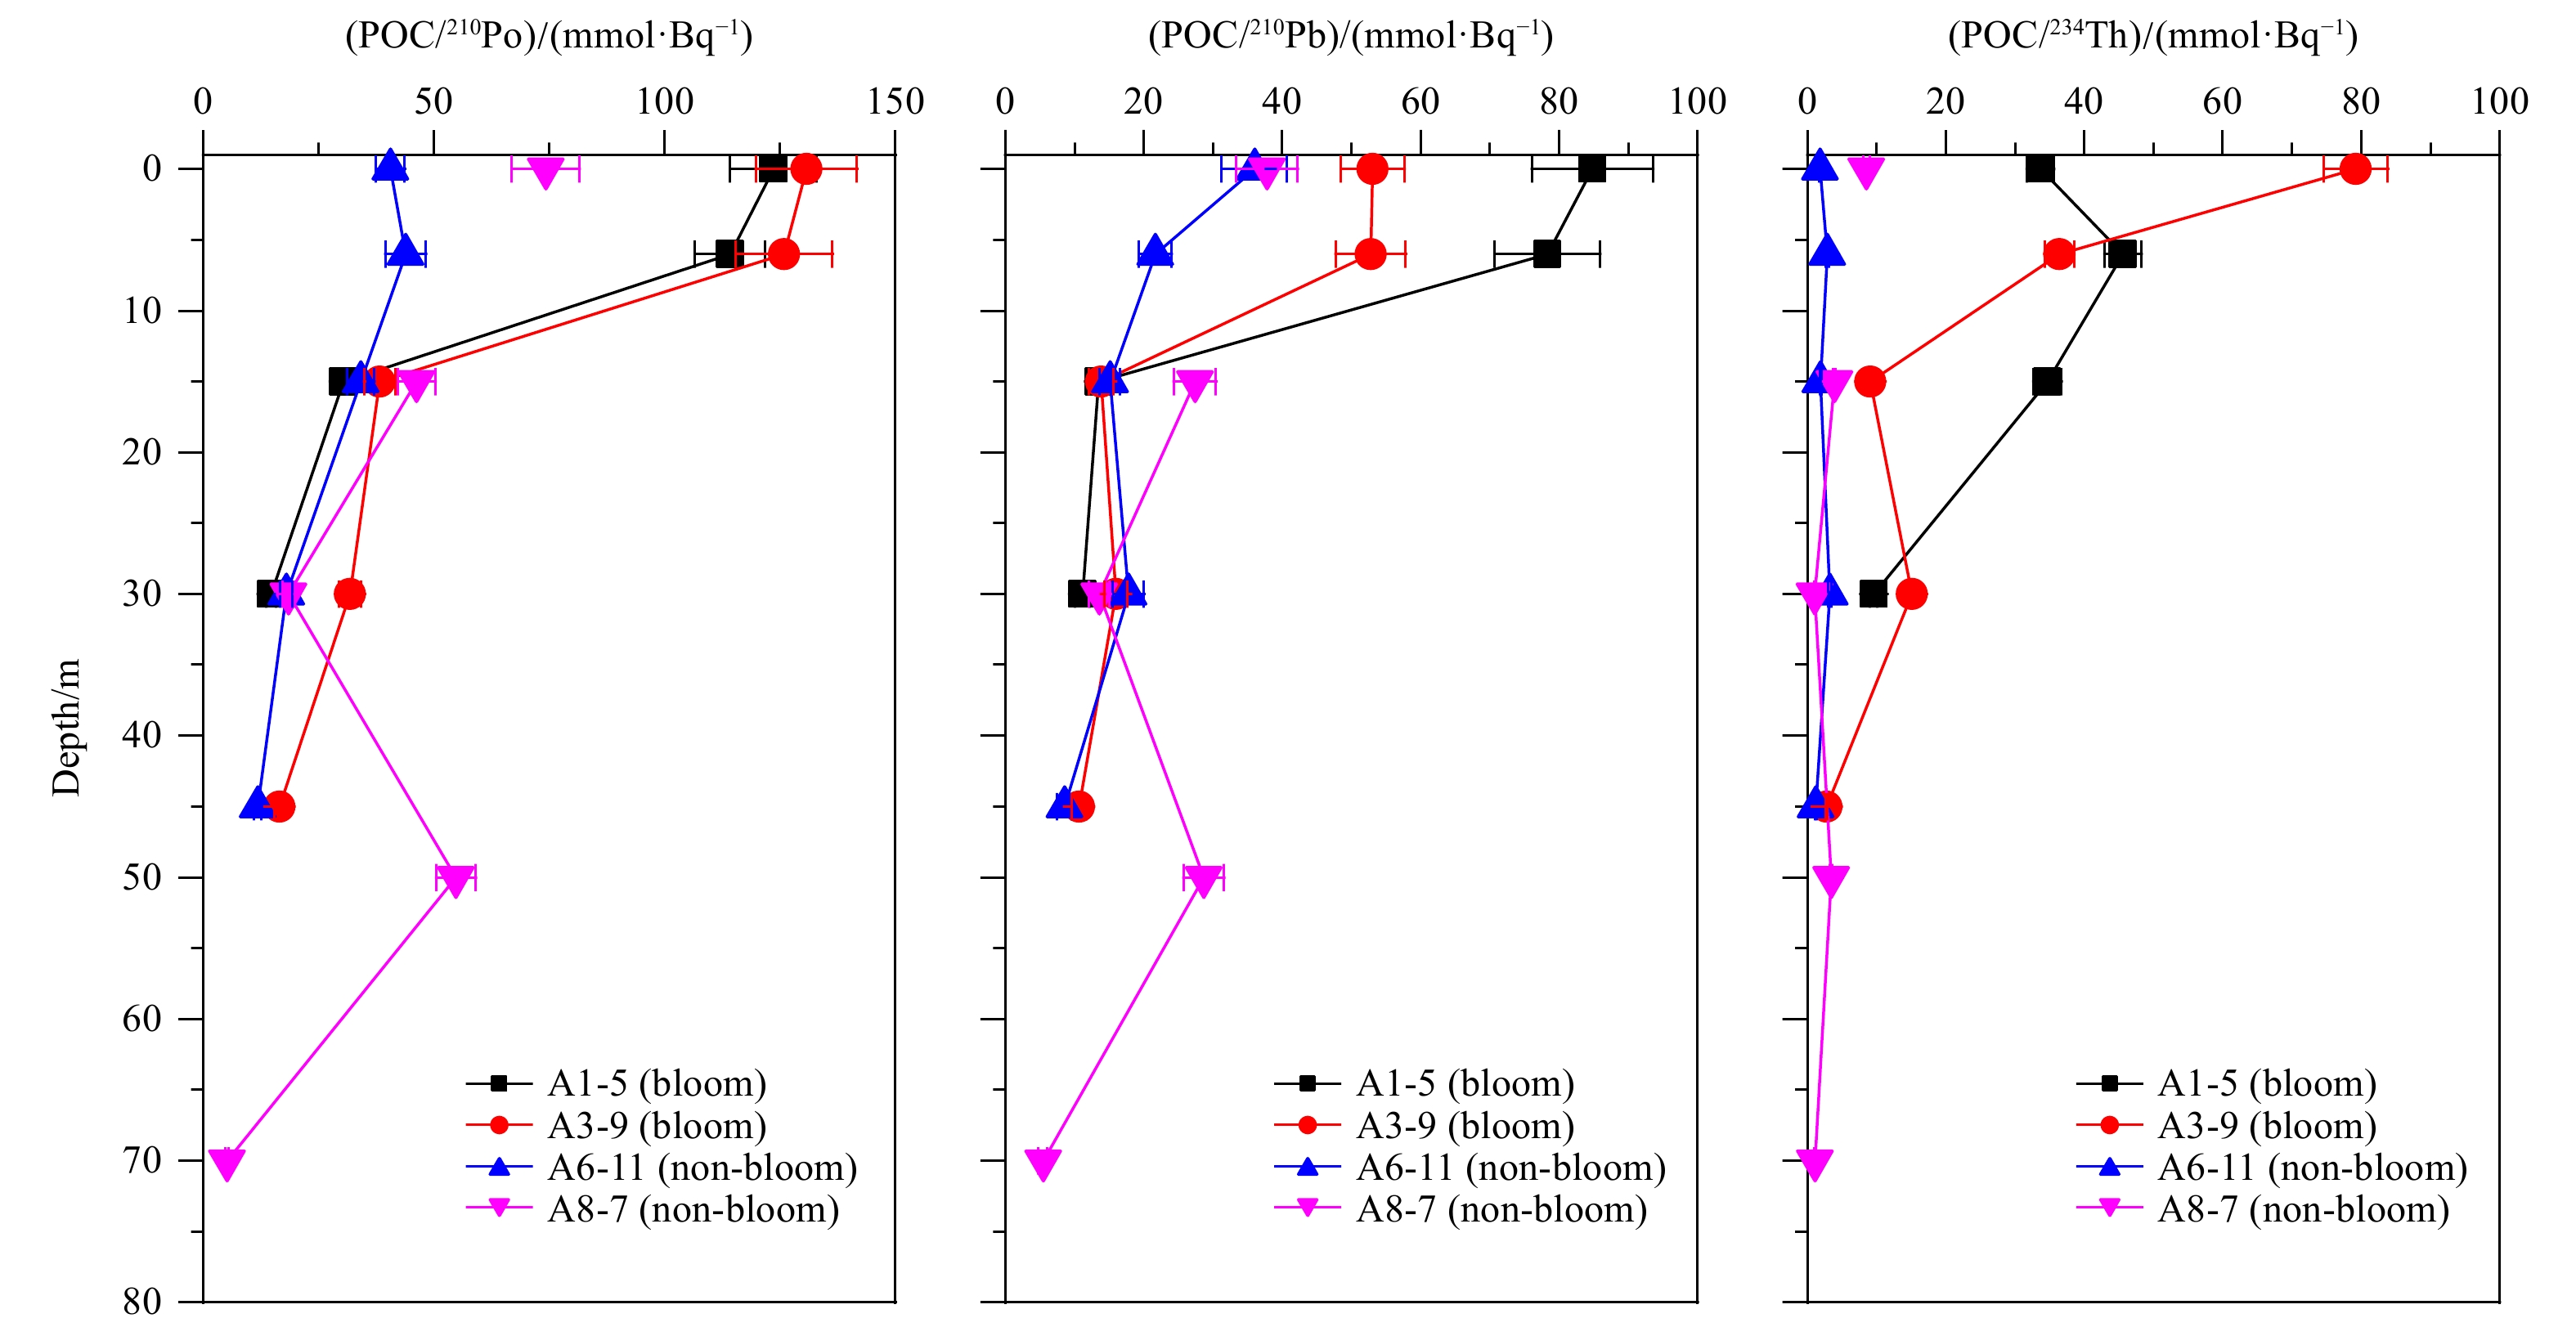
Thus, the uncertainties in determining 210Po or 234Th export and the POC/radionuclide ratio can strongly influence the accurate radionuclide-derived POC flux. The composition of sinking particle (Stewart et al., 2007), particle size (Stewart et al., 2011; Ceballos-Romero et al., 2016), and properties of radionuclides (Subha Anand et al., 2018; Stewart et al., 2011) may increase the differences of 210Po and 234Th as POC tracers. Here, we observed that the POC/210Po ratios, the POC/210Pb ratios, and the POC/234Th ratios in all the particulate samples for these four water columns decreased significantly with increasing depth (from ~120 mmol/Bq to ~6 mmol/Bq), especially at algal blooming stations (Fig. 11). The decrease of the POC/radionuclide ratios for 210Po, 210Pb, and 234Th was derived from the increase of particulate 210Po, 210Pb, and 234Th activities with depth increasing (Fig. 6), and from the decrease of POC content in TSM with increasing of depth (Fig. 3) (Buesseler et al., 2006; Puigcorbé et al., 2015; Tang et al., 2019). Obviously, the POC content/radionuclide activity ratios decrease rapidly from surface to 15 m layer and after 15 m layer, the ratios become stable until at the near bottom layer (Fig. 11). This phenomenon implied that the POC of these biogenic particles would be effectively reused and preliminarily degraded in the middle or bottom layer of seawater column. And the POC/210Po, POC/210Pb and POC/234Th ratio became sharply changeable in these tens of meters of the water column (Fig. 11). Hence, for the shallow coastal sea, once algal blooming occurred, how to select the export interface is a problem that needs to be taken into consideration. Because whichever radionuclide is chosen as the tracers, the extremely variable POC/210Po, POC/210Pb and POC/234Th ratios in different interface would result in a significant difference in POC export fluxes.
Figure
11.
The ratios of POC content to 210Po, 210Pb, and 234Th activities in the particulate samples.
The importance of the particle type on POC/radionuclide ratios in the suspended particles is shown in Fig. 12. All the data points can be divided into three clusters. Cluster 1: Four particulate samples with higher POC/210Po, POC/210Pb, and POC/234Th are associated with fresh plankton particles (Fig. 12), because these four particulate samples were collected from the surface (0 m and 6 m layer) of the algal blooming stations (A1-5 and A3-9). Six samples were distinguished to as Cluster 2 due to their low POC/210Po, POC/210Pb, and POC/234Th ratios (Fig. 12). Moreover, a good linear correlation of POC/210Po and POC/210Pb for these six samples (located in the 1:1-line in Fig. 12a) suggested an equilibrium state of 210Po and 210Pb. Such data implied that these particles might be dominated by the fecal pellets (with low POC content/radionuclide activity ratio, Stewart et al., 2007) or the resuspended particulate matters from seabed since those samples were collected at the closest depth to the seabed. The rest samples (Cluster 3) represented the primary degraded materials with elevated POC/210Po ratios. From Fig. 12b, the relationship of POC/210Po with POC/234Th showed that much of the variation in both would be limited through a mixing line between fresh phytoplankton and degraded marine particles (resuspended particles from the seabed). However, the dominated particles are different due to degree of degradation, component, and content of the organic materials in particles, and the POC/210Po and POC/234Th activity ratio in these particles would also vary largely, which subsequently cause the significant different estimated POC-flux results. Therefore, there is a greater need to carefully select suitable tracers to obtain the accurate radionuclide-derived POC-flux in different situations, especially when algal blooming occurs.
Figure
12.
POC/210Po vs. POC/210Pb (a) and POC/210Po vs. POC/234Th (b) (POC content/radionuclide activity) in the particulate samples. Data enclosed in black ellipse represent samples collected from surface layers at algal blooming stations. Data enclosed in blue ellipse represent fecal pellets or resuspended particulate matters. The red dashed lines indicate the 1:1 line.
From this investigation of the dissolved and particulate 210Po, 210Pb, and 234Th activities in four water columns in the CRE and ECS during an extensive red tide event in July 2016, the following conclusions can be drawn:
(1) The dissolved fractions of 210Po (26%−80%), 210Pb (53%−95%) and 234Th (47%−90%) indicated that most of these three radionuclides were mainly in dissolved phases. The high dissolved 210Pb concentrations (7.17−16.7 Bq/m3) were observed in the nearshore waters and in the intermediate and bottom waters of offshore stations, which might be caused by the release from bottom sediment or submarine groundwater discharge.
(2) Different strong relationships were found between the contents of POC and particulate activities of 210Po and 210Pb in surface, middle, and bottom waters, indicating the discriminations in particle properties and the important role of biological particles in scavenging of 210Po and 210Pb. Positive correlations between POC/TSM content ratios and log10Kd values for 210Po, 210Pb and 234Th were observed, indicating that the organic carbon content in particles was an important driver in regulating the partition behaviors of radionuclides between particles and dissolved phases.
(3) Fractionation factors, FPo/Pb and FPo/Th, were found to be >1 for most of the samples, and algal blooming can promote the fractionation behavior of Po against Pb and Th. 210Po exhibited a higher affinity for biogenic particle (like POC) than 210Pb, supporting the use of 210Po-210Pb disequilibrium as a method in tracing the export of organic matter (POC) in the sea.
(4) Particles in different depth have a markedly different POC/210Po or POC/234Th activity ratios due to the composition difference or the degree of degradation of the biogenic particles in the shallow sea, which might strongly influence the estimated POC-flux results. More attention should be paid to select the suitable export interface and tracer in shallow coastal seas.
Acknowledgements
We acknowledge the support by the crew of the R/V Runjiang II and the scientific party of the “Changjiang River Estuary Scientific Investigation and Experimental Research (CRESIER)” project for sharing the general water chemistry and hydrography parameters. We appreciate two anonymous reviewers for their comments.
A1.
The hydrography and general water chemistry parameters of the stations sampled in this study
Site-depth
T/°C
S
DO concentration/ (mg·L−1)
Chl a concentration/ (μg·L−1)
${\rm{NO}}_2^{-} $ concentration/ (μmol·L−1)
${\rm{NH}}_4^{+} $ concentration/ (μmol·L−1)
${\rm{PO}}_4^{3-} $ concentration/ (μmol·L−1)
${\rm{NO}}_3^{-} $ concentration/ (μmol·L−1)
${\rm{SiO}}_3^{2-} $ concentration/ (μmol·L−1)
A1-5-0 m
27.7
21.38
8.61
15.92
0.47
3.02
0.43
6.53
31.16
A1-5-6 m
26.7
26.96
NA
NA
NA
NA
NA
NA
NA
A1-5-15 m
23
30.70
4.17
4.54
0.54
3.33
0.34
16.26
24.51
A1-5-30 m
21.8
30.71
2.64
5.35
0.53
3.49
0.49
18.19
23.81
A1-9-0 m
28.8
21.05
8.57
8.07
0.67
2.51
0.11
8.54
10.41
A3-9-6 m
27.6
22.10
NA
NA
NA
NA
NA
NA
NA
A3-9-15 m
23.8
33.09
2.71
3.20
0.25
3.40
0.56
11.55
13.14
A3-9-30 m
23.4
33.04
NA
NA
NA
NA
NA
NA
NA
A3-9-45 m
23.3
33.07
2.39
1.62
0.24
3.32
0.62
12.01
13.68
A6-11-0 m
29.7
26.67
4.75
0.60
0.46
3.83
0.07
14.12
5.86
A6-11-6 m
29
27.63
NA
NA
NA
NA
NA
NA
NA
A6-11-15 m
27.8
32.96
4.15
0.78
0.21
3.81
0.12
4.04
3.86
A6-11-30 m
23.9
34.03
NA
NA
NA
NA
NA
NA
NA
A6-11-45 m
24
34.01
3.32
0.54
0.20
3.78
0.54
7.03
8.81
A8-7-0 m
29.7
27.58
6.45
0.53
0.32
3.70
0.06
10.76
1.82
A8-7-6 m
29.3
27.72
NA
NA
NA
NA
NA
NA
NA
A8-7-15 m
29.1
32.43
NA
NA
NA
NA
NA
NA
NA
A8-7-30 m
26.9
33.92
4.23
0.54
0.16
4.45
0.12
0.49
2.66
A8-7-50 m
28.4
34.30
3.07
0.24
0.23
3.78
0.71
8.03
10.55
A8-7-70 m
23.3
33.94
NA
NA
NA
NA
NA
NA
NA
Note: NA denotes not available; T, temperature; S, salinity.
Anderson D M, Cembella A D, Hallegraeff G M. 2012. Progress in understanding harmful algal blooms: paradigm shifts and new technologies for research, monitoring, and management. Annual Review of Marine Science, 4: 143–176. doi: 10.1146/annurev-marine-120308-081121
[2]
Bacon M P, Belastock R A, Tecotzky M, et al. 1988. Lead-210 and polonium-210 in ocean water profiles of the continental shelf and slope south of New England. Continental Shelf Research, 8(5–7): 841–853. doi: 10.1016/0278-4343(88)90079-9
[3]
Bacon M P, Spencer D W, Brewer P G. 1976. 210Pb/226Ra and 210Po/210Pb disequilibria in seawater and suspended particulate matter. Earth and Planetary Science Letters, 32(2): 277–296. doi: 10.1016/0012-821X(76)90068-6
[4]
Baskaran M, Church T, Hong G, et al. 2013. Effects of flow rates and composition of the filter, and decay/ingrowth correction factors involved with the determination of in situ particulate 210Po and 210Pb in seawater. Limnology and Oceanography: Methods, 11(3): 126–138. doi: 10.4319/lom.2013.11.126
[5]
Baskaran M, Santschi P H. 1993. The role of particles and colloids in the transport of radionuclides in coastal environments of Texas. Marine Chemistry, 43(1–4): 95–114. doi: 10.1016/0304-4203(93)90218-D
[6]
Baskaran M, Santschi P H, Benoit G, et al. 1992. Scavenging of thorium isotopes by colloids in seawater of the Gulf of Mexico. Geochimica et Cosmochimica Acta, 56(9): 3375–3388. doi: 10.1016/0016-7037(92)90385-V
[7]
Benitez-Nelson C R, Buesseler K O, van der Loeff M R, et al. 2001. Testing a new small-volume technique for determining 234Th in seawater. Journal of Radioanalytical and Nuclear Chemistry, 248(3): 795–799. doi: 10.1023/A:1010621618652
[8]
Benoit G, Hemond H F. 1990. Polonium-210 and lead-210 remobilization from lake sediments in relation to iron and manganese cycling. Environmental Science & Technology, 24(8): 1224–1234
[9]
Bi Qianqian. 2013. The disequilibrium of 234Th/238U and 210Po/210Pb in the Changjiang Estuary and adjacent sea: a case of tracing the export of particulate organic carbon (in Chinese)[dissertation]. Shanghai: East China Normal University
[10]
Buesseler K O, Bacon M P, Cochran J K, et al. 1992. Carbon and nitrogen export during the JGOFS North Atlantic Bloom experiment estimated from 234Th: 238U disequilibria. Deep-Sea Research Part A: Oceanographic Research Papers, 39(7−8): 1115–1137
[11]
Buesseler K O, Benitez-Nelson C R, Moran S B, et al. 2006. An assessment of particulate organic carbon to thorium-234 ratios in the ocean and their impact on the application of 234Th as a POC flux proxy. Marine Chemistry, 100(3–4): 213–233. doi: 10.1016/j.marchem.2005.10.013
[12]
Cai Pinghe, Chen Weifang, Dai Minhan, et al. 2008. A high-resolution study of particle export in the southern South China Sea based on 234Th: 238U disequilibrium. Journal of Geophysical Research: Oceans, 113(C4): C04019. doi: 10.1029/2007JC004268
[13]
Cai Pinghe, Dai Minhan, Lv Dongwei, et al. 2006. An improvement in the small-volume technique for determining thorium-234 in seawater. Marine Chemistry, 100(3–4): 282–288. doi: 10.1016/j.marchem.2005.10.016
[14]
Carvalho F P. 1997. Distribution, cycling and mean residence time of 226Ra, 210Pb and 210Po in the Tagus Estuary. Science of the Total Environment, 196(2): 151–161. doi: 10.1016/S0048-9697(96)05416-2
[15]
Carvalho F P, Oliveira J M, Alberto G. 2011. Factors affecting 210Po and 210Pb activity concentrations in mussels and implications for environmental bio-monitoring programmes. Journal of Environmental Radioactivity, 102(2): 128–137. doi: 10.1016/j.jenvrad.2010.11.003
[16]
Ceballos-Romero E, Le Moigne F A C, Henson S, et al. 2016. Influence of bloom dynamics on particle export efficiency in the North Atlantic: a comparative study of radioanalytical techniques and sediment traps. Marine Chemistry, 186: 198–210
[17]
Chen Jinfang, Luo Shangde, Huang Yipu. 2016. Scavenging and fractionation of particle-reactive radioisotopes 7Be, 210Pb and 210Po in the atmosphere. Geochimica et Cosmochimica Acta, 188: 208–223. doi: 10.1016/j.gca.2016.05.039
[18]
Dickson B L, Herczeg A L. 1992. Naturally-occurring radionuclides in acid-saline groundwaters around Lake Tyrrell, Victoria, Australia. Chemical Geology, 96(1−2): 95–114. doi: 10.1016/0009-2541(92)90123-M
[19]
Du Juan, Du Jinzhou, Baskaran M, et al. 2015. Temporal variations of atmospheric depositional fluxes of 7Be and 210Pb over 8 years (2006–2013) at Shanghai, China, and synthesis of global fallout data. Journal of Geophysical Research: Atmospheres, 120(9): 4323–4339. doi: 10.1002/2014JD022807
[20]
Field C B, Behrenfeld M J, Randerson J T, et al. 1998. Primary production of the biosphere: integrating terrestrial and oceanic components. Science, 281(5374): 237–240. doi: 10.1126/science.281.5374.237
[21]
Fisher N S, Burns K A, Cherry R D, et al. 1983. Accumulation and cellular distribution of 241Am, 210Po and 210Pb in two marine algae. Marine Ecology-Progress Series, 11: 233–237. doi: 10.3354/meps011233
[22]
Friedrich J, van der Loeff M M R. 2002. A two-tracer (210Po-234Th) approach to distinguish organic carbon and biogenic silica export flux in the Antarctic Circumpolar Current. Deep-Sea Research Part I: Oceanographic Research Papers, 49(1): 101–120. doi: 10.1016/S0967-0637(01)00045-0
[23]
Gao Lei, Li Daoji, Ishizaka J. 2014. Stable isotope ratios of carbon and nitrogen in suspended organic matter: seasonal and spatial dynamics along the Changjiang (Yangtze River) transport pathway. Journal of Geophysical Research: Biogeosciences, 119(8): 1717–1737. doi: 10.1002/2013JG002487
[24]
Gao Lei, Li Daoji, Ishizaka J, et al. 2015. Nutrient dynamics across the river-sea interface in the Changjiang (Yangtze River) Estuary-East China Sea region. Limnology and Oceanography, 60(6): 2207–2221. doi: 10.1002/lno.10196
[25]
Garcia-Orellana J, Rodellas V, Casacuberta N, et al. 2013. Submarine groundwater discharge: natural radioactivity accumulation in a wetland ecosystem. Marine Chemistry, 156: 61–72. doi: 10.1016/j.marchem.2013.02.004
[26]
Guo Laodong, Santschi P H, Baskaran M. 1997. Interactions of thorium isotopes with colloidal organic matter in oceanic environments. Colloids and Surfaces A: Physicochemical and Engineering Aspects, 120(1−3): 255–271
[27]
Guo Xiaoyi, Xu Bochao, Burnett W C, et al. 2020. Does submarine groundwater discharge contribute to summer hypoxia in the Changjiang (Yangtze) River Estuary?. Science of the Total Environment, 719, 137450
[28]
Harada K, Burnett W C, LaRock P A, et al. 1989. Polonium in Florida groundwater and its possible relationship to the sulfur cycle and bacteria. Geochimica et Cosmochimica Acta, 53(1): 143–150. doi: 10.1016/0016-7037(89)90281-0
[29]
Honeyman B D, Santschi P H. 1989. A Brownian-pumping model for oceanic trace metal scavenging: evidence from Th isotopes. Journal of Marine Research, 47(4): 951–992. doi: 10.1357/002224089785076091
[30]
Hong G H, Park S K, Baskaran M, et al. 1999. Lead-210 and polonium-210 in the winter well-mixed turbid waters in the mouth of the Yellow Sea. Continental Shelf Research, 19(8): 1049–1064. doi: 10.1016/S0278-4343(99)00011-4
[31]
Huang Dekun, Du Jinzhou, Moore W S, et al. 2013. Particle dynamics of the Changjiang Estuary and adjacent coastal region determined by natural particle-reactive radionuclides (7Be, 210Pb, and 234Th). Journal of Geophysical Research: Oceans, 118(4): 1736–1748. doi: 10.1002/jgrc.20148
[32]
Jiang Zhibing, Chen Jianfang, Zhou Feng, et al. 2017. Summer distribution patterns of Trichodesmium spp. in the Changjiang (Yangtze River) Estuary and adjacent East China Sea shelf. Oceanologia, 59(3): 248–261. doi: 10.1016/j.oceano.2017.02.001
[33]
Jones P, Maiti K, McManus J. 2015. Lead-210 and Polonium-210 disequilibria in the northern Gulf of Mexico hypoxic zone. Marine Chemistry, 169: 1–15. doi: 10.1016/j.marchem.2014.12.007
[34]
Jweda J, Baskaran M, van Hees E, et al. 2008. Short-lived radionuclides (7Be and 210Pb) as tracers of particle dynamics in a river system in southeast Michigan. Limnology and Oceanography, 53(5): 1934–1944. doi: 10.4319/lo.2008.53.5.1934
[35]
Kim T H, Kim G. 2012. Important role of colloids in the cycling of 210Po and 210Pb in the ocean: results from the East/Japan Sea. Geochimica et Cosmochimica Acta, 95: 134–142. doi: 10.1016/j.gca.2012.07.029
[36]
Kim G, Kim S J, Harada K, et al. 2005. Enrichment of excess 210Po in anoxic ponds. Environmental Science & Technology, 39(13): 4894–4899
[37]
Kim Y, Yang H S. 2004. Scavenging of 234Th and 210Po in surface water of Jinhae Bay, Korea during a red tide. Geochemical Journal, 38(6): 505–513. doi: 10.2343/geochemj.38.505
[38]
Kipp L E, Charette M A, Moore W S, et al. 2018. Increased fluxes of shelf-derived materials to the central Arctic Ocean. Science Advance, 4(1): eaao1302. doi: 10.1126/sciadv.aao1302
[39]
Lepore K, Moran S B, Smith J N. 2009. 210Pb as a tracer of shelf-basin transport and sediment focusing in the Chukchi Sea. Deep-Sea Research Part II: Topical Studies in Oceanography, 56(17): 1305–1315. doi: 10.1016/j.dsr2.2008.10.021
[40]
Liu Sumei, Qi Xiaohong, Li Xiaona, et al. 2016. Nutrient dynamics from the Changjiang (Yangtze River) Estuary to the East China Sea. Journal of Marine Systems, 154: 15–27. doi: 10.1016/j.jmarsys.2015.05.010
[41]
Marsan D, Rigaud S, Church T. 2014. Natural radionuclides 210Po and 210Pb in the Delaware and Chesapeake Estuaries: modeling scavenging rates and residence times. Journal of Environmental Radioactivity, 138: 447–455. doi: 10.1016/j.jenvrad.2014.08.014
[42]
Masqué P, Sanchez-Cabeza J A, Bruach J M, et al. 2002. Balance and residence times of 210Pb and 210Po in surface waters of the northwestern Mediterranean Sea. Continental Shelf Research, 22(15): 2127–2146. doi: 10.1016/S0278-4343(02)00074-2
[43]
Morel F M M, Price N M. 2003. The biogeochemical cycles of trace metals in the oceans. Science, 300(5621): 944–947. doi: 10.1126/science.1083545
[44]
Mudbidre R, Baskaran M, Schweitzer L. 2014. Investigations of the partitioning and residence times of Po-210 and Pb-210 in a riverine system in Southeast Michigan, USA. Journal of Environmental Radioactivity, 138: 375–383. doi: 10.1016/j.jenvrad.2014.01.007
[45]
Murray J W, Paul B, Dunne J P, et al. 2005. 234Th, 210Pb, 210Po and stable Pb in the central equatorial Pacific: tracers for particle cycling. Deep-Sea Research Part I: Oceanographic Research Papers, 52(11): 2109–2139. doi: 10.1016/j.dsr.2005.06.016
[46]
Nozaki Y, Tsubota H, Kasemsupaya V, et al. 1991. Residence times of surface water and particle-reactive 210Pb and 210Po in the East China and Yellow seas. Geochimica et Cosmochimica Acta, 55(5): 1265–1272. doi: 10.1016/0016-7037(91)90305-O
[47]
Owens S A, Buesseler K O, Sims K W W. 2011. Re-evaluating the 238U-salinity relationship in seawater: Implications for the 238U-234Th disequilibrium method. Marine Chemistry, 127(1–4): 31–39. doi: 10.1016/j.marchem.2011.07.005
[48]
Pike S M, Buesseler K O, Andrews J, et al. 2005. Quantification of 234Th recovery in small volume sea water samples by inductively coupled plasma-mass spectrometry. Journal of Radioanalytical and Nuclear Chemistry, 263(2): 355–360. doi: 10.1007/s10967-005-0594-z
[49]
Puigcorbé V, Benitez-Nelson C R, Masqué P, et al. 2015. Small phytoplankton drive high summertime carbon and nutrient export in the Gulf of California and Eastern Tropical North Pacific. Global Biogeochemical Cycles, 29(8): 1309–1332. doi: 10.1002/2015GB005134
[50]
Qi Lin, Tsai S F, Chen Yanlong, et al. 2019. In search of red Noctiluca scintillans blooms in the East China Sea. Geophysical Research Letters, 46(11): 5997–6004. doi: 10.1029/2019GL082667
[51]
Rigaud S, Puigcorbé V, Cámara-Mor P, et al. 2013. A methods assessment and recommendations for improving calculations and reducing uncertainties in the determination of 210Po and 210Pb activities in seawater. Limnology and Oceanography: Methods, 11(10): 561–571. doi: 10.4319/lom.2013.11.561
[52]
Roca-Martí M, Puigcorbé V, van der Loeff M M R, et al. 2016. Carbon export fluxes and export efficiency in the central Arctic during the record sea-ice minimum in 2012: a joint 234Th/238U and 210Po/210Pb study. Journal of Geophysical Research: Oceans, 121(7): 5030–5049. doi: 10.1002/2016JC011816
[53]
Ruberu S R, Liu Yungang, Perera S K. 2007. Occurrence and distribution of 210Pb and 210Po in selected California groundwater wells. Health Physics, 92(5): 432–441. doi: 10.1097/01.HP.0000254883.26386.9b
[54]
Santschi P H, Guo L, Walsh I D, et al. 1999. Boundary exchange and scavenging of radionuclides in continental margin waters of the Middle Atlantic Bight: implications for organic carbon fluxes. Continental Shelf Research, 19(5): 609–636. doi: 10.1016/S0278-4343(98)00103-4
[55]
Santschi P H, Li Yuanhui, Bell J. 1979. Natural radionuclides in the water of Narragansett Bay. Earth and Planetary Science Letters, 45(1): 201–213. doi: 10.1016/0012-821X(79)90121-3
[56]
Shimmield G B, Ritchie G D, Fileman T W. 1995. The impact of marginal ice zone processes on the distribution of 21OPo, 21OPb and 234Th and implications for new production in the Bellingshausen Sea, Antarctica. Deep-Sea Research Part II: Topical Studies in Oceanography, 42(4−5): 1313–1335. doi: 10.1016/0967-0645(95)00071-W
[57]
Stewart G, Cochran J K, Miquel J C, et al. 2007. Comparing POC export from 234Th/238U and 210Po/210Pb disequilibria with estimates from sediment traps in the northwest Mediterranean. Deep-Sea Research Part I: Oceanographic Research Papers, 54(9): 1549–1570. doi: 10.1016/j.dsr.2007.06.005
[58]
Stewart G M, Fisher N S. 2003. Experimental studies on the accumulation of polonium-210 by marine phytoplankton. Limnology and Oceanography, 48(3): 1193–1201. doi: 10.4319/lo.2003.48.3.1193
[59]
Stewart G M, Fowler S W, Teyssié J L, et al. 2005. Contrasting transfer of polonium-210 and lead-210 across three trophic levels in marine plankton. Marine Ecology Progress Series, 290: 27–33. doi: 10.3354/meps290027
[60]
Stewart G, Moran S B, Lomas M W, et al. 2011. Direct comparison of 210Po, 234Th and POC particle-size distributions and export fluxes at the Bermuda Atlantic Time-series Study (BATS) site. Journal of Environmental Radioactivity, 102(5): 479–489. doi: 10.1016/j.jenvrad.2010.09.011
[61]
Su Jilan. 2001. A review of circulation dynamics of the coastal oceans near China. Haiyang Xuebao (in Chinese), 23(4): 1–16
[62]
Su Kaijun, Du Jinzhou, Baskaran M, et al. 2017. 210Po and 210Pb disequilibrium at the PN section in the East China Sea. Journal of Environmental Radioactivity, 174: 54–65. doi: 10.1016/j.jenvrad.2016.07.031
[63]
Subha Anand S, Rengarajan R, Shenoy D, et al. 2018. POC export fluxes in the Arabian Sea and the Bay of Bengal: A simultaneous 234Th/238U and 210Po/210Pb study. Marine Chemistry, 198: 70–87
[64]
Tang Yi, Lemaitre N, Castrillejo M, et al. 2019. The export flux of particulate organic carbon derived from 210Po/210Pb disequilibria along the North Atlantic GEOTRACES GA01 transect: GEOVIDE cruise. Biogeosciences, 16(2): 309–327. doi: 10.5194/bg-16-309-2019
[65]
Tang Yi, Stewart G, Lam P J, et al. 2017. The influence of particle concentration and composition on the fractionation of 210Po and 210Pb along the North Atlantic GEOTRACES transect GA03. Deep-Sea Research Part I: Oceanographic Research Papers, 128: 42–54. doi: 10.1016/j.dsr.2017.09.001
[66]
Twining B S, Rauschenberg S, Morton P L, et al. 2015. Metal contents of phytoplankton and labile particulate material in the North Atlantic Ocean. Progress in Oceanography, 137: 261–283. doi: 10.1016/j.pocean.2015.07.001
[67]
Uddin S, Behbehani M, Al-Ghadban A N, et al. 2018. 210Po concentration in selected diatoms and dinoflagellates in the northern Arabian Gulf. Marine Pollution Bulletin, 129(1): 343–346. doi: 10.1016/j.marpolbul.2018.02.051
[68]
Verdeny E, Masqué P, Garcia-Orellana J, et al. 2009. POC export from ocean surface waters by means of 234Th/238U and 210Po/210Pb disequilibria: a review of the use of two radiotracer pairs. Deep-Sea Research Part II: Topical Studies in Oceanography, 56(18): 1502–1518. doi: 10.1016/j.dsr2.2008.12.018
[69]
Wang Kui, Chen Jianfang, Jin Haiyan, et al. 2018a. Organic matter degradation in surface sediments of the Changjiang Estuary: evidence from amino acids. Science of the Total Environment, 637–638: 1004–1013
[70]
Wang Jinlong, Du Jinzhou, Baskaran M, et al. 2016. Mobile mud dynamics in the East China Sea elucidated using 210Pb, 137Cs, 7Be, and 234Th as tracers. Journal of Geophysical Research: Oceans, 121(1): 224–239. doi: 10.1002/2015JC011300
[71]
Wang Jinlong, Zhang Weiguo, Baskaran M, et al. 2018b. Fingerprinting sediment transport in river-dominated margins using combined mineral magnetic and radionuclide methods. Journal of Geophysical Research: Oceans, 123(8): 5360–5374. doi: 10.1029/2018JC014174
[72]
Wei Ching-Ling, Chou Lin-Hua, Tsai Jing-Rui, et al. 2009. Comparative geochemistry of 234Th, 210Pb, and 210Po: a case study in the Hung-Tsai Trough off southwestern Taiwan. Terrestrial Atmospheric and Oceanic Sciences, 20(2): 411–423. doi: 10.3319/TAO.2008.01.09.01(Oc
[73]
Wei Ching-Ling, Lin Shiao-Yu, Wen Liang-Saw, et al. 2012. Geochemical behavior of 210Pb and 210Po in the nearshore waters off western Taiwan. Marine Pollution Bulletin, 64(2): 214–220. doi: 10.1016/j.marpolbul.2011.11.031
[74]
Wei Ching-Ling, Murray J W. 1994. The behavior of scavenged isotopes in marine anoxic environments: 210Pb and 210Po in the water column of the Black Sea. Geochimica et Cosmochimica Acta, 58(7): 1795–1811. doi: 10.1016/0016-7037(94)90537-1
[75]
Wildgust M A, McDonald P, White K N. 1998. Temporal changes of 210Po in temperate coastal waters. Science of the Total Environment, 214(1−3): 1–10. doi: 10.1016/S0048-9697(98)00050-3
[76]
Wu Y, Zhang J, Li D J, et al. 2003. Isotope variability of particulate organic matter at the PN section in the East China Sea. Biogeochemistry, 65(1): 31–49. doi: 10.1023/A:1026044324643
[77]
Zhang Shuwen, Liu Hongbin, Glibert P M, et al. 2017. Effects of prey of different nutrient quality on elemental nutrient budgets in Noctiluca scintillans. Scientific Reports, 7(1): 7622. doi: 10.1038/s41598-017-05991-w
[78]
Zhang Jing, Wu Yanbo, Jennerjahn T C, et al. 2007. Distribution of organic matter in the Changjiang (Yangtze River) Estuary and their stable carbon and nitrogen isotopic ratios: implications for source discrimination and sedimentary dynamics. Marine Chemistry, 106(1–2): 111–126. doi: 10.1016/j.marchem.2007.02.003
[79]
Zhong Qiangqiang, Wang Jinlong, Du Jinzhou, et al. 2019. The 210Po/210Pb disequilibrium in a spring-blooming marginal sea, the southern Yellow Sea. Journal of Environmental Radioactivity, 207: 15–26. doi: 10.1016/j.jenvrad.2019.05.017
[80]
Zhou Mingjiang, Yu Rencheng. 2007. Mechanisms and impacts of harmful algal blooms and the countmeasures. Chinese Journal of Nature, 29(2): 72–77
[81]
Zhou Zhengxi, Yu Rencheng, Zhou Mingjiang. 2017. Seasonal succession of microalgal blooms from diatoms to dinoflagellates in the East China Sea: a numerical simulation study. Ecological Modelling, 360: 150–162. doi: 10.1016/j.ecolmodel.2017.06.027
[82]
Zhu Wenzhuo, Zhang Jing, Yang Guipeng. 2018. Mixing behavior and photobleaching of chromophoric dissolved organic matter in the Changjiang River Estuary and the adjacent East China Sea. Estuarine, Coastal and Shelf Science, 207: 422–434
[83]
Zuo Zhizheng, Eisma D. 1993. 210Pb and 210Po distributions and disequilibrium in the coastal and shelf waters of the southern North Sea. Continental Shelf Research, 13(8−9): 999–1022. doi: 10.1016/0278-4343(93)90020-X
Qiangqiang Zhong, Dekun Huang, Qiugui Wang, et al. Terrestrial and marine POC export fluxes estimated by 234Th–238U disequilibrium and δ13C measurements in the East China Sea shelf. Biogeochemistry, 2024, 167(6): 807. doi:10.1007/s10533-024-01136-0
2.
Hajime Kawakami. Time-series observation of 210Pb sinking fluxes in the western North Pacific. Journal of Radioanalytical and Nuclear Chemistry, 2024. doi:10.1007/s10967-024-09801-2
3.
Zhaoxi Liu, Mingchen Ge, Qianqian Wang, et al. Spatial distribution and export of nutrients and metal elements in the subterranean estuary of Daya Bay. Acta Oceanologica Sinica, 2023, 42(8): 77. doi:10.1007/s13131-023-2212-8
Qiangqiang Zhong, Linwei Li, Viena Puigcorbé, Dekun Huang, Tao Yu, Jinzhou Du. Contrasting behaviors of 210Po, 210Pb and 234Th in the East China Sea during a severe red tide: Enhanced scavenging and promoted fractionation[J]. Acta Oceanologica Sinica, 2022, 41(8): 5-21. doi: 10.1007/s13131-021-1958-0
Qiangqiang Zhong, Linwei Li, Viena Puigcorbé, Dekun Huang, Tao Yu, Jinzhou Du. Contrasting behaviors of 210Po, 210Pb and 234Th in the East China Sea during a severe red tide: Enhanced scavenging and promoted fractionation[J]. Acta Oceanologica Sinica, 2022, 41(8): 5-21. doi: 10.1007/s13131-021-1958-0
Table
1.
Vertical profiles of dissolved and particulate 210Po, 210Pb and 234Th activities, activity ratios of dissolved fraction vs. total suspended matter (TSM), particulate organic carbon (POC) and particulate nitrogen (PN) contents, and δ13C
Station
Depth/ m
DPo/ (Bq·m−3)
PPo/ (Bq·m−3)
(DPo/TPo)/ %
DPb/ (Bq·m−3)
PPb/ (Bq·m−3)
(DPb/TPb)/ %
DTh/ (Bq·m−3)
PTh/ (Bq·m−3)
(DTh/TTh)/ %
TSM/ (mg·L−1)
POC/ (μmol·L−1)
PN/ (μmol·L−1)
${\text{δ} }$13C/ ‰
A1-5
1
0.57 ± 0.20
1.13 ± 0.08
34
11.9 ± 1.35
1.67 ± 0.15
88
17.7 ± 0.83
4.17 ± 0.17
81
10.3
140.8
21.7
−21.8
6
0.75 ± 0.17
0.90 ± 0.05
46
11.5 ± 1.12
1.30 ± 0.12
90
8.00 ± 0.33
2.17 ± 0.17
78
7.3
101.8
15.0
−21.5
15
0.77 ± 0.08
1.32 ± 0.08
37
4.57 ± 0.35
2.98 ± 0.27
61
8.67 ± 0.50
1.00 ± 0.17
88
4.8
40.2
8.9
−21.4
30
0.88 ± 0.25
2.57 ± 0.17
26
16.7 ± 1.83
3.40 ± 0.30
83
9.33 ± 0.50
3.83 ± 0.33
70
9.2
37.9
15.7
−18.9
A3-9
1
0.55 ± 0.10
0.75 ± 0.05
43
7.10 ± 0.67
1.85 ± 0.15
79
11.7 ± 0.67
1.17 ± 0.17
90
5.2
97.8
15.6
−19.2
6
1.02 ± 0.17
0.73 ± 0.05
59
8.07 ± 0.82
1.73 ± 0.15
82
12.3 ± 0.67
2.50 ± 0.17
83
2.5
91.6
15.0
−20.4
15
0.62 ± 0.15
0.90 ± 0.08
41
12.6 ± 1.22
2.47 ± 0.30
84
8.67 ± 0.50
3.67 ± 0.33
70
1.4
34.1
7.3
−22.0
30
0.72 ± 0.05
1.05 ± 0.07
41
3.48 ± 0.25
2.08 ± 0.20
63
8.83 ± 0.50
2.17 ± 0.17
80
7.6
33.2
5.0
−22.4
45
0.90 ± 0.13
1.55 ± 0.08
37
8.02 ± 0.73
2.40 ± 0.23
77
10.3 ± 0.50
9.17 ± 0.50
53
4.4
25.5
6.3
−21.3
A6-11
1
0.77 ± 0.05
0.43 ± 0.03
64
4.08 ± 0.37
0.48 ± 0.07
89
8.33 ± 0.33
9.33 ± 0.50
47
2.4
17.4
4.1
−24.1
6
0.73 ± 0.05
0.27 ± 0.02
74
4.12 ± 0.32
0.52 ± 0.05
89
15.2 ± 0.67
3.83 ± 0.17
80
2.9
11.3
5.7
−23.6
15
0.55 ± 0.05
0.32 ± 0.02
64
5.55 ± 0.43
0.72 ± 0.07
89
10.5 ± 0.50
5.67 ± 0.33
65
0.5
10.8
3.1
−18.6
30
0.55 ± 0.08
0.63 ± 0.03
47
13.1 ± 1.45
0.65 ± 0.08
95
6.67 ± 0.33
3.50 ± 0.17
65
0.3
11.5
4.1
−17.6
45
0.88 ± 0.05
0.90 ± 0.05
50
2.27 ± 0.17
1.23 ± 0.15
65
10.3 ± 0.50
8.67 ± 0.50
54
3.1
10.5
5.7
−20.6
A8-7
1
0.82 ± 0.07
0.20 ± 0.02
80
1.92 ± 0.17
0.40 ± 0.05
83
7.00 ± 0.33
1.83 ± 0.17
80
1.3
15.0
3.7
−23.3
6
0.93 ± 0.08
0.30 ± 0.02
76
3.18 ± 0.27
0.42 ± 0.05
89
7.33 ± 0.33
2.67 ± 0.17
74
1.4
NA
NA
−20.1
15
1.00 ± 0.15
0.30 ± 0.02
77
4.90 ± 0.47
0.50 ± 0.05
91
6.50 ± 0.17
3.50 ± 0.17
65
1.7
13.7
3.7
−23.7
30
1.33 ± 0.15
0.43 ± 0.03
76
4.83 ± 0.48
0.58 ± 0.07
89
11.2 ± 0.50
7.50 ± 0.33
60
0.9
7.9
1.9
−21.2
45
0.72 ± 0.08
0.37 ± 0.03
67
3.68 ± 0.32
0.68 ± 0.05
84
7.83 ± 0.33
5.67 ± 0.33
58
1.4
19.6
5.7
−21.6
70
1.03 ± 0.07
2.25 ± 0.10
32
2.37 ± 0.22
2.13 ± 0.25
53
12.8 ± 0.67
10.7 ± 0.50
54
11.6
11.6
4.2
−21.6
Note: T, D and P denotes total, dissolved, and particulate phases, respectively; NA denotes data not available. Errors are 1 sigma values based on counting uncertainties.
Table
2.
Comparison of activities (average±SD) of radionuclides (210Po, 210Pb and 234Th), 210Po/210Pb and 234Th/238U activity ratios between bloom and non-bloom stations
D-Po/ (Bq·m−3)
P-Po/ (Bq·m−3)
D-Pb/ (Bq·m−3)
P-Pb/ (Bq·m−3)
D-Th/ (Bq·m−3)
P-Th/ (Bq·m−3)
D-(210Po/210Pb)
P-(210Po/210Pb)
T-(210Po/210Pb)
T-(234Th/238U)
Bloom (n=9)
0.77±0.17
1.22±0.58
9.3±4.2
2.20±0.67
10.7±3.0
3.3±2.5
0.10±0.06
0.55±0.15
0.19±0.07
0.48±0.22
Non-bloom (n=11)
0.85±0.23
0.58±0.58
4.5±3.0
0.75±0.52
9.5±2.8
5.7±3.0
0.25±0.13
0.70±0.21
0.32±0.18
0.43±0.14
Note: D refers to dissolved fraction; P, particulate fraction; and T, dissolved fraction plus particulate fraction; n denotes the sample number in entire water columns.
Figure 1. Map showing the locations of the stations in the Changjiang River Estuary and East China Sea in July 2016 (a). Red stars are four stations where radionuclides were measured, with two stations (A1-5 and A3-9) affected by algal blooms (b), and two no-bloom stations (A6-11 and A8-7) (c). The regional currents during summer are included: Changjiang Dilute water (CDW), Zhejiang-Fujian Coast Current (ZFCC), Yellow Sea Coastal Current (YSCC) and Taiwan Warm Current (TWC). Black dots in red dashed boxes represent the locations where algal blooms were observed.
Figure 2. Vertical distribution plots of temperature (°C) (a) and salinity (b) along the defined section (c) of the East China Sea off the Changjiang River Estuary in July 2016.
Figure 3. Profiles of concentrations of DO and Chl a, contents of TSM and POC in four stations. Horizontal twill line denotes seafloor.
Figure 4. Relationships between POC and TSM (a), POC and PN (b), POC and Chl a (c), POC and five nutrients (${\rm{NO}}_3^{-} $ (e), ${\rm{NO}}_2^{-} $ (f), ${\rm{NH}}_4^{+} $ (g), ${\rm{PO}}_4^{3-} $ (h), ${\rm{SiO}}_3^{2-} $ (i)) and between PN and Chl a (d) during algal blooming in July 2016. The dotted lines indicate the correlation between the two parameters and the equation is presented in the corresponding panel. Red symbols indicate outliers of the general trend due to particularities of those specific samples, as described in each graphic.
Figure 5. Variations of stable organic carbon isotopic ratio (δ13C) and organic carbon and nitrogen content ratio (POC/PN content ratio) in particles collected in bloom (green) and non-bloom (blue) stations.
Figure 6. 210Po, 210Pb, and 234Th activity profiles for the dissolved (D, black squares), particulate (P, red dots), and total (dissolved+particulate; T, blue triangles) phases. Horizonal twill line indicated the bottom depth.
Figure 7. Relationships between POC content and particulate 210Po (a), 210Pb (b) and 234Th (c) activity in surface (black squares), middle (red dots), and bottom (blue triangles) waters.
Figure 8. Profiles of the POC/TSM content ratio (a) and mass specific activities of 210Po (b), 210Pb (c), and 234Th (d) at the four stations. The green highlighted regions represent the peaks of mass specific activity of 210Po, 210Pb and 234Th in water columns.
Figure 9. Relationships between the variation in the distribution coefficient (log10Kd, mL/g) for 210Po, 210Pb, and 234Th and the particle content (log10TSM) (a), and organic carbon content in TSM (b).
Figure 10. Fractionation factors of 210Po to 210Pb (a), 210Po to 234Th (b) and 210Pb to 234Th (c) at the four sampling stations.
Figure 11. The ratios of POC content to 210Po, 210Pb, and 234Th activities in the particulate samples.
Figure 12. POC/210Po vs. POC/210Pb (a) and POC/210Po vs. POC/234Th (b) (POC content/radionuclide activity) in the particulate samples. Data enclosed in black ellipse represent samples collected from surface layers at algal blooming stations. Data enclosed in blue ellipse represent fecal pellets or resuspended particulate matters. The red dashed lines indicate the 1:1 line.


 DownLoad:


 DownLoad:


 DownLoad: