National Engineering Laboratory of Marine Germplasm Resources Exploration and Utilization, Zhejiang Ocean University, Zhoushan 316022, China
2.
Marine Science and Technology College, Zhejiang Ocean University, Zhoushan 316022, China
3.
School of Fishery, Zhejiang Ocean University, Zhoushan 316022, China
Funds:
The National Natural Science Foundation of China under contract No. 41706176; the Basic Scientific Research Operating Expenses of Zhejiang Provincial Universities under contract No. 2019J00022.
Here, we sequenced the complete mitogenome of Parasesarma eumolpe (Brachyura: Grapsoidea: Sesarmidae) for the first time. The characteristics of this newly sequenced mitogenome were described and compared with other Sesarmidae species. The 15 646-bp mitogenome contains 13 protein-coding genes (PCGs), two ribosomal RNA genes (rRNAs), 22 transfer RNA genes (tRNAs), and an A-T rich region. All of the PCGs are initiated by the start codon ATN and terminated by the standard TAN codon or an incomplete T. The pairwise Ka/Ks ratio analysis shows that all 13 PCGs are under purifying selection, whereas the ATP8 gene is an outlier, with pairwise comparison values ranging from neutral selection (0.000) to positive selection (1.039). The gene arrangement of P. eumolpe compared with ancestral Decapoda shows the translocation of two tRNAs (tRNA-His and tRNA-Gln), which is identical to other Sesarmidae species. Phylogenetic analyses show that all Sesarmidae species are placed into one group, and the polyphyly of Eriphioidea, Ocypodoidea, and Grapsoidea is well supported. The relationship between gaps in the QIM region and the phylogeny of Sesarmidae is analyzed. It is obvious that both the G5 (the gap between Q and I) and G6 (the gap between I and M) decrease progressively with the evolution process. These results will help to better understand the genomic evolution within Sesarmidae and provide insights into the phylogeny of Brachyura.
The mitochondrial genome (mitogenome) is typically circular in metazoans, with a size of 14–20 kb. This genome contains 13 protein-coding genes (PCGs), 22 transfer RNA genes (tRNAs), two ribosomal RNA genes (12S and 16S) and an AT-rich region (also called control region, CR) (Boore, 1999). The mitogenome is featured by high abundance in the cell, maternal inheritance, small genome size, conserved gene content, low level of recombination, and fast rate of evolution (Gyllensten et al., 1991; Sato and Sato, 2013), thus being regarded as an ideal tool for population genetics, comparative genomics and phylogenetic studies (Ma et al., 2015; Sanchez et al., 2016; Tan et al., 2018). Besides, comparative analyses of the complete mitogenomes of closely related taxa can deepen the understanding of gene rearrangements and evolutionary relationships (Ren et al., 2020; Zhang et al., 2020c). With the advent of next-generation sequencing technologies, comparative mitogenomics has become an important method for molecular evolution and phylogenetic analysis (Wang et al., 2020b; Zhang et al., 2020b).
Generally, gene order in most vertebrate mitogenomes is considered highly conserved, e.g., about 4% rearrangement ratio in fish mitogenomes (Gong et al., 2013). However, extensive gene rearrangements have been observed in invertebrate mitogenomes, such as in bivalves (Wu et al., 2012), cephalopods (Xin et al., 2018), insects (Liu et al., 2017), and crabs (Wang et al., 2019). So far, five main mechanisms have been proposed to account for mitogenomic rearrangements, including tandem duplication/random loss (TDRL) model (Moritz et al., 1987), tRNA mis-priming model (Cantatore et al., 1987), intra-mitochondrial recombination model (Poulton et al., 1993), tandem duplication/non-random loss model (Lavrov et al., 2002), and dimer-mitogenome and non-random loss model (Luo et al., 2019). One of the most commonly accepted hypotheses is the TDRL model, which assumes that the rearranged gene order occurs via tandem duplications followed by random deletion of certain duplications (Moritz et al., 1987; Arndt and Smith, 1998). It has accounted for numerous rearrangements in a variety of animal mitogenomes (Ma et al., 2015; Sun et al., 2019; Yang et al., 2019).
The infraorder Brachyura is the largest clade Decapod Crustacea, with over 7 250 known species inhabiting marine, freshwater, and terrestrial habitats (Zhang, 2011; Basso et al., 2017; Chen et al., 2018). Owing to the extreme morphological and ecological diversity, morphological identification and phylogenetic relationships within Brachyura are complicated (Tan et al., 2018; Wang et al., 2020a, b). Up to now, a comprehensive analysis of the overall phylogeny of Brachyura is still lacking. Wherein the sesarmid crabs (Sesarmidae) play an important ecological role colonizing the mangroves of the Indo-Pacific, Pacific, and Atlantic regions (Lee, 1998; Gillikin and Schubart, 2004). According to WoRMS (http://www.marinespecies.org/), the family Sesarmidae has 49 genera and 329 species in total. Among them, the genus Parasesarma De Man, 1895 is a species-rich taxon, including 53 recognized species (http://www.marinespecies.org/aphia.php?p=taxdetails&id=204451). Parasesarma eumolpe (originally named Sesarmaeumolpe or Perisesarma eumolpe), a well-known sesarmid model species (Shahdadi et al., 2018), is often reported and described in detail. However, most studies of this model species have focused on the morphology so far (Tweedie, 1954; Shahdadi and Schubart, 2015, 2018), and researches on the molecular level are almost blank (Shahdadi et al., 2018).
To better understand this model species from the molecular perspective, we firstly sequenced and described the complete mitogenome of P. eumolpe. Combined with this newly sequenced mitogenome, a comparative analysis of 11 Sesarmidae mitogenomes were conducted to reveal the genomic evolution. Gene rearrangements in 11 sesarmid crab mitogenomes were compared and possible mechanisms of rearrangement were discussed. Additionally, the most comprehensive molecular phylogenetic analysis of 107 brachyuran species was conducted based on the nucleotide and amino acid sequences of 13 PCGs. These results will help to understand the features of Sesarmidae mitogenomes and lay a foundation for further evolutionary relationships within Brachyura.
2.
Materials and methods
2.1
Ethics statement
The crab specimen used in the present study was marine captured and purchased from Hainan Province, China (18°20′18″N, 109°30′50″E). The species was not involved in the endangered list of the International Union for Conservation of Nature (https://www.iucnredlist.org/). Specimen collection and maintenance were performed in strict accordance with the recommendations of Animal Care Quality Assurance in China. All experimental protocols were approved by the Institutional Ethics Committee of Zhejiang Ocean University.
2.2
DNA extraction, mitogenome sequencing, and assembly
The SQ Tissue DNA Kit (OMEGA, USA) was used to extract the total genomic DNA from muscle tissue of a single sample following the manufacturer’s instructions. The mitogenome of P. eumolpe was sequenced using the Illumina HisSeq 4000 platform with 150 bp paired-end reads (Shanghai Origingene Bio-pharmTechnology Co. Ltd., China). Adapters and low-quality bases were removed using Cutadapt v1.16 (Martin, 2011) with the following parameters: q, 20; m, 20. Trimmed reads shorter than 50 bp were discarded. Quality control of the raw and trimmed reads was performed using FastQC v0.11.5 (http://www.bioinformatics.babraham.ac.uk/projects/fastqc/). The filtered clean data were assembled and mapped to the complete mitogenome sequence using NOVOPlasty v2.7.2 (Dierckxsens et al., 2017).
2.3
Mitogenome annotation and sequence analyses
The complete mitogenome was manually annotated using the software of Sequin (v15.10, http://www.ncbi.nlm.nih.gov/Sequin/). The PCGs were determined by their open reading frame following the invertebrate mtDNA translation table. The boundaries of protein-coding and ribosomal RNA genes were determined using NCBI-BLAST (http://blast.ncbi.nlm.nih.gov). The transfer RNA genes were manually plotted, according to the secondary structure predicted by the MITOS Web Server (Bernt et al., 2013) and tRNAscan-SE 1.21 (Lowe and Chan, 2016). The CR was determined by the locations of adjacent genes. Tandem repeat units of the CRs were identified with Tandem Repeats Finder 4.09 (Benson, 1999). The mitogenome map was generated using CGView Server v1.0 (Stothard and Wishart, 2005). The base composition and relative synonymous codon usage were obtained using MEGA X (Kumar et al., 2018). The strand asymmetry was calculated using the following formulas: AT-skew=(A−T)/(A+T); GC-skew = (G−C)/(G+C) (Perna and Kocher, 1995). The ratios of non-synonymous substitutions (Ka) and synonymous substitutions (Ks) of the 13 PCGs were calculated using DnaSP v6.12.03 (Rozas et al., 2017).
2.4
Phylogenetic analysis
A total of 108 complete mitogenome sequences downloaded from the GenBank database (https://www.ncbi.nlm.nih.gov/genbank), and one newly determined sequence (P. eumolpe) were used to reconstruct the phylogenetic relationships of Brachyura (Table S1). Fasta files with the nucleotide and amino acids sequences for all 13 PCGs were extracted from the GenBank files using PhyloSuite (Zhang et al., 2020a). All the genes were aligned in batches with Clustal X (Larkin et al., 2007), using the default-alignment mode, and the ambiguous sequences were eliminated using Gblocks (Talavera and Castresana, 2007). Subsequently, the sequences were concatenated into a single alignment and converted into input files (Phylip and Nexus formats) for phylogenetic analyses. Phylogenetic trees were built under maximum likelihood (ML) and Bayesian inference (BI) methods. The ML analysis was conducted using IQ-TREE (Nguyen et al., 2015), under an ML+rapid bootstrap (BS) algorithm with 1000 replicates. The BI analysis was conducted in MrBayes 3.2.6 (Ronquist et al., 2012) with 3×10⁶ metropolis-coupled Markov Chain Monte Carlo generations, sampling every 1 000 generations, and the first 25% of the generations were discarded as burn-in. To guarantee the stationarity had been reached, the average standard deviation of split frequencies was set below 0.01.
3.
Results and discussion
3.1
Genome structure, organization, and nucleotide composition
The complete mitogenome of P. eumolpe (GenBank accession number MT193720) is a closed-circular molecule of 15 646 bp in length (Fig. S1), which contains 13 PCGs, two rRNAs, 22 tRNAs, as well as a putative CR (Fig. 1, Table 1). Except four PCGs (ND5, ND4, ND4L, and ND1), eight tRNAs (tRNA-His, Phe, Pro, Leu1, Val, Gln, Cys, and Tyr) and two rRNAs, which are distributed on the light (L-) strand, the rest of mitochondrial genes are distributed on the heavy (H-) strand (Table 1, Fig. S1). The genome sizes of 11 sesarmid crabs are relatively conserved, ranging from 15 611 bp (P. pictum) to 15 920 bp (Chiromantes neglectum) (Table S1). The maximum length diversification is detected in the rapidly evolving CR, which ranges from 528 bp (P. tripectinis) to 833 bp (Metopaulias depressus) and is largely responsible for the mitogenome length differences. Also, the overlapping regions and intergenic spacers are partially associated with the genome sizes (Fig. 1, Table S1).
Figure
1.
Aligned sequences of the CRs in 11 sesarmid crabs. The shaded blocks represent the conserved sequences. Abbreviations of species names are given as follows: C. neg, Chiromantes neglectum; C. deh, Chiromantes dehaani; C. hae, Chiromantes haematocheir; M. dep, Metopaulias depressus; C. sin, Clistocoeloma sinense; E. laf, Episesarma lafondii; P. eum, Parasesarma eumolpe; P. aff, Parasesarma affine; N. min, Nanosesarma minutum; P. tri, Parasesarma tripectinis; P. pic, Parasesarma pictum. The numbers in the square brackets are length of base (unit: bp).
The genes in P. eumolpe mitogenome are arranged both with interval and overlapping phenomena. There are 16 intergenic spacers with a total length of 174 bp, with the longest one (50 bp) located between tRNA-Gln and tRNA-Ile (Table 1). Simultaneously, a total of 18 bp overlapping sites are identified at six junctions. Two overlaps therein (1 bp between ATP6 and COIII, 7 bp between ND4 and ND4L) (Table 1) are also generally found in other crabs (Gong et al., 2019, 2020b; Lu et al., 2020).
The overall nucleotide composition of P. eumolpe is as follows: 36.7% A, 38.8% T, 9.8% G, and 14.7% C, respectively, with a high AT bias (75.5%) (Table S2). The skewness metrics of the mitogenome show negative AT-skew (−0.027) and negative GC-skew (−0.198) (Table S3). Also, the nucleotide composition of our newly sequenced mitogenome is compared with the other 10 Sesarmidae mitogenomes (Table S3). All the mitogenomes are rich in As and Ts, with the A+T content ranging from 74.2% (P. tripectinis) to 77.7% (Nanosesarma minutum). The base skewness is also highly congruent. The AT-skew ranges from −0.032 (P. pictum) to −0.010 (Chiromantes neglectum and Chiromantes dehaani), and the GC-skew ranges from −0.232 (Metopaulias depressus) to −0.194 (P. pictum) (Table S3). The negative AT-skew and GC-skew values among analyzed mitogenomes indicate that Ts and Cs are more abundant than As and Gs.
3.2
PCGs, transfer RNAs and ribosomal RNAs
The mitogenome of P. eumolpe contains 13 PCGs in the typical order found in brachyuran species, consisting of seven NADH dehydrogenases (ND1−ND6 and ND4L), three cytochrome c oxidases (COI−COIII), two ATPases (ATP6 and ATP8), and one cytochrome b (Cyt b). All PCGs are initiated by the start codon ATN (ATA, ATG, and ATT), with an exception (GTG) in ND1. The majority of the 13 PCGs terminate with TAA or TAG, whereas three other PCGs (COI, COII, and Cyt b) use a single T as a stop codon (Table 1). Incomplete stop codons are common in both invertebrate and vertebrate mitochondrial genes and may be recovered via post-transcriptional polyadenylation (Ojala et al., 1981).
The amino acid composition and relative synonymous codon usage of 11 sesarmid crabs are roughly identical. The most frequently used amino acids are Leu, Ser, Phe, and Ile in these mitogenomes (Fig. S2). In consistent with other brachyuran species (Lu et al., 2020; Wang et al., 2020a, b), the usage of two- and four-fold degenerate codons in these sesarmid crabs is biased toward the use of codons abundant in A or T (Fig. 1, Table S2). In addition, the codons Arg (CGC) and Cys (UGC) are absent in Episesarma lafondii and P. pictum mitogenomes, and Arg (CGC) is also absent in the other five Sesarmidae species (Chiromantes dehaani, Chiromantes haematocheir, Clistocoeloma sinense, N. minutum, and P. affine) (Fig. S2, Table S2). Both of the missing codons are preferred to end with “C” in the third codon position.
The mitogenome of P. eumolpe contains 22 tRNA genes scattered throughout the genome. The tRNAs size range from 65 bp to 73 bp with a total length of 1 480 bp. Most tRNAs display a typical cloverleaf secondary structure except for tRNA-Ser (TCT) that lacks the dihydrouridine (DHU) arm (Fig. S3), which is thought to be a common phenomenon in metazoan mitogenomes (Lü et al., 2019; Ruan et al., 2020; Wang et al., 2020a). Except for the normal base pairing and G-U, three kinds of mismatches are found in tRNAs. One C-U base pair is predicted in tRNA-Lys, one C-A base pair is predicted in tRNA-Ser (S1) and two U-U base pairs are predicted in tRNA-His and tRNA-Leu (L1). The total length of the two rRNAs in P. eumople is 2 150 bp. Of the two genes, the 16S rRNA is 1 332 bp located between tRNA-Leu (L1) and tRNA-Val, while the 12S rRNA is 818 bp and resides between tRNA-Val and CR (Fig. S1, Table 1).
3.3
Control region
The CR of P. eumople is located between 12S rRNA and tRNA-Gln, with an extremely high AT content (81.7%). The CR is the most variable region because of a faster evolution rate compared with the other genes. Nevertheless, the alignment of 11 Sesarmidae CRs reveals five conserved sequence blocks (Fig. 1). Their consensus sequences are as follows: ATATATGTATAT (CSB-A), TACGGAT-ATATA (CSB-B), GTAATTTCAATGGTTTAGA (CSB-C), TCTAA-ACCAATGAAAT-TAC (CSB-D), and ATTATATTATATTTAA-TTAAATGTATATATA--TATATAT (CSB-E) (the underlined letters represent the fluctuant nucleotide among the 11 Sesarmidae species). Additionally, several tandem repeat units are detected in the CRs in almost all sesarmid crab mitogenomes except for P. affine and P. eumolpe (Fig. 2). The motif length and copy number of tandem repeat units present dramatic differences among these analyzed Sesarmidae mitogenomes. The longest motif is 72 bp occurred in N. minutum CR, followed by 38 bp in Chiromantes haematocheir CR; the largest copy number is 4 occurred in Chiromantes haematocheir and Metopaulias depressus CR. Notably, Chiromantes neglectum and Chiromantes dehanni CR share two identical tandem repeat units almost in the same location; however, no similar tandem repeat unit is detected in other CRs. So far, there have been few studies on the conserved blocks, especially their potential functions in invertebrate mitogenomes (Ray and Densmore, 2002; Guo et al., 2003; Zhao et al., 2011). Comparative analyses of more distantly related species and several imperative functional experiments are needed to uncover the conserved sequence blocks related to its function and further to illuminate the functional importance of CR.
Figure
2.
Organization of the CRs in 11 Sesarmidae mitogenomes. Purple ellipses indicate the tandem repeat units; the remaining regions are shown in light gray boxes. The tandem repeat with copy number is displayed in the format of (motif)n.
To detect the selective pressure of 13 PCGs in sesarmid crabs, we conduct pairwise Ka/Ks analyses for each PCG. It is commonly accepted that Ka>Ks, Ka=Ks, and Ka<Ks generally indicate positive selection, neutral mutation, and purifying selection, respectively (Yang, 2006). The results show that all 13 PCGs among the 11 Sesarmidae mitogenomes are evolving under a purifying selection. COI gene exhibits the strongest purifying selection, whereas the NADH family genes (especially ND6) exhibits a slightly relaxed purifying selection; ATP8 is an outlier, with pairwise comparison values ranging from neutral selection (0.000) to positive selection (1.039) (Fig. 3). The lowest Ka/Ks ratio for COI gene indicates strong evolutionary conservation, which results in the COI gene often being used as a potential molecular marker (Hebert et al., 2003). In contrast, the ATP8 gene exhibits the highest evolutionary rate of all the PCGs, which implies that the ATP8 gene can be used to evaluate intraspecific relationships (Wang et al., 2015). Furthermore, the Ka/Ks values in Sesarmidae species reveal that the environment variation is not great enough to change their genetic function.
Figure
3.
Box-plot comparisons of the pairwise Ka/Ks (Ka, non-synonymous substitution; Ks, synonymous substitution) ratios estimated in the various mitochondrial genes. The estimates were based on pairwise alignments of samples.
So far, three main types of gene rearrangement events have been observed in the mitogenomes of animal, including translocation, shuffling, and inversion (Thyagarajan et al., 1996; Macey et al., 1997; Tsaousis et al., 2005; Zhuang and Cheng, 2010). Here, two translocations are detected in P. eumolpe mitogenome. One is the translocation of tRNA-His (H). Compared with the gene order of the ancestor of Decapoda, the tRNA-His (H) is rearranged from the downstream of ND5 (Fig. 4a) to the position between tRNA-Glu (E) and tRNA-Phe (F), forming a new gene block (E-H-F-ND5-ND4) in P. eumolpe mitogenome (Fig. 4b). The translocation of tRNA-His gene is a relatively common event in brachyuran mitogenomes (Lu et al., 2020; Wang et al., 2020a, b). The other translocation is identified in tRNA-Gln(Q) when selecting the ancestral mitochondrial gene order of Brachyura as a reference. The typical IQM arrangement (tRNA-Ile-Gln-Met) is changed to QIM order (tRNA-Gln-Ile-Met), which is identical with other published Sesarmidae mitogenomes (Wang et al., 2018, 2019) (Fig. 4c).
Figure
4.
Inferred intermediate steps between the ancestral gene arrangement of Decapoda, Brachyura and Sesarmidae mitogenomes. PCGs and control region (CR) are indicated with boxes, and tRNAs are indicated with columns. Genes labeled above the diagram are encoded on the H-strand and those below the diagram on the L-strand. a. Ancestral gene arrangement of Decapoda; b. ancestral gene arrangement of Brachyura; c. gene arrangement of 11 Sesarmidae species. The duplicated gene block is underlined, and the lost genes are marked in dark gray. G1, G2, G3, G4, G5, G6, and G7 indicate the intergenic spacer between E and H, H and F, F and ND5, ND5 and ND4, Q and I, I and M, M and ND2, respectively; the number after the species names is the amount of intergenic spacers.
How did the mitogenome structure of P. eumolpe emerge? Based on the rearrangement features and principle of parsimony, the TDRL is adopted to explain the rearrangement events in P. eumolpe mitogenome. The hypothesized intermediate steps are as follows, starting with the typical ancestral order of the Decapoda mitogenome (Fig. 4a). First, the F-ND5-H genes underwent a complete copy, forming a dimeric block (F-ND5-H)- (F′-ND5′-H'). Consecutive copies were then followed by a random loss of supernumerary genes, namely F-ND5-H-F′-ND5′-H′ (the underlined letters represent the deleted genes). Thus a new H-F-ND5 gene order was formed (Fig. 4b). In the following step, the gene order of the gene block (CR-I-Q-M) was changed to CR-Q-I-M through the same mechanism (Fig. 4c).
Considering these 11 Sesarmidae mitogenomes analyzed in this study share the same gene arrangement (Fig. 4c), which was resulted from the translocation of two tRNAs (tRNA-His and tRNA-Gln). So is there a universal mechanism to account for the rearrangement events? The TDRL model used in P. eumolpe mitogenome is generally featured by the presence of intergenic spacers as a result of incomplete deletion of the duplicated genes (Moritz et al., 1987; Arndt and Smith, 1998). Here, different levels of intergenic spacers were found in the two rearranged regions (H-F-ND5 and CR-Q-I-M) in these 11 Sesarmidae mitogenomes. The intergenic spacers in the rearranged regions are as follows: 1 bp to 9 bp between E and H (G1); 1 bp to 2 bp between H and F (G2); 1 bp to 7 bp between F and ND5 (G3); 15 bp to 50 bp between ND5 and ND4 (G4); 14 bp to 211 bp between Q and I (G5); and 6 bp to 63 bp between I and M (G6) (Fig. 4). These features in rearranged regions support that the novel gene order in Sesarmidae mitogenomes can be well explained by the TDRL model.
3.6
Phylogenetic analysis and intergenic spacers in Sesarmidae
In this study, we reconstructed the phylogenetic relationships of Brachyura based on the nucleotide and amino acid sequences of 13 PCGs using ML and BI methods (Figs 5, S4 and S5). The phylogenetic trees (ML tree and BI tree) based on the nucleotide sequences produce an identical structure. Here, only one topology (BI) with both support values is displayed (Fig. 5). However, the phylogenetic trees based on the amino acid sequences are not consistent, and both trees are slightly different from the nucleotide trees (Figs S4−S6). In both the nucleotide and amino acid trees, all Sesarmidae species cluster into a clade and consist of two sister groups. Nevertheless, the phylogenetic position of Nanosesarma within this family is not consistent. The BI tree of the nucleotide sequences shows that N. minutum forms a sister clade with four Parasesarma species, while N. minutum interfuses the Parasesarma clade in the BI tree of the nucleotide sequences and the amino acid trees. Because the genus Nanosesarma has only one representative, long-branch attraction (Philippe, 2000; Boussau et al., 2014) may lead to this topology. Future researches that include more sample volume are essential to confirm the phylogenetic placement of Nanosesarma.
Figure
5.
Phylogenetic tree of brachyuran species inferred from the nucleotide sequences of 13 PCGs based on maximum likelihood and Bayesian inference analyses. The node marked with a solid circle indicates 100 maximum likelihood bootstrap support and 100% Bayesian inference posterior probability.
Of the 29 families included in the phylogenetic trees, the monophyly of each family is strongly supported except Xanthidae and Homolidae (Figs 5, S4 and S5). However, it is worth noting that the monophyly of Gecarcinidae is presented in the amino acid trees, whereas it consists of two clades in the nucleotide trees, one of which forms a sister clade with Sesarmidae. Viewed from a higher taxonomic level, the polyphyly of three superfamilies (Eriphioidea, Ocypodoidea, and Grapsoidea) is well supported in both the nucleotide and amino acid trees (Figs 5, S4 and S5). However, within the polyphyly of Ocypodoidea and Grapsoidea, the relationships among different families are inconsistent (Fig. S6). The ML tree of the amino acid sequences places Ocypodidae at a relatively basal position, which is in accord with Tan’s result (Ma et al., 2019). Whereas the nucleotide trees and the BI tree of the amino acid sequences show that Ocypodidae forms a sister clade with Xengrapsidae, which in turn affects the positions of the other families as well. Therefore, the interrelationships among these two taxa need further analysis by integrating more molecular data. Besides, the superfamily status of Portunoidea has been constantly debated, with its constituent families varying among different authors. The latest results support a more conservative classification of Portunoidea with three instead of eight extant families: Geryonidae (Geryonidae+Ovalipidae), Carcinidae (Carcinidae+Pirimelidae+Polybiidae+Thiidae+Coelocarcinus) and Portunidae (Evans, 2018). However, the current phylogeny suggests different relationships among the three major Portunoidea groups. Here, Ovalipidae and Geryonidae cluster together as sister groups, which supports the latest classification of Portunoidea. While in previous researches, Ovalipidae is revealed to be more closely related to the Carcinidae+Polybiidae clade (Ma et al., 2019) or Portunidae (Tsang et al., 2014).
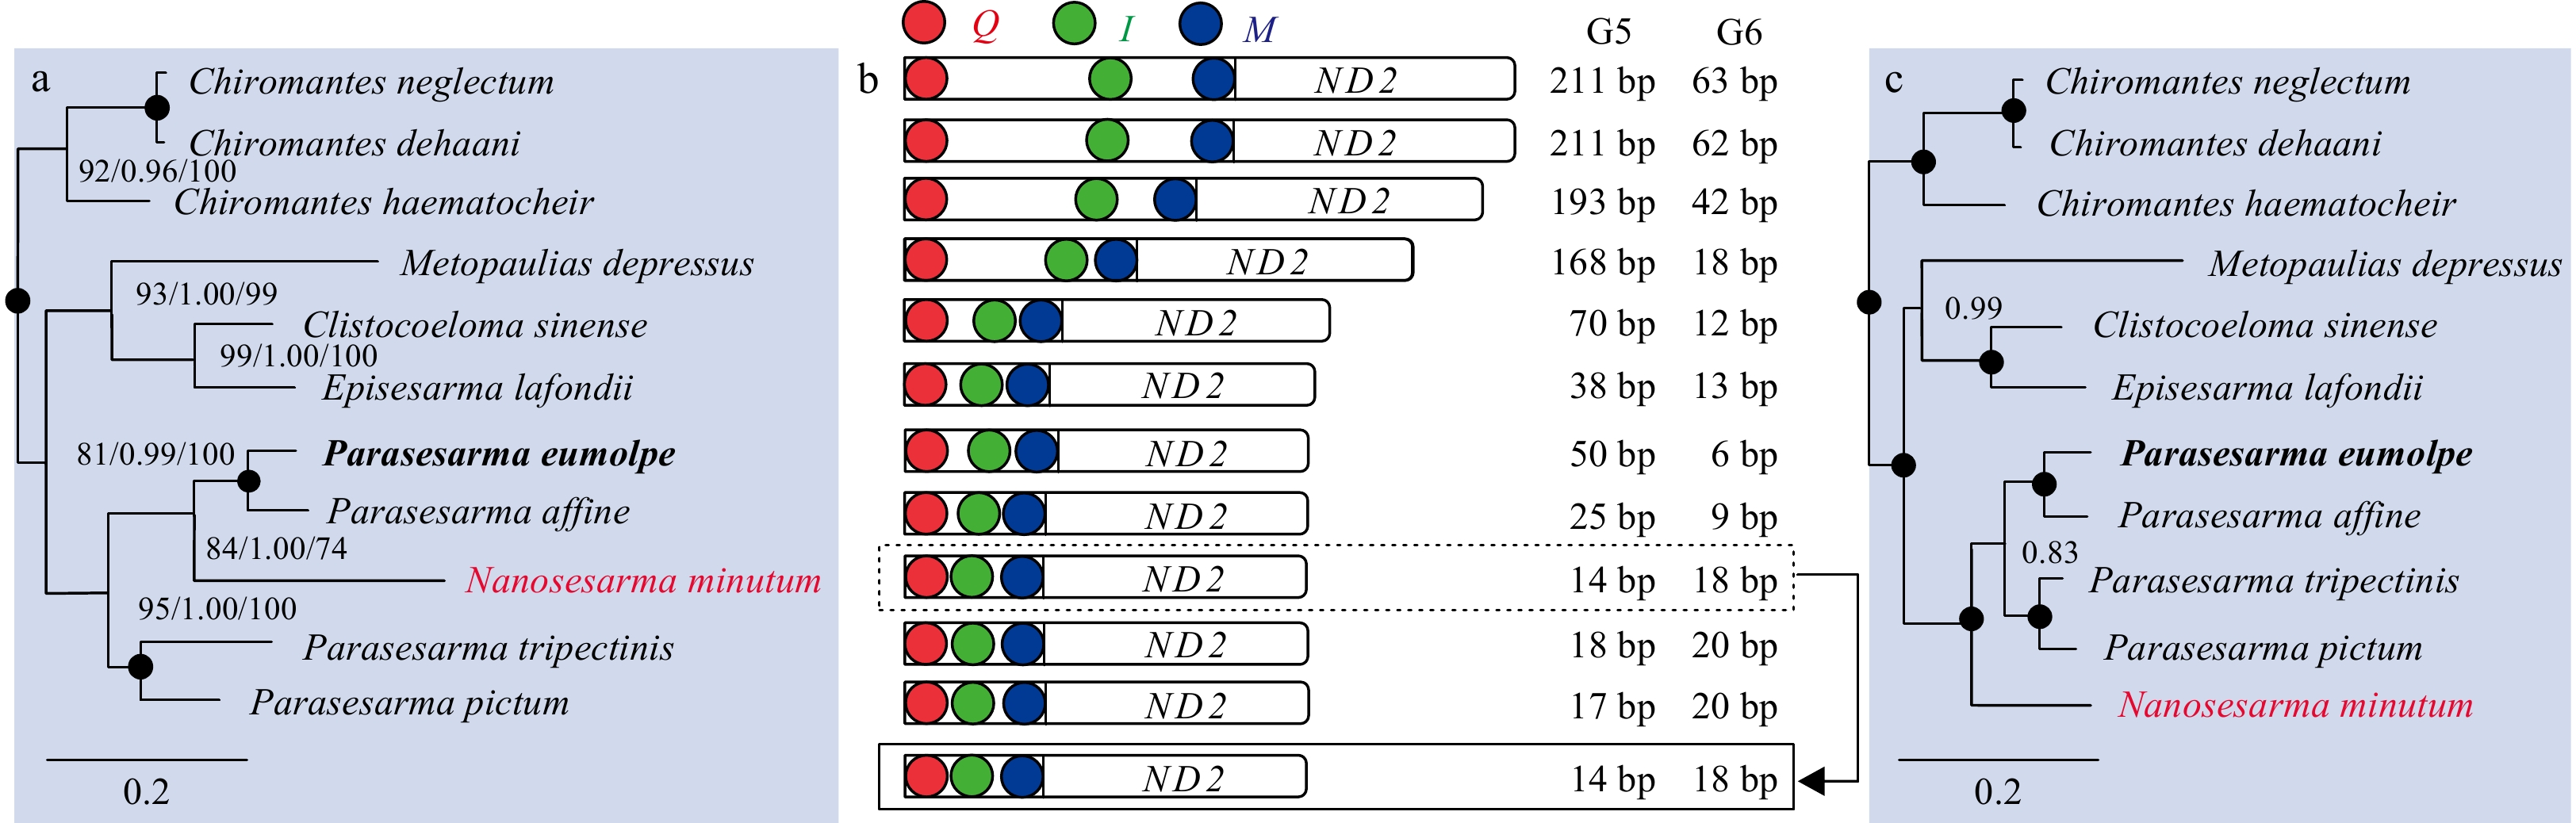
Previous findings showed that the evolution process of mitogenomes could be revealed by the length of gap spacer in the rearranged area (Kumazawa and Nishida, 1995; McKnight and Shaffer, 1997; Gong et al., 2020a). In order to explore the relationship between the phylogeny of Sesarmidae species and the gaps in the CR-Q-I-M region, four phylogenetic trees (two nucleotide trees and two amino acid trees) were constructed including 11 sesarmid crabs (Fig. 6). Except for the phylogenetic position of N. minutum, the ML tree of the amino acid sequences has the same topology as the other three phylogenetic trees. Although the difference exists, an obvious correlation between the gaps in the rearranged CR-Q-I-M region and the phylogenetic position of each sesarmid crab is observed (Fig. 6). Our results show that with the evolution of sesarmid crabs, the gap spacers (G5 and G6) decrease progressively under the degradation pressure of non-functional genes.
Figure
6.
Relationship of Sesarmidae species and gap spacers between tRNA and QIM. G5 and G6 indicate the intergenic spacer between Q and I and between I and M, respectively. Phylogenetic trees of Sesarmidae species inferred from 13 PCGs based on different methods. a. Nucleotide sequences based on maximum likelihood and Bayesian inference analysis, amino acids sequences based on maximum likelihood analysis; b. the length of intergenic spacers in the rearranged region; c. amino acid sequences based on Bayesian inference analysis; node marked with a solid circle indicates 100 maximum likelihood bootstrap support and 100% Bayesian inference posterior probability.
In this study, the complete mitogenome of P. eumolpe was sequenced. The 15 646 bp mitogenome contains 37 genes and one AT-rich region, as is typical of metazoan mitogenome. Compared to other previously reported complete mitogenomes of Sesarmidae, all of them have similar molecular characteristics. Although all 13 PCGs evolve under purifying selection, the ATP8 gene evolves under a highly relaxed selection. All of these analyzed Sesarmidae mitogenomes capture the same gene rearrangements, which can be fully explained by the TDRL model. The most comprehensive molecular phylogenetic analysis of Brachyura was constructed, and the polyphyly of three superfamilies (Eriphioidea, Ocypodoidea, and Grapsoidea) is reconfirmed. However, large-scale taxonomic samplings are still needed to further investigate the genomic evolution within Sesarmidae and better understand the taxonomical and phylogenetic studies of Brachyura.
Arndt A, Smith M J. 1998. Mitochondrial gene rearrangement in the sea cucumber genus Cucumaria. Molecular Biology and Evolution, 15(8): 1009–1016. doi: 10.1093/oxfordjournals.molbev.a025999
[2]
Basso A, Babbucci M, Pauletto M, et al. 2017. The highly rearranged mitochondrial genomes of the crabs Maja crispata and Maja squinado (Majidae) and gene order evolution in Brachyura. Scientific Reports, 7(1): 4096. doi: 10.1038/s41598-017-04168-9
[3]
Benson G. 1999. Tandem repeats finder: a program to analyze DNA sequences. Nucleic Acids Research, 27(2): 573–580. doi: 10.1093/nar/27.2.573
[4]
Bernt M, Donath A, Jühling F, et al. 2013. MITOS: improved de novo metazoan mitochondrial genome annotation. Molecular Phylogenetics and Evolution, 69(2): 313–319. doi: 10.1016/j.ympev.2012.08.023
Boussau B, Walton Z, Delgado J A, et al. 2014. Strepsiptera, phylogenomics and the long branch attraction problem. PLoS ONE, 9(10): e107709. doi: 10.1371/journal.pone.0107709
[7]
Cantatore P, Gadaleta M N, Roberti M, et al. 1987. Duplication and remoulding of tRNA genes during the evolutionary rearrangement of mitochondrial genomes. Nature, 329(6142): 853–855. doi: 10.1038/329853a0
[8]
Chen Jianqin, Xing Yuhui, Yao Wenjia, et al. 2018. Characterization of four new mitogenomes from Ocypodoidea & Grapsoidea, and phylomitogenomic insights into thoracotreme evolution. Gene, 675: 27–35. doi: 10.1016/j.gene.2018.06.088
[9]
Dierckxsens N, Mardulyn P, Smits G. 2017. NOVOPlasty: de novo assembly of organelle genomes from whole genome data. Nucleic Acids Research, 45(4): e18
[10]
Evans N. 2018. Molecular phylogenetics of swimming crabs (Portunoidea Rafinesque, 1815) supports a revised family-level classification and suggests a single derived origin of symbiotic taxa. PeerJ, 6: e4260. doi: 10.7717/peerj.4260
[11]
Gillikin D P, Schubart C D. 2004. Ecology and systematics of mangrove crabs of the genus Perisesarma (Crustacea: Brachyura: Sesarmidae) from East Africa. Zoological Journal of the Linnean Society, 141(3): 435–445. doi: 10.1111/j.1096-3642.2004.00125.x
[12]
Gong Li, Jiang Hui, Zhu Kehua, et al. 2019. Large-scale mitochondrial gene rearrangements in the hermit crab Pagurus nigrofascia and phylogenetic analysis of the Anomura. Gene, 695: 75–83. doi: 10.1016/j.gene.2019.01.035
[13]
Gong Li, Lu Xinting, Luo Hairong, et al. 2020a. Novel gene rearrangement pattern in Cynoglossus melampetalus mitochondrial genome: new gene order in genus Cynoglossus (Pleuronectiformes: Cynoglossidae). International Journal of Biological Macromolecules, 149: 1232–1240. doi: 10.1016/j.ijbiomac.2020.02.017
[14]
Gong Li, Lu Xinting, Wang Zhifu, et al. 2020b. Novel gene rearrangement in the mitochondrial genome of Coenobita brevimanus (Anomura: Coenobitidae) and phylogenetic implications for Anomura. Genomics, 112(2): 1804–1812. doi: 10.1016/j.ygeno.2019.10.012
[15]
Gong Li, Shi Wei, Si Lizhen, et al. 2013. Rearrangement of mitochondrial genome in fishes. Zoological Research, 34(6): 666–673
[16]
Guo Xinhong, Liu Shaojun, Liu Yun. 2003. Comparative analysis of the mitochondrial DNA control region in cyprinids with different ploidy level. Aquaculture, 224(1–4): 25–38. doi: 10.1016/S0044-8486(03)00168-6
[17]
Gyllensten U, Wharton D, Josefsson A, et al. 1991. Paternal inheritance of mitochondrial DNA in mice. Nature, 352(6332): 255–257. doi: 10.1038/352255a0
[18]
Hebert P D N, Ratnasingham S, De Waard J R. 2003. Barcoding animal life: cytochrome c oxidase subunit 1 divergences among closely related species. Proceedings of the Royal Society B: Biological Sciences, 270(S1): S96–S99
[19]
Kumar S, Stecher G, Li M, et al. 2018. MEGA X: molecular evolutionary genetics analysis across computing platforms. Molecular Biology and Evolution, 35(6): 1547–1549. doi: 10.1093/molbev/msy096
[20]
Kumazawa Y, Nishida M. 1995. Variations in mitochondrial tRNA gene organization of reptiles as phylogenetic markers. Molecular Biology and Evolution, 12(5): 759–772
[21]
Larkin M A, Blackshields G, Brown N P, et al. 2007. Clustal W and Clustal X version 2.0. Bioinformatics, 23(21): 2947–2948. doi: 10.1093/bioinformatics/btm404
[22]
Lavrov D V, Boore J L, Brown W M. 2002. Complete mtDNA sequences of two millipedes suggest a new model for mitochondrial gene rearrangements: duplication and nonrandom loss. Molecular Biology and Evolution, 19(2): 163–169. doi: 10.1093/oxfordjournals.molbev.a004068
[23]
Lee S Y. 1998. Ecological role of grapsid crabs in mangrove ecosystems: a review. Marine and Freshwater Research, 49(4): 335–343. doi: 10.1071/MF97179
[24]
Liu Qiuning, Xin Zhaozhe, Zhu Xiaoyu, et al. 2017. A transfer RNA gene rearrangement in the lepidopteran mitochondrial genome. Biochemical and Biophysical Research Communications, 489(2): 149–154. doi: 10.1016/j.bbrc.2017.05.115
[25]
Lowe T M, Chan P P. 2016. tRNAscan-SE On-line: integrating search and context for analysis of transfer RNA genes. Nucleic Acids Research, 44(W1): W54–W57. doi: 10.1093/nar/gkw413
[26]
Lu Xinting, Gong Li, Zhang Ying, et al. 2020. The complete mitochondrial genome of Calappa bilineata: the first representative from the family Calappidae and its phylogenetic position within Brachyura. Genomics, 112(3): 2516–2523. doi: 10.1016/j.ygeno.2020.02.003
[27]
Lü Zhenming, Zhu Kehua, Jiang Hui, et al. 2019. Complete mitochondrial genome of Ophichthus brevicaudatus reveals novel gene order and phylogenetic relationships of Anguilliformes. International Journal of Biological Macromolecules, 135: 609–618. doi: 10.1016/j.ijbiomac.2019.05.139
[28]
Luo Hairong, Kong Xiaoyu, Chen Shixi, et al. 2019. Mechanisms of gene rearrangement in 13 bothids based on comparison with a newly completed mitogenome of the threespot flounder, Grammatobothus polyophthalmus (Pleuronectiformes: Bothidae). BMC Genomics, 20(1): 792. doi: 10.1186/s12864-019-6128-9
[29]
Ma Kayan, Qin Jing, Lin Chia-Wei, et al. 2019. Phylogenomic analyses of brachyuran crabs support early divergence of primary freshwater crabs. Molecular Phylogenetics and Evolution, 135: 62–66. doi: 10.1016/j.ympev.2019.02.001
[30]
Ma Zhihong, Yang Xuefen, Bercsenyi M, et al. 2015. Comparative mitogenomics of the genus Odontobutis (Perciformes: Gobioidei: Odontobutidae) revealed conserved gene rearrangement and high sequence variations. International Journal of Molecular Sciences, 16(10): 25031–25049. doi: 10.3390/ijms161025031
[31]
Macey J R, Larson A, Ananjeva N B, et al. 1997. Two novel gene orders and the role of light-strand replication in rearrangement of the vertebrate mitochondrial genome. Molecular Biology and Evolution, 14(1): 91–104. doi: 10.1093/oxfordjournals.molbev.a025706
[32]
Martin M. 2011. Cutadapt removes adapter sequences from high-throughput sequencing reads. EMBnet. Journal, 17(1): 10–12
[33]
McKnight M L, Shaffer H B. 1997. Large, rapidly evolving intergenic spacers in the mitochondrial DNA of the salamander family Ambystomatidae (Amphibia: Caudata). Molecular Biology and Evolution, 14(11): 1167–1176. doi: 10.1093/oxfordjournals.molbev.a025726
[34]
Moritz C, Dowling T E, Brown W M. 1987. Evolution of animal mitochondrial DNA: relevance for population biology and systematics. Annual Review of Ecology and Systematics, 18: 269–292. doi: 10.1146/annurev.es.18.110187.001413
[35]
Nguyen L T, Schmidt H A, Von Haeseler A, et al. 2015. IQ-TREE: a fast and effective stochastic algorithm for estimating maximum-likelihood phylogenies. Molecular Biology and Evolution, 32(1): 268–274. doi: 10.1093/molbev/msu300
[36]
Ojala D, Montoya J, Attardi G. 1981. tRNA punctuation model of RNA processing in human mitochondria. Nature, 290(5806): 470–474. doi: 10.1038/290470a0
[37]
Perna N T, Kocher T D. 1995. Patterns of nucleotide composition at fourfold degenerate sites of animal mitochondrial genomes. Journal of Molecular Evolution, 41(3): 353–358. doi: 10.1007/BF01215182
[38]
Philippe H. 2000. Opinion: long branch attraction and protist phylogeny. Protist, 151(4): 307–316. doi: 10.1078/S1434-4610(04)70029-2
[39]
Poulton J, Deadman M E, Bindoff L, et al. 1993. Families of mtDNA re-arrangements can be detected in patients with mtDNA deletions: duplications may be a transient intermediate form. Human Molecular Genetics, 2(1): 23–30. doi: 10.1093/hmg/2.1.23
[40]
Ray D A, Densmore L. 2002. The crocodilian mitochondrial control region: general structure, conserved sequences, and evolutionary implications. Journal of Experimental Zoology, 294(4): 334–345. doi: 10.1002/jez.10198
[41]
Ren Lipin, Zhang Xiangyan, Li Yi, et al. 2020. Comparative analysis of mitochondrial genomes among the subfamily Sarcophaginae (Diptera: Sarcophagidae) and phylogenetic implications. International Journal of Biological Macromolecules, 161: 214–222. doi: 10.1016/j.ijbiomac.2020.06.043
[42]
Ronquist F, Teslenko M, Van Der Mark P, et al. 2012. MrBayes 3.2: efficient Bayesian phylogenetic inference and model choice across a large model space. Systematic Biology, 61(3): 539–542. doi: 10.1093/sysbio/sys029
[43]
Rozas J, Ferrer-Mata A, Sánchez-DelBarrio J C, et al. 2017. DnaSP 6: DNA sequence polymorphism analysis of large data sets. Molecular Biology and Evolution, 34(12): 3299–3302. doi: 10.1093/molbev/msx248
[44]
Ruan Huiting, Li Min, Li Zhenhai, et al. 2020. Comparative analysis of complete mitochondrial genomes of three Gerres fishes (Perciformes: Gerreidae) and primary exploration of their evolution history. International Journal of Molecular Sciences, 21(5): 1874. doi: 10.3390/ijms21051874
[45]
Sanchez G, Tomano S, Yamashiro C, et al. 2016. Population genetics of the jumbo squid Dosidicus gigas (Cephalopoda: Ommastrephidae) in the northern Humboldt Current system based on mitochondrial and microsatellite DNA markers. Fisheries Research, 175: 1–9. doi: 10.1016/j.fishres.2015.11.005
[46]
Sato M, Sato K. 2013. Maternal inheritance of mitochondrial DNA by diverse mechanisms to eliminate paternal mitochondrial DNA. Biochimica et Biophysica Acta (BBA)-Molecular Cell Research, 1833(8): 1979–1984. doi: 10.1016/j.bbamcr.2013.03.010
[47]
Shahdadi A, Ng P K L, Schubart C D. 2018. Morphological and phylogenetic evidence for a new species of Parasesarma De Man, 1895 (Crustacea: Decapoda: Brachyura: Sesarmidae) from the Malay Peninsula, previously referred to as Parasesarma indiarum (Tweedie, 1940). Raffles Bulletin of Zoology, 66: 739–762
[48]
Shahdadi A, Schubart C D. 2015. Evaluating the consistency and taxonomic importance of cheliped and other morphological characters that potentially allow identification of species of the genus Perisesarma De Man, 1895 (Brachyura, Sesarmidae). Crustaceana, 88(10−11): 1079–1095. doi: 10.1163/15685403-00003473
[49]
Shahdadi A, Schubart C D. 2018. Taxonomic review of Perisesarma (Decapoda: Brachyura: Sesarmidae) and closely related genera based on morphology and molecular phylogenetics: new classification, two new genera and the questionable phylogenetic value of the epibranchial tooth. Zoological Journal of the Linnean Society, 182(3): 517–548. doi: 10.1093/zoolinnean/zlx032
[50]
Stothard P, Wishart D S. 2005. Circular genome visualization and exploration using CGView. Bioinformatics, 21(4): 537–539. doi: 10.1093/bioinformatics/bti054
[51]
Sun Ziqiang, Liu Yingqi, Wilson J J, et al. 2019. Mitochondrial genome of Phalantus geniculatus (Hemiptera: Reduviidae): trnT duplication and phylogenetic implications. International Journal of Biological Macromolecules, 129: 110–115. doi: 10.1016/j.ijbiomac.2019.01.205
[52]
Talavera G, Castresana J. 2007. Improvement of phylogenies after removing divergent and ambiguously aligned blocks from protein sequence alignments. Systematic Biology, 56(4): 564–577. doi: 10.1080/10635150701472164
[53]
Tan M H, Gan Hanming, Lee Y P, et al. 2018. ORDER within the chaos: insights into phylogenetic relationships within the Anomura (Crustacea: Decapoda) from mitochondrial sequences and gene order rearrangements. Molecular Phylogenetics and Evolution, 127: 320–331. doi: 10.1016/j.ympev.2018.05.015
[54]
Thyagarajan B, Padua R A, Campbell C. 1996. Mammalian mitochondria possess homologous DNA recombination activity. Journal of Biological Chemistry, 271(44): 27536–27543. doi: 10.1074/jbc.271.44.27536
[55]
Tsang L M, Schubart C D, Ahyong S T, et al. 2014. Evolutionary history of true crabs (Crustacea: Decapoda: Brachyura) and the origin of freshwater crabs. Molecular Biology and Evolution, 31(5): 1173–1187. doi: 10.1093/molbev/msu068
[56]
Tsaousis A D, Martin D P, Ladoukakis E D, et al. 2005. Widespread recombination in published animal mtDNA sequences. Molecular Biology and Evolution, 22(4): 925–933. doi: 10.1093/molbev/msi084
[57]
Tweedie M W F. 1954. Notes on grapsoid crabs from the Raffles Museum, Nos. 3, 4 and 5. Bulletin of the Raffles Museum, 25: 118–128
[58]
Wang Yuan, Chen Jing, Jiang Liyun, et al. 2015. Hemipteran mitochondrial genomes: features, structures and implications for phylogeny. International Journal of Molecular Sciences, 16(6): 12382–12404
[59]
Wang Ziqian, Shi Xuejia, Guo Huayun, et al. 2020a. Characterization of the complete mitochondrial genome of Uca lacteus and comparison with other Brachyuran crabs. Genomics, 112(1): 10–19. doi: 10.1016/j.ygeno.2019.06.004
[60]
Wang Zhengfei, Shi Xuejia, Tao Yitao, et al. 2019. The complete mitochondrial genome of Parasesarma pictum (Brachyura: Grapsoidea: Sesarmidae) and comparison with other Brachyuran crabs. Genomics, 111(4): 799–807. doi: 10.1016/j.ygeno.2018.05.002
[61]
Wang Qi, Tang Dan, Guo Huayun, et al. 2020b. Comparative mitochondrial genomic analysis of Macrophthalmus pacificus and insights into the phylogeny of the Ocypodoidea & Grapsoidea. Genomics, 112(1): 82–91. doi: 10.1016/j.ygeno.2019.12.012
[62]
Wang Zhengfei, Wang Ziqian, Shi Xuejia, et al. 2018. Complete mitochondrial genome of Parasesarma affine (Brachyura: Sesarmidae): Gene rearrangements in Sesarmidae and phylogenetic analysis of the Brachyura. International Journal of Biological Macromolecules, 118: 31–40. doi: 10.1016/j.ijbiomac.2018.06.056
[63]
Wu Xiangyun, Li Xiaoling, Li Lu, et al. 2012. New features of Asian Crassostrea oyster mitochondrial genomes: a novel alloacceptor tRNA gene recruitment and two novel ORFs. Gene, 507(2): 112–118. doi: 10.1016/j.gene.2012.07.032
[64]
Xin Zhaozhe, Liu Yu, Tang Boping, et al. 2018. A comprehensive phylogenetic analysis of Grapsoidea crabs (Decapoda: Brachyura) based on mitochondrial cytochrome oxidase subunit 1 (CO1) genes. Turkish Journal of Zoology, 42: 46–52. doi: 10.3906/zoo-1703-46
[65]
Yang Ziheng. 2006. Computational Molecular Evolution. Oxford: Oxford University Press, 259–292
[66]
Yang Zhihui, Yang Tingting, Liu Yu, et al. 2019. The complete mitochondrial genome of Sinna extrema (Lepidoptera: Nolidae) and its implications for the phylogenetic relationships of Noctuoidea species. International Journal of Biological Macromolecules, 137: 317–326. doi: 10.1016/j.ijbiomac.2019.06.238
[67]
Zhang Zhiqiang. 2011. Animal biodiversity: an outline of higher-level classification and survey of taxonomic richness. Zootaxa, 3148: 1–237. doi: 10.11646/zootaxa.3148.1.1
[68]
Zhang Dong, Gao Fangluan, Jakovlić I, et al. 2020a. PhyloSuite: an integrated and scalable desktop platform for streamlined molecular sequence data management and evolutionary phylogenetics studies. Molecular Ecology Resources, 20(1): 348–355. doi: 10.1111/1755-0998.13096
[69]
Zhang Bo, Wu Yingying, Wang Xin, et al. 2020b. Comparative analysis of mitochondrial genome of a deep-sea crab Chaceon granulates reveals positive selection and novel genetic features. Journal of Oceanology and Limnology, 38(2): 427–437. doi: 10.1007/s00343-019-8364-x
[70]
Zhang Zhan, Xing Yuhui, Cheng Jiajia, et al. 2020c. Phylogenetic implications of mitogenome rearrangements in East Asian potamiscine freshwater crabs (Brachyura: Potamidae). Molecular Phylogenetics and Evolution, 143: 106669. doi: 10.1016/j.ympev.2019.106669
[71]
Zhao Ling, Zheng Zheming, Huang Yuan, et al. 2011. Comparative analysis of the mitochondrial control region in Orthoptera. Zoological Studies, 50(3): 385–393
[72]
Zhuang Xuan, Cheng C H C. 2010. ND6 gene “lost” and found: evolution of mitochondrial gene rearrangement in Antarctic notothenioids. Molecular Biology and Evolution, 27(6): 1391–1403. doi: 10.1093/molbev/msq026
Figure 1. Aligned sequences of the CRs in 11 sesarmid crabs. The shaded blocks represent the conserved sequences. Abbreviations of species names are given as follows: C. neg, Chiromantes neglectum; C. deh, Chiromantes dehaani; C. hae, Chiromantes haematocheir; M. dep, Metopaulias depressus; C. sin, Clistocoeloma sinense; E. laf, Episesarma lafondii; P. eum, Parasesarma eumolpe; P. aff, Parasesarma affine; N. min, Nanosesarma minutum; P. tri, Parasesarma tripectinis; P. pic, Parasesarma pictum. The numbers in the square brackets are length of base (unit: bp).
Figure 2. Organization of the CRs in 11 Sesarmidae mitogenomes. Purple ellipses indicate the tandem repeat units; the remaining regions are shown in light gray boxes. The tandem repeat with copy number is displayed in the format of (motif)n.
Figure 3. Box-plot comparisons of the pairwise Ka/Ks (Ka, non-synonymous substitution; Ks, synonymous substitution) ratios estimated in the various mitochondrial genes. The estimates were based on pairwise alignments of samples.
Figure 4. Inferred intermediate steps between the ancestral gene arrangement of Decapoda, Brachyura and Sesarmidae mitogenomes. PCGs and control region (CR) are indicated with boxes, and tRNAs are indicated with columns. Genes labeled above the diagram are encoded on the H-strand and those below the diagram on the L-strand. a. Ancestral gene arrangement of Decapoda; b. ancestral gene arrangement of Brachyura; c. gene arrangement of 11 Sesarmidae species. The duplicated gene block is underlined, and the lost genes are marked in dark gray. G1, G2, G3, G4, G5, G6, and G7 indicate the intergenic spacer between E and H, H and F, F and ND5, ND5 and ND4, Q and I, I and M, M and ND2, respectively; the number after the species names is the amount of intergenic spacers.
Figure 5. Phylogenetic tree of brachyuran species inferred from the nucleotide sequences of 13 PCGs based on maximum likelihood and Bayesian inference analyses. The node marked with a solid circle indicates 100 maximum likelihood bootstrap support and 100% Bayesian inference posterior probability.
Figure 6. Relationship of Sesarmidae species and gap spacers between tRNA and QIM. G5 and G6 indicate the intergenic spacer between Q and I and between I and M, respectively. Phylogenetic trees of Sesarmidae species inferred from 13 PCGs based on different methods. a. Nucleotide sequences based on maximum likelihood and Bayesian inference analysis, amino acids sequences based on maximum likelihood analysis; b. the length of intergenic spacers in the rearranged region; c. amino acid sequences based on Bayesian inference analysis; node marked with a solid circle indicates 100 maximum likelihood bootstrap support and 100% Bayesian inference posterior probability.


 DownLoad:
 DownLoad:


 DownLoad: