Ruixiang Zhao, Xiaohua Zhu, Chuanzheng Zhang, Hua Zheng. The first near real-time inverted echo sounder observation in the South China Sea[J]. Acta Oceanologica Sinica, 2021, 40(6): 129-130. doi: 10.1007/s13131-021-1875-2
Citation:
Ruixiang Zhao, Xiaohua Zhu, Chuanzheng Zhang, Hua Zheng. The first near real-time inverted echo sounder observation in the South China Sea[J]. Acta Oceanologica Sinica, 2021, 40(6): 129-130. doi: 10.1007/s13131-021-1875-2
Ruixiang Zhao, Xiaohua Zhu, Chuanzheng Zhang, Hua Zheng. The first near real-time inverted echo sounder observation in the South China Sea[J]. Acta Oceanologica Sinica, 2021, 40(6): 129-130. doi: 10.1007/s13131-021-1875-2
Citation:
Ruixiang Zhao, Xiaohua Zhu, Chuanzheng Zhang, Hua Zheng. The first near real-time inverted echo sounder observation in the South China Sea[J]. Acta Oceanologica Sinica, 2021, 40(6): 129-130. doi: 10.1007/s13131-021-1875-2
State Key Laboratory of Satellite Ocean Environment Dynamics, Second Institute of Oceanography, Ministry of Natural Resources, Hangzhou 310012, China
2.
Southern Laboratory of Ocean Science and Engineering (Zhuhai), Zhuhai 519082, China
3.
School of Oceanography, Shanghai Jiao Tong University, Shanghai 200030, China
Funds:
The Scientific Research Fund of Second Institute of Oceanography, MNR, under contract Nos QNYC2102, JZ2001 and JT1801; the National Natural Science Foundation of China under contract Nos 41920104006, 41906023, 41806020, 41776107, 41906024 and 41976001; the Project of State Key Laboratory of Satellite Ocean Environment Dynamics, SIO, under contract No. SOEDZZ2106.
We report the first near real-time inverted echo sounder (IES) observation in the South China Sea (Fig. 1). Although the first IES observation in the South China Sea was in 2005, and the near real-time IES observation module was first developed in 2012 (http://www.po.gso.uri.edu/dynamics/IES/hist.html), the real-time IES has never been deployed in the South China Sea until the reporting of observations in this study. IES is a bottom-mounted mooring that records the round-trip acoustic travel time from the bottom to the surface and back (τ), bottom pressure, and near bottom velocities (eastward component $\mathord{\buildrel{\lower3pt\hbox{$\scriptscriptstyle\rightharpoonup$}} \over u }$ and westward component $\mathord{\buildrel{\lower3pt\hbox{$\scriptscriptstyle\rightharpoonup$}} \over v } $). To achieve near real-time observations, four Popeye data-shuttles (PDSs) contained in a float sphere were deployed around the IES. The PDSs are the add-on devices of IES, and can serve as a data carrier. When the PDS was activated at its scheduled time, the IES transmitted its data by generating a non-propagating magnetic field around its housing. The PDS equipped with a magnetic field detector converted the amplitude modulations of the field into digital signals and recorded the IES data. After complete data download, the PDS was released from the anchor and it floated on the surface. Subsequently, the PDS accessed the Iridium Short Burst Data (SBD) service and transmitted IES observation data to the email address of the user. Each PDS-IES system can achieve four near real-time data transmissions before recovery.
Figure
1.
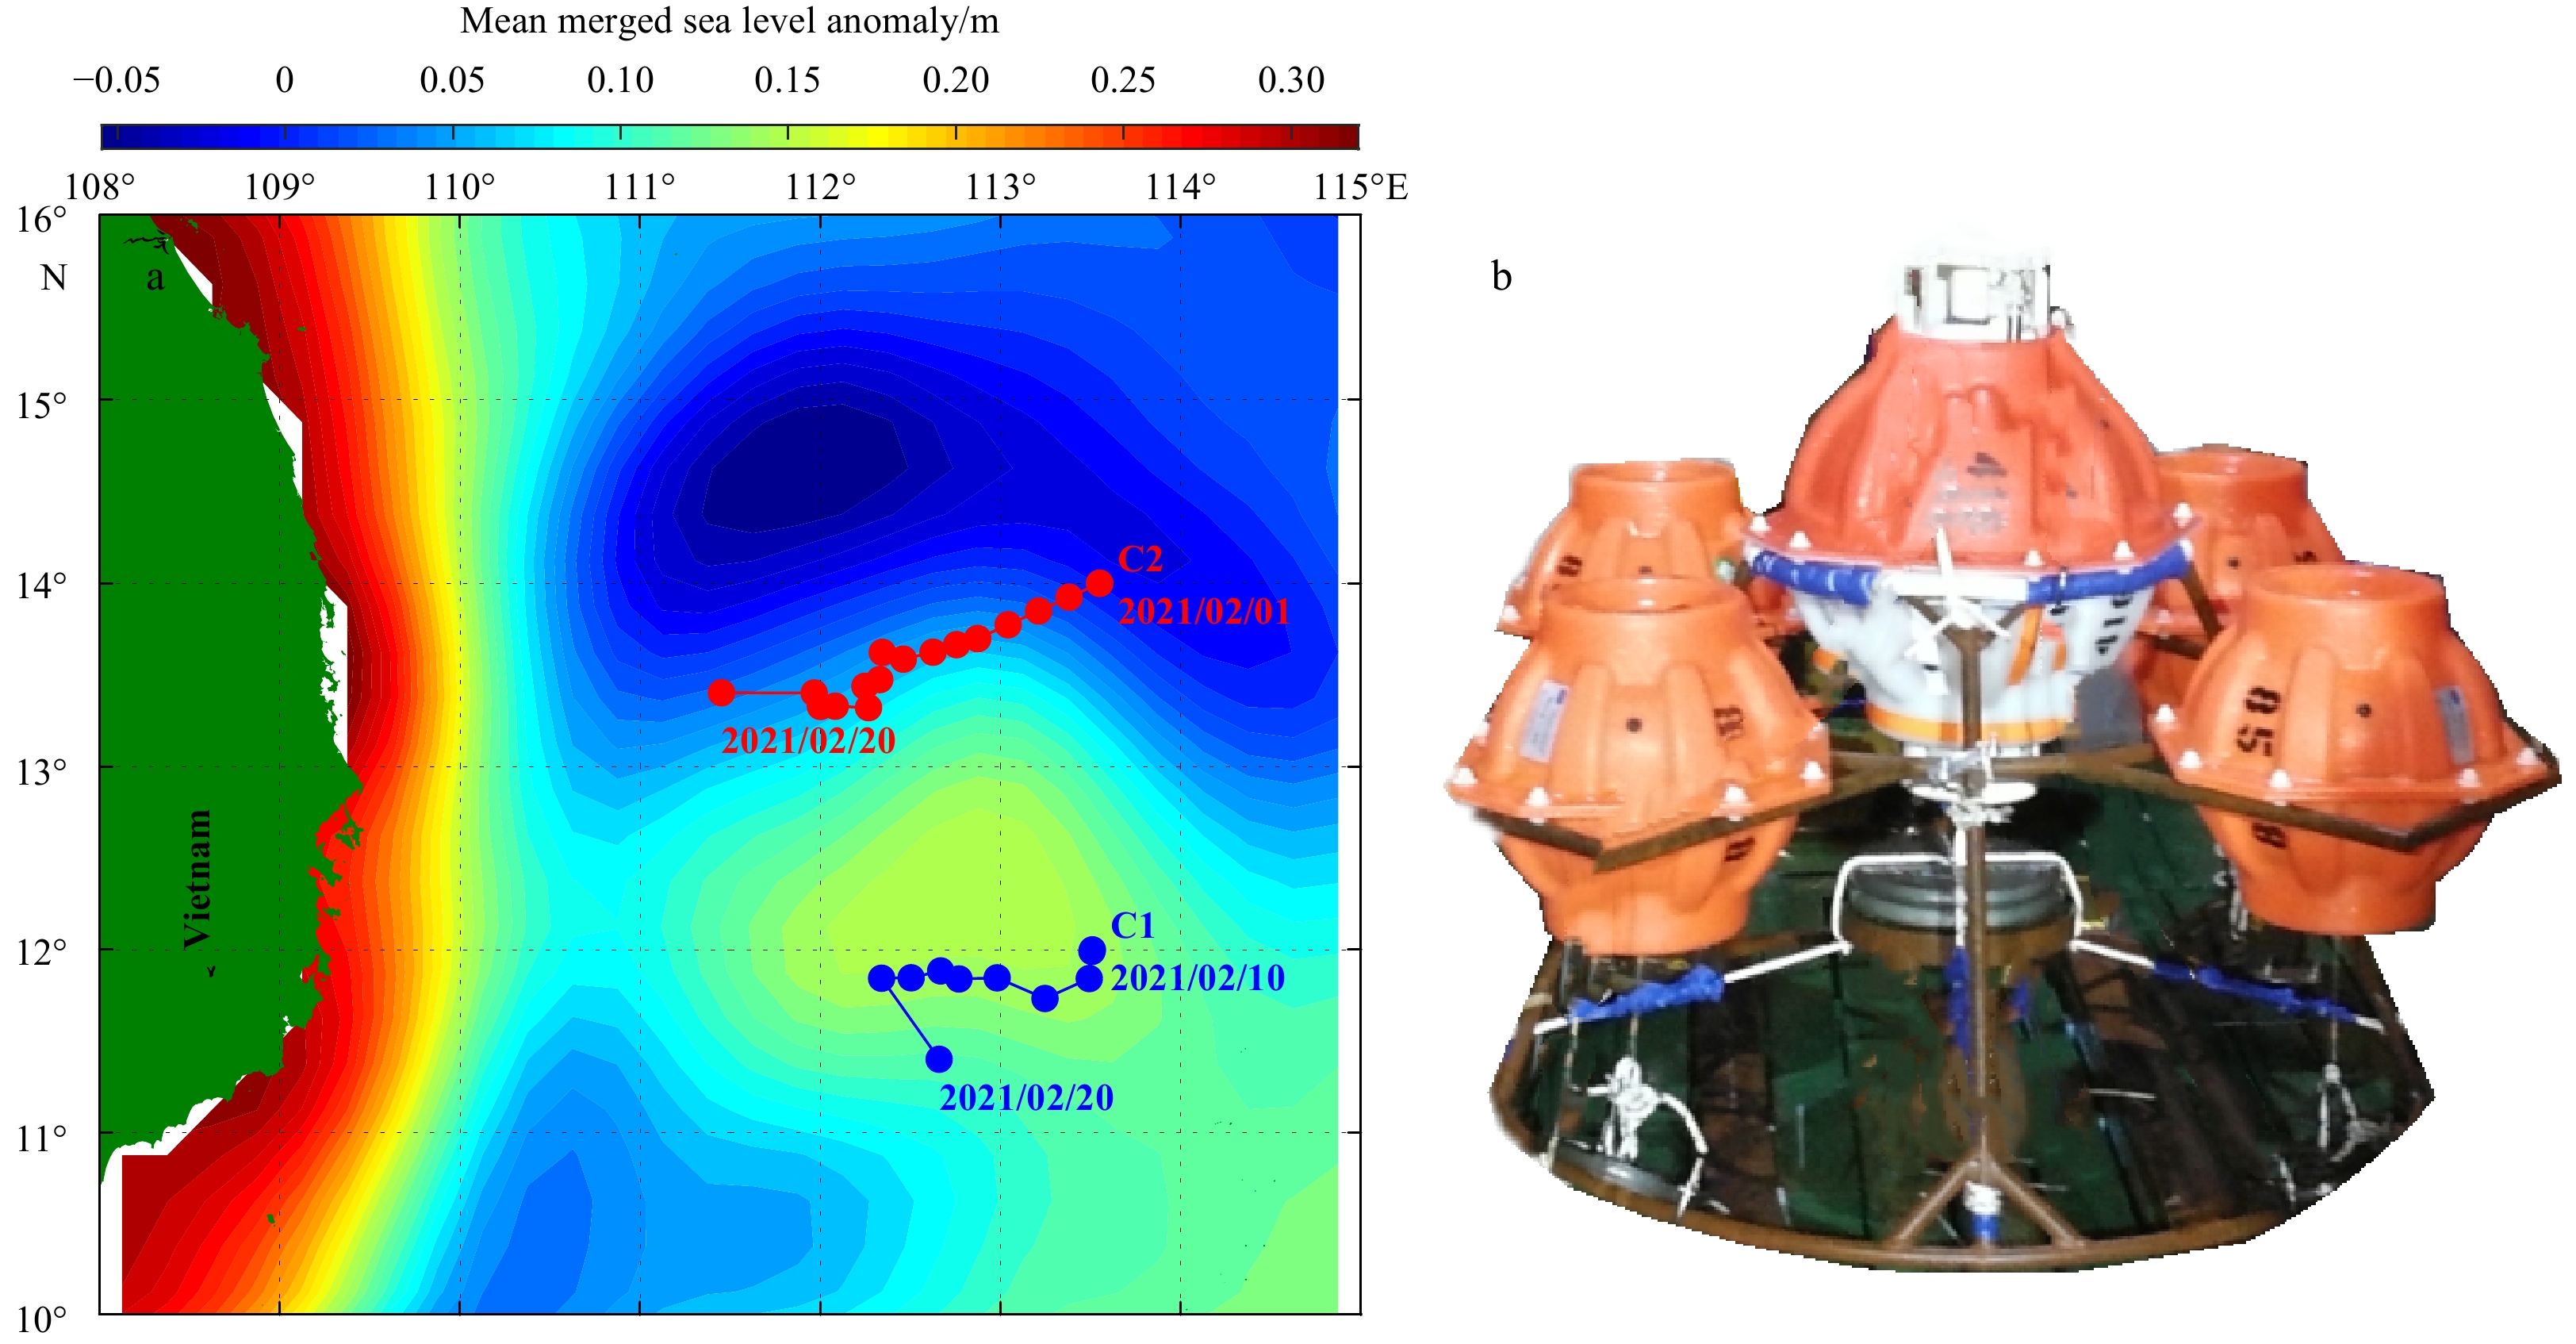
Location map of the PDS-IES stations (C1 and C2) and trajectories of PDSs after reaching the surface (February 10 and 1 for C1 and C2, respectively) (a), and a photo of PDS-IES before deployment (b). The instrument in the middle is IES, which is surrounded by four PDSs.
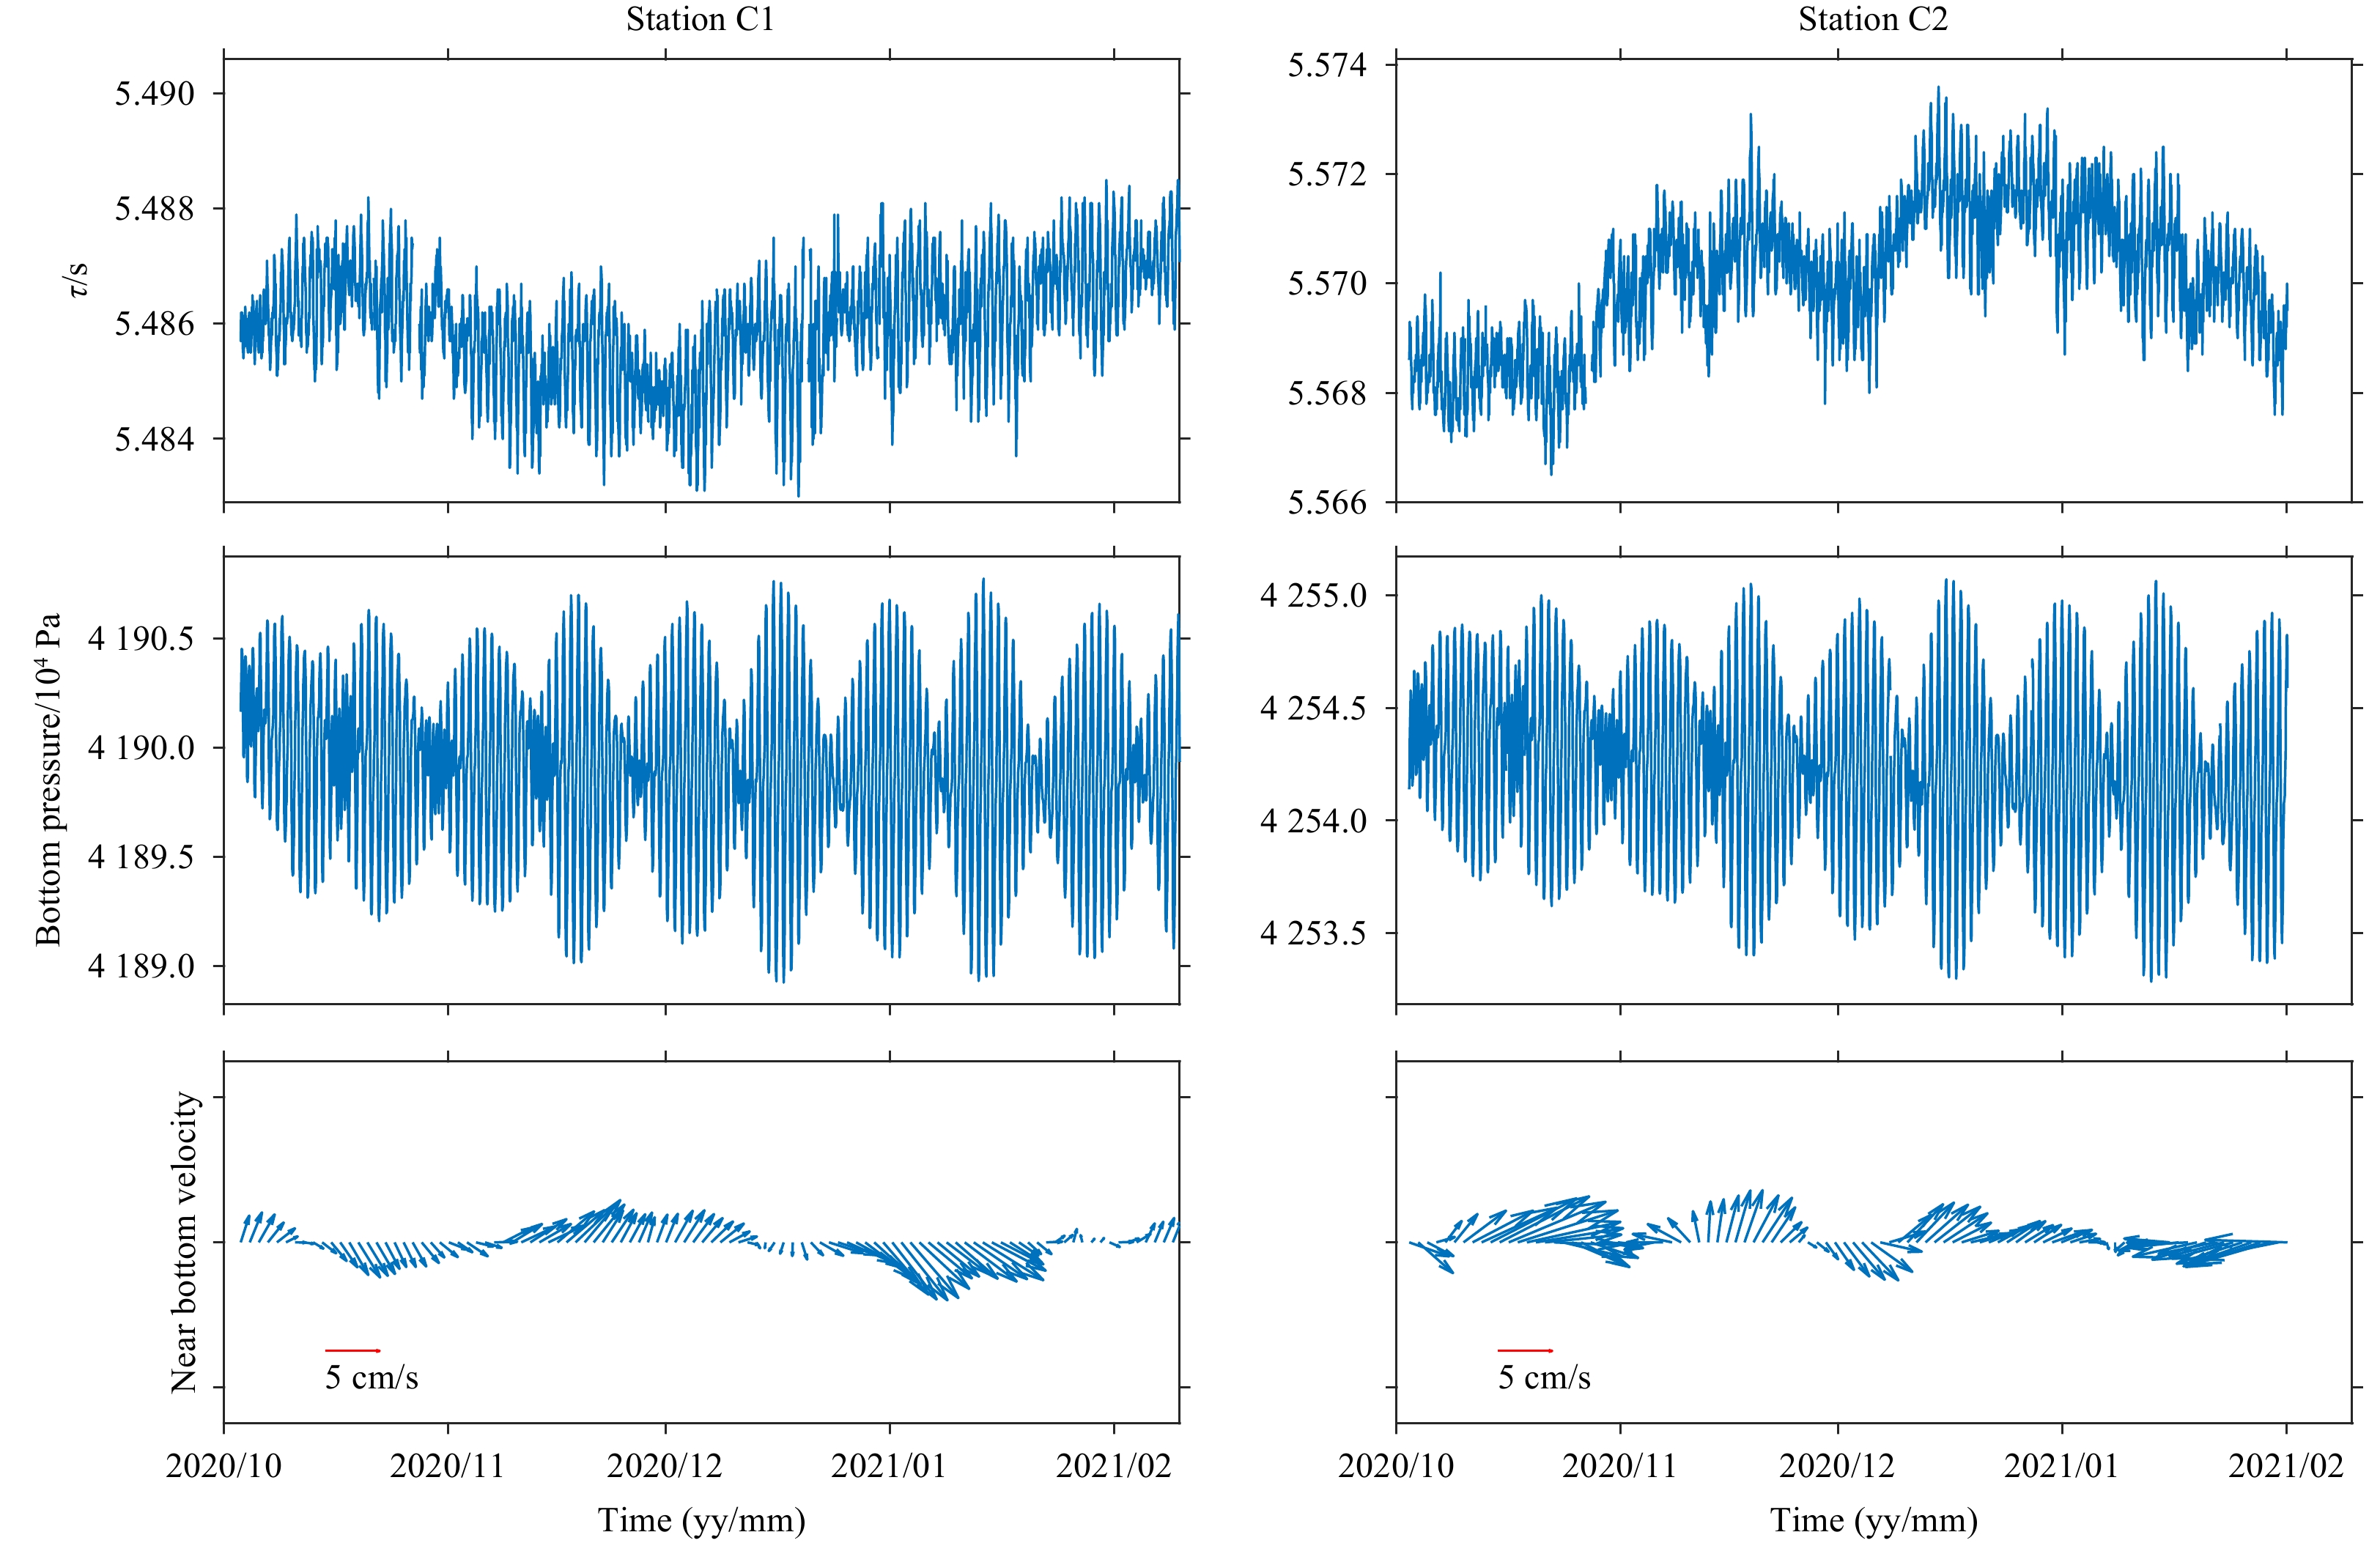
The PDS-IESs were deployed in October 2020 to monitor the active mesoscale eddies in the southwestern South China Sea. PDSs for C1 (serial number (SN) 85) and C2 (SN 81) were released and sent data at the scheduled time February 10 and 1 of 2021, respectively. All the measured data are successfully retrieved, which proved the robustness of the PDS technique. From the retrieved data (Fig. 2), it is found that τ and $\mathord{\buildrel{\lower3pt\hbox{$\scriptscriptstyle\rightharpoonup$}} \over u } $, $\mathord{\buildrel{\lower3pt\hbox{$\scriptscriptstyle\rightharpoonup$}} \over v} $ of the two stations (C1 and C2) show quite different variability, although their distance is not quite large (around 180 km). For C1, τ dropped from October to December in 2020, then increased slowly till late February. It is interpreted that temperature in the upper ocean increased first but decreased after December. It seemed to be the opposite for C2. Strong mesoscale eddies are likely to account for above phenomenon, which are identified from merged sea surface height product released by Copernicus. For $\mathord{\buildrel{\lower3pt\hbox{$\scriptscriptstyle\rightharpoonup$}} \over u } $ and $\mathord{\buildrel{\lower3pt\hbox{$\scriptscriptstyle\rightharpoonup$}} \over v } $, time-mean eastward components are evident for both stations, with mean speeds of 2.0 cm/s (C1) and 1.2 cm/s (C2), which seemed to be caused by the Vietnam Offshore Current; however, meridional velocities of the two stations showed quite different variability. From the power spectrum analysis (figures not shown), near 20 d period variability are strong for both τ and $\mathord{\buildrel{\lower3pt\hbox{$\scriptscriptstyle\rightharpoonup$}} \over u } $, $\mathord{\buildrel{\lower3pt\hbox{$\scriptscriptstyle\rightharpoonup$}} \over v } $. Tidal signals with maximum amplitude of near 1×10⁴ Pa are quite significant in bottom pressure records. In subtidal frequency band, near 5 d period bottom pressure variability are quite significant for both stations. The PDSs continued to report its location once a day after its surface. Till February 20, they both headed southwestward with an average speed of 0.15 m/s (SN 85) and 0.13 m/s (SN 81), respectively.
Figure
2.
The round-trip acoustic travel time (τ), bottom pressure, and near bottom velocities for C1 and C2.
The data were acquired in February 2021 and officially announced by the Second Institute of Oceanography, Ministry of Natural Resources. It is the first near real-time inverted echo sounder observation in China, and offers a new technique for retrieving deep ocean mooring data without recovery.
Figure 1. Location map of the PDS-IES stations (C1 and C2) and trajectories of PDSs after reaching the surface (February 10 and 1 for C1 and C2, respectively) (a), and a photo of PDS-IES before deployment (b). The instrument in the middle is IES, which is surrounded by four PDSs.
Figure 2. The round-trip acoustic travel time (τ), bottom pressure, and near bottom velocities for C1 and C2.


 DownLoad:


 DownLoad: