
Figure
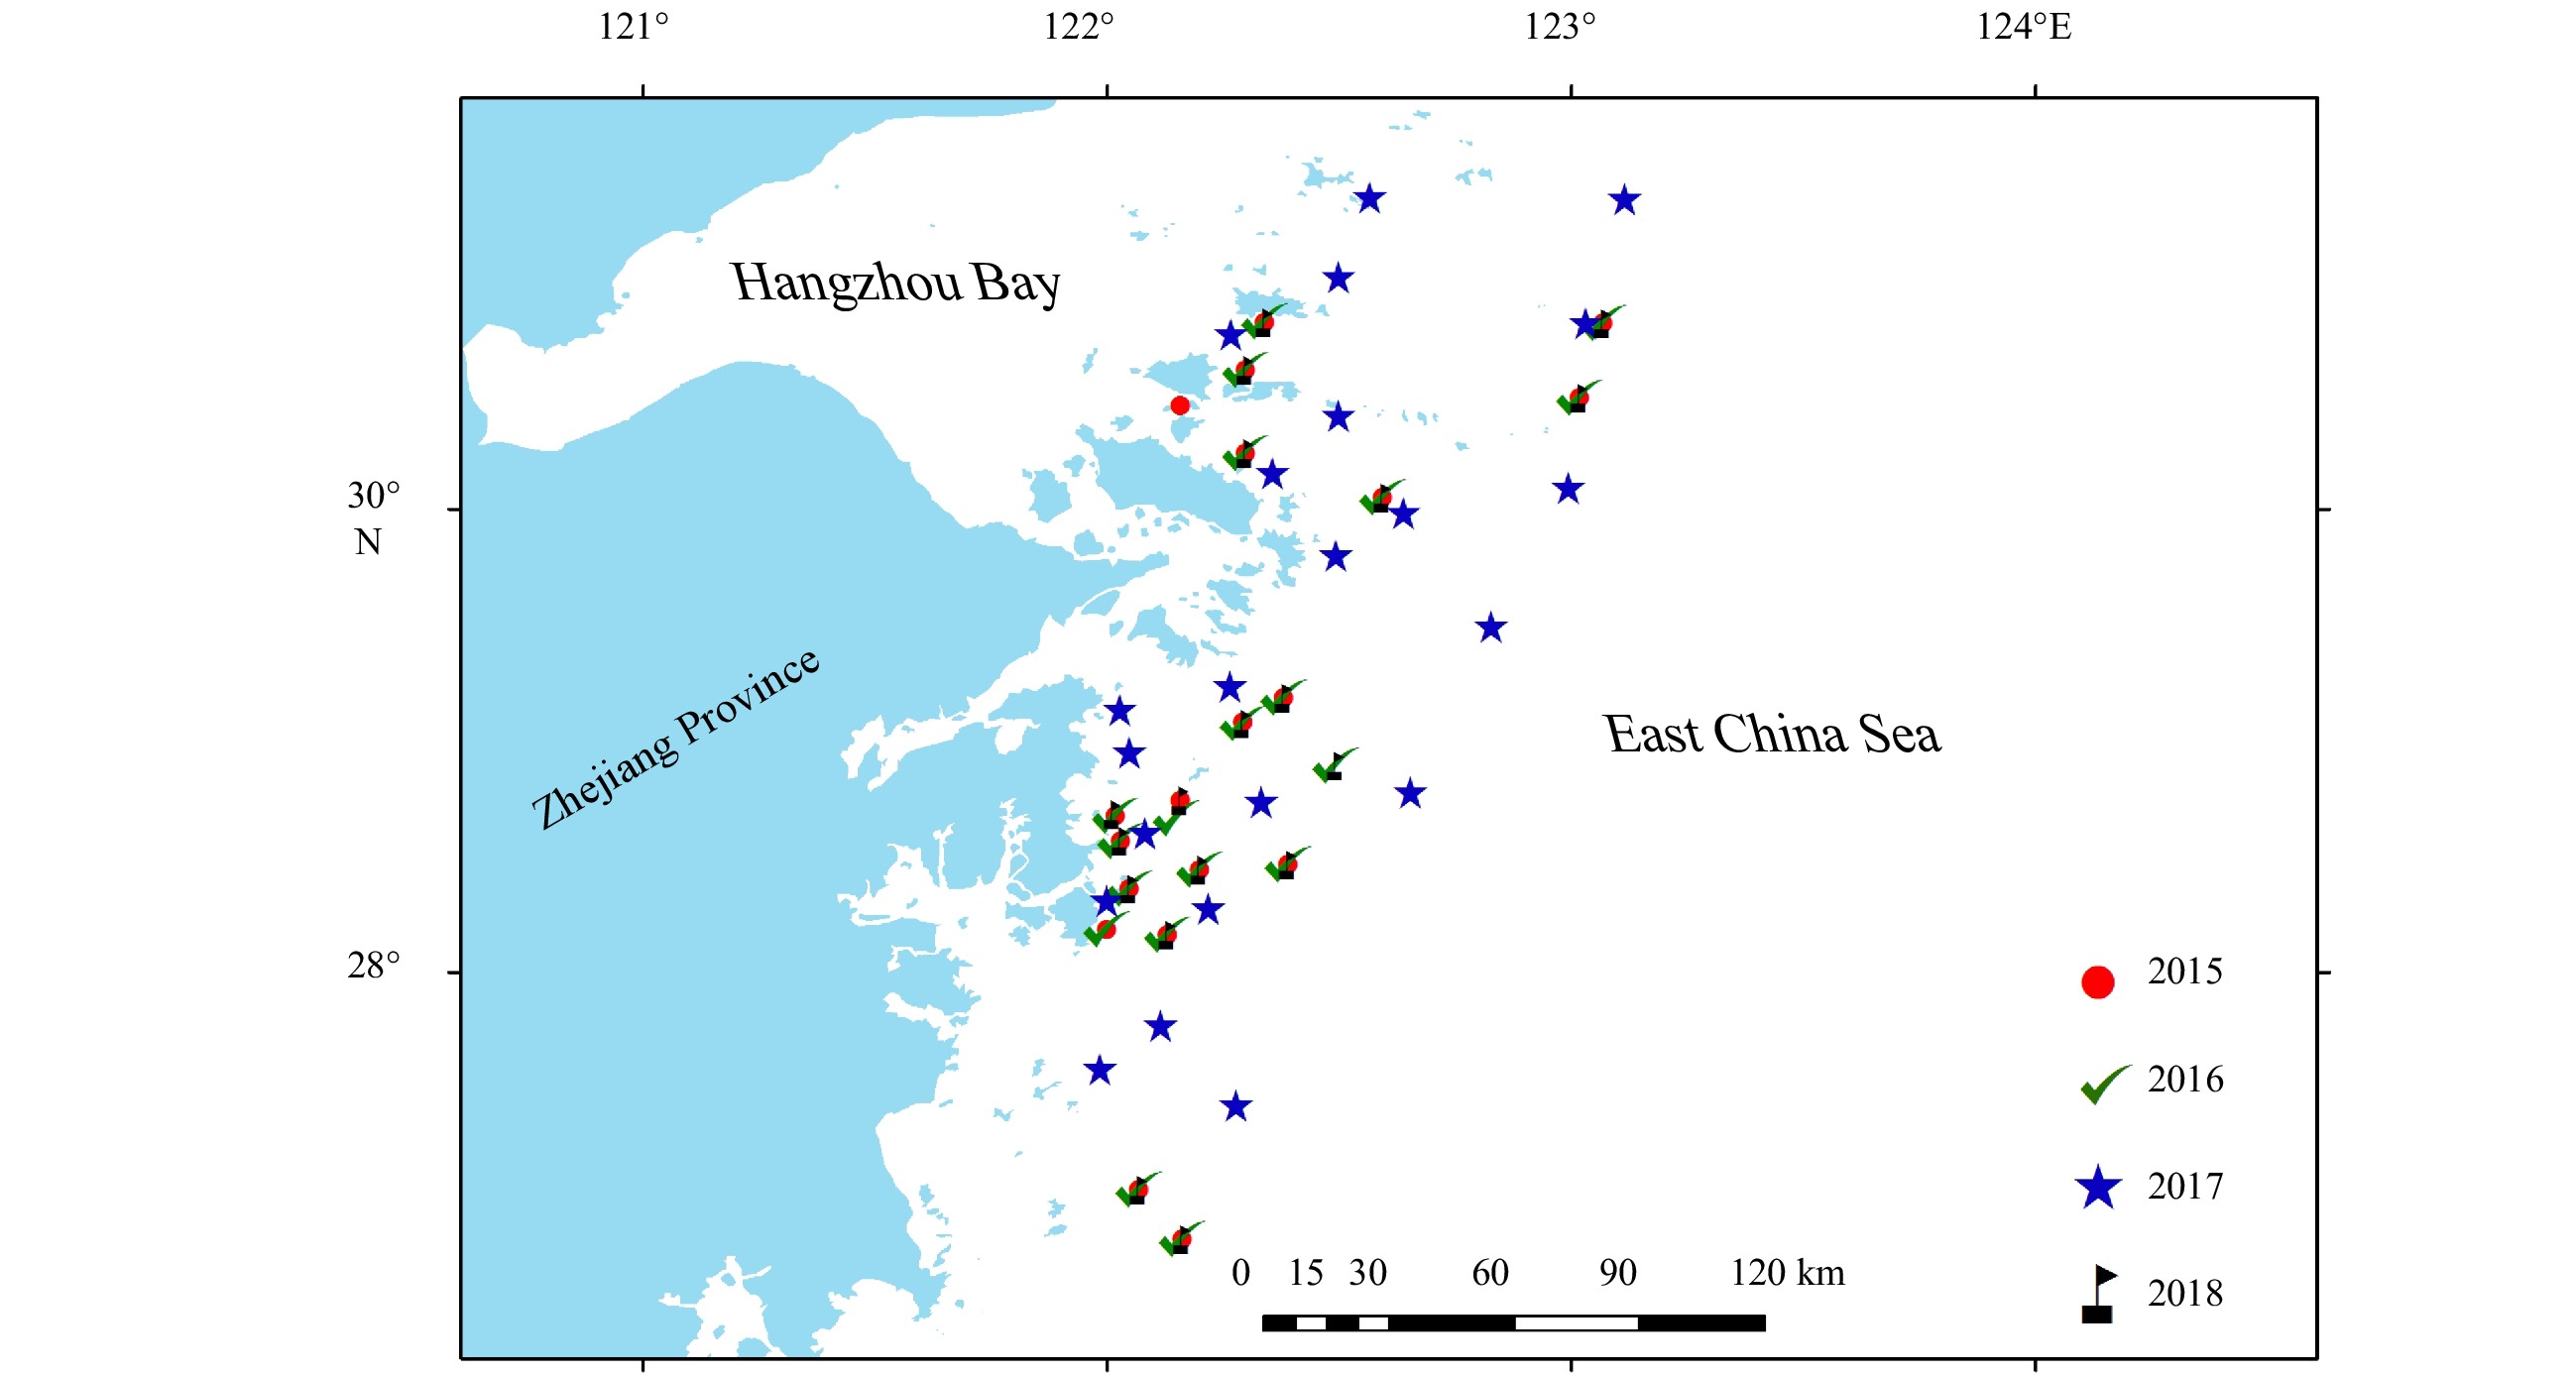
1.
Geographic positions of sampling sites from 2015 to 2018.
| Citation: | Ran Ye, Chunying Ge, Qiong Wang, Qing Xu, Guofeng Xu, Yongkang Yan, Mingli Qin, Yanhong Cai, Yuejun Fei. Ecological thresholds of phytoplankton community across environmental gradients in the harmful algal blooms-frequently-occurring, subtropical coastal waters, East China Sea[J]. Acta Oceanologica Sinica, 2021, 40(6): 100-110. doi: 10.1007/s13131-021-1782-6

|
Ecological thresholds can be defined as a point or zone of relatively abrupt change point occurs between alternate ecological conditions in relation to one or more ecological factors (Zhao et al., 2007; Baker and King, 2010). Identification of thresholds for ecological communities is of crucial importance since such change points pose practical applications upon eco-disaster pre-warning, natural resources conservation, and ecosystem balance. Many organisms, such as phytoplankton (Kovalenko et al., 2017; Taylor et al., 2018), zooplankton (Yang et al., 2018), fish (Milardi et al., 2018), macroinvertebrates (Sultana et al., 2019), and bacteria (Simonin et al., 2019) have been applied to research stressor-response patterns across environmental gradients, resulting in different ecological thresholds. However, selecting which ecological community to better indicate environmental changes in a certain ecoregion still remains controversy.
Algae, particularly phytoplankton, are the key primary producers in most aquatic ecosystems, supplying the essential energy for senior food chains. Phytoplankton is ubiquitously distributed in transitional, estuarine, and coastal environments and acting as carriers for nutrients fixation and transition in terms of biogeochemical cycling in these areas. As widely acknowledged, estuarine and coastal waters is susceptible to multiple environmental stresses (e.g., eutrophication, harmful algal blooms (HABs), and hypoxia) that mainly caused by human activities (Wang, 2006; Ye et al., 2017). Given the short generation times, marine phytoplankton species responses immediately and sensitively to environmental variations, especially to nutrient inputs derived from riverine discharge. This makes it suitable as an indicator to nutrient over-enrichment and being an early-warning signal of environmental changes in response to external pressures (McCormick and Cairns, 1994; Zhou et al., 2008; Jiang et al., 2014). Moreover, as a routine item of ecological monitoring, field observations and laboratory identifications of phytoplankton are cost-effective and easy (McCormick and Cairns, 1994). All these evidence that phytoplankton possesses excellent attributes for the indications of environmental changes and ecological successions.
The coastal waters of northern Zhejiang Province, a subtropical region that has experienced multiple stresses from anthropogenic perturbations for decades (Wang, 2006; Zhou et al., 2008; Jiang et al., 2014; Ye et al., 2017), is ceaselessly suffering a great deal of ecological problems. Large amounts of nutrient and organic matter loadings are transported into marine environments via terrestrial runoff, among which the Changjiang Diluted Water (CDW) has been recognized as the most critical source (Gao et al., 2012). Excessive nutrient inputs inevitably lead to severe eutrophication and subsequently facilitate frequent occurrences of HABs under certain circumstances, making coastal waters of northern Zhejiang Province as one of the most notable regions of HABs outbreaks in China (Wang and Wu, 2009; Liu et al., 2013; Zeng et al., 2019; Wang et al., 2019). In addition, the complex hydrological and hydrodynamic conditions, especially in wet seasons (Zhou et al., 2017a), also enable this region to be substantially affected by the complicated environmental changes. Hence, the coastal waters of northern Zhejiang Province seems to become an ideal region to study ecological thresholds of phytoplankton community in response to environmental changes.
Recent publications have documented various ecological thresholds of phytoplankton communities along environmental gradients. Most of them focused on freshwater ecosystems, such as stream (Smucker et al., 2013; Taylor et al., 2018), river (Porter-Goff et al., 2013), reservoir (Tang et al., 2016), wetland (Mazzei and Gaiser, 2018), and lake (Cao et al., 2016; Kovalenko et al., 2017), little knowledge is known in coastal marine environment. Therefore, this study aims to figure out: (1) the thresholds of phytoplankton community responses to environmental gradients; (2) the thresholds of individual species responses to environmental gradients; and (3) seasonal community responses of ecological thresholds between spring and summer.
Field investigations were conducted twice a year (in May and August) from 2015 to 2018, including 19 sites in 2015, 20 sites in 2016, 22 sites in 2017, and 18 sites in 2018, respectively. Due to the adjusted sampling strategy, monitoring networks differed annually despite seasonal sampling sites remained the same within each year in terms of numbers and geographic positions (Fig. 1).
Samples for physicochemical parameters were collected by a CTD system (Seabird 19 Plus, USA) through water collectors fixed on it at different layers based on water depth of each site (AQSIQ and Standardization Administration of China, 2008a). Water temperature (WT), water clarity (secchi depth, SD), salinity (Sal), pH, nitrate (
Phytoplankton samples were collected from bottom to surface using plankton net with a 77 μm mesh size and preserved with 5% formalin. After at least 24 h of sedimentation, samples were concentrated to 100–150 mL and then, 0.5 mL sample was uniformly siphoned onto the counting plate for counting and identification through light microscopy (Olympus bx41, Japan). Samples were identified into species level at which an accurate identification could be confirmed. All the analyses were carried out according to the standard methods (AQSIQ and Standardization Administration of China, 2008c).
This study used Kruskal-Wallis tests to examine seasonal differences for environmental parameters. Species data were lg (x+1) transformed prior to community data analysis. To visualize seasonal dissimilarity of phytoplankton community composition, Principal Coordinate Analysis (PCoA) was employed using Bray-Curtis dissimilarity matrices. Analysis of Similarity (ANOSIM) was thereafter applied to evaluate the significant differences between the two seasons. Relationship between phytoplankton community and environmental viarbles was conducted via Redundancy Analysis (RDA).
Once the most significant environmental factors were selected, Threshold Indicator Taxa Analysis (TITAN) (Baker and King, 2010) was then performed to identifiy ecological thresholds at the commnity and individual level along enviromnemtal gradients, respectively. This approach integrates indicator species analysis (Dufrêne and Legendre, 1997) with nonparametric change-point analysis (King and Richardson, 2003; Qian et al., 2003) to determine indicator species scores across binary partitions of samples for detecting congruence in taxon-specific changes of abundance and occurrence frequency across environmental gradients as evidences of ecological thresholds (Baker and King, 2010, 2013; King and Baker, 2010). After positive taxa (z+) and negative taxa (z–) are identified, bootstapping is used to assess the purity and reliability of each species. Two key parameters are employed to estimate whether an indicator species is statistically reliable. Purity is the mean proportion correct taxa direction (z– or z+) assignment, reliability is the mean proportion of P<0.05. Only species that characterized with purity≥0.95 and reliability≥0.95 will be defined as reliable indicator species. Species data used in TITAN were lg (x+1) transformed and only species with≥3 occurrences were included (Baker and King, 2010).
All the analyses were performed in R 3.3.1 (R Development Core Team, 2016), with package“vegan” (Oksanen et al., 2010) for PCoA, ANOSIM, and RDA and package “TITAN2” (Baker and King, 2010) for TITAN.
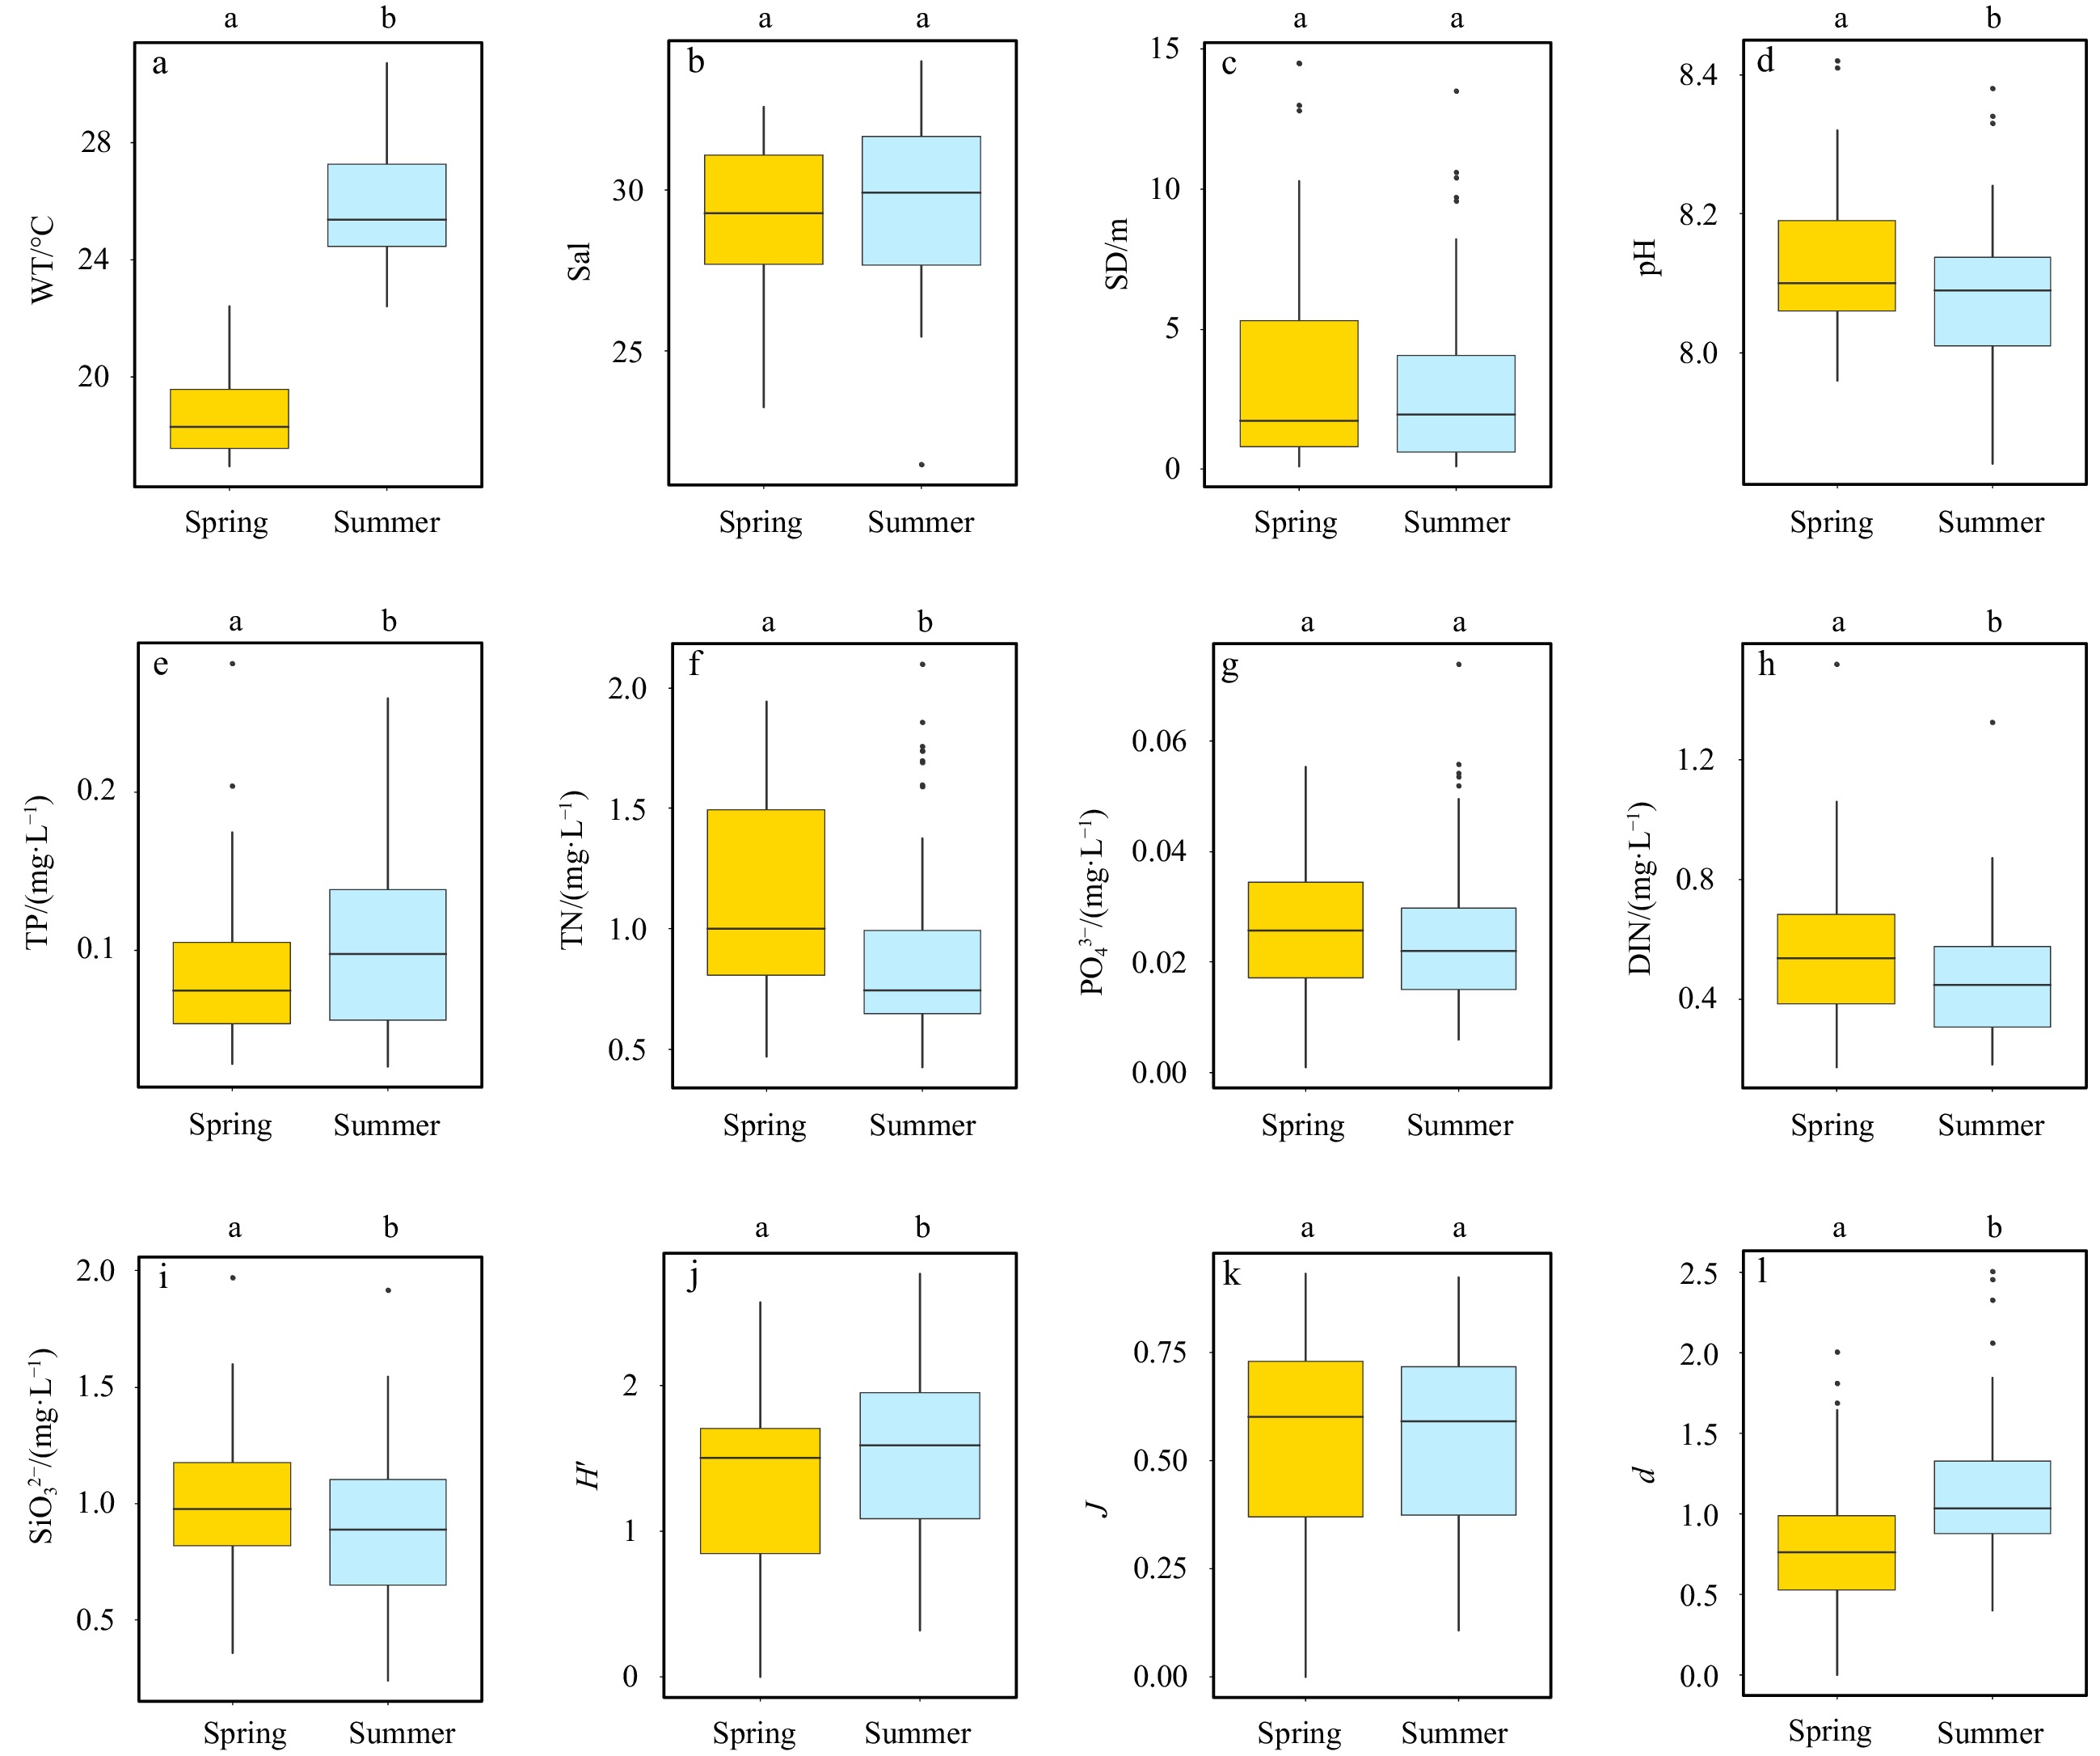
As predicted by seasonal patterns, WT ranged from 16.94°C to 22.40°C and 22.40°C to 30.70°C in spring and summer, respectively; Sal varied from 23.25 to 32.58 and 21.48 to 33.99 in spring and summer, respectively; pH ranged from 7.96 to 8.42 and 7.84 to 8.38 in the two seasons, separately. For nutrients, concentrations of TP were detected from 0.028 5 mg/L to 0.281 3 mg/L (mean=0.083 0 mg/L) and 0.026 4 mg/L to 0.259 5 mg/L (mean=0.102 4 mg/L) during spring and summer periods, respectively, while TN were measured from 0.469 mg/L to 1.943 mg/L (mean=1.103 mg/L) and 0.423 mg/L to 2.100 mg/L (mean=0.883 mg/L) in spring and summer, respectively (Table 1). Characteristics of other parameters were also displayed in Table 1.
| Spring | Summer | ||||||||
| Minimum | Median | Mean | Maximum | Minimum | Median | Mean | Maximum | ||
| WT/°C | 16.94 | 18.29 | 18.71 | 22.40 | 22.40 | 25.35 | 25.90 | 30.70 | |
| Sal | 23.25 | 29.27 | 29.31 | 32.58 | 21.48 | 29.91 | 29.68 | 33.99 | |
| SD/m | 0.1 | 1.75 | 3.21 | 14.5 | 0.1 | 2.0 | 2.9 | 13.5 | |
| pH | 7.96 | 8.10 | 8.13 | 8.42 | 7.84 | 8.09 | 8.07 | 8.38 | |
| TP/(mg·L−1) | 0.0285 | 0.0748 | 0.0830 | 0.2813 | 0.0264 | 0.0976 | 0.1024 | 0.2595 | |
| TN/(mg·L−1) | 0.469 | 0.999 | 1.103 | 1.943 | 0.423 | 0.742 | 0.883 | 2.100 | |
| ${\rm {PO}}_4^{3-} $/(mg·L−1) | 0.0009 | 0.0258 | 0.0256 | 0.0554 | 0.0059 | 0.0220 | 0.0247 | 0.0740 | |
| DIN/(mg·L−1) | 0.172 | 0.538 | 0.555 | 1.520 | 0.183 | 0.447 | 0.465 | 1.327 | |
| ${\rm {SiO}}_3^{2-} $/(mg·L−1) | 0.358 | 0.976 | 1.000 | 1.970 | 0.239 | 0.887 | 0.898 | 1.918 | |
| H′ | 0 | 1.50 | 1.28 | 2.58 | 0.32 | 1.59 | 1.51 | 2.77 | |
| J | 0 | 0.60 | 0.54 | 0.93 | 0.11 | 0.59 | 0.54 | 0.92 | |
| d | 0 | 0.76 | 0.82 | 2.01 | 0.40 | 1.04 | 1.15 | 2.51 | |
| Note: WT, water temperature; Sal, salinity; SD, secchi depth; TP, total phosphorus; TN, total nitrogen; ${\rm {PO}}_4^{3-} $, phosphate concentration; DIN, dissolved inorganic nitrogen concentration; ${\rm {SiO}}_3^{2-} $, silicate concentration; H′, Shannon-Weiner diversity index; J, Pielou evenness index; d, Margalef richness index. | |||||||||
 DownLoad:
CSV
DownLoad:
CSV
Overall, WT (Fig. A1a), pH (Fig. A1d) and nutrients (Figs A1e–f, h–i), except for

In general, a total of 130 species belonging to 5 phyla (Bacillariophyta, Pyrrophyta, Chlorophyta, Chrysophyta and Cyanophyta) were recorded in the two seasons; and 77 species of 36 genera and 101 species of 72 genera were detected in spring and summer, respectively. Noctiluca scintillans (41.5%) was identified as the most abundant species for the former and Pseudo-nitzschia pungens (41.2%) for the latter.
Regarding the α-diversity, Shannon-Weiner diversity index (H’), Pielou evenness index (J) and Margalef richness index (d) varied from 0 to 2.58, 0 to 0.93 and 0 to 2.01, respectively in spring. Meanwhile, they maintained round at 1.51, 0.54 and 1.15 during summertime (Table 1). Marked seasonal dissimilarities of H’ and d were observed (Figs A1j, l), whereas J demonstrated little temporal variations (Fig. A1k).
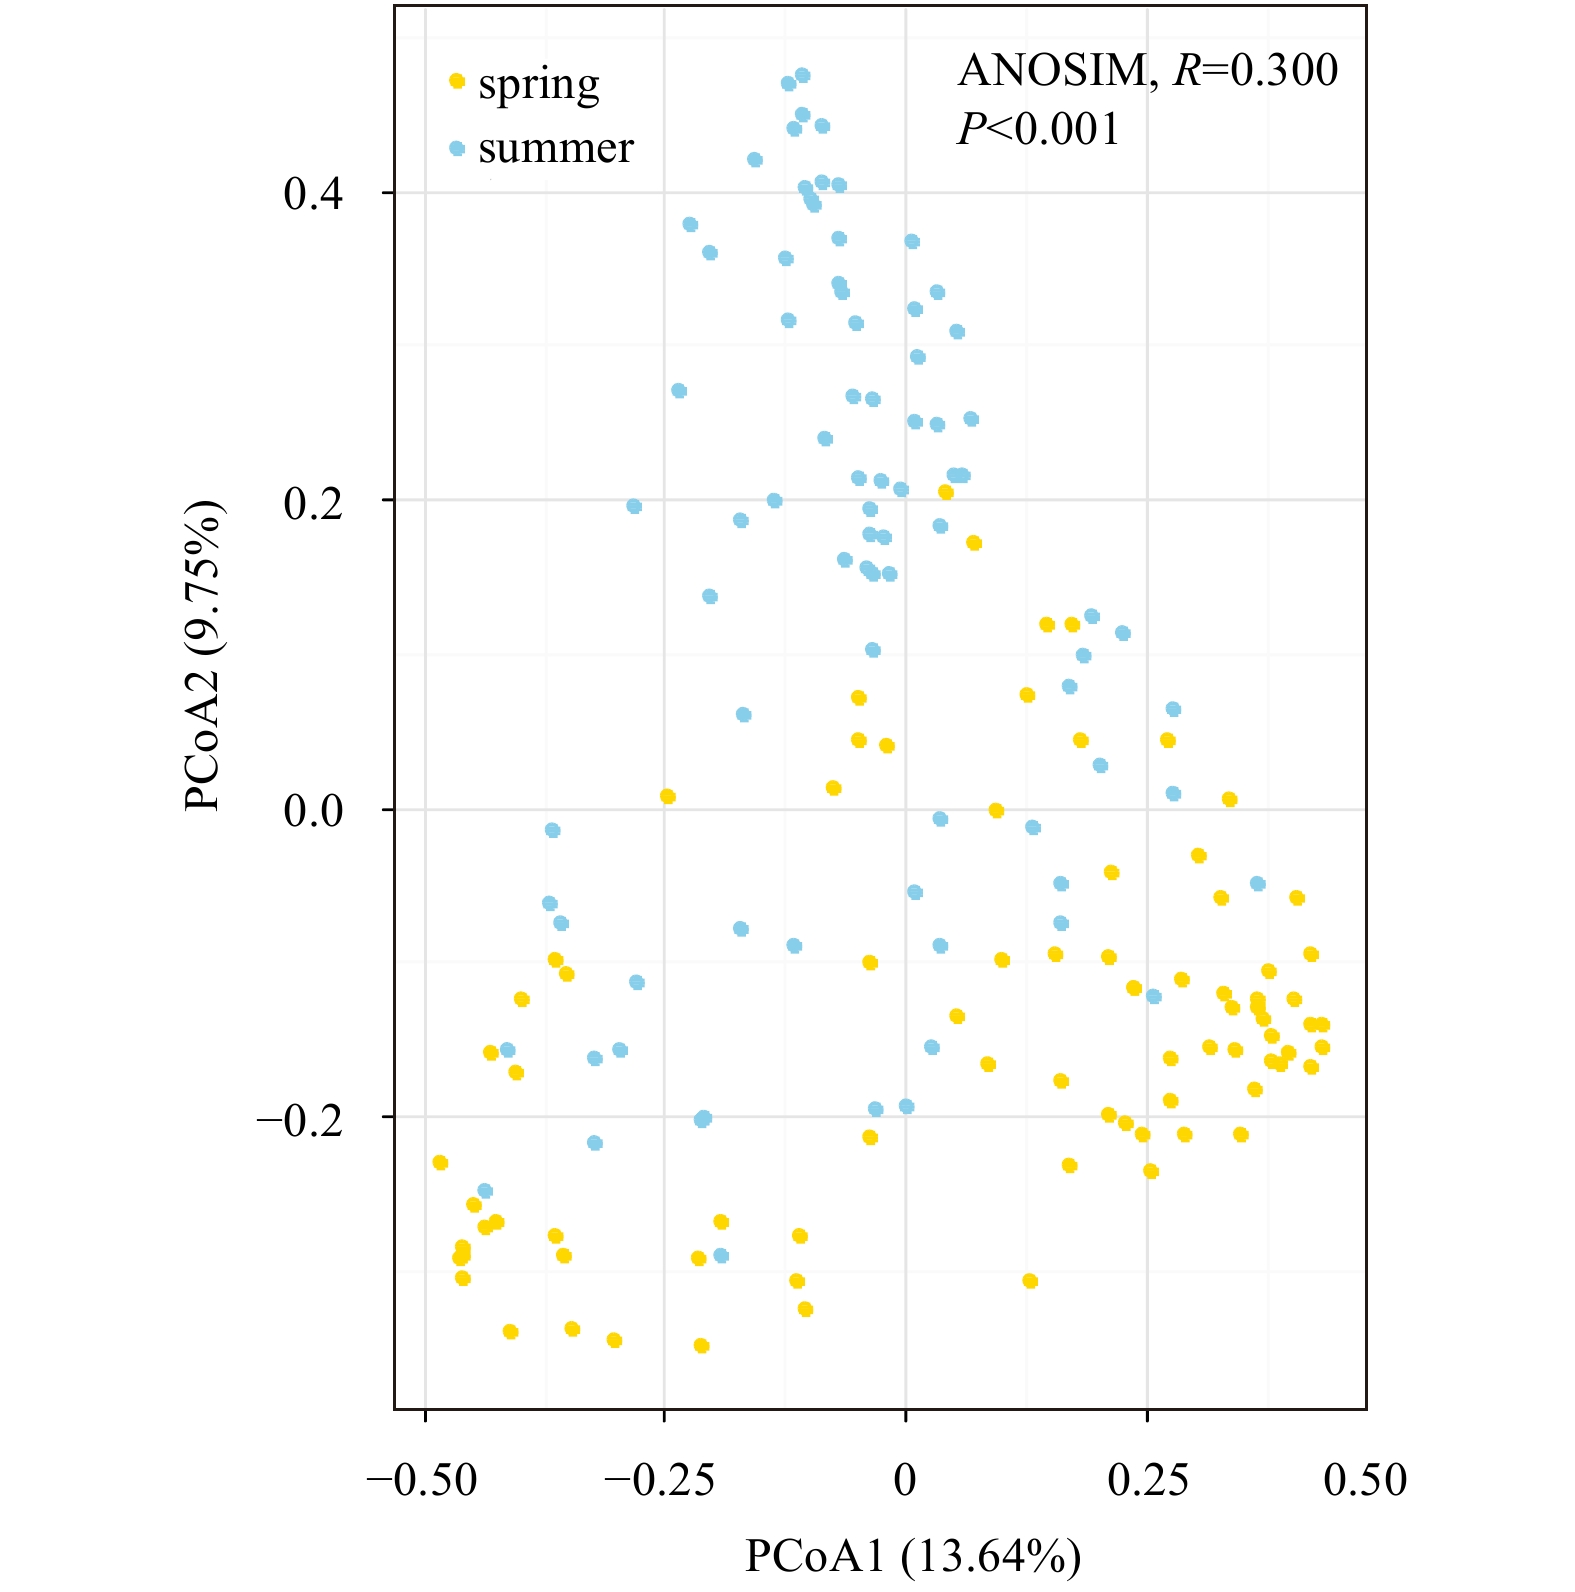
A relative strong seasonal dissimilarity of phytoplankton community was discovered via PCoA plot (Fig. 2, ANOSIM test, R=0.300, p<0.001), indicating a season-to-season separation was acceptable across the study area.

RDA showed that significant factors explained 9.3% of the total variation and TN, pH and TP were the driving factors controlling phytoplankton community in spring. There was 15.6% of the total variation which was explained by six remarkable parameters, namely WT, TN, TP, Sal,
| Season | Significant variables | R2 | Cumulated R2 | Adjusted cumulated R2 | F-test | P |
| Spring | TN | 0.057 | 0.057 | 0.045 | 4.824 | 0.002 |
| pH | 0.039 | 0.096 | 0.073 | 3.434 | 0.012 | |
| TP | 0.030 | 0.127 | 0.093 | 2.718 | 0.032 | |
| Summer | WT | 0.050 | 0.050 | 0.038 | 4.171 | <0.001 |
| TN | 0.048 | 0.097 | 0.074 | 4.182 | <0.001 | |
| TP | 0.047 | 0.144 | 0.111 | 4.260 | <0.001 | |
| Sal | 0.027 | 0.172 | 0.128 | 2.551 | 0.015 | |
| ${\rm {SiO}}_3^{2-} $ | 0.026 | 0.198 | 0.145 | 2.468 | 0.015 | |
| pH | 0.021 | 0.219 | 0.156 | 2.029 | 0.037 | |
| Note: WT, water temperature; Sal, salinity; TP, total phosphorus; TN, total nitrogen; ${\rm {SiO}}_3^{2-} $, silicate concentration. | ||||||
DownLoad:
CSV
TITAN revealed that in spring, pH fluctuated drastically between 8.00 and 8.28 (Fig. 3a) resulting in the negative response threshold of 8.03 and positive response threshold of 8.25, respectively (Table 3). TN declined between 0.9 mg/L and 1.3 mg/L and increased intensively from 0.7 mg/L to 1.4 mg/L (Fig. 3b), leading to 0.966 mg/L and 1.553 mg/L as thresholds of negative and positive taxa, respectively (Table 3). Meanwhile, the thresholds of TP were 0.0433 mg/L and 0.0987 mg/L for negative and positive responders, separately (Table 3 and Fig. 3c).

| Season | Environmental gradient | Responder | Threshold |
| Spring | pH | z– | 8.03 |
| z+ | 8.25 | ||
| TN (mg·L–1) | z– | 0.966 | |
| z+ | 1.553 | ||
| TP/(mg·L–1) | z– | 0.043 3 | |
| z+ | 0.098 7 | ||
| Summer | pH | z– | 7.98 |
| z+ | 8.12 | ||
| TN/(mg·L–1) | z– | 0.706 | |
| z+ | 1.008 | ||
| TP/(mg·L–1) | z– | 0.035 5 | |
| z+ | 0.146 4 | ||
| Note: Responder meant taxa that either negatively (z–) or positively (z+) responded to environmental gradients. | |||
DownLoad:
CSV
During summertime, pH decreased sharply between 8.0 and 8.2 and increased drastically from 7.9 to 8.05 (Fig. 3d), which provided the thresholds of 7.98 and 8.12 for negative taxa and positive taxa, respectively (Table 3). For nutrients, the thresholds of TN were 0.706 mg/L and 1.008 mg/L for negative taxa and positive taxa, respectively (Table 3 and Fig. 3e) while thresholds of TP occurred at 0.035 5 mg/L and 0.146 4 mg/L (Table 3) for negative taxa and positive taxa, separately (Fig. 3f).
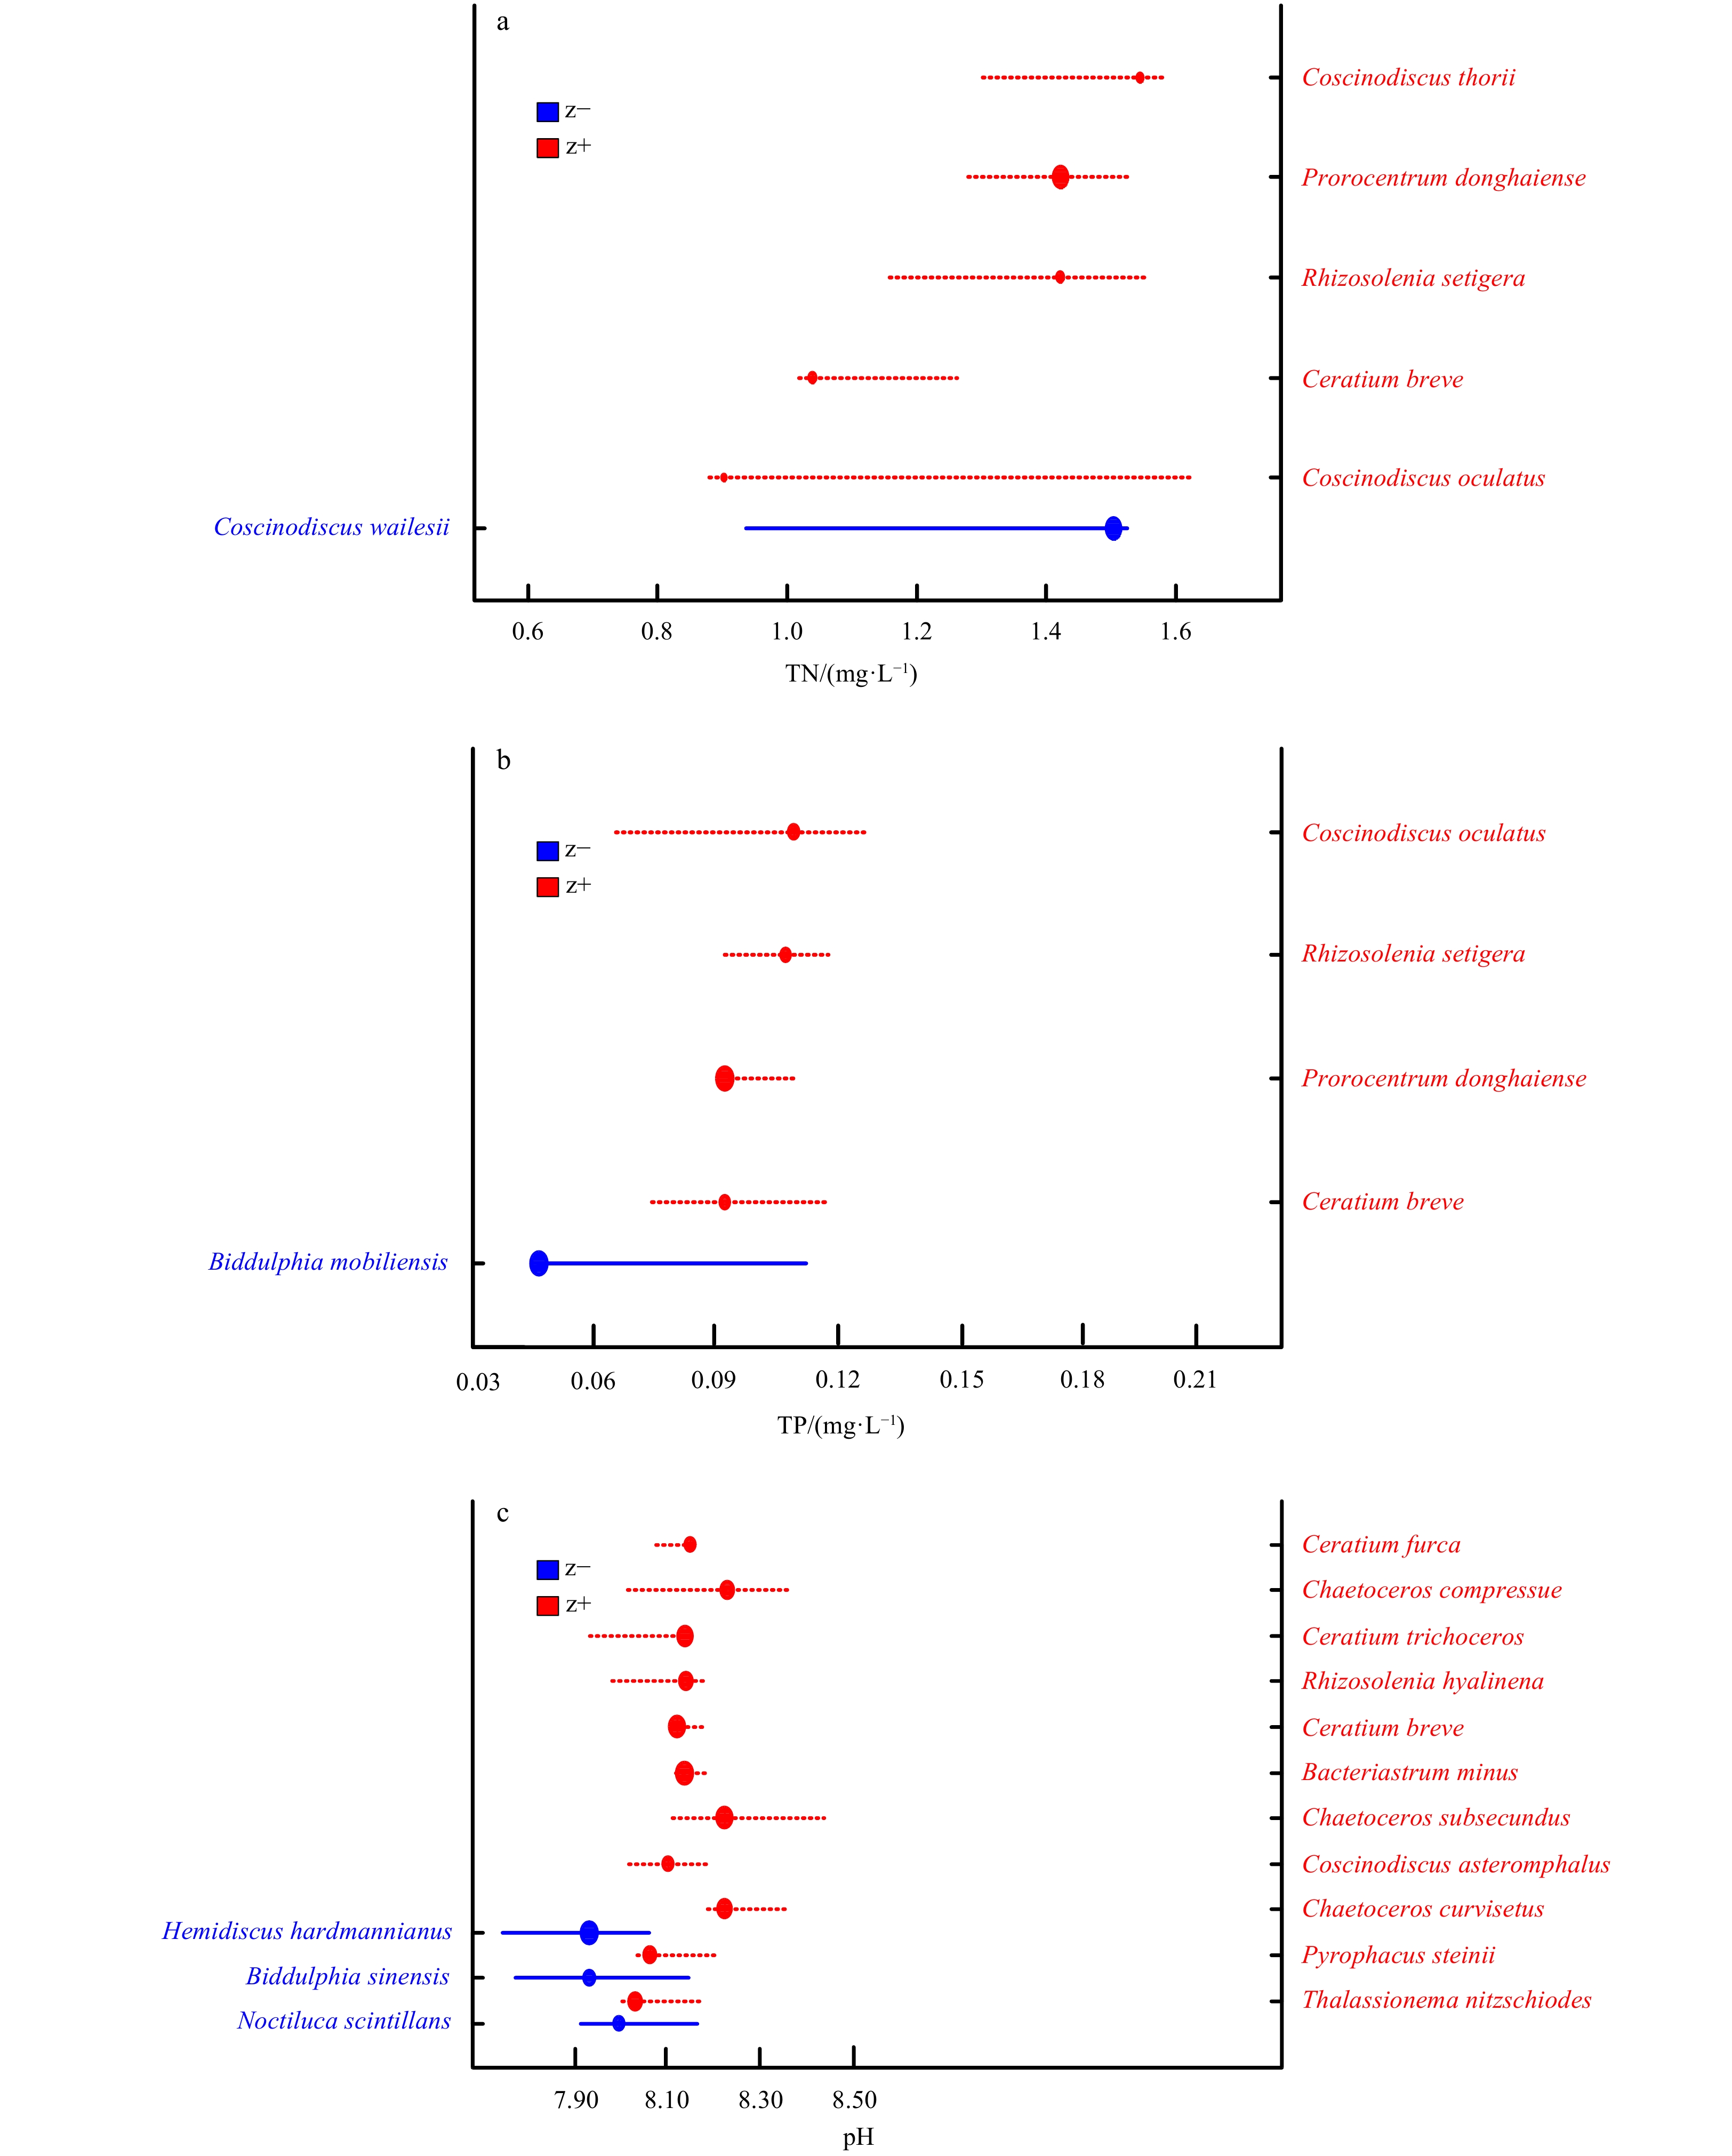
In spring, this study identified 3, 5 and 4 reliable taxa as tolerant indicator taxa along pH, TN and TP gradient. Prorocentrum donghaiense was repeatedly observed and intensively responding to the increasing environmental parameters (Table A1, Figs 4a and b). Meanwhile, only one reliable species was detected as sensitive indicator species in response to both TN and TP, respectively (Table A1, Figs 4a and b), whereas no sensitive responder was found in relation to pH.
| Season | Taxon | Environmental gradient | Threshold | Direction | Purity | Reliability |
| Spring | Prorocentrum donghaiense | pH | 8.22 | z+ | 1.000 | 0.996 |
| Rhizosolenia setigera | 8.28 | z+ | 0.988 | 0.976 | ||
| Ceratium fusus | 8.22 | z+ | 1.000 | 1.000 | ||
| Prorocentrum donghaiense | TN/(mg·L−1) | 1.519 | z+ | 1.000 | 1.000 | |
| Rhizosolenia setigera | 1.423 | z+ | 0.994 | 0.982 | ||
| Ceratium breve | 1.040 | z+ | 0.998 | 0.994 | ||
| Coscinodiscus oculatus | 1.602 | z+ | 1.000 | 0.988 | ||
| Coscinodiscus thorii | 1.545 | z+ | 0.980 | 0.984 | ||
| Coscinodiscus wailesii | 1.504 | z– | 0.982 | 0.978 | ||
| Prorocentrum donghaiense | TP/(mg·L−1) | 0.0975 | z+ | 1.000 | 1.000 | |
| Rhizosolenia setigera | 0.1008 | z+ | 0.976 | 0.956 | ||
| Ceratium breve | 0.0987 | z+ | 0.996 | 0.994 | ||
| Biddulphia mobiliensis | 0.0433 | z– | 1.000 | 0.972 | ||
| Coscinodiscus oculatus | 0.1056 | z+ | 1.000 | 0.976 | ||
| Summer | Noctiluca scintillans | pH | 7.99 | z– | 0.994 | 0.998 |
| Hemidiscus hardmannianus | 7.90 | z– | 1.000 | 0.986 | ||
| Biddulphia sinensis | 7.90 | z– | 0.990 | 0.986 | ||
| Chaetoceros curvisetus | 8.22 | z+ | 0.994 | 0.994 | ||
| Thalassionema nitzschiodes | 8.04 | z+ | 1.000 | 0.998 | ||
| Ceratium furca | 8.15 | z+ | 0.978 | 1.000 | ||
| Ceratium breve | 8.12 | z+ | 0.986 | 1.000 | ||
| Ceratium trichoceros | 8.14 | z+ | 1.000 | 1.000 | ||
| Coscinodiscus asteromphalus | 8.11 | z+ | 0.994 | 0.992 | ||
| Chaetoceros subsecundus | 8.22 | z+ | 1.000 | 0.998 | ||
| Chaetoceros compressue | 8.22 | z+ | 1.000 | 0.986 | ||
| Rhizosolenia hyalinena | 8.14 | z+ | 1.000 | 0.960 | ||
| Bacteriastrum minus | 8.14 | z+ | 0.996 | 0.988 | ||
| Pyrophacus steinii | 8.08 | z+ | 1.000 | 0.988 | ||
| Noctiluca scintillans | TN/(mg·L−1) | 1.595 | z– | 0.988 | 0.992 | |
| Thalassiothrix frauenfeldii | 1.243 | z– | 0.968 | 0.960 | ||
| Ceratium furca | 0.684 | z– | 0.988 | 0.982 | ||
| Rhizosolenia alata f. gracillima | 0.564 | z– | 0.998 | 0.970 | ||
| Ceratium tripos | 0.634 | z– | 1.000 | 1.000 | ||
| Coscinodiscus radiatus | 0.586 | z– | 0.998 | 0.986 | ||
| Pyrophacus horologicum | 0.993 | z– | 0.990 | 0.990 | ||
| Schroederella delicatula | 0.909 | z+ | 1.000 | 0.998 | ||
| Skeletonema costatum | 0.909 | z+ | 0.976 | 0.964 | ||
| Hemidiscus hardmannianus | 0.816 | z+ | 1.000 | 1.000 | ||
| Thalassionema nitzschiodes | 1.075 | z+ | 0.994 | 0.996 | ||
| Protoperidinium depressum | 0.767 | z+ | 0.982 | 0.996 | ||
| Ditylum brightwellii | 1.645 | z+ | 0.988 | 0.992 | ||
| Ceratium trichoceros | 1.720 | z+ | 0.958 | 0.984 | ||
| Coscinodiscus bipartitus | 1.090 | z+ | 1.000 | 1.000 | ||
| Coscinodiscus centralis | 1.164 | z+ | 1.000 | 0.992 | ||
| Protoperidinium pentagonum | 1.483 | z+ | 1.000 | 0.994 | ||
| Pyrophacus steinii | 1.720 | z+ | 1.000 | 1.000 | ||
| Streptotheca thamesis | 1.720 | z+ | 1.000 | 1.000 | ||
| Rhizosolenia calcar–avis | TP/(mg·L−1) | 0.0334 | z– | 1.000 | 1.000 | |
| Protoperidinium pentagonum | 0.1129 | z– | 0.998 | 0.964 | ||
| Pyrophacus steinii | 0.0355 | z– | 1.000 | 0.976 | ||
| Thalassiothrix frauenfeldii | 0.1464 | z+ | 0.994 | 1.000 | ||
| Ceratium furca | 0.1260 | z+ | 0.998 | 1.000 | ||
| Ceratium tripos | 0.1260 | z+ | 0.998 | 1.000 | ||
| Note: Direction meant taxa that either negatively (z–) or positively (z+) responded to environmental gradients. Purity was the mean proportion correct taxa direction (z– or z+) assignment, reliability was the mean proportion of P<0.05. TP, total phosphorus; TN, total nitrogen. | ||||||
DownLoad:
CSV


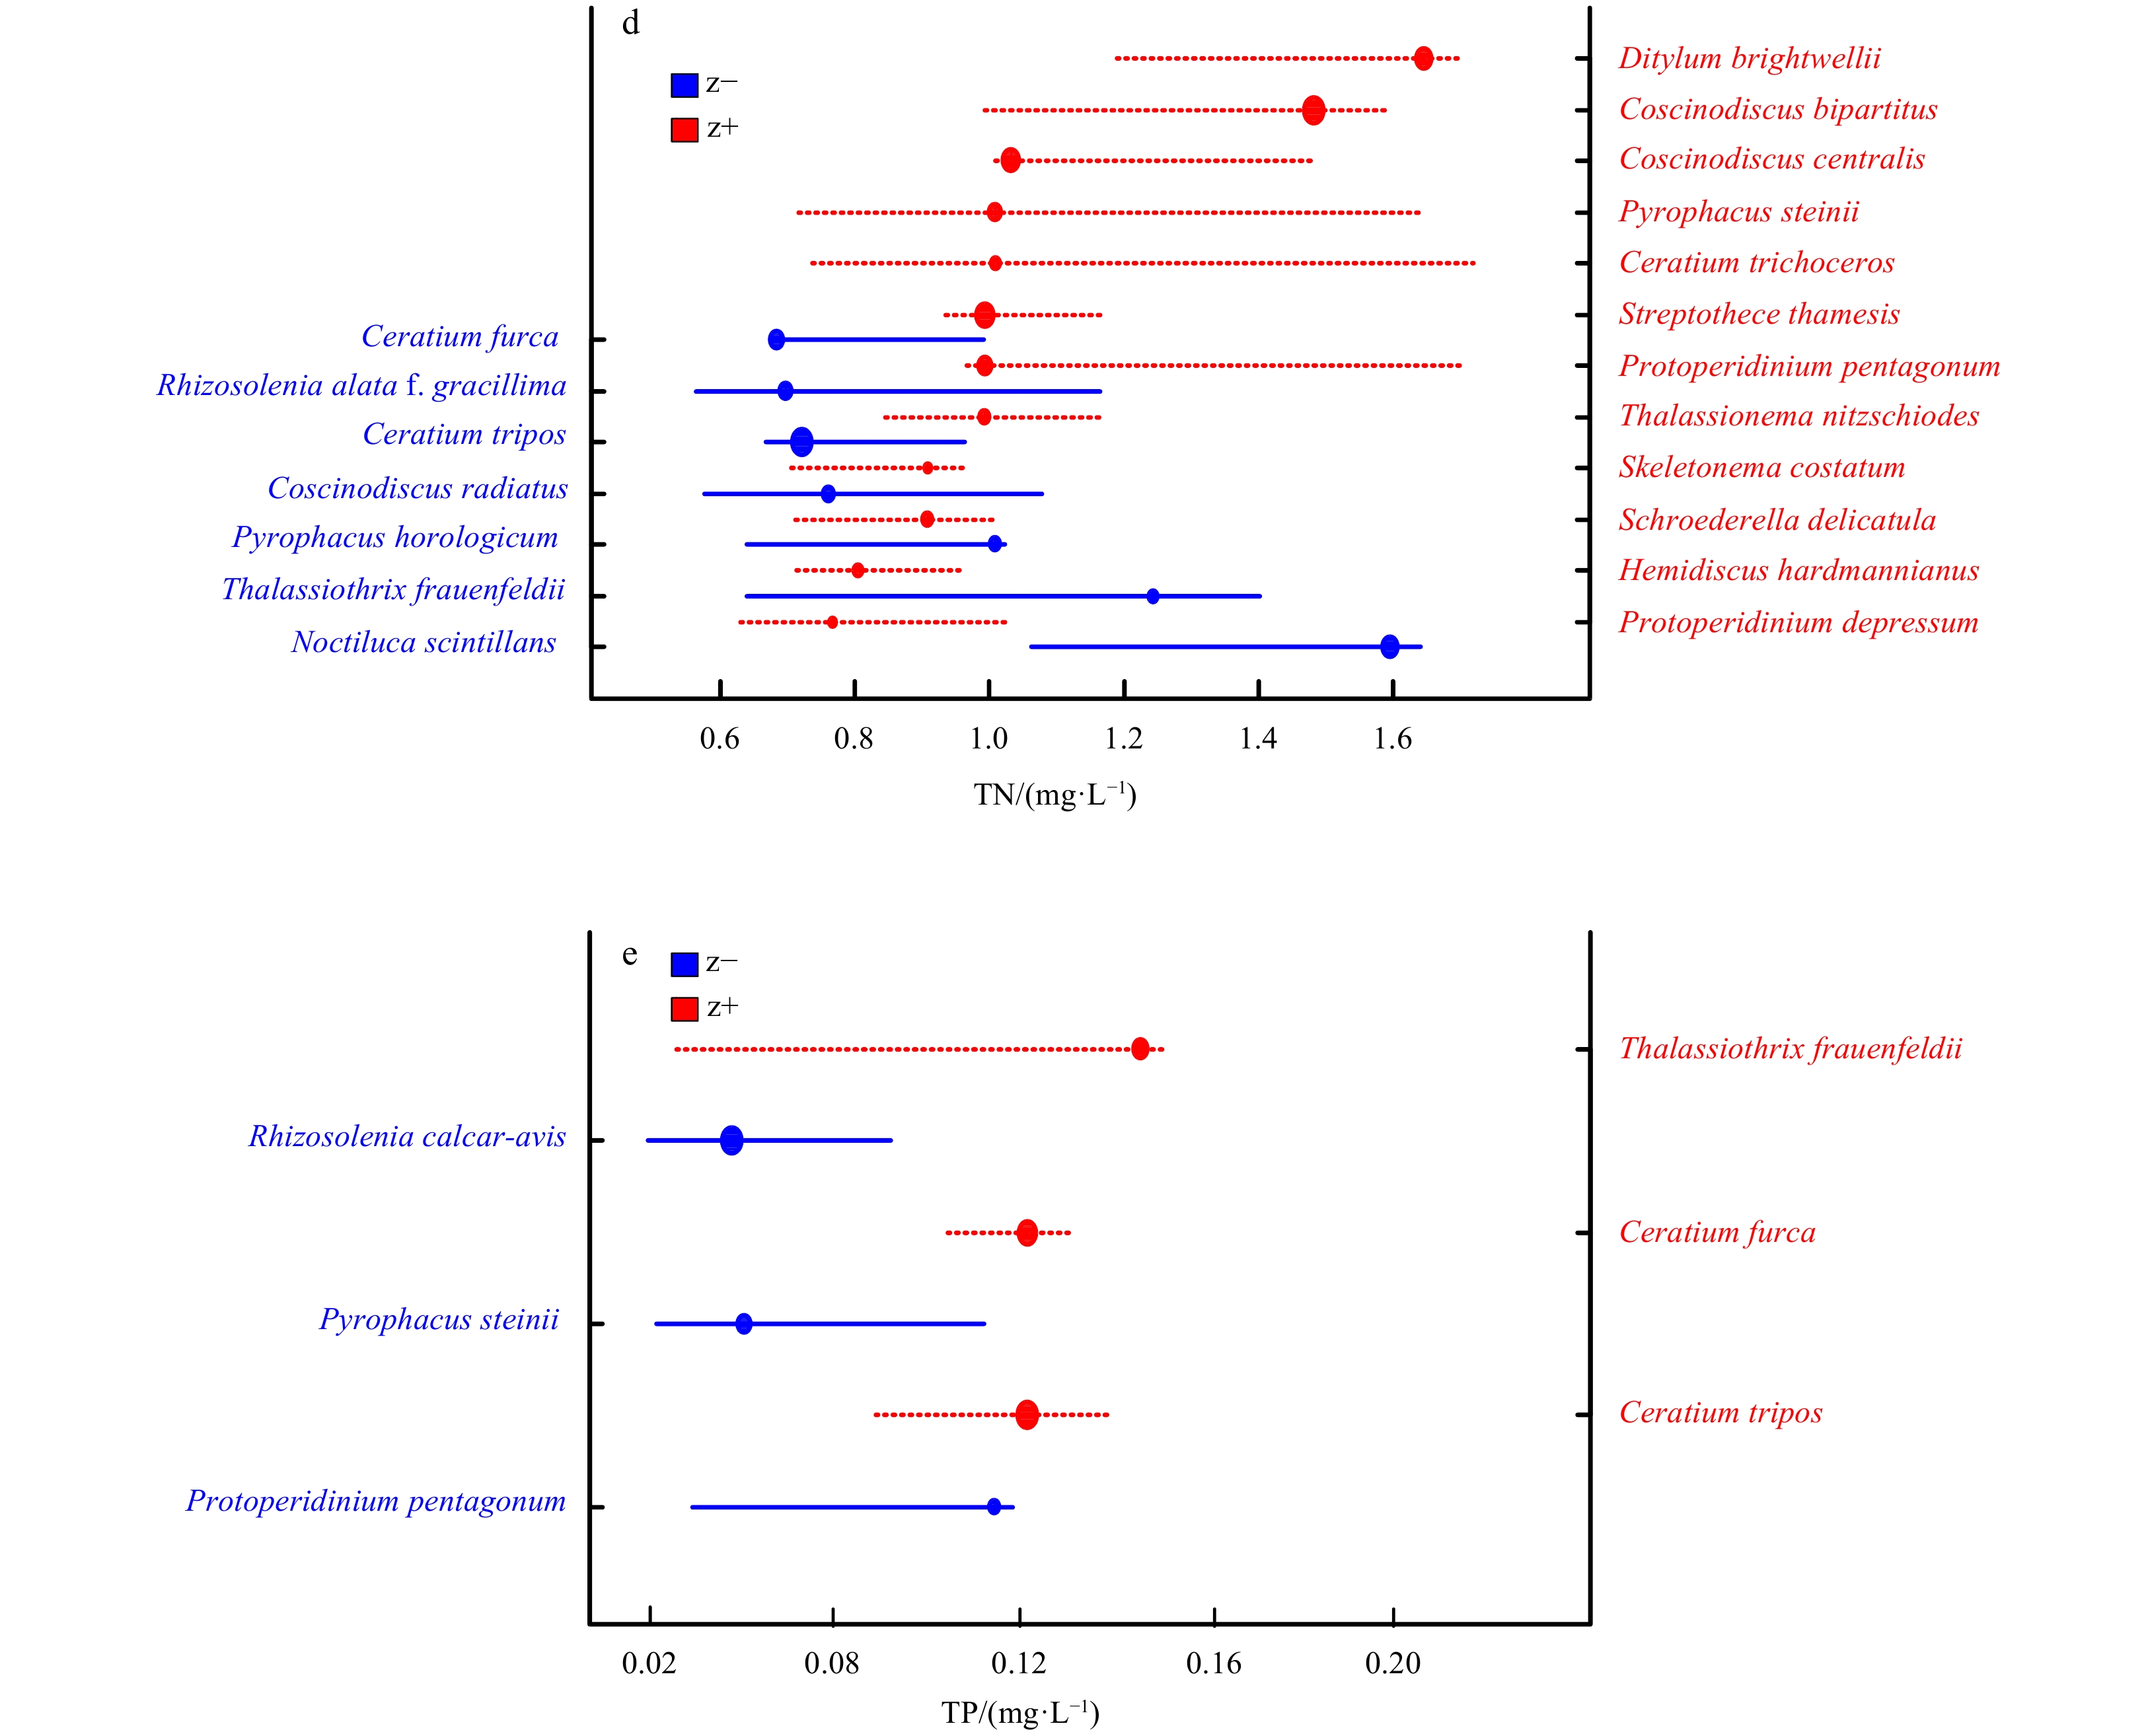
In summer, more indicator taxa were detected in response to environmental gradients, of which 11, 12 and 3 reliable taxa were recorded as tolerant indicator taxa that increased with pH value and TN, TP concentrations. In contrast, only 3, 7 and 3 reliable taxa were recorded as sensitive indicator taxa that declined with increasing pH value and TN, TP concentrations (Table A1, Figs 4c-e). Noctiluca scintillans occurred frequently as negative responder across pH and TN gradients (Figs 4c and d). Moreover, Ceratium spp., Chaetoceros spp. corresponded positively to pH; Skeletonema costatum, Coscinodiscus spp. and Ceratium spp. responded positively to TN and TP, respectively (Figs 4d and e).
Identifying thresholds for ecological communities are of great importance for ecological application and management (Townsend et al., 2008; Martin and Kirkman, 2009). In this study, TITAN revealed that phytoplankton community in the coastal waters of northern Zhejiang Province, East China Sea substantially responded to TN, TP and pH gradients in a nonlinear way (Fig. 3), suggesting the existence of complex stressor-response patterns. Both negative (z–) and positive (z+) thresholds were identified in the two seasons (Table 3). Previous studies have also recorded the thresholds of phytoplankton community across multiple environmental gradients (Smucker et al., 2013; Cao et al., 2016; Taylor et al., 2018). Tang et al. (2016) suggested that thresholds of epilithic diatom assemblages in responses to TN and TP in the Three Gorges Reservoir were 0.382 mg/L (z–), 1.298 mg/L (z+) and 0.0160 mg/L (z–), 0.0650 mg/L (z+) in spring, respectively. Results of Mazzei and Gaiser (2018) documented thresholds of diatom assemblages in response to TP gradient were 0.0487 mg/L (z–) and 0.2650 mg/L (z+), 0.0453 mg/L (z–) and 0.3648 mg/L (z+) in spring and summer, respectively. In the Laurentian Great Lakes, USA, phytoplankton community change-points along
Indicator taxa can be utilized to monitor and predict environmental variations in coastal waters that sharply altered by anthropogenic activities. The thresholds of them are thus used to quantify potential ecological risks as one of early-warning signals (McCormick and Cairns, 1994). The results of this study showed that P. donghaiense responded positively and substantially to all the three significant environmental parameters, which meant that it was the most crucial indicator species in spring. Earlier research recorded that P. donghaiense blooms had been frequently observed in the coastal waters of Zhejiang Province recently in late spring (Xu et al., 2010; Li et al., 2011). This study found the tolerant thresholds of both community level and P. donghaiense in response to pH approached to 8.25 and 8.22 (Table 1), respectively. This was almost in accordance with He (2010) which suggested the pH value for the pre-forming stage of HABs in coastal water of Xiamen, southern East China Sea, should be 8.26. Rather, being capable of storing nutrients higher than diatoms, dinoflagellates, especially for Prorocentrum spp. (Lv and Li, 2006), need more nutrients (mainly nitrogen and phosphorus) for their growth. The thresholds of P. donghaiense in response to TN (1.519 mg/L) and TP (0.0975 mg/L) were higher than the mean values of them (Table 1). This indicated that great attention should be paid on the potential outbreaks of P. donghaiense-caused blooms in the early-warning stage despite nutrient conditions were relatively not enough to trigger bloom-forming. As long as the nutrient concentrations exceeded the thresholds, various tolerant taxa would replace the sensitive taxa and thus dominant the community, leading to the potential risk of forming HABs.
During summertime, reliable indicator species shifted from P. donghaiense to N. scintillans with the latter declining with increasing pH value and TN. Noctiluca scintillans is able to form tremendous blooms in subtropical nearshore waters in summer and can cause significant ecological disaster during bloom forming and after-bloom stage (Huang and Qi, 1997; Harrison et al., 2011). However, N. scintillans was detected as sensitive species in the present study. This indicated that the structure of N. scintillans population was ecologically stable and healthy when pH value and TN concentration were below 7.99 mg/L and 1.595 mg/L, respectively. It has been reported that N. scintillans blooms associated more with complicated and unpredictable climate changes than with deterministic mechanisms (Huang and Qi, 1997; Miyaguchi et al., 2006; Harrison et al., 2011). Moreover, other studies have also confirmed that N. scintillans was voracious phagotrophs and could feed on a wide range of food proxies, such as bacteria (Kirchner et al., 1996), diatoms (Tsai et al., 2018), and zooplankton (Quevedo et al., 1999). Unfortunately, these climatic factors and biological grazing factors were not taken into consideration and thereby no thresholds of them were identified, which need further study.
There were still numerous species that identified as “non-responders” along environmental gradients. This could probably ascribe to the rigorous statistical procedures that identified as reliable indicator species in TITAN. For instance, N. scintillans and P. pungens were not detected as reliable indicator species in spring and summer, respectively though they were measured as the most abundant species in each season. They may exist at the minority of sites with high abundance but not be observed in the majority of sites. Consequently, these species could not be robustly identified as indicators despite the fact that they related positively or negatively to environmental gradients (Dufrêne and Legendre, 1997; Simonin et al., 2019).
This study found the thresholds of phytoplankton community in response to environmental gradients differed seasonally. Generally, thresholds for the community-level in spring were much higher than that in summer (Table 3, except for the tolerant thresholds in response to TP). pH value and TN concentrations were significantly higher in spring compared with that in summer (Figs A1d, f) whereas TP in spring markedly outnumbered that in summer (Fig. A1e). Moreover, PCoA also showed significant seasonal differences of phytoplankton community composition (Fig. 2). These results illustrated that given the remark differences between the seasons in terms of community composition and environmental variation, it was not surprising that phytoplankton community thresholds across the environmental gradients changed temporally (Kovalenko et al., 2017). Furthermore, different species will respond differently to environmental dynamics given the fact that the succession of dominant (indicator) species shifted seasonally in coastal waters of northern Zhejiang Province (Wang and Wu, 2009; Zhou et al., 2017b; Zeng et al., 2019).
This study was the frontal work that focused on the ecological thresholds of marine phytoplankton community in response to environmental gradients in the coastal waters of northern Zhejiang, East China Sea. The ecological thresholds of community-level along environmental gradients differed seasonally with that in spring being higher compared with summer. As the most tolerant and sensitive indicator species identified in spring and summer, P. donghaiense and N. scintillans, respectively, responded intensively along environmental gradients and thus possessed significant indications for environmental variations. The thresholds of both community-level and taxon-level are useful for coastal HABs early-warning monitoring and management, as well as establishing phytoplankton-based nutrient criteria.
We appreciated the whole sampling stuffs and analysts of Marine Environmental Monitoring Center of Ningbo, for their hard work in field investigations and laboratory analyses.
| [1] |
Baker M E, King R S. 2010. A new method for detecting and interpreting biodiversity and ecological community thresholds. Methods in Ecology and Evolution, 1(1): 25–37. doi: 10.1111/j.2041-210X.2009.00007.x
|
| [2] |
Baker M E, King R S. 2013. Of TITAN and straw men: an appeal for greater understanding of community data. Freshwater Science, 32(2): 489–506. doi: 10.1899/12-142.1
|
| [3] |
Cao Xiaofeng, Wang Jie, Liao Jingqiu, et al. 2016. The threshold responses of phytoplankton community to nutrient gradient in a shallow eutrophic Chinese lake. Ecological Indicators, 61: 258–267. doi: 10.1016/j.ecolind.2015.09.025
|
| [4] |
Conde A, Hurtado M, Prado M. 2018. Phytoplankton response to a weak El Niño event. Ecological Indicators, 95: 394–404. doi: 10.1016/j.ecolind.2018.07.064
|
| [5] |
Dufrêne M, Legendre P. 1997. Species assemblages and indicator species: the need for a flexible asymmetrical approach. Ecological Monographs, 67(3): 345–366
|
| [6] |
Gao Lei, Li Daoji, Zhang Yanwei. 2012. Nutrients and particulate organic matter discharged by the Changjiang (Yangtze River): seasonal variations and temporal trends. Journal of Geophysical Research: Biogeosciences, 117(G4): G04001
|
| [7] |
General Administration of Quality Supervision of China, Standardization Administration of China. 2008a. GB 17378.3–2007 The specification for marine monitoring-Part 3: sample collection storage and transportation (in Chinese). Beijing: China Standard Press
|
| [8] |
General Administration of Quality Supervision of China, Standardization Administration of China. 2008b. GB 17378.4–2007 The specification for marine monitoring-Part 4: seawater analysis (in Chinese). Beijing: China Standard Press
|
| [9] |
General Administration of Quality Supervision of China, Standardization Administration of China. 2008c. GB 17378.7–2007 The specification for marine monitoring-Part 7: ecological survey for offshore pollution and biological monitoring (in Chinese). Beijing: China Standard Press
|
| [10] |
Harding Jr L W, Mallonee M E, Perry E S, et al. 2016. Variable climatic conditions dominate recent phytoplankton dynamics in Chesapeake Bay. Scientific Reports, 6(1): 23773. doi: 10.1038/srep23773
|
| [11] |
Harrison P J, Furuya K, Glibert P M, et al. 2011. Geographical distribution of red and green Noctiluca scintillans. Chinese Journal of Oceanology and Limnology, 29(4): 807–831. doi: 10.1007/s00343-011-0510-z
|
| [12] |
He Qing. 2010. The feasibility study on AOI and pH application for red tide pre-warning in Xiamen inner red tide-prone areas (in Chinese) [dissertation]. Xiamen: Third Institute of Oceanography, Ministry of Natural Resources
|
| [13] |
Huang C, Qi Y. 1997. The abundance cycle and influence factors on red tide phenomena of Noctiluca scintillans (Dinophyceae) in Dapeng Bay, the South China Sea. Journal of Plankton Research, 19(3): 303–318. doi: 10.1093/plankt/19.3.303
|
| [14] |
Jiang Zhibing, Chen Jianfang, Zhou Feng, et al. 2015. Controlling factors of summer phytoplankton community in the Changjiang (Yangtze River) Estuary and adjacent East China Sea shelf. Continental Shelf Research, 101: 71–84. doi: 10.1016/j.csr.2015.04.009
|
| [15] |
Jiang Zhibing, Liu Jingjing, Chen Jianfang, et al. 2014. Responses of summer phytoplankton community to drastic environmental changes in the Changjiang (Yangtze River) Estuary during the past 50 years. Water Research, 54: 1–11. doi: 10.1016/j.watres.2014.01.032
|
| [16] |
King R S, Baker M E. 2010. Considerations for identifying and interpreting ecological community thresholds. Journal of the North American Benthological Association, 29(3): 998–1008. doi: 10.1899/09-144.1
|
| [17] |
King R S, Richardson C J. 2003. Integrating bioassessment and ecological risk assessment: an approach to developing numerical water-quality criteria. Environmental Management, 31(6): 795–809. doi: 10.1007/s00267-002-0036-4
|
| [18] |
Kirchner M, Sahling G, Uhlig G, et al. 1996. Does the red tide-forming dinoflagellate Noctiluca scintillans feed on bacteria?. Sarsia, 81(1): 45–55. doi: 10.1080/00364827.1996.10413610
|
| [19] |
Kovalenko K E, Reavie E D, Allan J D, et al. 2017. Pelagic phytoplankton community change-points across nutrient gradients and in response to invasive mussels. Freshwater Biology, 62(2): 366–381. doi: 10.1111/fwb.12873
|
| [20] |
Li Yang, Lü Songhui, Jiang Tianjiu, et al. 2011. Environmental factors and seasonal dynamics of Prorocentrum populations in Nanji Islands National Nature Reserve, East China Sea. Harmful Algae, 10(5): 426–432. doi: 10.1016/j.hal.2010.08.002
|
| [21] |
Liu Lusan, Zhou Juan, Zheng Binghui, et al. 2013. Temporal and spatial distribution of red tide outbreaks in the Yangtze River Estuary and adjacent waters, China. Marine Pollution Bulletin, 72(1): 213–221. doi: 10.1016/j.marpolbul.2013.04.002
|
| [22] |
Lv Songhui, Li Yang. 2006. Nutritional storage ability of four harmful algae from the East China Sea. The Chinese Journal of Process Engineering (in Chinese), 6(3): 439–444
|
| [23] |
Martin K L, Kirkman L K. 2009. Management of ecological thresholds to re-establish disturbance-maintained herbaceous wetlands of the south-eastern USA. Journal of Applied Ecology, 46(4): 906–914. doi: 10.1111/j.1365-2664.2009.01659.x
|
| [24] |
Mazzei V, Gaiser E. 2018. Diatoms as tools for inferring ecotone boundaries in a coastal freshwater wetland threatened by saltwater intrusion. Ecological Indicators, 88: 190–204. doi: 10.1016/j.ecolind.2018.01.003
|
| [25] |
McCormick P V, Cairns Jr J. 1994. Algae as indicators of environmental change. Journal of Applied Phycology, 6: 509–526. doi: 10.1007/BF02182405
|
| [26] |
Milardi M, Aschonitis V, Gavioli A, et al. 2018. Run to the hills: exotic fish invasions and water quality degradation drive native fish to higher altitudes. Science of the Total Environment, 624: 1325–1335. doi: 10.1016/j.scitotenv.2017.12.237
|
| [27] |
Miyaguchi H, Fujiki T, Kikuchi T, et al. 2006. Relationship between the bloom of Noctiluca scintillans and environmental factors in the coastal waters of Sagami Bay, Japan. Journal of Plankton Research, 28(3): 313–324. doi: 10.1093/plankt/fbi127
|
| [28] |
Oksanen J, Blanchet F G, Friendly M, et al. 2010. Vegan: community ecology package. http://cran.r-project.org/web/packages/vegan [2019-09-01]
|
| [29] |
Porter-Goff E R, Frost P C, Xenopoulos M A. 2013. Changes in riverine benthic diatom community structure along a chloride gradient. Ecological Indicators, 32: 97–106. doi: 10.1016/j.ecolind.2013.03.017
|
| [30] |
Qian S S, King R S, Richardson C J. 2003. Two statistical methods for the detection of environmental thresholds. Ecological Modelling, 166(1–2): 87–97
|
| [31] |
Quevedo M, Gonzalez-Quiros R, Anadon R. 1999. Evidence of heavy predation by Noctiluca scintillans on Acartia clausi (Copepoda) eggs off the central Cantabrian coast (NW Spain). Oceanologica Acta, 22(1): 127–131. doi: 10.1016/S0399-1784(99)80039-5
|
| [32] |
R Development Core Team. 2016. R: a language and environment for statistical computing. R foundation for statistical computing, Vienna, Austria. http://www.R-project.org [2019-09-01]
|
| [33] |
Simonin M, Voss K A, Hassett B A., et al. 2019. In search of microbial indicator taxa: shifts in stream bacterial communities along an urbanization gradient. Environmental Microbiology, 21(10): 3653–3668. doi: 10.1111/1462-2920.14694
|
| [34] |
Smucker N J, Becker M, Detenbeck N E, et al. 2013. Using algal metrics and biomass to evaluate multiple ways of defining concentration-based nutrient criteria in streams and their ecological relevance. Ecological Indicators, 32: 51–61. doi: 10.1016/j.ecolind.2013.03.018
|
| [35] |
Sultana J, Recknagel F, Tibby J, et al. 2019. Comparison of water quality thresholds for macroinvertebrates in two Mediterranean catchments quantified by the inferential techniques TITAN and HEA. Ecological Indicators, 101: 867–877. doi: 10.1016/j.ecolind.2019.02.003
|
| [36] |
Tang Ting, Ren Ze, Tang Tao, et al. 2016. Total nitrogen and total phosphorus thresholds for epilithic diatom assemblages in inflow tributaries of the Three Gorges Reservoir, China. Chinese Journal of Applied Ecology (in Chinese), 27(8): 2670–2678
|
| [37] |
Taylor J M, Back J A, Brooks B W, et al. 2018. Spatial, temporal and experimental: three study design cornerstones for establishing defensible numeric criteria in freshwater ecosystems. Journal of Applied Ecology, 55(5): 2114–2123. doi: 10.1111/1365-2664.13150
|
| [38] |
Townsend C R, Uhlmann S S, Matthaei C D. 2008. Individual and combined responses of stream ecosystems to multiple stressors. Journal of Applied Ecology, 45(6): 1810–1819. doi: 10.1111/j.1365-2664.2008.01548.x
|
| [39] |
Tsai S F, Wu Luying, Chou Wenchen, et al. 2018. The dynamics of a dominant dinoflagellate, Noctiluca scintillans, in the subtropical coastal waters of the Matsu archipelago. Marine Pollution Bulletin, 127: 553–558. doi: 10.1016/j.marpolbul.2017.12.041
|
| [40] |
USEPA. 2001. EPA-822-B-01-003 Nutrient criteria technical guidance manual: estuarine and coastal marine waters. Washington, DC: US Environmental Protection Agency, Office of Water
|
| [41] |
Wang Baodong. 2006. Cultural eutrophication in the Changjiang (Yangtze River) plume: history and perspective. Estuarine, Coastal and Shelf Science, 69(3–4): 471–477
|
| [42] |
Wang Jinhui, Wu Jianyong. 2009. Occurrence and potential risks of harmful algal blooms in the East China Sea. Science of the Total Environment, 407(13): 4012–4021. doi: 10.1016/j.scitotenv.2009.02.040
|
| [43] |
Wang Yihe, Wu Hui, Gao Lei, et al. 2019. Spatial distribution and physical controls of the spring algal blooming off the Changjiang River Estuary. Estuaries and Coasts, 42(4): 1066–1083. doi: 10.1007/s12237-019-00545-x
|
| [44] |
Xu Ning, Duan Shunshan, Li Aifen, et al. 2010. Effects of temperature, salinity and irradiance on the growth of the harmful dinoflagellate Prorocentrum donghaiense Lu. Harmful Algae, 9(1): 13–17. doi: 10.1016/j.hal.2009.06.002
|
| [45] |
Yang Fuxia, Mi Tiezhu, Chen Hongtao, et al. 2019. Developing numeric nutrient criteria for the Yangtze River Estuary and adjacent waters in China. Journal of Hydrology, 579: 124188. doi: 10.1016/j.jhydrol.2019.124188
|
| [46] |
Yang Yuzhan, Ni Ping, Gao Yangchun, et al. 2018. Geographical distribution of zooplankton biodiversity in highly polluted running water ecosystems: validation of fine-scale species sorting hypothesis. Ecology and Evolution, 8(10): 4830–4840. doi: 10.1002/ece3.4037
|
| [47] |
Ye Ran, Liu Lian, Wang Qiong, et al. 2017. Identification of coastal water quality by multivariate statistical techniques in two typical bays of northern Zhejiang Province, East China Sea. Acta Oceanologica Sinica, 36(2): 1–10. doi: 10.1007/s13131-017-0981-7
|
| [48] |
Zeng Jing, Yin Baoling, Wang Yetang, et al. 2019. Significantly decreasing harmful algal blooms in China seas in the early 21st century. Marine Pollution Bulletin, 139: 270–274. doi: 10.1016/j.marpolbul.2019.01.002
|
| [49] |
Zhao Huixia, Wu Shaohong, Jiang Luguang. 2007. Review on recent advances in ecological threshold research. Acta Ecologica Sinica (in Chinese), 27(1): 338–345
|
| [50] |
Zhou Mingjiang, Shen Zhiliang, Yu Rencheng. 2008. Responses of a coastal phytoplankton community to increased nutrient input from the Changjiang (Yangtze) River. Continental Shelf Research, 28(12): 1483–1489. doi: 10.1016/j.csr.2007.02.009
|
| [51] |
Zhou Yuping, Zhang Yanmin, Li Fangfang, et al. 2017a. Nutrients structure changes impact the competition and succession between diatom and dinoflagellate in the East China Sea. Science of the Total Environment, 574: 499–508. doi: 10.1016/j.scitotenv.2016.09.092
|
| [52] |
Zhou Zhengxi, Yu Rencheng, Zhou Mingjiang. 2017b. Resolving the complex relationship between harmful algal blooms and environmental factors in the coastal waters adjacent to the Changjiang River Estuary. Harmful Algae, 62: 60–72. doi: 10.1016/j.hal.2016.12.006
|
| 1. | Li Xiaodong, Lu Weijing, Jiang Fan, et al. The dinoflagellate Noctiluca scintillans in China: A review of its distribution and role in harmful algal blooms. Marine Pollution Bulletin, 2023, 194: 115415. doi:10.1016/j.marpolbul.2023.115415 |

Figures(6) / Tables(4)

Supported by:
Beijing Renhe Information Technology Co. Ltd

Ran Ye, Chunying Ge, Qiong Wang, Qing Xu, Guofeng Xu, Yongkang Yan, Mingli Qin, Yanhong Cai, Yuejun Fei. Ecological thresholds of phytoplankton community across environmental gradients in the harmful algal blooms-frequently-occurring, subtropical coastal waters, East China Sea[J]. Acta Oceanologica Sinica, 2021, 40(6): 100-110. doi: 10.1007/s13131-021-1782-6

| Spring | Summer | ||||||||
| Minimum | Median | Mean | Maximum | Minimum | Median | Mean | Maximum | ||
| WT/°C | 16.94 | 18.29 | 18.71 | 22.40 | 22.40 | 25.35 | 25.90 | 30.70 | |
| Sal | 23.25 | 29.27 | 29.31 | 32.58 | 21.48 | 29.91 | 29.68 | 33.99 | |
| SD/m | 0.1 | 1.75 | 3.21 | 14.5 | 0.1 | 2.0 | 2.9 | 13.5 | |
| pH | 7.96 | 8.10 | 8.13 | 8.42 | 7.84 | 8.09 | 8.07 | 8.38 | |
| TP/(mg·L−1) | 0.0285 | 0.0748 | 0.0830 | 0.2813 | 0.0264 | 0.0976 | 0.1024 | 0.2595 | |
| TN/(mg·L−1) | 0.469 | 0.999 | 1.103 | 1.943 | 0.423 | 0.742 | 0.883 | 2.100 | |
| ${\rm {PO}}_4^{3-} $/(mg·L−1) | 0.0009 | 0.0258 | 0.0256 | 0.0554 | 0.0059 | 0.0220 | 0.0247 | 0.0740 | |
| DIN/(mg·L−1) | 0.172 | 0.538 | 0.555 | 1.520 | 0.183 | 0.447 | 0.465 | 1.327 | |
| ${\rm {SiO}}_3^{2-} $/(mg·L−1) | 0.358 | 0.976 | 1.000 | 1.970 | 0.239 | 0.887 | 0.898 | 1.918 | |
| H′ | 0 | 1.50 | 1.28 | 2.58 | 0.32 | 1.59 | 1.51 | 2.77 | |
| J | 0 | 0.60 | 0.54 | 0.93 | 0.11 | 0.59 | 0.54 | 0.92 | |
| d | 0 | 0.76 | 0.82 | 2.01 | 0.40 | 1.04 | 1.15 | 2.51 | |
| Note: WT, water temperature; Sal, salinity; SD, secchi depth; TP, total phosphorus; TN, total nitrogen; ${\rm {PO}}_4^{3-} $, phosphate concentration; DIN, dissolved inorganic nitrogen concentration; ${\rm {SiO}}_3^{2-} $, silicate concentration; H′, Shannon-Weiner diversity index; J, Pielou evenness index; d, Margalef richness index. | |||||||||
DownLoad:
CSV
| Season | Significant variables | R2 | Cumulated R2 | Adjusted cumulated R2 | F-test | P |
| Spring | TN | 0.057 | 0.057 | 0.045 | 4.824 | 0.002 |
| pH | 0.039 | 0.096 | 0.073 | 3.434 | 0.012 | |
| TP | 0.030 | 0.127 | 0.093 | 2.718 | 0.032 | |
| Summer | WT | 0.050 | 0.050 | 0.038 | 4.171 | <0.001 |
| TN | 0.048 | 0.097 | 0.074 | 4.182 | <0.001 | |
| TP | 0.047 | 0.144 | 0.111 | 4.260 | <0.001 | |
| Sal | 0.027 | 0.172 | 0.128 | 2.551 | 0.015 | |
| ${\rm {SiO}}_3^{2-} $ | 0.026 | 0.198 | 0.145 | 2.468 | 0.015 | |
| pH | 0.021 | 0.219 | 0.156 | 2.029 | 0.037 | |
| Note: WT, water temperature; Sal, salinity; TP, total phosphorus; TN, total nitrogen; ${\rm {SiO}}_3^{2-} $, silicate concentration. | ||||||
DownLoad:
CSV
| Season | Environmental gradient | Responder | Threshold |
| Spring | pH | z– | 8.03 |
| z+ | 8.25 | ||
| TN (mg·L–1) | z– | 0.966 | |
| z+ | 1.553 | ||
| TP/(mg·L–1) | z– | 0.043 3 | |
| z+ | 0.098 7 | ||
| Summer | pH | z– | 7.98 |
| z+ | 8.12 | ||
| TN/(mg·L–1) | z– | 0.706 | |
| z+ | 1.008 | ||
| TP/(mg·L–1) | z– | 0.035 5 | |
| z+ | 0.146 4 | ||
| Note: Responder meant taxa that either negatively (z–) or positively (z+) responded to environmental gradients. | |||
DownLoad:
CSV
| Season | Taxon | Environmental gradient | Threshold | Direction | Purity | Reliability |
| Spring | Prorocentrum donghaiense | pH | 8.22 | z+ | 1.000 | 0.996 |
| Rhizosolenia setigera | 8.28 | z+ | 0.988 | 0.976 | ||
| Ceratium fusus | 8.22 | z+ | 1.000 | 1.000 | ||
| Prorocentrum donghaiense | TN/(mg·L−1) | 1.519 | z+ | 1.000 | 1.000 | |
| Rhizosolenia setigera | 1.423 | z+ | 0.994 | 0.982 | ||
| Ceratium breve | 1.040 | z+ | 0.998 | 0.994 | ||
| Coscinodiscus oculatus | 1.602 | z+ | 1.000 | 0.988 | ||
| Coscinodiscus thorii | 1.545 | z+ | 0.980 | 0.984 | ||
| Coscinodiscus wailesii | 1.504 | z– | 0.982 | 0.978 | ||
| Prorocentrum donghaiense | TP/(mg·L−1) | 0.0975 | z+ | 1.000 | 1.000 | |
| Rhizosolenia setigera | 0.1008 | z+ | 0.976 | 0.956 | ||
| Ceratium breve | 0.0987 | z+ | 0.996 | 0.994 | ||
| Biddulphia mobiliensis | 0.0433 | z– | 1.000 | 0.972 | ||
| Coscinodiscus oculatus | 0.1056 | z+ | 1.000 | 0.976 | ||
| Summer | Noctiluca scintillans | pH | 7.99 | z– | 0.994 | 0.998 |
| Hemidiscus hardmannianus | 7.90 | z– | 1.000 | 0.986 | ||
| Biddulphia sinensis | 7.90 | z– | 0.990 | 0.986 | ||
| Chaetoceros curvisetus | 8.22 | z+ | 0.994 | 0.994 | ||
| Thalassionema nitzschiodes | 8.04 | z+ | 1.000 | 0.998 | ||
| Ceratium furca | 8.15 | z+ | 0.978 | 1.000 | ||
| Ceratium breve | 8.12 | z+ | 0.986 | 1.000 | ||
| Ceratium trichoceros | 8.14 | z+ | 1.000 | 1.000 | ||
| Coscinodiscus asteromphalus | 8.11 | z+ | 0.994 | 0.992 | ||
| Chaetoceros subsecundus | 8.22 | z+ | 1.000 | 0.998 | ||
| Chaetoceros compressue | 8.22 | z+ | 1.000 | 0.986 | ||
| Rhizosolenia hyalinena | 8.14 | z+ | 1.000 | 0.960 | ||
| Bacteriastrum minus | 8.14 | z+ | 0.996 | 0.988 | ||
| Pyrophacus steinii | 8.08 | z+ | 1.000 | 0.988 | ||
| Noctiluca scintillans | TN/(mg·L−1) | 1.595 | z– | 0.988 | 0.992 | |
| Thalassiothrix frauenfeldii | 1.243 | z– | 0.968 | 0.960 | ||
| Ceratium furca | 0.684 | z– | 0.988 | 0.982 | ||
| Rhizosolenia alata f. gracillima | 0.564 | z– | 0.998 | 0.970 | ||
| Ceratium tripos | 0.634 | z– | 1.000 | 1.000 | ||
| Coscinodiscus radiatus | 0.586 | z– | 0.998 | 0.986 | ||
| Pyrophacus horologicum | 0.993 | z– | 0.990 | 0.990 | ||
| Schroederella delicatula | 0.909 | z+ | 1.000 | 0.998 | ||
| Skeletonema costatum | 0.909 | z+ | 0.976 | 0.964 | ||
| Hemidiscus hardmannianus | 0.816 | z+ | 1.000 | 1.000 | ||
| Thalassionema nitzschiodes | 1.075 | z+ | 0.994 | 0.996 | ||
| Protoperidinium depressum | 0.767 | z+ | 0.982 | 0.996 | ||
| Ditylum brightwellii | 1.645 | z+ | 0.988 | 0.992 | ||
| Ceratium trichoceros | 1.720 | z+ | 0.958 | 0.984 | ||
| Coscinodiscus bipartitus | 1.090 | z+ | 1.000 | 1.000 | ||
| Coscinodiscus centralis | 1.164 | z+ | 1.000 | 0.992 | ||
| Protoperidinium pentagonum | 1.483 | z+ | 1.000 | 0.994 | ||
| Pyrophacus steinii | 1.720 | z+ | 1.000 | 1.000 | ||
| Streptotheca thamesis | 1.720 | z+ | 1.000 | 1.000 | ||
| Rhizosolenia calcar–avis | TP/(mg·L−1) | 0.0334 | z– | 1.000 | 1.000 | |
| Protoperidinium pentagonum | 0.1129 | z– | 0.998 | 0.964 | ||
| Pyrophacus steinii | 0.0355 | z– | 1.000 | 0.976 | ||
| Thalassiothrix frauenfeldii | 0.1464 | z+ | 0.994 | 1.000 | ||
| Ceratium furca | 0.1260 | z+ | 0.998 | 1.000 | ||
| Ceratium tripos | 0.1260 | z+ | 0.998 | 1.000 | ||
| Note: Direction meant taxa that either negatively (z–) or positively (z+) responded to environmental gradients. Purity was the mean proportion correct taxa direction (z– or z+) assignment, reliability was the mean proportion of P<0.05. TP, total phosphorus; TN, total nitrogen. | ||||||
DownLoad:
CSV
| Spring | Summer | ||||||||
| Minimum | Median | Mean | Maximum | Minimum | Median | Mean | Maximum | ||
| WT/°C | 16.94 | 18.29 | 18.71 | 22.40 | 22.40 | 25.35 | 25.90 | 30.70 | |
| Sal | 23.25 | 29.27 | 29.31 | 32.58 | 21.48 | 29.91 | 29.68 | 33.99 | |
| SD/m | 0.1 | 1.75 | 3.21 | 14.5 | 0.1 | 2.0 | 2.9 | 13.5 | |
| pH | 7.96 | 8.10 | 8.13 | 8.42 | 7.84 | 8.09 | 8.07 | 8.38 | |
| TP/(mg·L−1) | 0.0285 | 0.0748 | 0.0830 | 0.2813 | 0.0264 | 0.0976 | 0.1024 | 0.2595 | |
| TN/(mg·L−1) | 0.469 | 0.999 | 1.103 | 1.943 | 0.423 | 0.742 | 0.883 | 2.100 | |
| ${\rm {PO}}_4^{3-} $/(mg·L−1) | 0.0009 | 0.0258 | 0.0256 | 0.0554 | 0.0059 | 0.0220 | 0.0247 | 0.0740 | |
| DIN/(mg·L−1) | 0.172 | 0.538 | 0.555 | 1.520 | 0.183 | 0.447 | 0.465 | 1.327 | |
| ${\rm {SiO}}_3^{2-} $/(mg·L−1) | 0.358 | 0.976 | 1.000 | 1.970 | 0.239 | 0.887 | 0.898 | 1.918 | |
| H′ | 0 | 1.50 | 1.28 | 2.58 | 0.32 | 1.59 | 1.51 | 2.77 | |
| J | 0 | 0.60 | 0.54 | 0.93 | 0.11 | 0.59 | 0.54 | 0.92 | |
| d | 0 | 0.76 | 0.82 | 2.01 | 0.40 | 1.04 | 1.15 | 2.51 | |
| Note: WT, water temperature; Sal, salinity; SD, secchi depth; TP, total phosphorus; TN, total nitrogen; ${\rm {PO}}_4^{3-} $, phosphate concentration; DIN, dissolved inorganic nitrogen concentration; ${\rm {SiO}}_3^{2-} $, silicate concentration; H′, Shannon-Weiner diversity index; J, Pielou evenness index; d, Margalef richness index. | |||||||||
| Season | Significant variables | R2 | Cumulated R2 | Adjusted cumulated R2 | F-test | P |
| Spring | TN | 0.057 | 0.057 | 0.045 | 4.824 | 0.002 |
| pH | 0.039 | 0.096 | 0.073 | 3.434 | 0.012 | |
| TP | 0.030 | 0.127 | 0.093 | 2.718 | 0.032 | |
| Summer | WT | 0.050 | 0.050 | 0.038 | 4.171 | <0.001 |
| TN | 0.048 | 0.097 | 0.074 | 4.182 | <0.001 | |
| TP | 0.047 | 0.144 | 0.111 | 4.260 | <0.001 | |
| Sal | 0.027 | 0.172 | 0.128 | 2.551 | 0.015 | |
| ${\rm {SiO}}_3^{2-} $ | 0.026 | 0.198 | 0.145 | 2.468 | 0.015 | |
| pH | 0.021 | 0.219 | 0.156 | 2.029 | 0.037 | |
| Note: WT, water temperature; Sal, salinity; TP, total phosphorus; TN, total nitrogen; ${\rm {SiO}}_3^{2-} $, silicate concentration. | ||||||
| Season | Environmental gradient | Responder | Threshold |
| Spring | pH | z– | 8.03 |
| z+ | 8.25 | ||
| TN (mg·L–1) | z– | 0.966 | |
| z+ | 1.553 | ||
| TP/(mg·L–1) | z– | 0.043 3 | |
| z+ | 0.098 7 | ||
| Summer | pH | z– | 7.98 |
| z+ | 8.12 | ||
| TN/(mg·L–1) | z– | 0.706 | |
| z+ | 1.008 | ||
| TP/(mg·L–1) | z– | 0.035 5 | |
| z+ | 0.146 4 | ||
| Note: Responder meant taxa that either negatively (z–) or positively (z+) responded to environmental gradients. | |||
| Season | Taxon | Environmental gradient | Threshold | Direction | Purity | Reliability |
| Spring | Prorocentrum donghaiense | pH | 8.22 | z+ | 1.000 | 0.996 |
| Rhizosolenia setigera | 8.28 | z+ | 0.988 | 0.976 | ||
| Ceratium fusus | 8.22 | z+ | 1.000 | 1.000 | ||
| Prorocentrum donghaiense | TN/(mg·L−1) | 1.519 | z+ | 1.000 | 1.000 | |
| Rhizosolenia setigera | 1.423 | z+ | 0.994 | 0.982 | ||
| Ceratium breve | 1.040 | z+ | 0.998 | 0.994 | ||
| Coscinodiscus oculatus | 1.602 | z+ | 1.000 | 0.988 | ||
| Coscinodiscus thorii | 1.545 | z+ | 0.980 | 0.984 | ||
| Coscinodiscus wailesii | 1.504 | z– | 0.982 | 0.978 | ||
| Prorocentrum donghaiense | TP/(mg·L−1) | 0.0975 | z+ | 1.000 | 1.000 | |
| Rhizosolenia setigera | 0.1008 | z+ | 0.976 | 0.956 | ||
| Ceratium breve | 0.0987 | z+ | 0.996 | 0.994 | ||
| Biddulphia mobiliensis | 0.0433 | z– | 1.000 | 0.972 | ||
| Coscinodiscus oculatus | 0.1056 | z+ | 1.000 | 0.976 | ||
| Summer | Noctiluca scintillans | pH | 7.99 | z– | 0.994 | 0.998 |
| Hemidiscus hardmannianus | 7.90 | z– | 1.000 | 0.986 | ||
| Biddulphia sinensis | 7.90 | z– | 0.990 | 0.986 | ||
| Chaetoceros curvisetus | 8.22 | z+ | 0.994 | 0.994 | ||
| Thalassionema nitzschiodes | 8.04 | z+ | 1.000 | 0.998 | ||
| Ceratium furca | 8.15 | z+ | 0.978 | 1.000 | ||
| Ceratium breve | 8.12 | z+ | 0.986 | 1.000 | ||
| Ceratium trichoceros | 8.14 | z+ | 1.000 | 1.000 | ||
| Coscinodiscus asteromphalus | 8.11 | z+ | 0.994 | 0.992 | ||
| Chaetoceros subsecundus | 8.22 | z+ | 1.000 | 0.998 | ||
| Chaetoceros compressue | 8.22 | z+ | 1.000 | 0.986 | ||
| Rhizosolenia hyalinena | 8.14 | z+ | 1.000 | 0.960 | ||
| Bacteriastrum minus | 8.14 | z+ | 0.996 | 0.988 | ||
| Pyrophacus steinii | 8.08 | z+ | 1.000 | 0.988 | ||
| Noctiluca scintillans | TN/(mg·L−1) | 1.595 | z– | 0.988 | 0.992 | |
| Thalassiothrix frauenfeldii | 1.243 | z– | 0.968 | 0.960 | ||
| Ceratium furca | 0.684 | z– | 0.988 | 0.982 | ||
| Rhizosolenia alata f. gracillima | 0.564 | z– | 0.998 | 0.970 | ||
| Ceratium tripos | 0.634 | z– | 1.000 | 1.000 | ||
| Coscinodiscus radiatus | 0.586 | z– | 0.998 | 0.986 | ||
| Pyrophacus horologicum | 0.993 | z– | 0.990 | 0.990 | ||
| Schroederella delicatula | 0.909 | z+ | 1.000 | 0.998 | ||
| Skeletonema costatum | 0.909 | z+ | 0.976 | 0.964 | ||
| Hemidiscus hardmannianus | 0.816 | z+ | 1.000 | 1.000 | ||
| Thalassionema nitzschiodes | 1.075 | z+ | 0.994 | 0.996 | ||
| Protoperidinium depressum | 0.767 | z+ | 0.982 | 0.996 | ||
| Ditylum brightwellii | 1.645 | z+ | 0.988 | 0.992 | ||
| Ceratium trichoceros | 1.720 | z+ | 0.958 | 0.984 | ||
| Coscinodiscus bipartitus | 1.090 | z+ | 1.000 | 1.000 | ||
| Coscinodiscus centralis | 1.164 | z+ | 1.000 | 0.992 | ||
| Protoperidinium pentagonum | 1.483 | z+ | 1.000 | 0.994 | ||
| Pyrophacus steinii | 1.720 | z+ | 1.000 | 1.000 | ||
| Streptotheca thamesis | 1.720 | z+ | 1.000 | 1.000 | ||
| Rhizosolenia calcar–avis | TP/(mg·L−1) | 0.0334 | z– | 1.000 | 1.000 | |
| Protoperidinium pentagonum | 0.1129 | z– | 0.998 | 0.964 | ||
| Pyrophacus steinii | 0.0355 | z– | 1.000 | 0.976 | ||
| Thalassiothrix frauenfeldii | 0.1464 | z+ | 0.994 | 1.000 | ||
| Ceratium furca | 0.1260 | z+ | 0.998 | 1.000 | ||
| Ceratium tripos | 0.1260 | z+ | 0.998 | 1.000 | ||
| Note: Direction meant taxa that either negatively (z–) or positively (z+) responded to environmental gradients. Purity was the mean proportion correct taxa direction (z– or z+) assignment, reliability was the mean proportion of P<0.05. TP, total phosphorus; TN, total nitrogen. | ||||||
 DownLoad: