
Figure
1.
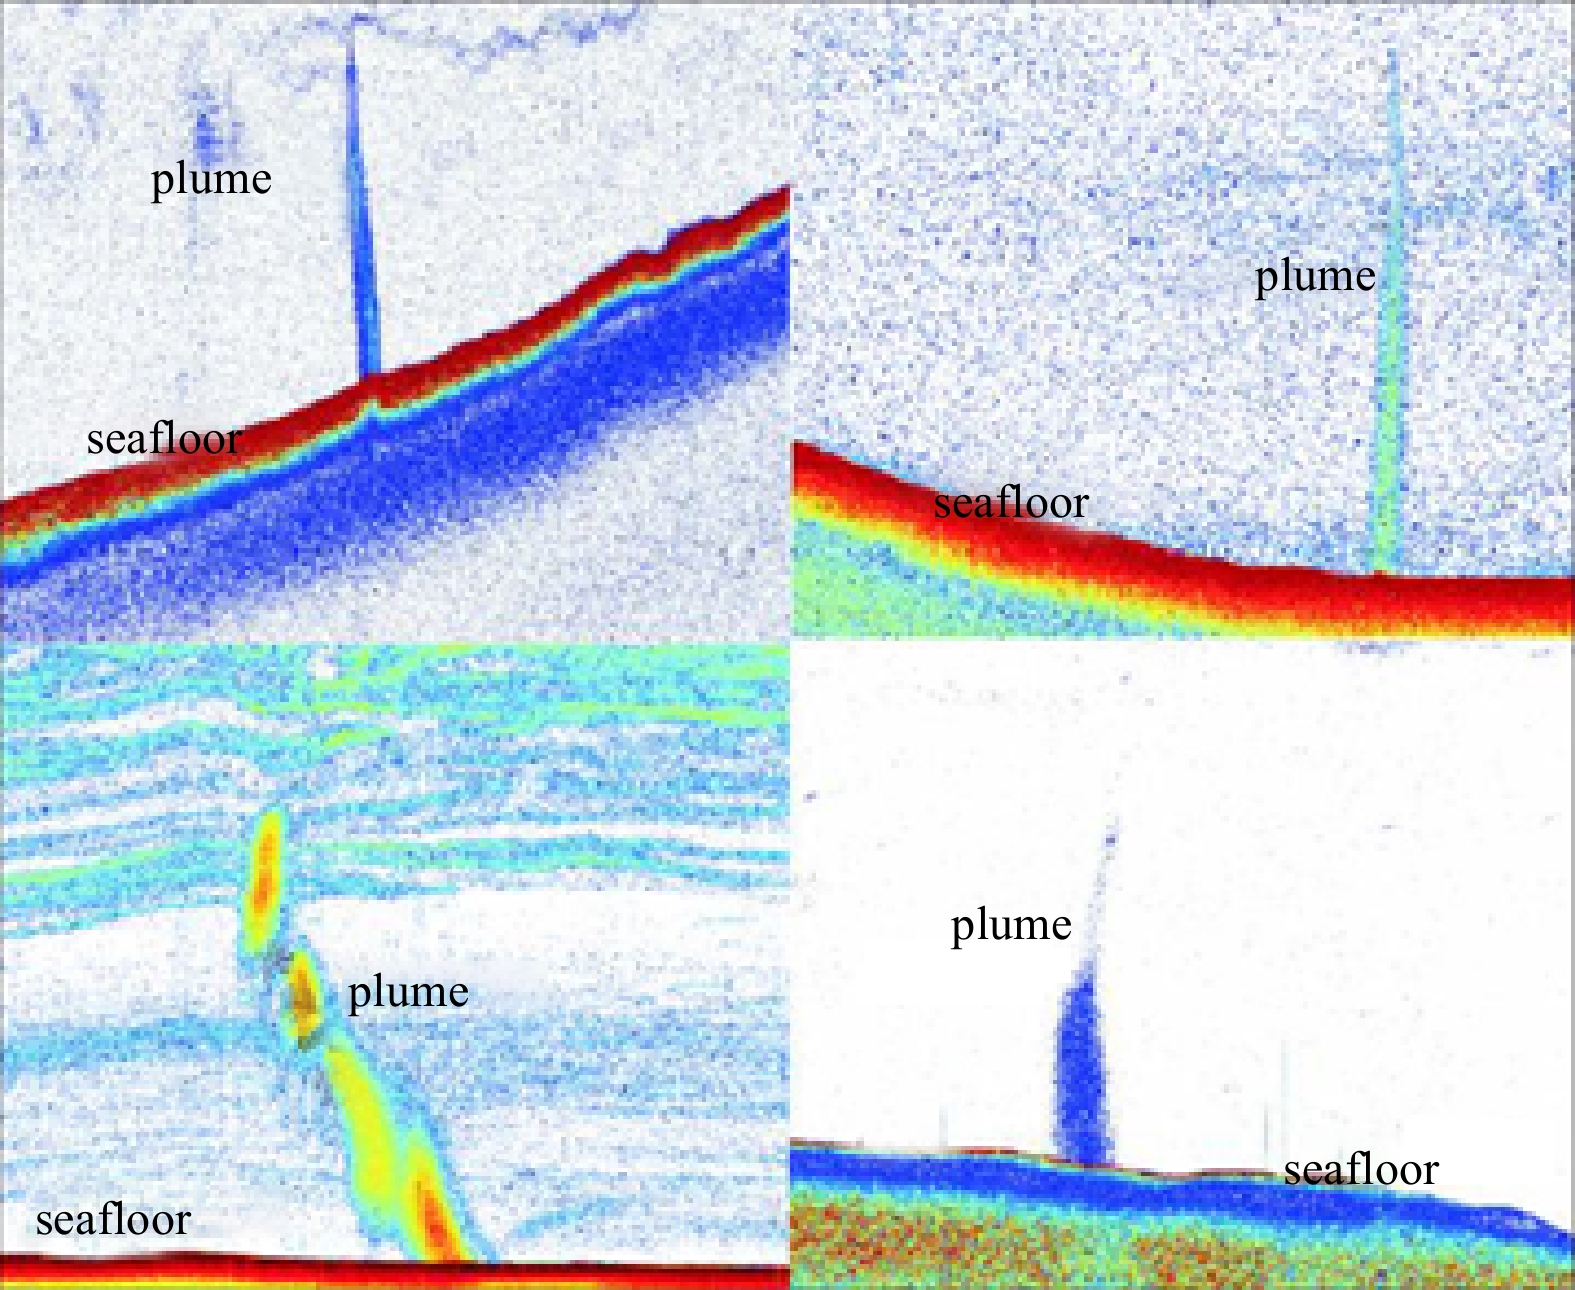
Bubble plume in cold seepage in the Okhotsk Sea (Luan et al., 2010).
| Citation: | Canping Li, Jiachun You, Yanchun Tan, Fengying Chen, Yilin Liu, Zihao Guo, Xinyu Tian. Forward modeling and inversion of the relation model between the gas content of plume and its seismic attribute[J]. Acta Oceanologica Sinica, 2021, 40(5): 120-128. doi: 10.1007/s13131-021-1737-y

|
A bubble plume is frequently discovered in overlying seawater areas where hydrates are stored, and this phenomenon can be detected by sonar or seismic techniques, such as the examples at the bottom of the west rim of the Barents Sea (Sauter et al., 2006), the continental margin Hydrate Ridge in Cascadia (Shipboard Scientific Party, 2002), the Okhotsk Sea (Luan et al., 2010), the Gulf of Mexico (Sassen et al., 2001), the UT-04 ridge in Naoetsu Basin at the convergent margin of the Sea of Japan (Matsumoto and Gong, 2006) and other sea areas (Freire et al., 2011) as well as the mud volcano in the Mediterranean (Charlou et al., 2003). Plume bubbles carrying hydrate spill out from the bottom of sea and exhibit the seafloor phenomenon of a “flame”. In the Black Sea, the seafloor plume bubbles that spill out from a seafloor mud volcanic crater reach up to 1 300 m (Greinert et al., 2006). The bubbles in the plume take on the appearance of a plume (the origin of the name “plume”) are shown in Fig. 1. Because bubbles are affected by ocean currents and the seafloor terrain environment in the process of continuous rising (Heeschen et al., 2003; Tryon et al., 2002; Tryon and Brown, 2004), certain plumes are vertical and others have a tilted shape.
The formation of the plume occurs due to seafloor cold seep, which refers to a type of marine geological phenomenon (Luan et al., 2010; Di et al., 2008) in which gas from the submarine sedimentary strata (or deeper) is ejected into the sea via a gush or seepage, and a large amount of gases rush from the cold seep into the seawater to form the bubble plume. Therefore, the plume is the direct representation of seafloor cold seep activity and offers direct evidence of seafloor gas leakage, which is a topic of growing concern for scientists (Liu et al., 2015) because the precipitation of seeping natural gas hydrate is closely related to seafloor cold seep activity. Additionally, the methane bubble plume caused by seafloor cold seep activity is an important indicator of changes in the marine environment and even the global climate.
An obvious wave impedance interface is formed between the seawater and the bubbles such that acoustic waves might scatter when they encounter bubbles during propagation in seawater (Wu and Aki, 1993). The bubble plume in the water body can be identified using scattering imaging theory. Currently, the plume is generally identified using photography and sonar acoustic technology (Chen et al., 2019; Sauter et al., 2006; Shipboard Scientific Party, 2002; Luan et al., 2010; Sassen et al., 2001), and the resolution of the images obtained by sonar is relatively high with a clearly visible plume (Fig. 1) because the high detection frequency of sonar yields high resolution (Luan et al., 2010). In contrast, the acoustic wave frequency and the resolution of seismic exploration are relatively low, which causes that seismic imaging is not as clear as that of sonar (Fig. 2a). However, the seismic method has the advantages of a large area of seismic exploration and low cost. Certain problems related to the hydrate can be further studied through research on the seismic response caused by the plume, e.g., the gas content of plume can be inverted according to the seismic response and used to estimate the hydrate reserves in the seafloor formation for exploration of decomposition and the migration law of the hydrate (Fu et al., 2019).

Numerical simulation of bubble plumes has been studied by seismic method. The plume was simulated numerically earlier (Li et al., 2013). The seismic response and seismic attributes of plume was further analyzed (Li et al., 2016, 2017). By analyzing the results of a complex cold seepage bubble scattering model, Duan et al. (2020) concluded that the seismic response can accurately describe the submarine cold seepage plume. The numerical simulation and synthetic examples shown in the research demonstrate the feasibility of the seismic oceanography method to investigate the dynamics of processes related to submarine bubble plumes (Chen et al., 2020).
The seismic migration section in an area of the South China Sea (Fig. 2b) shows gas chimneys, fracture structures, typical BSR (bottom simulating reflector) and a blank zone. Figure 2a presents the seismic migration section of seawater containing the bubble plume in the same area as Fig. 2b, which obviously shows that the seismic response caused by the plume is distributed in a vertical strip, with fewer bubbles in the shadow formation than in the deep formation. At the same time, cold seep and hydrate occur on the seafloor of this area. Figure 2 shows that the gas chimney and fracture create a migration pathway for the methane to spill out into the seawater, and the decomposition of natural gas hydrate is the source of the bubble plume. Therefore, the plume plays a role in indirect indication of exploration and identification of natural gas hydrate. This evidence shows that the seismic method can be used to detect the bubble plume in the water body. In addition, the seismic method is one of the main means used to detect the plume for regional exploration. However, a set of complete methodology is not available for processing of seismic data for plume identification, and no conclusion has been reached internationally for how to handle the seismic response mechanism of the plume.
Therefore, further study of the seismic response mechanism for a bubble plume in the cold seep activity area is needed to determine whether the change in gas content causes the change in seismic response and whether the gas content is related to the amplitude attribute. In this paper, based on the established plume model and its migration section (You et al., 2015), the seismic attributes are extracted from the migration sections of different gas content models to obtain a relation model between the gas content and seismic attribute, which is applied in the seismic section of a real plume to obtain the gas content section corresponding to the seismic section of the real plume. Therefore, this section can more intuitively reflect the distribution situation of the gas content of the plume, from which the distribution law of seafloor bubbles can be deduced to lay a foundation for further estimation of the gas content of the plume and hydrate reserves.
Using the analysis of the characteristics of seawater containing bubbles and according to the shape features of the plume and the bubble distribution characteristics detected by sonar, the model of velocity of the plume is established, and the seismic migration section is obtained via reverse-time migration processing. Li et al. (2013) and You et al. (2015) have achieved these research results, and the studies in this paper are performed based on this foundation. To better understand the entire paper, model establishment and acquisition of the migration section are briefly described in the following section.
At the micro-level, the plume bubbles and surrounding seawater belong to a type of typical gas-liquid two-phase medium, and therefore, calculation of the plume velocity is performed according to the average effective medium theory of Reuss (Mavko et al., 2003). The section of the real plume shows that the plume bubbles in the seawater exist in a state of random distribution during the process of continuous rising. The seawater medium containing the bubbles belongs to the random medium. Thus, the distribution state of the plume bubble is realized using the random medium theory (Korn, 1993). Because the shape of the real plume is a half ellipse (Luan et al., 2010), the simulation of the plume shape is described by the elliptic function (Yuan et al., 2013; Xia et al., 2012).
Reuss average effective theory (Mavko et al., 2003) is introduced below (You et al., 2015).
| $$ \left\{ \begin{aligned} &\frac{{\rm{1}}}{{{K_{{\rm{fl}}}}}} = \frac{{{S_{\rm{g}}}}}{{{K_{\rm{g}}}}} + \frac{{1 - {S_{\rm{g}}}}}{{{K_{\rm{w}}}}}\text{,} \\ & \rho = {S_{\rm{g}}}{\rho _{\rm{g}}} + (1 - {S_{\rm{g}}}){\rho _{\rm{w}}}\text{,} \\ & v = \sqrt {\frac{{{K_{{\rm{fl}}}}}}{\rho }} \text{,}\end{aligned} \right. $$ | (1) |
where Kg and Kw are the bulk moduli of gas and water, respectively; in petrophysics, Sg is saturation such as hydrate formation, and Sg is methane gas content in the effective medium; ρg and ρw are the densities of gas and water, respectively; Kfl, ρ and v are the effective bulk modulus, density and velocity of gas and water, respectively.
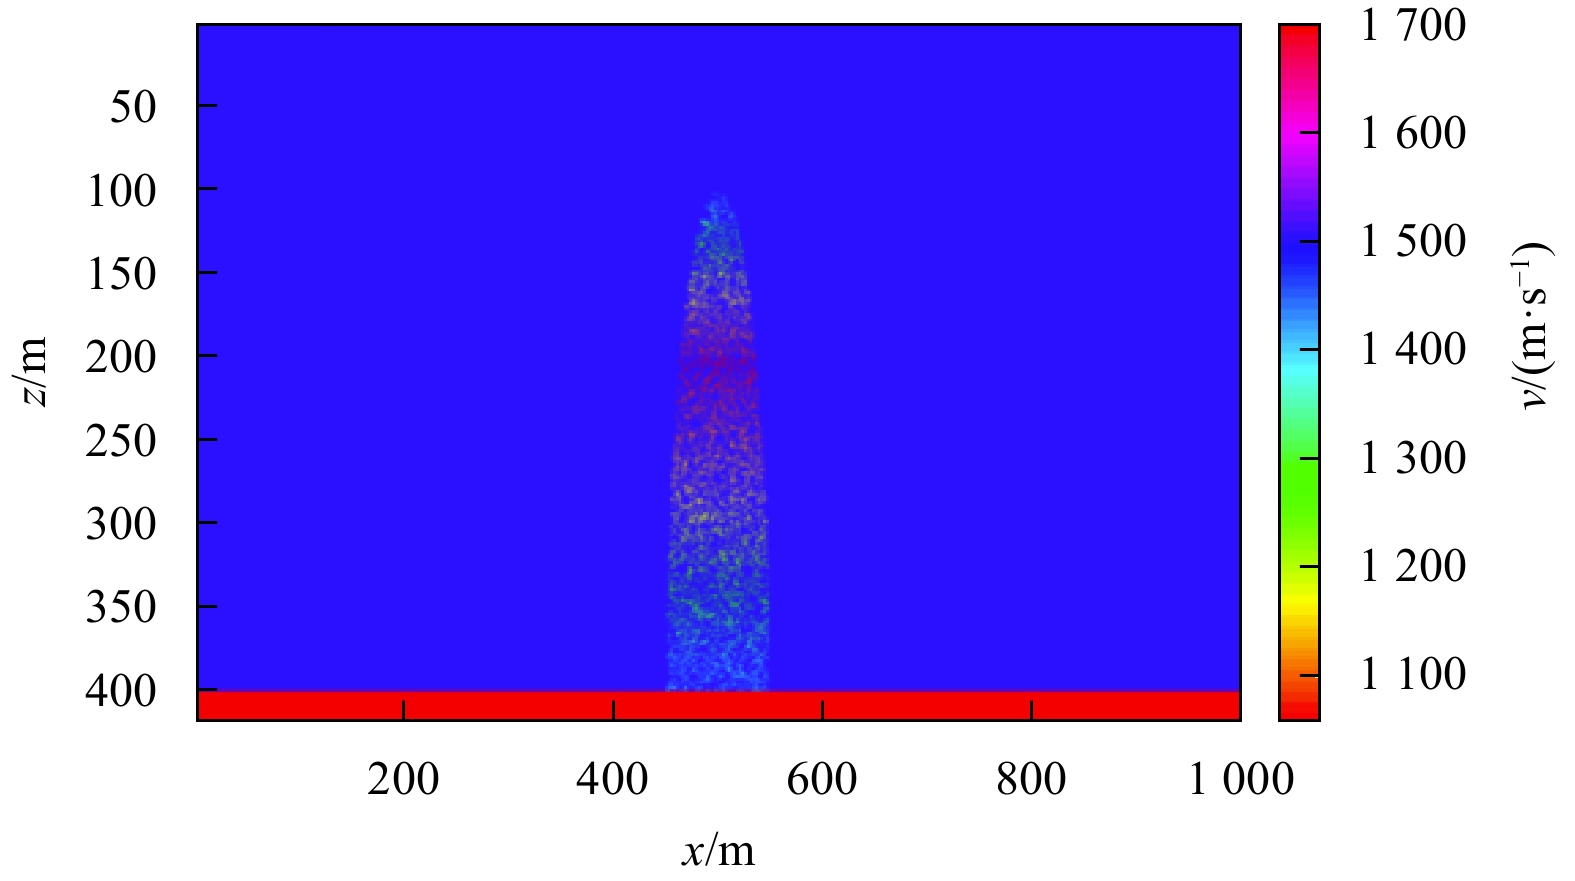
To better simulate the seismic response of the plume, the model is established with two formations. The background of Formation 1 is seawater, and the middle is the plume in the shape of a semi-ellipse. Formation 2 is the seafloor that contains deposits rich in gas.
To study the difference in the seismic response caused by the change in the background gas content of the plume, five plume models with gradually increasing gas content are established, and the background gas content of the five models is respectively 1%–5%–1%, 5%–10%–5%, 10%–15%–10%, 15%–20%–15% and 20%–25%–20%. The model of the background gas content of 1%–5%–1% is selected as an example (Fig. 3). The detailed procedure of establishment of the plume model is referred to the literature (You et al., 2015).

Sg in the Eq. (1) is gas content in the area containing methane gas in Fig. 3. The test results show that if the background gas content S0 (You et al., 2015) is too small, the difference between the velocity calculated by Eq. (1) of the effective medium and that of sea water is very small. Thus the seismic response of plumes is weak, which will make it more difficult to image. Therefore, the background gas content S0 in the simulation is a little large.
The finite difference method is used to solve the acoustic wave equation to obtain shot-gather records of the five plume models. The acquisition parameters are as follows: the length of survey line is 1 000 m in the horizontal direction and at zero depth; the grid subdivision is 1 m×1 m; the dominant frequency of a seismic wavelet is 140 Hz. The observation system is as follows: seismic waves are received at all arrays; the receiver array is fixed, with the shot point moving from left to right, and its interval is 10 m, amounting to 101 shots; the depth of seismic source is 0 m, and the trace interval is 1 m, amounting to 1 000 traces; and the least offset is 0; the record length is 1.4 s and the sampling rate is 0.2 ms. The shot-gather records of the five models are processed using pre-stack reverse-time migration, and the migration section is obtained.
Frequency is important in acoustic detection of plumes. Figure 1 is high frequency acoustic image and its excitation frequency is about tens to hundreds of kilohertz. The data of shot-gather and trace-gather are extracted from the seismic section in Fig. 2a, and its spectrum is shown in Fig. 4. Its frequency bandwidth is about 0–200 Hz in Fig. 4. According to the frequency features in acoustic images and real seismic sections, the dominant frequency of a seismic wavelet is selected as 140 Hz to obtain the seismic imaging result with higher resolution in simulation.

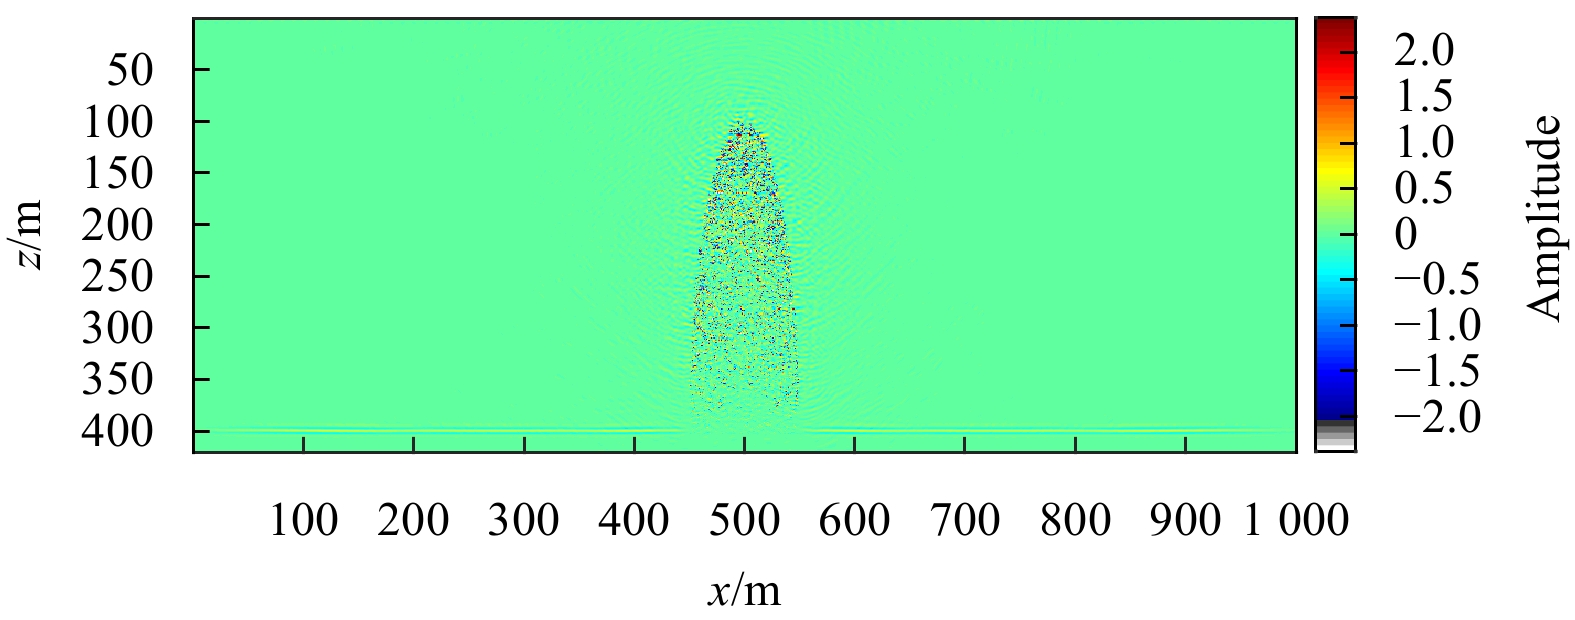
Select one section as an example, as shown in Fig. 5. Compared with the plume section detected by sonar (Fig. 1) and the seismic migration section of the plume (Fig. 2a), the imaging result obtained via reverse-time migration processing has better quality, with higher precision, and the boundary convergence effect is better, thus maintaining the shape features of the plume. This research result shows that the plume can produce a seismic response, and different gas contents might cause changes in different corresponding seismic responses. Therefore, the result shows that the bubble plume can be identified via seismic means, thus to lay a foundation for the study and analysis of the corresponding relation between the gas content and seismic attribute.

After formulating the migration sections of the shot-gather records for the plume, it is necessary to further analyze the correlation between the gas content and seismic response. This analysis involved extracting the seismic attributes from the seismic migration sections of different gas content to establish the relation model between the gas content and seismic attribute and invert the gas content of the plume with application of the seismic data.
The analysis technology for the seismic attribute is widely applied in stratum and lithological interpretation, reservoir evaluation and reservoir characteristics, and in detection of reservoir fluid dynamics, which plays an increasingly more important role in the exploration and development of oil and gas (Brown, 1996). Approximately 200 types of seismic attributes are applied in seismic exploration (Taner et al., 1979; Chen and Sidney, 1997). Research (You et al., 2015) shows that the gas content of the plume is relatively sensitive to the amplitude-class attributes. Therefore, three typical amplitude attributes are selected, namely, RMS amplitude, average absolute amplitude, and absolute amplitude integration.
The formulas of three extracted attribute parameters are given as follows:
RMS amplitude:
| $$ att1 = \sqrt {\frac{1}{{{n_2} - {n_1}}}\sum\limits_{n = {n_1}}^{n = {n_2}} {{A^2}(n \cdot \Delta t)} } \text{,} $$ | (2) |
Average absolute amplitude:
| $$ att2 = \frac{{\displaystyle\sum\limits_{n = {n_1}}^{n = {n_2}} {\left| {A(n \cdot \Delta t)} \right|} }}{{{n_2} - {n_1}}}\text{,} $$ | (3) |
Absolute amplitude integration:
| $$ att3 = \sum\limits_{n = {n_1}}^{n = {n_2}} \left|A {(n \cdot \Delta t)} \right|\text{.} $$ | (4) |
In each of the above formulas, attn indicates the nth extracted attribute;
To extract the attribute, seismic data need to be read from the five migration sections of the plume established in this paper. The reverse-time migration section in Fig. 5 is a 420×1 000 2D data set. The range of data belonging to the plume is the color spot area in the figure, and the remaining green area represents seawater.
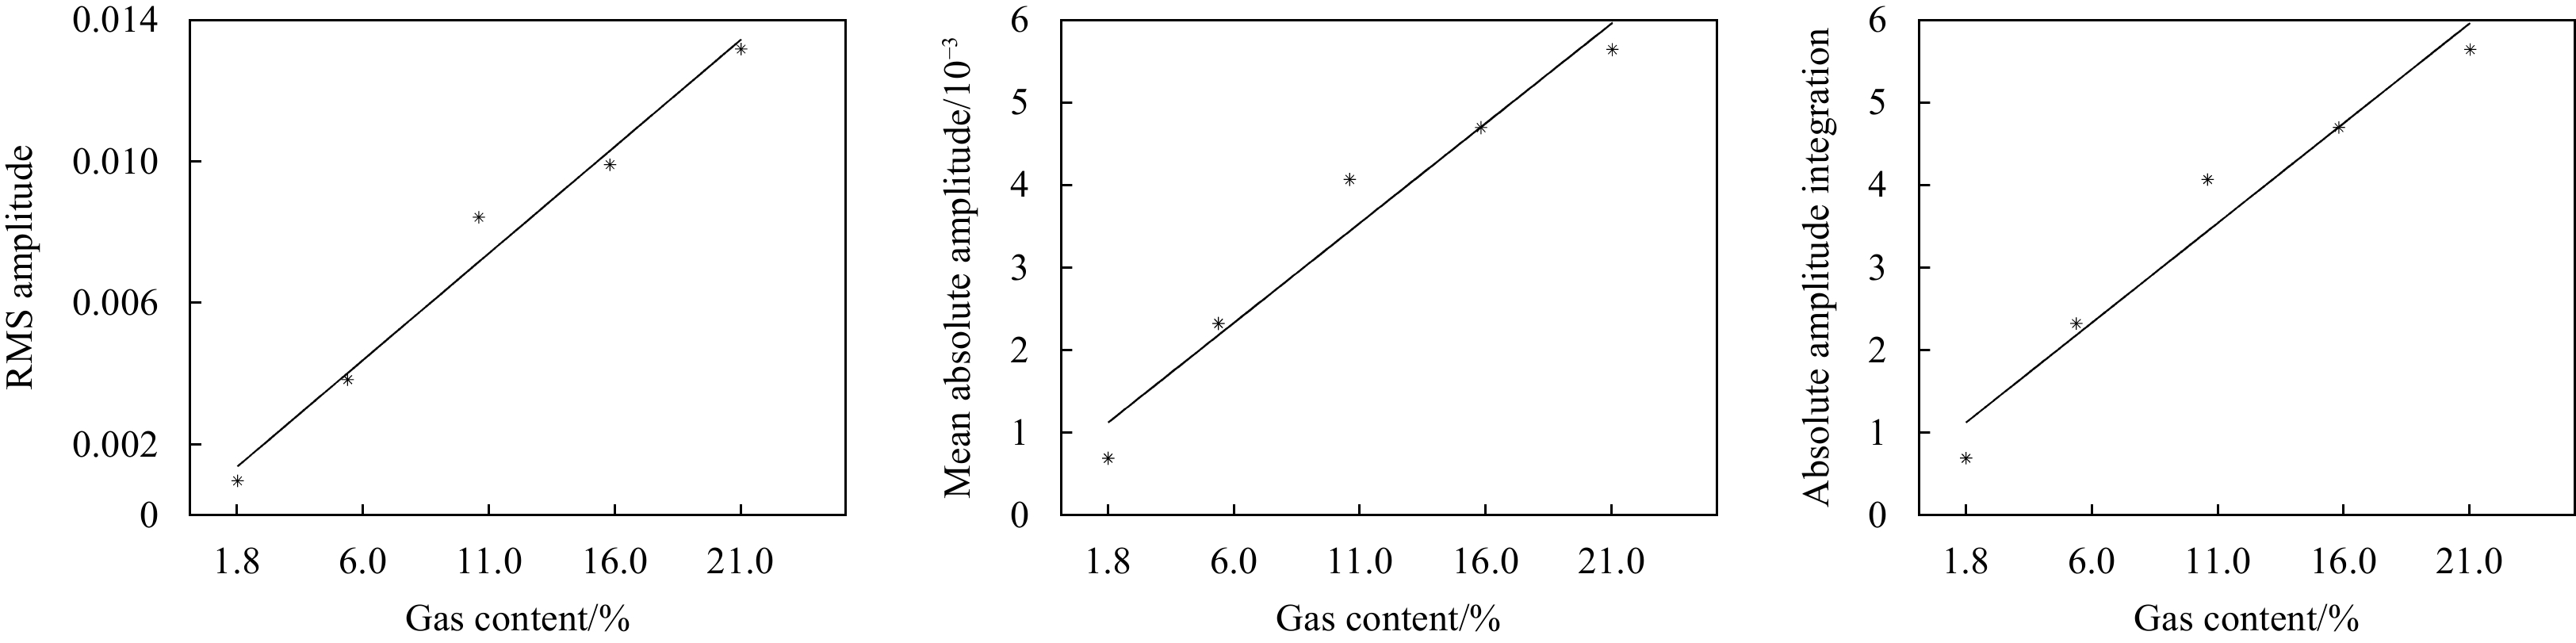
Since the plume model is distributed in formations, the data for three formations in the migration sections are selected as representatives from which to extract the seismic attribute, and the depths of three formations are described as follows: Formation 1 is located 121–130 m from the sea level, Formation 2 is located 201–210 m from the sea level, and Formation 3 is located 291–300 m from the sea level. The transverse range of the three formations consists of 451–550 traces. More specifically, a 10×100 small-rectangular 2D data body is extracted for each formation. The background gas content corresponding to the three formations of the five models is shown in Table 1.
| Model | Formation 1 | Formation 2 | Formation 3 |
| m1 | 0.018 | 0.05 | 0.030 |
| m2 | 0.060 | 0.10 | 0.076 |
| m3 | 0.110 | 0.15 | 0.120 |
| m4 | 0.160 | 0.20 | 0.176 |
| m5 | 0.210 | 0.25 | 0.226 |
 DownLoad:
CSV
DownLoad:
CSV
Three amplitude attributes are extracted for the seismic data in three formations of the migration section of five models, and the relationship between the gas content and the seismic attribute is established. The relation model between both factors is obtained by the fitting method.
According to the above method of extraction for seismic data from the migration section of the plume, the data from three formations are extracted from each section and substituted into Eqs (2)−(4) of the amplitude attribute to calculate the amplitude attribute values. With the background gas content (Table 1) of the three formations of five models used as the horizontal coordinate and the corresponding amplitude attribute values of five models applied as the longitudinal coordinate, the relationship between the gas content and the amplitude attribute of the three formations is obtained, and their scatter diagrams and trend lines are illustrated in Figs 6-8.


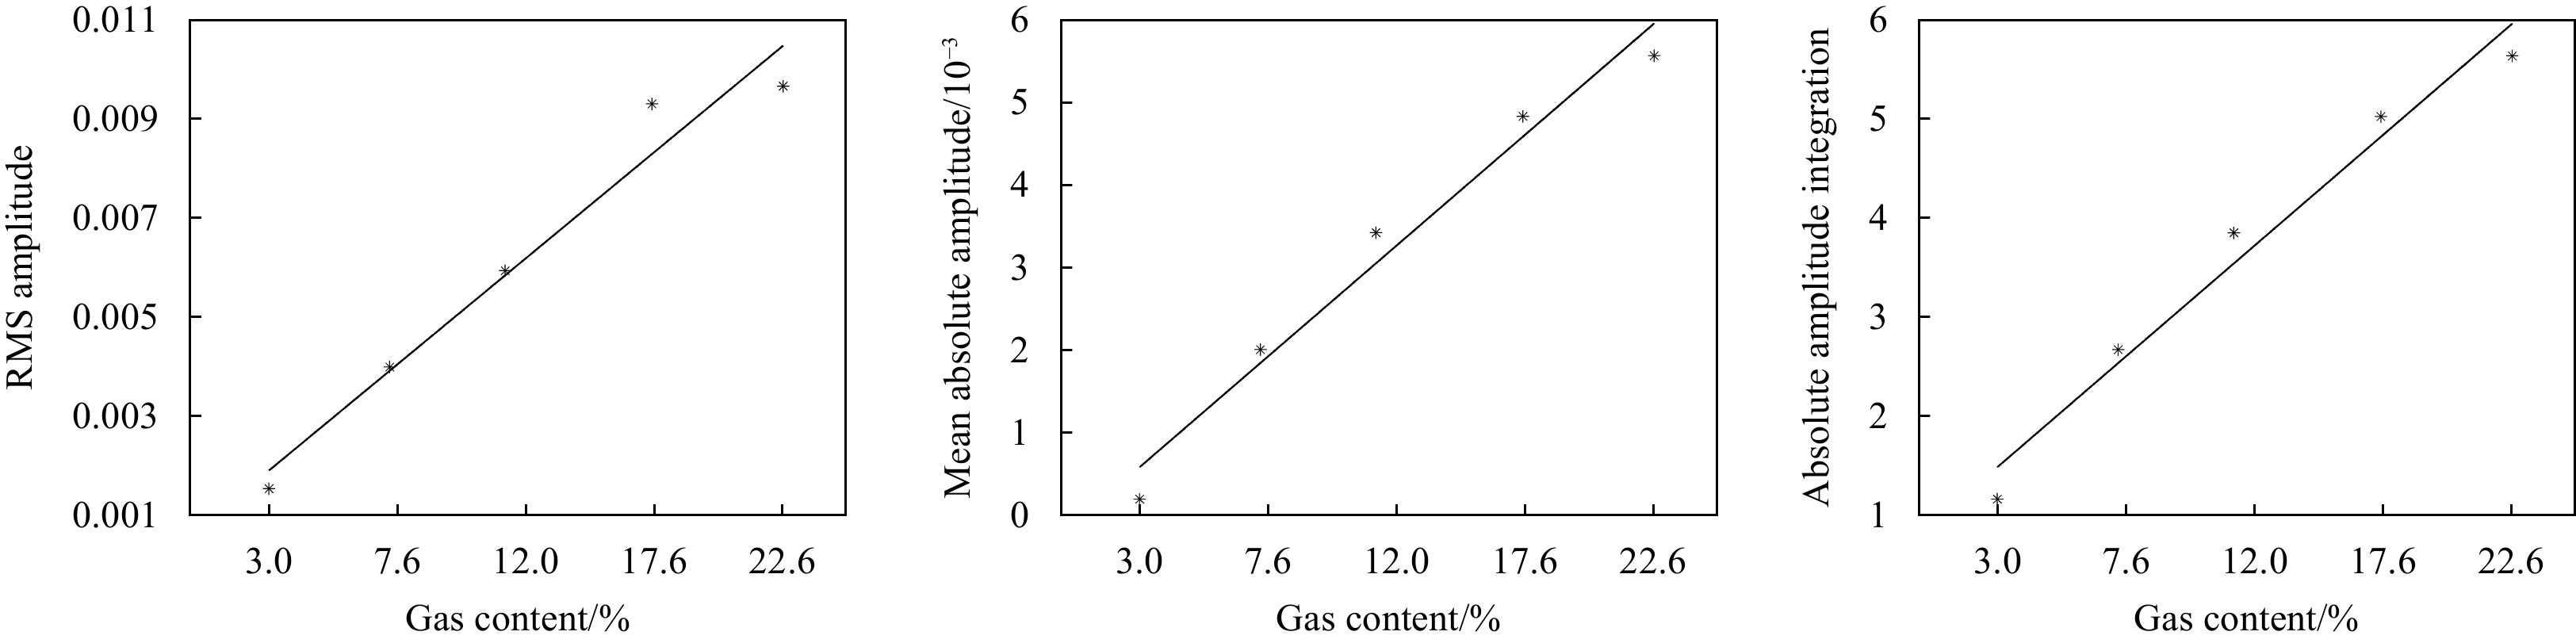
Figures 6-8 above show that in each formation, as the gas content increases, the values of three amplitude attributes correspondingly increase and present a significantly increasing trend with relatively good linear correlation. This result occurs because the gas content of the plume is correlated with the volume content, and if the gas content increases, the bubble radius also increases. Thus the scattering caused by the seismic wave is more obvious, and the energy of the scattered wave increases as well. The other reason for this result is that large bubbles splitting into small bubbles partly causes the increase in the gas content of the plume, and the random characteristics of the gas-liquid random medium are more obvious. Therefore, the scattering caused by the seismic wave is stronger, and the energy of the scattered wave also increases.
In Figs 6-8, by applying the fitting technique, the linear correlation between the gas content of the plume and the amplitude attributes of the three formations becomes more obvious. Correlation coefficients between gas content and amplitude attributes of three formations are close to 1.0, as shown in Table 2. It proves that the linear relationship between gas content and seismic attributes is very good.
| Amplitude attributes | Formation 1 | Formation 2 | Formation 3 |
| RMS amplitude | 0.989 3 | 0.997 4 | 0.980 7 |
| Average absolute amplitude | 0.977 3 | 0.994 7 | 0.985 8 |
| Absolute amplitude integration | 0.977 3 | 0.994 7 | 0.985 8 |
DownLoad:
CSV
The relation models between the gas content and the three amplitude attributes are further obtained from the fitting function, as shown in Table 3.
| Amplitude attribute | Formation 1 | Formation 2 | Formation 3 |
| RMS amplitude | y11=0.0628x11+2.5×10⁻⁴ | y21=0.0435x21+1.2×10⁻³ | y31=0.0444x31+5.9×10⁻⁴ |
| Average absolute amplitude | y12=0.0252x12+6.7×10⁻⁴ | y22=0.0191x22+1.6×10⁻³ | y32=0.0228x32+8.0×10⁻⁴ |
| Absolute amplitude integration | y13=25.2x13+0.67 | y23=19.1x23+1.6 | y33=22.8x33+0.8 |
DownLoad:
CSV
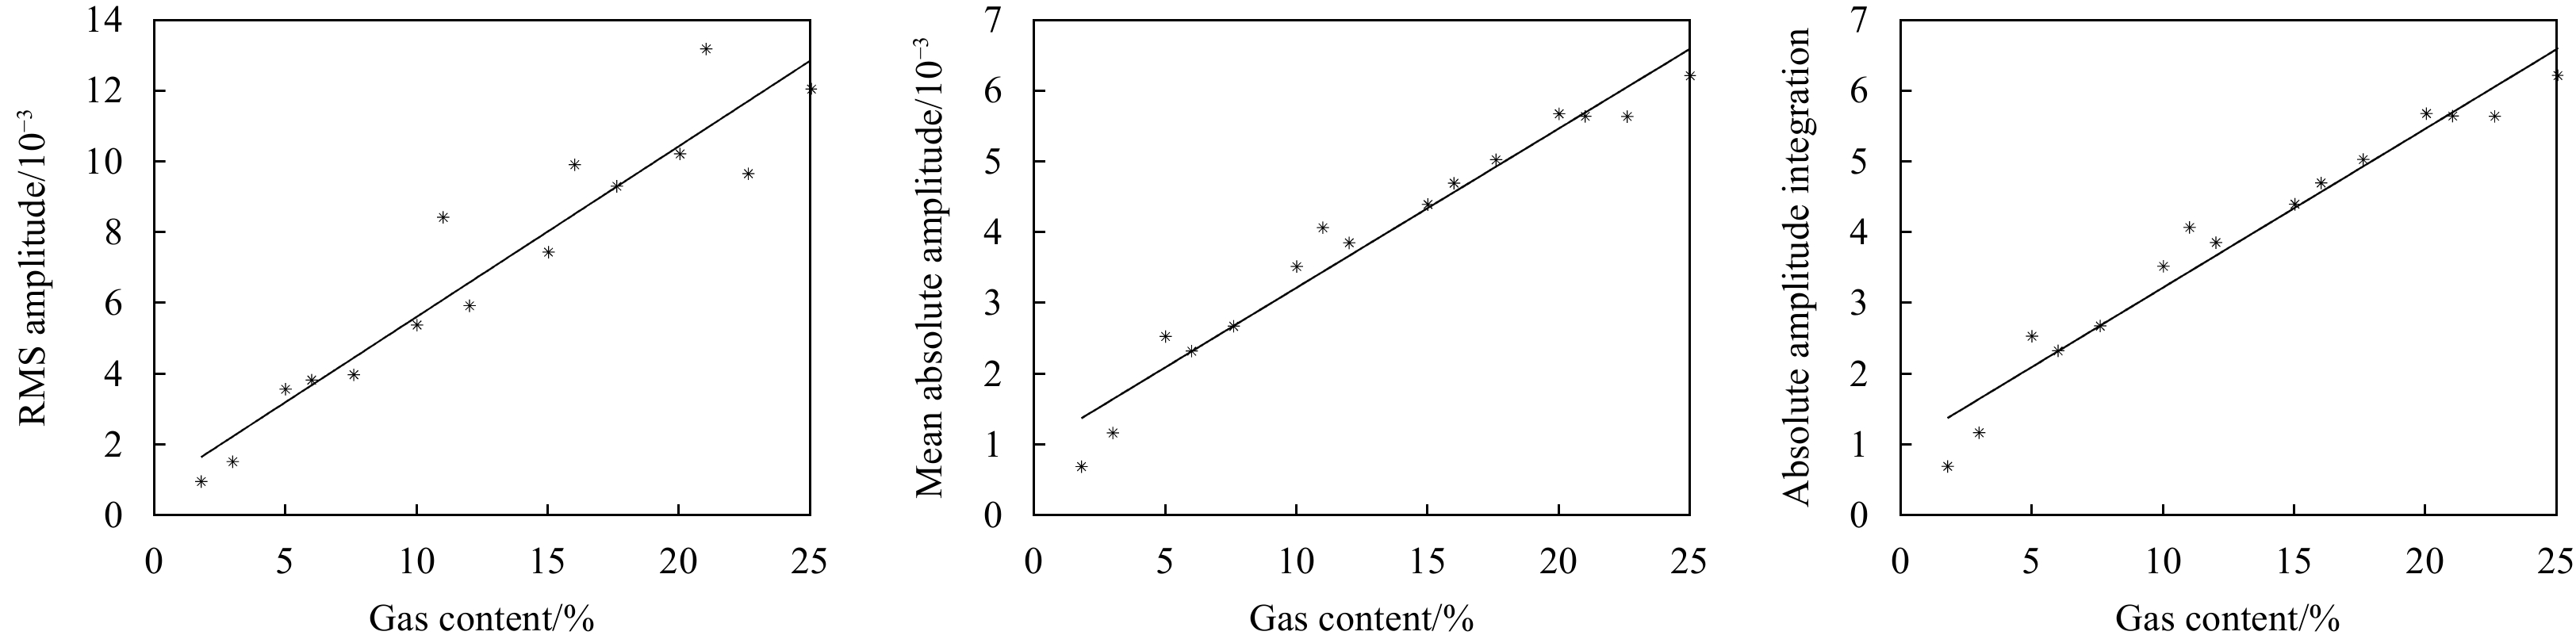
In Table 3, ynm indicates the nth formation and the mth amplitude attribute, and xnm indicates the nth formation and the gas content corresponding to the mth amplitude attribute. The table shows that the fitting relation between the gas content of the plume and the three amplitude attributes of the three formations is a linear relation that can be described using a simple linear function. The independent variable coefficients of the RMS amplitude and the average absolute amplitude are similar, the intercepts of Formation 1 and Formation 3 are similar, and the independent variable coefficients of the absolute amplitude integration of the three formations are related. Therefore, it is necessary to unify the results of the three formations and obtain a general relation model.
From above, the independent variable coefficient is similar in the fitting relation between the gas content of the plume and the three amplitude attributes of three formations. To obtain the general model of the relation between the gas content and the amplitude attribute, the gas content and the corresponding three amplitude attributes of the three formations in Table 3 are combined to obtain the overall relationship between the gas content and the three amplitude attributes (Fig. 9).

The model of the overall relation between the gas content of the plume and three seismic attributes is a linear correlation in Fig. 9. As the gas content increases, the three amplitude attributes present a significantly increasing trend. Using the linear fitting method, the comprehensive fitting relation model between the gas content of the plume and the three seismic attributes are obtained as follows:
Relation model between the RMS amplitude and gas content:
| $$ {y_1} = 0.048{x_1} + 7.99 \times {10^{ - 4}}\text{.} $$ | (5) |
Relation model between the average absolute amplitude and gas content:
| $$ {y_2} = 0.023{x_2} + 9.68 \times {10^{ - 4}}\text{.} $$ | (6) |
Relation model between the absolute amplitude integration and gas content:
| $$ {y_3} = 22.51{x_3} + 0.968\text{.} $$ | (7) |
In the above expression, yn indicates the nth amplitude attribute, and xn indicates the gas content corresponding to the nth amplitude attribute.
In Fig. 9, correlation coefficients between gas content and amplitude attributes are close to 1.0, as drawn in Table 4. It also shows that the linear relationship between gas content and seismic attributes is very good.
| Amplitude attributes | RMS amplitude | Average absolute amplitude | Absolute amplitude integration |
| Correlation coefficients | 0.949 5 | 0.977 7 | 0.977 7 |
DownLoad:
CSV
The above result laid a good foundation for inversion of the gas content of the real plume data in the next step.
The models of the comprehensive fitting relation between the gas content of the plume and the three amplitude attributes (Eqs (5)−(7)) are obtained from research on numerical simulation of the plume, as described previously, and in this section, the relational models are applied to a real seismic data-bearing plume. In the relational models, yn indicates the nth amplitude attribute. Therefore, the seismic amplitude section of the real plume is first converted to an amplitude attribute section, and the attribute section is converted to the gas content section through the fitting relation model.
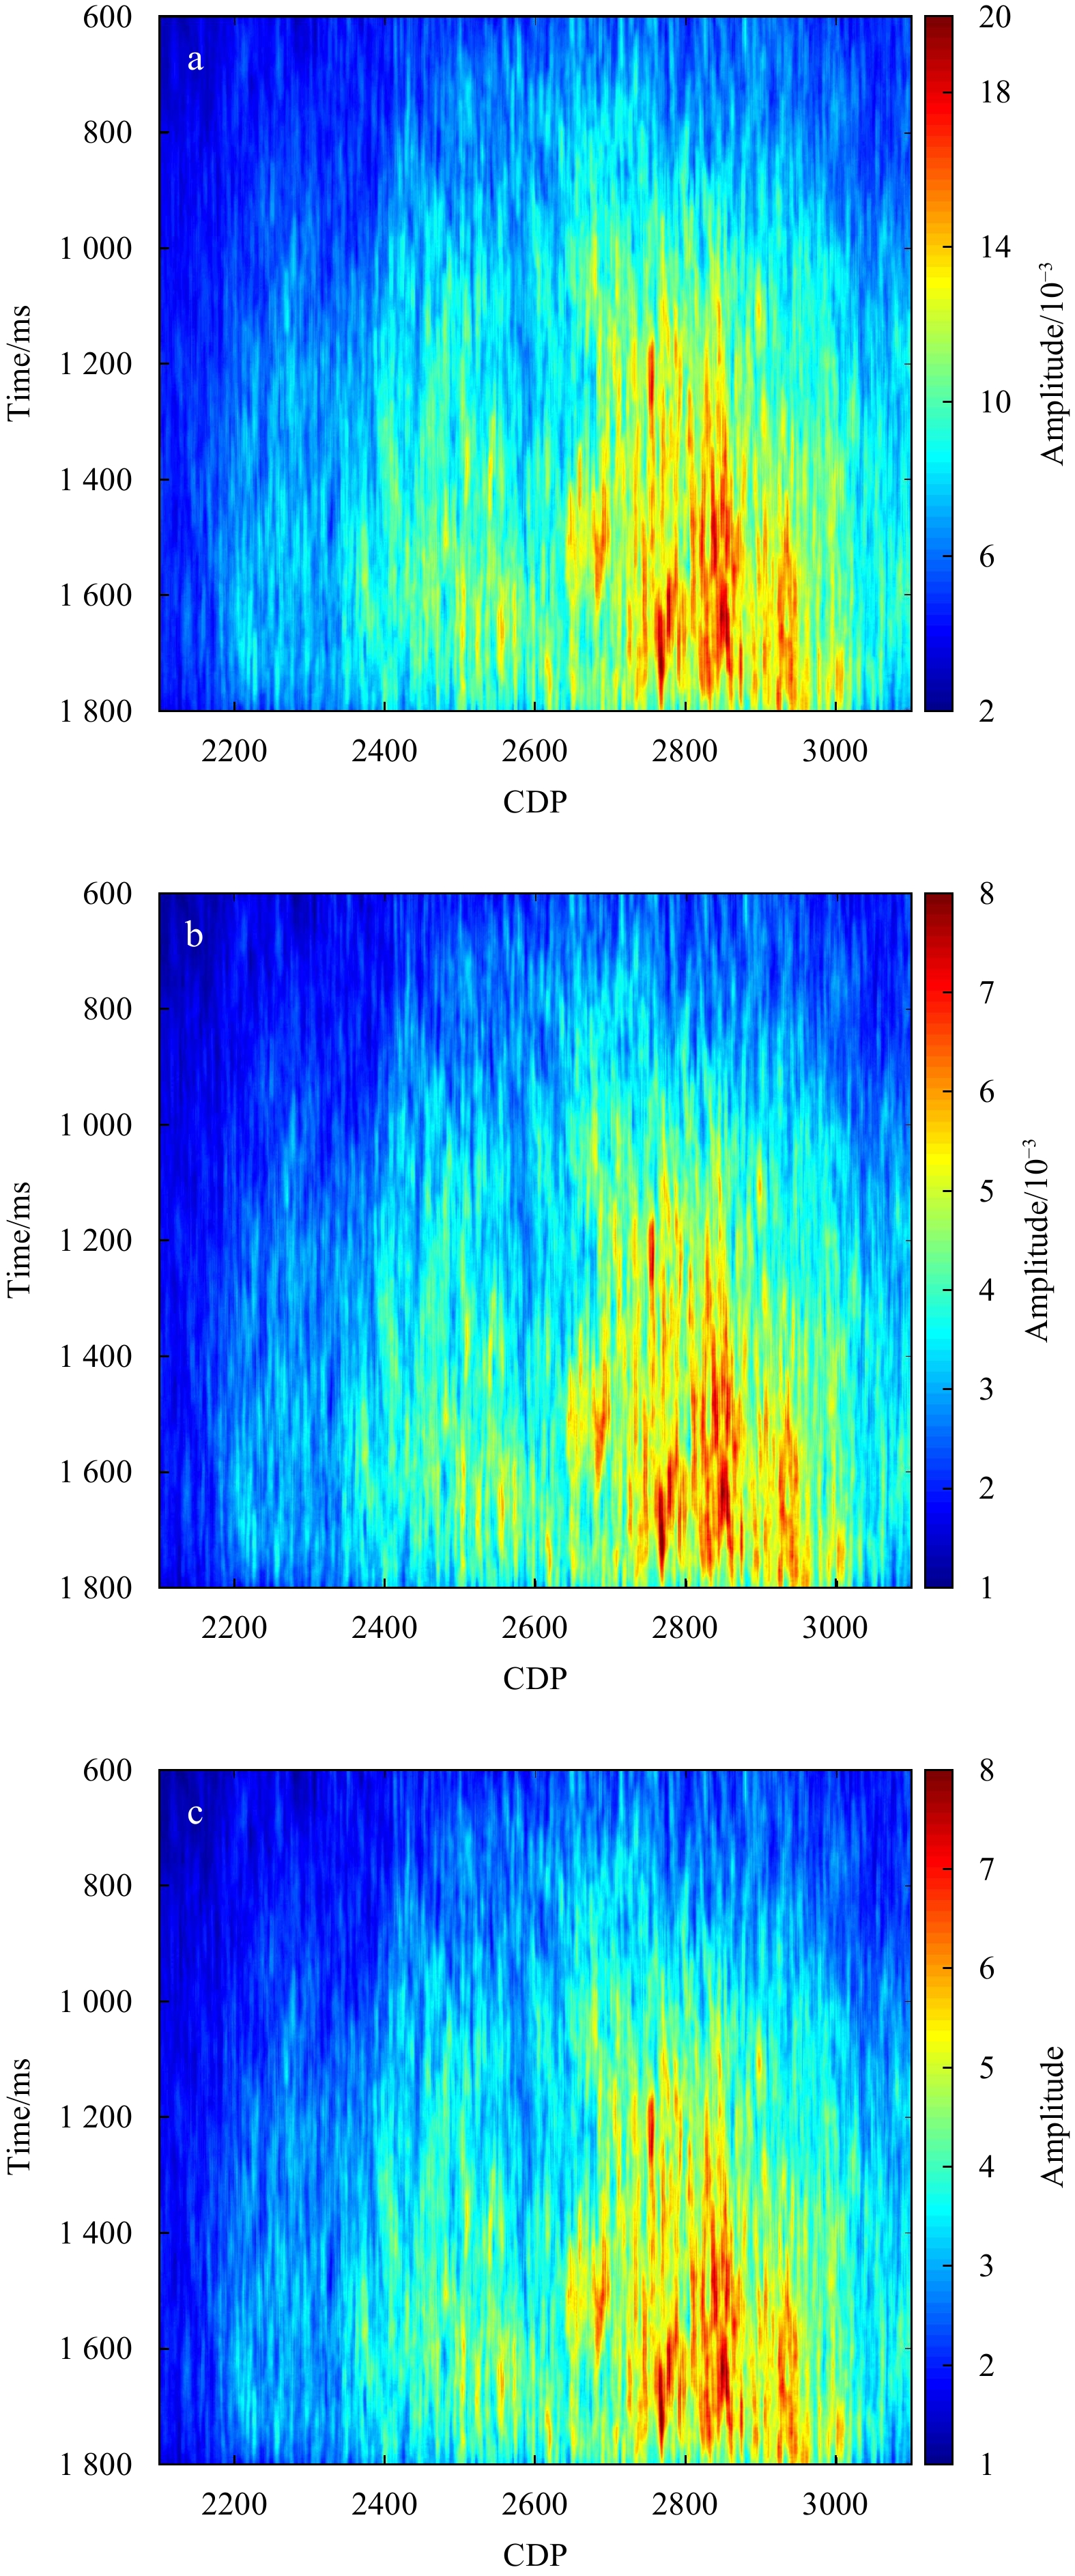
The seismic migration section of the plume is shown in Fig. 10 for a certain survey area in the South China Sea. Because the amount of data is large, only the data at the position of the dark color are selected in the section, which indicates that the plume bubble is dense with large content. The range of data selected is 1 000 traces (CDP 2101–3100) in the transverse direction. Six hundred sampling points are collected in time (the sampling interval is 2 ms), from 600 ms to 1 800 ms, and the data collected form a 600×1 000 2D array. A 50×5 small time window 2D array is selected from Column 1 to Column 5 and from Row 1 to Row 50 in the 600×1 000 2D array and substituted into Eqs (2)−(4) of the amplitude attribute to obtain three amplitude attributes. The small time window is shifted longitudinally, and one sampling point is shifted each time to obtain three amplitude attributes in every shift. When the small time window is shifted to Row 600 longitudinally, and the small time window is shifted from Column 2 to Column 6 transversely, the longitudinal shift is repeated. One sampling point is shifted each time to obtain three amplitude attributes in every shift to eventually obtain three 551×996 2D amplitude attribute sections (Fig. 11).


By extracting the amplitude attribute in the range of 600–1 800 ms in the longitudinal direction and 1 801–2 800 traces in the transverse direction in the section of real plume (Fig. 10), three sections of the amplitude attribute (Fig. 11) are obtained. The light and dark colors in the figure show that the attribute section of the plume is the same as the distribution situation of the corresponding position in the seismic section: the color of the section in the lower right corner is dark, which shows that the amplitude value is large, the scattering energy is strong, and the distribution of plume bubble is dense. Therefore, further work can be performed. Using the relation model between the gas content and the seismic attribute, the three sections of the amplitude attribute in Fig. 11 are converted to three sections of gas content.
Using the attribute sections obtained from above section, the amplitude attribute values in three 2D attribute sections are substituted into Eqs (5)−(7) of the overall relation model between the gas content of the plume and the amplitude attribute to invert the gas content and obtain three corresponding gas content sections of the plume (Fig. 12).

In Fig. 12, the range of the three gas content sections remains nearly the same for values below 0.4, namely, 40%. The value of the gas content inverted by the RMS amplitude attribute is large, amounting to 40%. The gas content inverted by the average absolute amplitude and absolute amplitude integration is similar for values less than 0.35, namely, 35%. Thus, the three amplitude attributes could be integrated in actual application to invert the gas content.
The inverted gas content in Fig. 12 seems to be relatively high. This may be related to the setting of gas content in the numerical simulation. In order to produce obvious seismic response of plumes, the background gas content S0 is a little large in Fig. 3. The relation model between gas content and amplitude attribute is obtained by numerical simulation, and the gas content of a real plume in Fig. 10 is inversed by the relation model. Therefore, the higher gas content inverted may be caused by the higher gas content in the simulation. Moreover, it is believed that the estimated gas content is a relative value. That means small gas content can also be estimated when magnitudes of seismic response of plumes are relatively small.
Compared with the seismic section of the real plume (Fig. 10), the attribute section (Fig. 11) and the gas content section (Fig. 12), the three types of sections have common distribution characteristics, namely, the color of the section in the lower right corner is dark, the corresponding attribute value is large if the amplitude value is large, and the inverted gas content value is correspondingly large (because the gas content and the amplitude attribute present a linear correlation), which shows that the distribution of the plume bubble is dense. Therefore, the seismic section of the real plume is inverted into the gas content section of the plume, which can intuitively reflect the distribution situation of the bubble content.
To study the seismic response characteristics caused by the plume and further invert the gas content of the plume, the plume model is established based on the equivalent medium theory and random medium theory. To analyze the difference in the corresponding seismic response caused by the change in the gas content of the plume, five plume models of gradually increasing gas content are established. A relatively high quality seismic migration section of the plume is obtained by processing the seismic data using pre-stack reverse-time migration.
Three amplitude-class attributes (RMS amplitude, average absolute amplitude and absolute amplitude integration) are extracted for three formations of the five seismic migration sections of the plume to obtain the relationship between the gas content and the seismic attribute. As the gas content increases, the amplitude attribute value significantly increases, and the linear correlation is relatively good, and correlation coefficients between gas content and amplitude attributes are close to 1.0. The relation model between both factors is obtained using linear fitting. To obtain a unified relation model between the gas content and the seismic attribute, three amplitude attributes of the three formations of the plume are combined to obtain the overall relation model of the gas content and seismic attribute.
To invert the gas content of the real plume, the seismic section of the real plume is first converted to the attribute section. Then, the overall relation model between the gas content and seismic attribute obtained is used to back-calculate the gas content to obtain the gas content section. The gas content section of the plume is compared with the attribute section and real seismic section to show that they share common distribution characteristics. Specifically, the color of section in the lower right corner is dark. If the amplitude value of the seismic section of the real plume is large, the amplitude attribute value of the corresponding attribute section is large, and the inverted value of the gas content is correspondingly large (because the gas content and the amplitude attribute present a linear correlation), which indicates that the plume bubbles of the section in the lower right corner are intensively distributed.
The gas content section of the plume that is finally obtained is able to more simply and intuitively reflect the distribution situation of plume bubble content, from which the distribution law of the seafloor bubbles can be deduced. The relation model between the gas content and the seismic attribute in this paper is a preliminary result, and its practicability must be further discussed and verified. Nevertheless, this work represents important progress in seismic research on the plume.
We thank Xuewei Liu from China University of Geosciences in Beijing for making the bubble plume migration section (Figs 2a and 10) and the seismic migration section available (Fig. 2b) in the South China Sea.
| [1] |
Brown A R. 1996. Seismic attributes and their classification. The Leading Edge, 15(10): 1090. doi: 10.1190/1.1437208
|
| [2] |
Charlou J L, Donval J P, Zitter T, et al. 2003. Evidence of methane venting and geochemistry of brines on mud volcanoes of the eastern Mediterranean Sea. Deep Sea Research Part I: Oceanographic Research Papers, 50(8): 941–958. doi: 10.1016/s0967-0637(03)00093-1
|
| [3] |
Chen Yilan, Ding Jisheng, Zhang Haiquan, et al. 2019. Multibeam water column data research in the Taixinan Basin: implications for the potential occurrence of natural gas hydrate. Acta Oceanologica Sinica, 38(5): 129–133. doi: 10.1007/s13131-019-1444-0
|
| [4] |
Chen Q, Sidney S. 1997. Seismic attribute technology for reservoir forecasting and monitoring. The Leading Edge, 16(5): 445–450. doi: 10.1190/1.1437657
|
| [5] |
Chen Jiangxin, Tong Siyou, Han Tonggang, et al. 2020. Modelling and detection of submarine bubble plumes using seismic oceanography. Journal of Marine Systems, 209: 103375. doi: 10.1016/j.jmarsys.2020.103375
|
| [6] |
Di Pengfei, Feng Dong, Gao Libao, et al. 2008. In situ measurement of fluid flow and signatures of seep activity at marine seep sites. Progress in Geophysics (in Chinese), 23(5): 1592–1602
|
| [7] |
Duan Peiran, Luan Xiwu, Yu Yi, et al. 2020. Numerical simulation of seismic waves of bubble plumes in submarine cold seepages. Chinese Journal of Geophysics (in Chinese), 63(2): 753–765. doi: 10.6038/cjg2020M0533
|
| [8] |
Freire A F M, Matsumoto R, Santos L A. 2011. Structural-stratigraphic control on the Umitaka Spur gas hydrates of Joetsu Basin in the eastern margin of Japan Sea. Marine and Petroleum Geology, 28(10): 1967–1978. doi: 10.1016/j.marpetgeo.2010.10.004
|
| [9] |
Fu Chao, Li Shengli, Yu Xinghe, et al. 2019. Patterns of gas hydrate accumulation in mass transport deposits related to canyon activity: example from Shenhu drilling area in the South China Sea. Acta Oceanologica Sinica, 38(5): 118–128. doi: 10.1007/s13131-019-1443-1
|
| [10] |
Matsumoto R, Gong Jianming. 2006. Methane plumes over a marine gas hydrate system in the eastern margin of the Sea of Japan: a proposed mechanism for the transport of significant subsurface methane to shallow waters. Marine Geology Letters (in Chinese), 22(5): 33. doi: 10.16028/j.1009-2722.2006.05.009
|
| [11] |
Greinert J, Artemov Y, Egorov V, et al. 2006. 1300-m-high rising bubbles from mud volcanoes at 2080 m in the Black Sea: hydroacoustic characteristics and temporal variability. Earth and Planetary Science Letters, 244(1–2): 1–15. doi: 10.1016/j.jpgl.2006.02.011
|
| [12] |
Heeschen K U, Tréhu A M, Collier R W, et al. 2003. Distribution and height of methane bubble plumes on the Cascadia Margin characterized by acoustic imaging. Geophysical Researcher Letters, 30(12): 1643. doi: 10.1029/2003gl016974
|
| [13] |
Korn M. 1993. Seismic waves in random media. Journal of Applied Geophysics, 29(3–4): 247–269. doi: 10.1016/0926-9851(93)90007-L
|
| [14] |
Li Canping, Gou Limin, You Jiachun, et al. 2016. Further studies on the numerical simulation of bubble plumes in the cold seepage active region. Acta Oceanologica Sinica, 35(1): 118–124. doi: 10.1007/s13131-016-0803-3
|
| [15] |
Li Canping, Gou Limin, You Jiachun. 2017. Numerical simulation of bubble plumes and an analysis of their seismic attributes. Journal of Ocean University of China, 16(2): 223–232. doi: 10.1007/s11802-017-3069-2
|
| [16] |
Li Canping, Liu Xuewei, Gou Limin, et al. 2013. Numerical simulation of bubble plumes in overlying water of gas hydrate in the cold seepage active region. Science China: Earth Sciences, 56(4): 579–587. doi: 10.1007/s11430-012-4508-y
|
| [17] |
Liu Shanqi, Yin Fengling, Zhu Bojing, et al. 2015. Numerical simulation on the formation of cold seepage. Chinese Journal of Geophysics (in Chinese), 58(5): 1731–1741. doi: 10.6038/cjg20150523
|
| [18] |
Luan Xiwu, Liu Hong, Yue Baojing. 2010. Characteristics of cold seepage on side scan sonar sonogram. Geoscience (in Chinese), 24(3): 474–480. doi: 10.3969/j.issn.1000-8527.2010.03.009
|
| [19] |
Mavko G, Mukerji T, Dvorkin J. 2003. The Rock Physics Handbook: Tools for Seismic Analysis of Porous Media. Cambridge: Cambridge University Press, 106–142
|
| [20] |
Sassen R, Losh S L, Cathles III L, et al. 2001. Massive vein-filling gas hydrate: relation to ongoing gas migration from the deep subsurface in the Gulf of Mexico. Marine and Petroleum Geology, 18(5): 551–560. doi: 10.1016/S0264-8172(01)00014-9
|
| [21] |
Sauter E J, Muyakshin S I, Charlou J L, et al. 2006. Methane discharge from a deep-sea submarine mud volcano into the upper water column by gas hydrate-coated methane bubbles. Earth and Planetary Science Letters, 243(3–4): 354–365. doi: 10.1016/j.jpgl.2006.01.041
|
| [22] |
Shipboard Scientific Party. 2002. Drilling gas hydrates on hydrate ridge, Cascadia continental margin. In: Leg 204 Preliminary Report. College Station, TX: Texas A&M University
|
| [23] |
Taner M T, Koehler F, Sheriff R E. 1979. Complex seismic trace analysis. Geophysics, 44(6): 1041–1063. doi: 10.1190/1.1440994
|
| [24] |
Tryon M D, Brown K M. 2004. Fluid and chemical cycling at Bush Hill: implications for gas-and hydrate-rich environments. Geochemistry, Geophysics, Geosystems, 5(12): Q12004. doi: 10.1029/2004gc000778
|
| [25] |
Tryon M D, Brown K M, Torres M E. 2002. Fluid and chemical flux in and out of sediments hosting methane hydrate deposits on Hydrate Ridge, OR, II: hydrological processes. Earth and Planetary Science Letters, 201(3–4): 541–557. doi: 10.1016/s0012-821x(02)00732-x
|
| [26] |
Wu Rushan, Aki K. 1993. Scattering and Attenuation of Seismic Waves (in Chinese). Li Yuche, Lu Shoude, trans. Beijing: Seismic Press, 1–5
|
| [27] |
Xia Jie, Pang Zhaojun, Jin Dongping. 2012. Inner resonance of an in-plane elastic tethered satellite system. Journal of Vibration Engineering (in Chinese), 25(3): 232–237. doi: 10.3969/j.issn.1004-4523.2012.03.002
|
| [28] |
You Jiachun, Li Canping, Cheng Lifang, et al. 2015. Numerical simulation of methane plumes based on effective medium theory. Arabian Journal of Geosciences, 8(11): 9089–9100. doi: 10.1007/s12517-015-1916-2
|
| [29] |
Yuan Wenjun, Shang Yadong, Huang Yong, et al. 2013. The representation of meromorphic solutions to certain ordinary differential equations and its applications. Scientia Sinica Mathematica, 43(6): 563–575. doi: 10.1360/012012-159
|

Figures(12) / Tables(4)

Supported by:
Beijing Renhe Information Technology Co. Ltd

Canping Li, Jiachun You, Yanchun Tan, Fengying Chen, Yilin Liu, Zihao Guo, Xinyu Tian. Forward modeling and inversion of the relation model between the gas content of plume and its seismic attribute[J]. Acta Oceanologica Sinica, 2021, 40(5): 120-128. doi: 10.1007/s13131-021-1737-y

| Model | Formation 1 | Formation 2 | Formation 3 |
| m1 | 0.018 | 0.05 | 0.030 |
| m2 | 0.060 | 0.10 | 0.076 |
| m3 | 0.110 | 0.15 | 0.120 |
| m4 | 0.160 | 0.20 | 0.176 |
| m5 | 0.210 | 0.25 | 0.226 |
DownLoad:
CSV
| Amplitude attributes | Formation 1 | Formation 2 | Formation 3 |
| RMS amplitude | 0.989 3 | 0.997 4 | 0.980 7 |
| Average absolute amplitude | 0.977 3 | 0.994 7 | 0.985 8 |
| Absolute amplitude integration | 0.977 3 | 0.994 7 | 0.985 8 |
DownLoad:
CSV
| Amplitude attribute | Formation 1 | Formation 2 | Formation 3 |
| RMS amplitude | y11=0.0628x11+2.5×10⁻⁴ | y21=0.0435x21+1.2×10⁻³ | y31=0.0444x31+5.9×10⁻⁴ |
| Average absolute amplitude | y12=0.0252x12+6.7×10⁻⁴ | y22=0.0191x22+1.6×10⁻³ | y32=0.0228x32+8.0×10⁻⁴ |
| Absolute amplitude integration | y13=25.2x13+0.67 | y23=19.1x23+1.6 | y33=22.8x33+0.8 |
DownLoad:
CSV
| Amplitude attributes | RMS amplitude | Average absolute amplitude | Absolute amplitude integration |
| Correlation coefficients | 0.949 5 | 0.977 7 | 0.977 7 |
DownLoad:
CSV
| Model | Formation 1 | Formation 2 | Formation 3 |
| m1 | 0.018 | 0.05 | 0.030 |
| m2 | 0.060 | 0.10 | 0.076 |
| m3 | 0.110 | 0.15 | 0.120 |
| m4 | 0.160 | 0.20 | 0.176 |
| m5 | 0.210 | 0.25 | 0.226 |
| Amplitude attributes | Formation 1 | Formation 2 | Formation 3 |
| RMS amplitude | 0.989 3 | 0.997 4 | 0.980 7 |
| Average absolute amplitude | 0.977 3 | 0.994 7 | 0.985 8 |
| Absolute amplitude integration | 0.977 3 | 0.994 7 | 0.985 8 |
| Amplitude attribute | Formation 1 | Formation 2 | Formation 3 |
| RMS amplitude | y11=0.0628x11+2.5×10⁻⁴ | y21=0.0435x21+1.2×10⁻³ | y31=0.0444x31+5.9×10⁻⁴ |
| Average absolute amplitude | y12=0.0252x12+6.7×10⁻⁴ | y22=0.0191x22+1.6×10⁻³ | y32=0.0228x32+8.0×10⁻⁴ |
| Absolute amplitude integration | y13=25.2x13+0.67 | y23=19.1x23+1.6 | y33=22.8x33+0.8 |
| Amplitude attributes | RMS amplitude | Average absolute amplitude | Absolute amplitude integration |
| Correlation coefficients | 0.949 5 | 0.977 7 | 0.977 7 |
 DownLoad:


 DownLoad: