
Figure
1.
Location of sediment core GA306-GC4 and other records mentioned in the text. Modern surface circulation in the studied area is indicated by arrows.
| Citation: | Longbin Sha, Dongling Li, Yanguang Liu, Bin Wu, Yanni Wu, Karen Luise Knudsen, Zhongqiao Li, Hao Xu. Biogenic silica concentration as a marine primary productivity proxy in the Holsteinsborg Dyb, West Greenland, during the last millennium[J]. Acta Oceanologica Sinica, 2020, 39(9): 78-85. doi: 10.1007/s13131-020-1648-3

|
Since 1978, Arctic sea ice concentration has decreased by ~9% every decade, accompanied by a decrease in its thickness and duration (Comiso, 2012; Maslanik et al., 2011; Perovich and Richter-Menge, 2009). The thinning and recession of Arctic sea ice is one of the most significant consequences of recent climate change, and sea ice has a very important impact on the functioning of the Arctic ecosystem (Wassmann et al., 2011). In the Arctic Ocean, net primary production has increased by ~30% over the past two decades (Ribeiro et al., 2017), largely due to the retreat of sea ice. 74% and 77% of the variance in annual net primary production can be explained by the increase in the open water area (May–September) and the length of the open water season, respectively (Arrigo and van Dijken, 2015). However, this model is not consistent in the Arctic, as primary production is reported to have declined by ~15% (45°W to 15°E) in Greenland (Arrigo and van Dijken, 2015). Studies of the latitudinal gradient of sea ice cover around Greenland show that sea ice has a significant impact on the productivity of both primary (Krause-Jensen et al., 2012) and secondary producers (Sejr et al., 2009), suggesting that any future changes in sea ice cover will significantly affect marine ecosystems.
Siliceous phytoplankton makes an important contribution to the primary production of the world’s oceans. Van Cappellen et al. (2002) estimated that, as a major primary producer, diatoms account for up to 40% of global primary production, and 75% of coastal and nutrient-rich waters (Liu et al., 2008; Nelson et al., 1995). Biological silicon (BSi), known as biogenic opal, is produced by siliceous organisms (mainly diatoms) in the ocean. Consequently, diatoms preserved in sediments provide a record of diatom productivity and therefore of total phytoplankton productivity. However, the relationship is rather complex (Colman and Bratton, 2003). The dissolution of BSi begins after the death of these organisms and continues within deep water and after the deposition of BSi in surface sediments (van der Weijden and van der Weijden, 2002). The dissolution and preservation of BSi plays a key role in the biogeochemical silicon cycle in the ocean, which is related to the carbon cycle (DeMaster, 2002; Liu et al., 2005; Ragueneau et al., 2000; Schlüter and Sauter, 2000).
BSi has previously been used to track climate-related changes in aquatic production on millennial and orbital time scales (Colman and Bratton, 2003; Hu et al., 2003). Romero and Hebbeln (2003) observed a good correlation between BSi in sediments and primary production in the overlying water column in the region of the Peru-Chile upwelling, with a higher BSi content indicating higher primary production.
Diatoms are good indicators of past climate and environmental changes in the North Atlantic because of their near ubiquity in the marine environment and their high sensitivity to environmental and ecological conditions (Jiang et al., 2001, 2015; Koc Karpuz and Schrader, 1990). Diatom-based transfer function for paleo sea-surface temperature reconstructions have been widely applied in the North Atlantic (Jiang et al., 2005, 2015; Justwan et al., 2008; Krawczyk et al., 2017; Li et al., 2017; Miettinen et al., 2015).
Up to now, little research has been done on the relationship between variations in summer sea surface temperature (SST) and sea ice cover and primary productivity in the Labrador Sea during the last millennium. In order to place changes in a longer-term context and to better constrain future scenarios for this region, it is necessary to reconstruct these key parameters in order to determine their inter-relationships on a multi-decadal-to-millennial time scale.
Holsteinsborg Dyb is a deep buried valley that passes southwest through the western continental shelf of Greenland from the town of Sisimiut. It appears to be repeatedly eroded and then filled with Quaternary sediments (Lykke-Andersen and Knudsen, 2007) (Fig. 1). It is a deep west-south-west-oriented trench which extends for ~60 km into the middle continental shelf and then shallows, due to the influence of an estuarine fan, at the edge of the continental shelf (Lykke-Andersen and Knudsen, 2007). Four large fjords, Amerdloq, Ikertooa, Kangerluarssuk and Itilleq Fiord, are located in the eastern part of Holsteinsborg Dyb, consistent with one of the main thrust forces of Ikertooq Fjord (Jensen et al., 2002) (Fig. 1).
The hydrology in West Greenland is controlled by the northward flow of the West Greenland Current, which is composed of water masses from two different sources. Closest to the shore, the water mass of the East Greenland Current brings polar water masses northwards along the West Greenland coast. Along the way, the water is diluted by runoff from different fjord systems and then diverted westward to Canada at ~65°–66° N. Below this water mass and offshore, the West Greenland Current consists of a water mass from the Irminger Current from the Atlantic Ocean. This relatively warm, high salinity water mass can be traced along the west coast of Greenland to the north of Baffin Bay (Andersen, 1981; Tang et al., 2004). Flowing northwards, the Irminger Current water is gradually modified by mixing with East Greenland Current waters and meltwater from the Inland Ice and smaller ice caps (Buch, 2002; Ribergaard, 2011; Sha et al., 2012). Compared to the rest of the Arctic Ocean, there has been no significant change in annual net primary production in the Baffin Bay region (100° to 45°W) since 1998, perhaps due to a longer growing season, despite of a reduced sea ice cover (Arrigo and van Dijken, 2015).
During the Galathea 3 expedition from 25 August to 25 September 2006, a 501-cm-long gravity core GA306-GC4 was retrieved from the Helsteinsborg Dyb offshore trough located on the continental shelf of West Greenland at 66°44′41″N, 53°56′25″W (water depth 445 m). Based on the core stratigraphy, the sedimentation rate of GC4 was quite high (~0.5 cm/a) during the past 1 ka. A total of 99 samples were taken at every 5 cm from the core for measurement of BSi content and diatom abundance analysis.
Based on the combination method of Mortlock and Froelich (1989) and DeMaster (1981), the BSi content in bulk sediments was measured by the alkaline extraction technique (Liu et al., 2002, 2008). The coefficients of variation (CV) of five parallel extractions were 2.00%. The BSi data from the same sediment samples were compared between the two laboratories in order to assess the accuracy of the BSi measurements. Under the conditions of high temperature (85°C) and pH (2% Na2CO3), alkali extraction experiments were made with samples pretreated with hydrogen peroxide (H2O2) and hydrochloric acid (HCl) which could accelerate the dissolution of bio-silica. Most of the samples were dissolved in 2 h. The dissolution process lasted for 8 h, and the weight percentage of extracted silica changed with time (h–1). As reported by Koning et al. (1997) and Rickert (2000), the dissolution of BSi in an alkaline medium can be described by a first-order kinetic model (Eq. (1)):
| $$ {\left[ {{\rm{Si}}{{\rm{O}}_2}\% } \right]_t} = {\left[ {{\rm{BSi}}\% } \right]_0} \times (1 - {{\rm{e}}^{ - {k_{{\rm{Na}}_2{\rm{CO}}_3}}t}}) + {{{b}}_{{\rm{Na}}_2{\rm{CO}}_3}}t, $$ | (2) |
where [BSi%]0 is the content of BSi (wt%) in the sediment sample; [SiO2%]t is the content of SiO2 (wt%) at time t;
About 5–6 mg of freeze-dried material from each sample was weighed precisely with a precision of 0.1 mg. Based on the improved method established by the Alfred Wegener Institute for Polar and Marine Research (Gersonde and Zielinski, 2000), a permanent slide for chemical treatment and microscopic observation was prepared. 10% HCl and 30% H2O2 were added to the sample and heated to remove biogenic carbonate and organic matter, respectively. After complete digestion, the mixture was carefully stirred with distilled water and kept for 24 h to settle the particles. The supernatant was then siphoned off and the washing process was repeated four times to remove excess HCl and H2O2 as well as the reaction solution. The remaining sample was diluted to 20 mL, and then 2 mL of gelatin solution was added to accelerate the following settling process (Ran et al., 2015). The mixed sample solution was gently poured into a Petri dish, and two 22 mm×22 mm cover slides were pre-fixed in the Petri dish. After settling for 24 h, a strip of absorbent paper was used to remove the supernatant from the Petri dish (Ran et al., 2015). When the material was completely dried, the cover was transferred to the tagged carrier and sealed with Naphrax (dn=1.73). Diatoms were counted and identified using a Leica DM2500 phase contrast microscope at 1 000× magnification. Diatom flux was then calculated using the following formula:
| $$ A = \frac{{N \times S}}{{n \times a \times m}}, $$ | (1) |
where A is the diatom abundance (valves/g), N is the number of diatoms counted under microscope, S is the area of the petri dish, n is the number of fields of vision counted for diatoms under the microscope, a is the area of one field of vision, and m is the dry weight (g) of sample used for diatom analysis (Ran et al., 2015).
Summer SST was quantitatively reconstructed using the C2 package. Seven transfer function methods were assessed and the weighted averaging with partial least squares regression (WA-PLS) using two components was selected to quantitatively reconstruct summer SST (Li et al., 2017). This approach has the lowest maximum bias (2.047), low root-mean squared error of prediction based on the leave-one-out jack-knifing (1.393), and a high coefficient of determination between observed and predicted values (0.853). By comparing the observed and predicted values of the surface samples (using a cross-validation model), a good linear relationship was found, and the residuals are randomly distributed (Li et al., 2017).
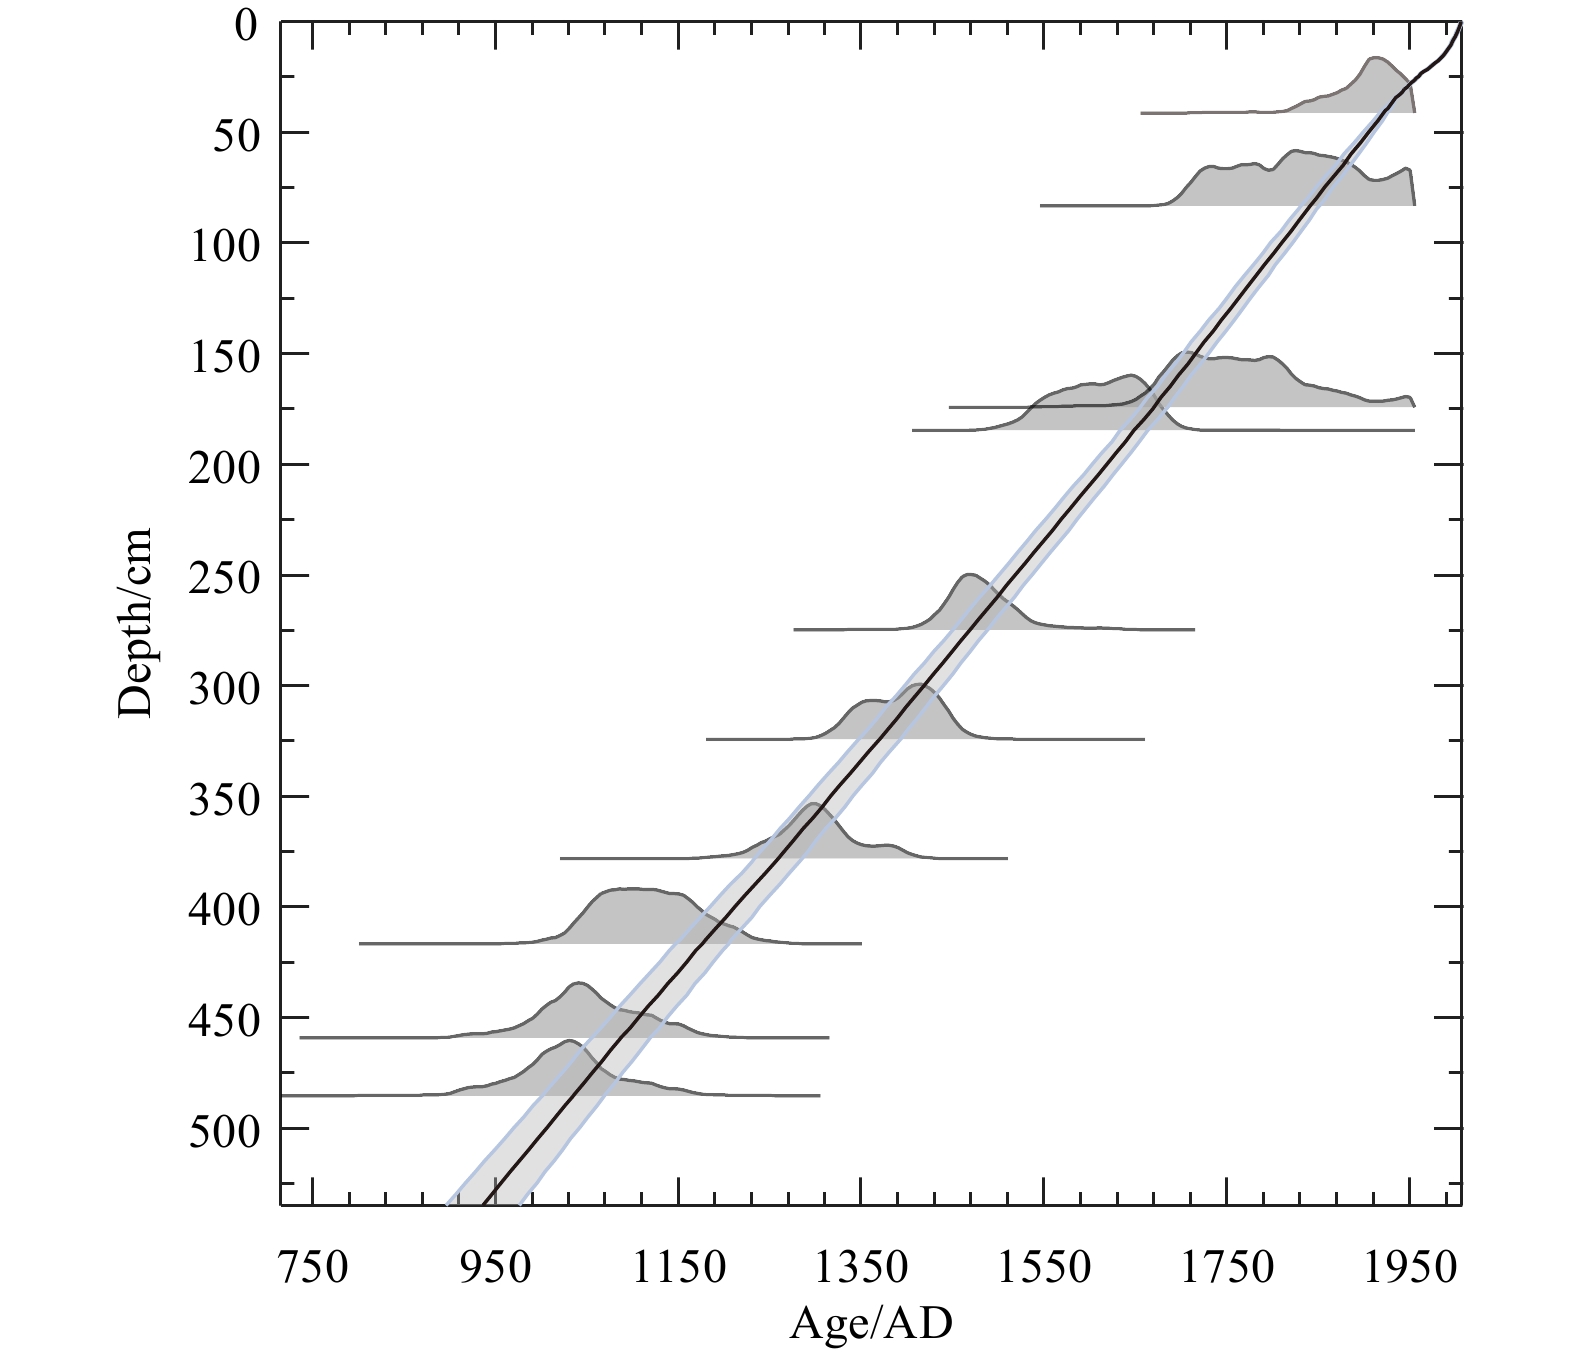
The age model for core GC4 is based on the AMS14C dating of marine mollusk shells at the AMS 14C Dating Center of Aarhus University, Denmark (Fig. 2). OxCal 4.1.3 software (Ramsey, 2009) and the Marine09 calibration data set (Reimer et al., 2009) were used to calibrate all 14C ages. A reservoir age offset (ΔR) of (140±30) a (Erbs-Hansen et al., 2013) was used to convert the 14C ages to calendar ages, which was applied given the domination of Atlantic subsurface water at the water depth of the core site. A linear sedimentation rate was assumed between the calibrated 14C age control points (Fig. 2).
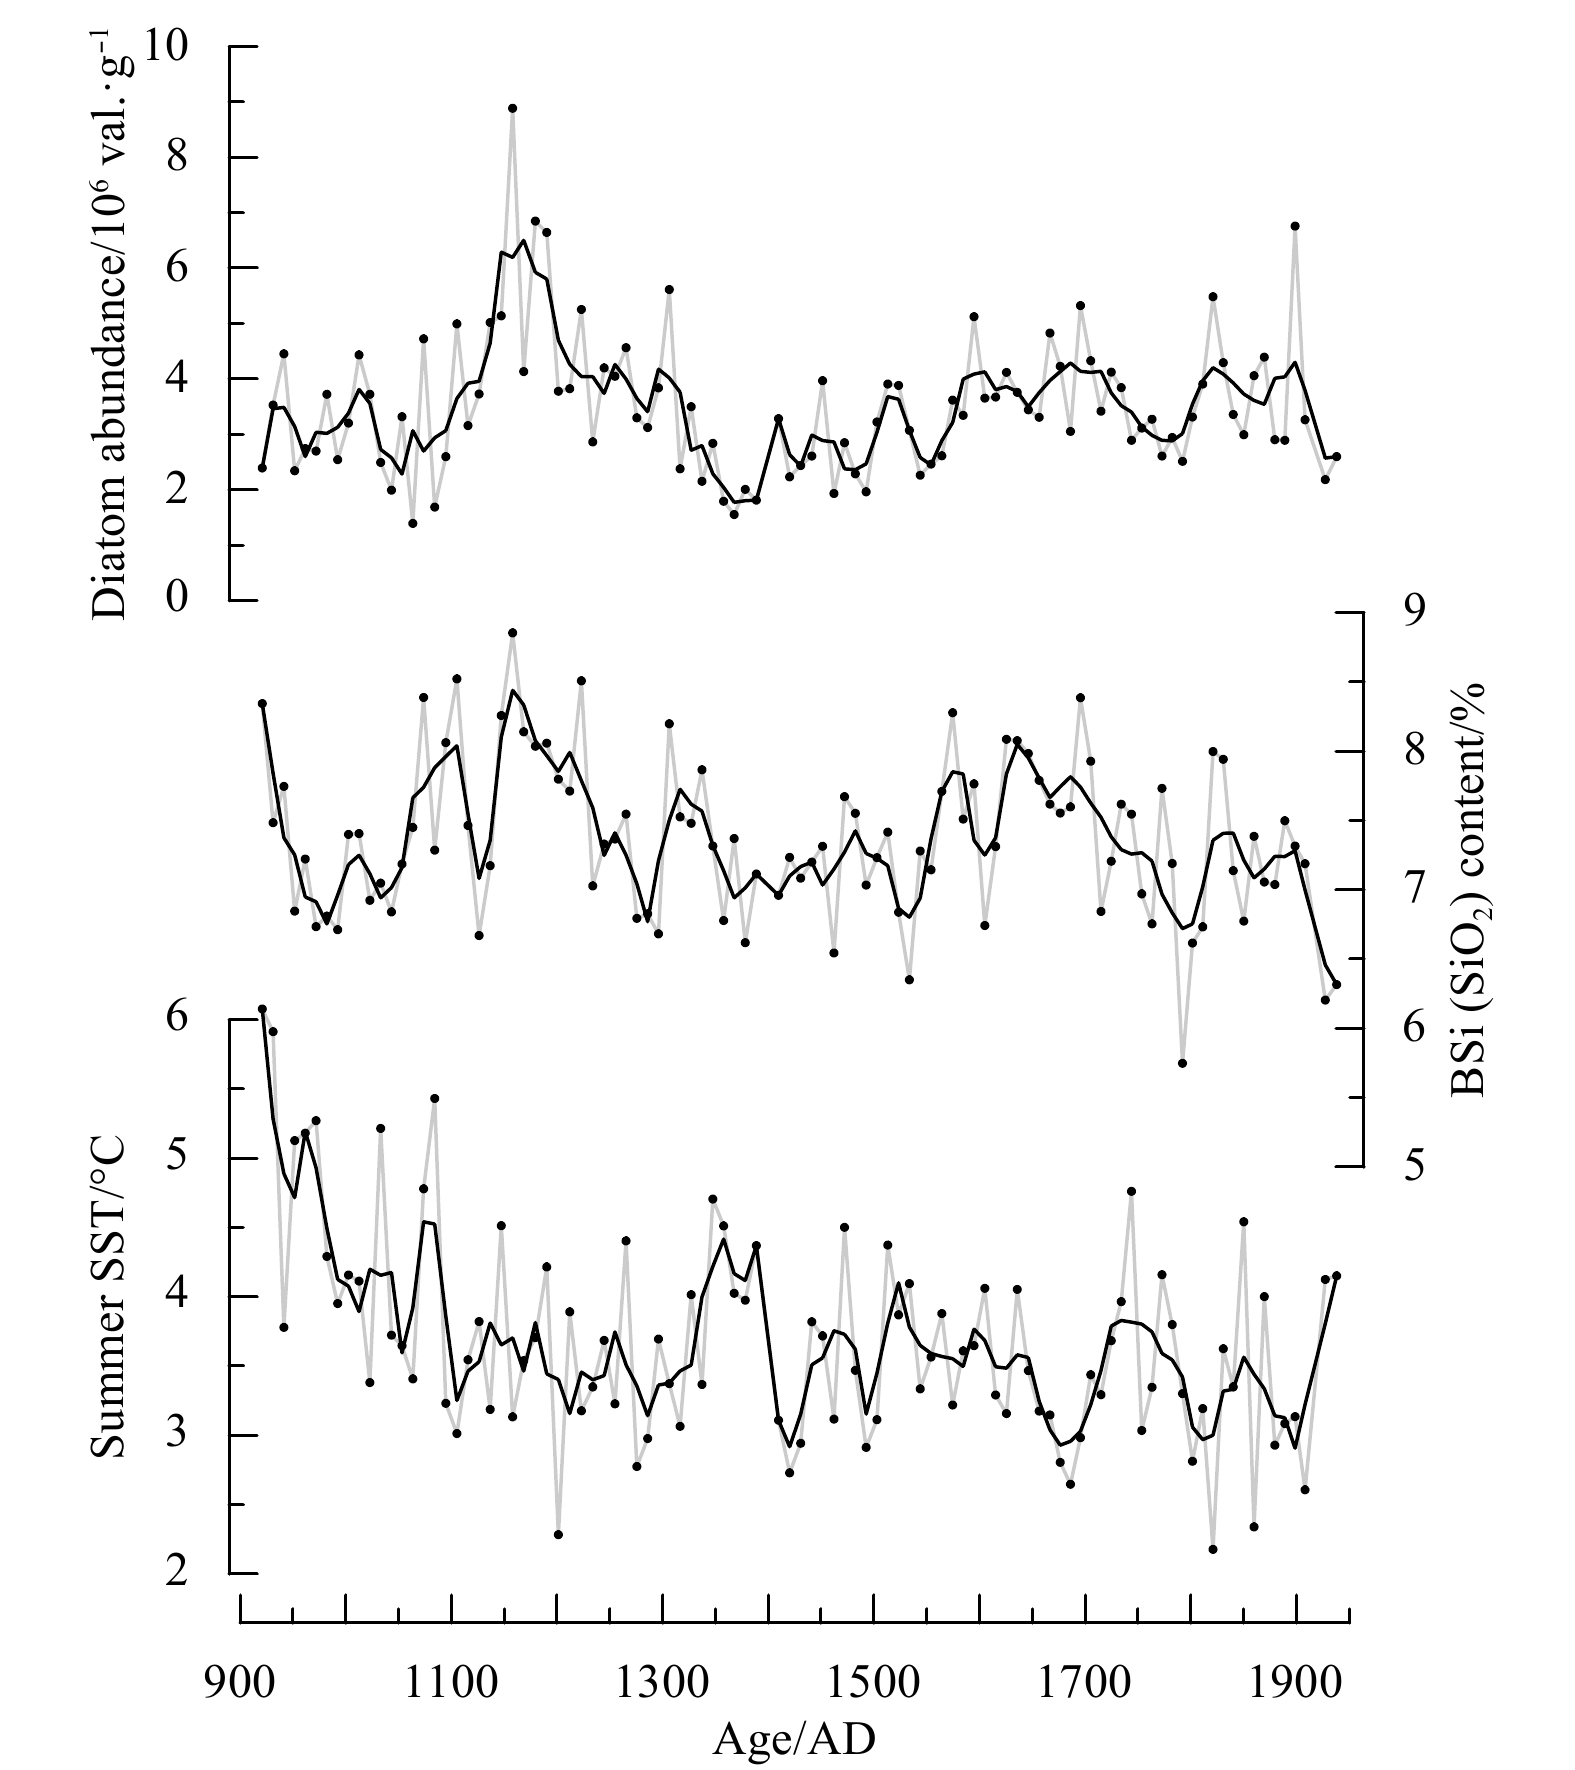
The BSi content of core GC4 ranges from 5.75% to 8.85% (Fig. 3). Initially, there is a decreasing trend of the BSi content during AD 900–1000. This is interrupted, however, by significantly elevated values during AD 1000–1350. The BSi content then generally decreases during AD 1350–1550, which is followed by an increase which persists from AD 1550 to AD 1700. The BSi content then decreases markedly from AD 1700–1940.

During the last millennium, the diatom abundance of core GC4 ranges from 1.40×10⁶ to 8.89×10⁶ val./g (valves per gram of dry sediment) (Fig. 3). The results indicate that the diatom abundance is low (1.4×10⁶–4.7×10⁶ val./g) between AD 900 and AD 1080 (Fig. 3). During AD 1080–1350, it increases substantially (2.1×10⁶–8.9×10⁶ val./g), with the maximum values at ~AD 1160. Thereafter, there is a relatively long interval (AD 1350–1800) with lower diatom abundances, but with rather high concentrations during AD 1600–1700 (3.06×10⁶–5.32×10⁶ val./g). An increase occurs after AD 1800, with a second maximum in diatom abundance at ~AD 1900.
The diatom-based reconstructed summer SSTs range from 2.2°C and 6.1°C, showing a general cooling trend between AD 900 and 1900 (Fig. 3). The interval of AD 900–1100 is characterized by relatively high summer SSTs. Subsequently, lower summer SSTs occur during AD 1100–1900, with several relatively high SSTs values occurring at ~AD 1350, ~1470, ~1740, ~1850 and ~1930 (Fig. 3).
Previous studies of the BSi from both marine and lacustrine sediments revealed that the BSi content was not a simple function of diatom abundance (Newberry and Schelske, 1986; Swann and Mackay, 2006; Ye et al., 2004). However, most paleolimnological studies have found a good correspondence between the abundance of diatom valves and BSi concentrations, despite the potential for the dissolution of diatoms (Bradbury and Winter, 1976; Flower, 1980; Schelske et al., 1983; Engstrom et al., 1985). In core GC4 there is a good correlation between the BSi content and diatom abundance during the last millennium (r=0.53, p<0.01; Fig. 4b). Therefore, we used the BSi content and diatom abundance to infer changes in primary productivity in the study area.

The diatom-based summer SST records show rather warm conditions during AD 900–1100, corresponding to the Medieval Warm Period (MWP, Lamb, 1965). This warming may be related to the strengthened impact of the Irminger Current in the study area. Records from the continental shelf of West Greenland suggest a decrease of sea ice cover (Jensen et al., 2004; Ribeiro et al., 2012; Roncaglia and Kuijpers, 2004; Sha et al., 2016) during AD 1000–1300. The δ18O record from the planktonic foraminifer Turborotalita quinqueloba in a sediment core from south of Greenland (RAPiD-35-25B) shows the enhanced melting of both sea ice and the Greenland ice sheet during AD 900–1000 and AD 1100–1400 (Moffa-Sánchez et al., 2014, Fig. 4e). A temperature reconstruction from the Agassiz and Renland ice cores also suggests relatively warm conditions between AD 1000 and 1400 (Vinther et al., 2009, Fig. 4d). These records around Greenland show different time ranges for MWP compared to that of the present study, which is probably caused by their uneven temporal sampling and dating uncertainties.
One notable feature in our record is the decrease of summer SST between AD 1100 and 1300, which suggests that the MWP in the Holstensburg Dyb was not a uniformly warm interval. A diatom record from Igaliku Fjord, South Greenland, reveals a cold period during AD 1100–1290, inferred by a large decrease of Atlantic open water species during the MWP (Jensen et al., 2004), which is in accordance with the summer SST record obtained in the present study. In addition, the δ18O record from south of Greenland (RAPiD-35-25B) shows reduced melting of both sea ice and the Greenland ice sheet during AD 1000–1100.
The distinctly decreased BSi content and low diatom abundance during AD 900–1000 reflect low primary productivity in the Holsteinsborg Dyb, which is in accordance with the observed low primary productivity between AD 900 and 1050 in Disko Bay (Ribeiro et al., 2012). However, rather high SSTs and low sea-ice concentration indicate warm conditions at that time. Subsequently, the interval of AD 1000–1350 is characterized by a high BSi content and diatom abundances, suggesting distinctly high primary productivity in the study area. Interestingly, relatively low summer SSTs during AD 1100–1300 indicate a cold condition in the Holsteinsborg Dyb, as well as a slightly increase in sea-ice concentration (Fig. 4c, Sha et al., 2016).
The element Ti, which is redox insensitive, can be used to reflect changes in the input of terrigenous components (Jansen et al., 1998; Peterson et al., 2000; Yarincik et al., 2000) via run-off or ice rafting (Solignac et al., 2011; St-Onge et al., 2007). The rather high element Ti counts during AD 950–1300 suggest an increase in meltwater influence from the Greenland ice sheet (Fig. 4a). The co-variation of the element Ti counts and BSi content during AD 1000–1300 indicates that high productivity in the study area was caused by enhanced meltwater input. This is also supported by an increase in meltwater influx between AD 1050 and 1250 in Disko Bugt (Seidenkrantz et al., 2008). In addition, enhanced mixing of the water column, caused by the strengthened westerlies in a positive North Atlantic Oscillation (NAO) state during the MWP (Trouet et al., 2009; Olsen et al., 2012), may have stimulated the growth of diatoms, relative to other phytoplankton groups at the termination of the MWP.
In summary, there is a very weak negative correlation between the BSi content and SSTs (r=–0.12, p<0.01) during AD 900–1400. Therefore, the relatively high primary productivity in the Holsteinsborg Dyb during the WMP does not show a positive correlation to summer SSTs and sea-ice reduction. Rather, a positive NAO and enhanced influence of the Irminger Current and terrigenous input carried by meltwater, indicated by high element Ti counts, may have been the major factors responsible for the high productivity in the Holsteinsborg Dyb.
A prolonged period of low SSTs from AD 1400 to AD 1900 indicates the strengthened impact of the East Greenland Current on the study area, corresponding to the Little Ice Age (LIA, Lamb, 1965). This is supported by a general increase in sea-ice diatoms, in contrast to a pronounced decrease in the Atlantic species and the disappearance of the Atlantic Water foraminifera species at site GC4 during AD 1400–1900 (Erbs-Hansen et al., 2013; Sha et al., 2012).This cooling is supported by another diatom record which shows severe cooling after AD 1350 in South Greenland, resulting in the deterioration of farming conditions which affected the Norse people (Jensen et al., 2004). This is also in accordance with records of cold conditions in the eastern Labrador Sea and in the Agassiz and Renland ice cores during AD 1400–1900 (Moffa-Sánchez et al., 2014; Vinther et al., 2009) (Fig. 4d).
The relatively low diatom abundance and BSi content from AD 1350 to 1550 indicates lower productivity in Holsteinsborg Dyb than during AD 1000–1350 (Fig. 4b). This is also supported by the pronounced negative NAO centered at ~ AD 1450 and by XRF geochemical data from southwest Greenland, which indicates decreasing productivity during AD 1350–1550 (Møller et al. 2006; Trouet et al., 2009). The fluctuating SSTs and sea-ice concentrations reconstructed from core GC4 show no significant correlation with the marine productivity in the study area (Fig. 4c, Sha et al., 2016). Notably, however, there is a distinct increase in the BSi content during AD 1550–1700, when extensive sea-ice conditions were recorded in West Greenland (Ribeiro et al., 2012; Sha et al., 2016) (Fig. 4c). In addition, an enhanced East Greenland Current and negative NAO are out of phase with increases in productivity in the Holsteinsborg Dyb during AD 1550–1700 (Erbs-Hansen et al., 2013; Sha et al., 2016).
Similarly, a slightly increase in the element Ti counts at site GC4 suggests the high export of meltwater from the Greenland ice sheet to the Holsteinsborg Dyb between AD 1550 and AD 1750 (Erbs-Hansen et al., 2013) (Fig. 4a). This silicate-rich meltwater likely stimulated the growth of diatoms relative to other phytoplankton groups (Meire et al., 2016). Therefore, the relatively high productivity inferred by the diatom abundance and BSi record from the Holsteinsborg Dyb during AD 1550–1700 may be associated with the increased supply of silicate-rich meltwater from the Greenland ice sheet.
After AD 1700 there is a reduction of diatom abundance and BSi content, with the minimum BSi content occurring at ~AD 1800, suggesting a reduction in primary productivity in the Holsteinsborg Dyb. This is in agreement with a distinct decrease in element Ti counts after AD 1750, which indicates that less meltwater reached the study area (Erbs-Hansen et al., 2013) (Fig. 4a); the resulting decrease in the export of meltwater from the Greenland ice sheet would have limited the growth of diatoms in the study area. This is in accordance with reduced onshore wind stress during a period of a generally negative winter NAO index (Trouet et al., 2009).
In most of the Arctic Ocean, there has been a distinct increase in primary productivity over the past two decades, due to rising temperatures and reduced sea-ice cover under ongoing global warming (Arrigo and van Dijken, 2015; Ribeiro et al., 2017). However, there is almost no correlation between marine productivity and sea surface temperature and sea-ice concentration in the study area during the last millennium, with the correlation coefficients between the BSi content and SSTs and sea-ice concentration of -0.06 and 0.14 (p<0.01), respectively. In contrast, there is a relatively high correlation between the BSi content and element Ti counts (r=0.32, p<0.01). Therefore, the mechanism responsible for changes in the marine productivity in the Holsteinsborg Dyb may be related to meltwater input from the Greenland ice sheet. Other factors, like wind-induced surface-water mixing and the deep and bottom waters around the study area (Knudsen et al., 2008; Ribeiro et al., 2012), may also have influenced the productivity variations. However, determining which of the two mechanisms was responsible requires further study.
The BSi content in sediment core GC4 from the Holsteinsborg Dyb, West Greenland, varied from 5.75% to 8.85% during the last millennium. There is a high positive correlation between the BSi content and diatom abundance, and both of them can be used to represent changes in productivity in the study area.
The reconstructed summer SSTs shows that the WMP was not a sustained warm period in West Greenland. There is almost no correlation between the SSTs and BSi content (r=–0.06, p<0.01), suggesting that SSTs had little influence on the productivity in the Holsteinsborg Dyb over the past 1 000 years.
The relatively high correlation between the BSi content and element Ti counts (r=0.32, p<0.01) in core GC4 suggests that meltwater input from the Greenland ice sheet may have had a major impact on productivity variations in the study area, compared to the influence of the SSTs and sea-ice concentration. Other factors, like wind-induced surface-water mixing and the deep and bottom waters around the study area may also have influenced the productivity variations.
The core material was obtained during the Galathea 3 cruise in 2006. We are grateful to the captain, crew and expedition members for coring and seismic operations on board R/V Vædderen and all cruises providing surface samples for our study. We thank Jan Heinemeier (Aarhus University, Denmark) for providing the 14C age determinations. This work was supported by the K C Wong Magna Fund in Ningbo University. Finally, we thank Jan Bloemendal for suggested improvement to the English text.
| [1] |
Andersen O G N. 1981. The annual cycle of temperature, salinity, currents and water masses in Disko Bugt and adjacent waters, West Greenland. Medd Grønland Bioscience, 5: 1–36
|
| [2] |
Arrigo K R, van Dijken G L. 2015. Continued increases in Arctic Ocean primary production. Progress in Oceanography, 136: 60–70. doi: 10.1016/j.pocean.2015.05.002
|
| [3] |
Bradbury J P, Winter T C. 1976. Areal distribution and stratigraphy of diatoms in the sediments of Lake Sallie, Minnesota. Ecology, 57(5): 1005–1014. doi: 10.2307/1941065
|
| [4] |
Buch E. 2002. Present oceanographic conditions in Greenland Waters. Copenhagen: Danish Meteorological Institute, 1–36
|
| [5] |
Colman S M, Bratton J F. 2003. Anthropogenically induced changes in sediment and biogenic silica fluxes in Chesapeake Bay. Geology, 31(1): 71–74. doi: 10.1130/0091-7613(2003)031<0071:AICISA>2.0.CO;2
|
| [6] |
Comiso J C. 2012. Large decadal decline of the arctic multiyear ice cover. Journal of Climate, 25(4): 1176–1193. doi: 10.1175/JCLI-D-11-00113.1
|
| [7] |
DeMaster D J. 1981. The supply and accumulation of silica in the marine environment. Geochimica et Cosmochimica Acta, 45(10): 1715–1732. doi: 10.1016/0016-7037(81)90006-5
|
| [8] |
DeMaster D J. 2002. The accumulation and cycling of biogenic silica in the Southern Ocean: revisiting the marine silica budget. Deep Sea Research Part II: Topical Studies in Oceanography, 49(16): 3155–3167. doi: 10.1016/S0967-0645(02)00076-0
|
| [9] |
Engstrom D R, Swain E B, Kingston J C. 1985. A palaeolimnological record of human disturbance from Harvey’s Lake, Vermont: geochemistry, pigments and diatoms. Freshwater Biology, 15(3): 261–288. doi: 10.1111/j.1365-2427.1985.tb00200.x
|
| [10] |
Erbs-Hansen D R, Knudsen K L, Olsen J, et al. 2013. Paleoceanographical development off Sisimiut, West Greenland, during the mid- and late Holocene: a multiproxy study. Marine Micropaleontology, 102: 79–97. doi: 10.1016/j.marmicro.2013.06.003
|
| [11] |
Flower R J. 1980. A study of sediment formation, transport and deposition in Lough Neagh, Northern Ireland, with special reference to diatoms [dissertation]. Northern Ireland: The New University of Ulster
|
| [12] |
Gersonde R, Zielinski U. 2000. The reconstruction of late Quaternary Antarctic sea-ice distribution—the use of diatoms as a proxy for sea-ice. Palaeogeography, Palaeoclimatology, Palaeoecology, 162(3–4): 263–286
|
| [13] |
Hu Fengsheng, Kaufman D, Yoneji S, et al. 2003. Cyclic variation and solar forcing of Holocene climate in the Alaskan subarctic. Science, 301(5641): 1890–1893. doi: 10.1126/science.1088568
|
| [14] |
Jansen J H F, Van der Gaast S J, Koster B, et al. 1998. CORTEX, a shipboard XRF-scanner for element analyses in split sediment cores. Marine Geology, 151(1–4): 143–153
|
| [15] |
Jensen K G, Kuijpers A, Koç N, et al. 2004. Diatom evidence of hydrographic changes and ice conditions in Igaliku Fjord, South Greenland, during the past 1500 years. The Holocene, 14(2): 152–164. doi: 10.1191/0959683604hl698rp
|
| [16] |
Jensen S M, Hansen H, Secher K, et al. 2002. Kimberlites and other ultramafic alkaline rocks in the Sisimiut–Kangerlussuaq region, southern West Greenland. Geology of Greenland Survey Bulletin, 191: 57–66
|
| [17] |
Jiang Hui, Eiríksson J, Schulz M, et al. 2005. Evidence for solar forcing of sea-surface temperature on the North Icelandic Shelf during the late Holocene. Geology, 33(1): 73–76. doi: 10.1130/G21130.1
|
| [18] |
Jiang Hui, Muscheler R, Björck S, et al. 2015. Solar forcing of Holocene summer sea-surface temperatures in the northern North Atlantic. Geology, 43(3): 203–206. doi: 10.1130/G36377.1
|
| [19] |
Jiang Hui, Seidenkrantz M S, Knudsen K L, et al. 2001. Diatom surface sediment assemblages around Iceland and their relationships to oceanic environmental variables. Marine Micropaleontology, 41(1–2): 73–96
|
| [20] |
Justwan A, Koç N, Jennings A E. 2008. Evolution of the Irminger and East Icelandic Current systems through the Holocene, revealed by diatom-based sea surface temperature reconstructions. Quaternary Science Reviews, 27(15–16): 1571–1582
|
| [21] |
Knudsen K L, Stabell B, Seidenkrantz M S, et al. 2008. Deglacial and Holocene conditions in northernmost Baffin Bay: sediments, foraminifera, diatoms and stable isotopes. Boreas, 37(3): 346–376. doi: 10.1111/j.1502-3885.2008.00035.x
|
| [22] |
Koc Karpuz N, Schrader H. 1990. Surface sediment diatom distribution and Holocene Paleotemperature variations in the Greenland, Iceland and Norwegian Sea. Paleoceanography and Paleoclimatology, 5(4): 557–580
|
| [23] |
Koning E, Brummer G J, Van Raaphorst W, et al. 1997. Settling, dissolution and burial of biogenic silica in the sediments off Somalia (northwestern Indian Ocean). Deep Sea Research Part II: Topical Studies in Oceanography, 44(6–7): 1341–1360
|
| [24] |
Krause-Jensen D, Marbà N, Olesen B, et al. 2012. Seasonal sea ice cover as principal driver of spatial and temporal variation in depth extension and annual production of kelp in Greenland. Global Change Biology, 18(10): 2981–2994. doi: 10.1111/j.1365-2486.2012.02765.x
|
| [25] |
Krawczyk D W, Witkowski A, Moros M, et al. 2017. Quantitative reconstruction of Holocene sea ice and sea surface temperature off West Greenland from the first regional diatom data set. Paleoceanography and Paleoclimatology, 32(1): 18–40
|
| [26] |
Lamb H H. 1965. The early medieval warm epoch and its sequel. Palaeogeography, Palaeoclimatology, Palaeoecology, 1: 13–37. doi: 10.1016/0031-0182(65)90004-0
|
| [27] |
Li Dongling, Sha Longbin, Li Jialin, et al. 2017. Summer Sea-Surface Temperatures and Climatic Events in Vaigat Strait, West Greenland, during the Last 5000 Years. Sustainability, 9(5): 704. doi: 10.3390/su9050704
|
| [28] |
Liu Sumei, Ye Xiwen, Zhang Jing, et al. 2002. Problems with biogenic silica measurement in marginal seas. Marine Geology, 192(4): 383-392
|
| [29] |
Liu Sumei, Ye Xiwen, Zhang Jing, et al. 2008. The silicon balance in Jiaozhou Bay, North China. Journal of Marine Systems, 74(1–2): 639–648
|
| [30] |
Liu Sumei, Zhang Jing, Chen Hongtao, et al. 2005. Factors influencing nutrient dynamics in the eutrophic Jiaozhou Bay, North China. Progress in Oceanography, 66(1): 66–85. doi: 10.1016/j.pocean.2005.03.009
|
| [31] |
Lykke-Andersen H, Knudsen K L. 2007. Geologien i Holsteinsborg Dyb. Geoviden: Geologi og Geografi, 3: 6–7
|
| [32] |
Maslanik J, Stroeve J, Fowler C, et al. 2011. Distribution and trends in Arctic sea ice age through spring 2011. Geophysical Research Letters, 38(13): L13502
|
| [33] |
Meire L, Meire P, Struyf E, et al. 2016. High export of dissolved silica from the Greenland Ice Sheet. Geophysical Research Letters, 43(17): 9173–9182. doi: 10.1002/2016GL070191
|
| [34] |
Miettinen A, Divine D V, Husum K, et al. 2015. Exceptional ocean surface conditions on the SE Greenland shelf during the Medieval Climate Anomaly. Paleoceanography and Paleoclimatology, 30(12): 1657–1674
|
| [35] |
Moffa-Sánchez P, Hall I R, Barker S, et al. 2014. Surface changes in the eastern Labrador Sea around the onset of the Little Ice Age. Paleoceanography and Paleoclimatology, 29(3): 160–175
|
| [36] |
Møller H S, Jensen K G, Kuijpers A, et al. 2006. Late-Holocene environment and climatic changes in Ameralik Fjord, southwest Greenland: evidence from the sedimentary record. The Holocene, 16(5): 685–695. doi: 10.1191/0959683606hl963rp
|
| [37] |
Mortlock R A, Froelich P N. 1989. A simple method for the rapid determination of biogenic opal in pelagic marine sediments. Deep Sea Research Part A. Oceanographic Research Papers, 36(9): 1415–1426. doi: 10.1016/0198-0149(89)90092-7
|
| [38] |
Nelson D M, Tréguer P, Brzezinski M A, et al. 1995. Production and dissolution of biogenic silica in the ocean: revised global estimates, comparison with regional data and relationship to biogenic sedimentation. Global Biogeochemical Cycles, 9(3): 359–372. doi: 10.1029/95GB01070
|
| [39] |
Newberry T L, Schelske C L. 1986. Biogenic silica record in the sediments of Little Round Lake, Ontario. Hydrobiologia, 143(1): 293–300. doi: 10.1007/BF00026673
|
| [40] |
Olsen J, Anderson N J, Knudsen M F. 2012. Variability of the North Atlantic Oscillation over the past 5, 200 years. Nature Geoscience, 5(11): 808–812. doi: 10.1038/ngeo1589
|
| [41] |
Perovich D K, Richter-Menge J A. 2009. Loss of Sea Ice in the Arctic. Annual Review of Marine Science, 1: 417–441. doi: 10.1146/annurev.marine.010908.163805
|
| [42] |
Peterson L C, Haug G H, Hughen K A, et al. 2000. Rapid changes in the hydrologic cycle of the tropical atlantic during the last glacial. Science, 290(5498): 1947–1951. doi: 10.1126/science.290.5498.1947
|
| [43] |
Ragueneau O, Tréguer P, Leynaert A, et al. 2000. A review of the Si cycle in the modern ocean: recent progress and missing gaps in the application of biogenic opal as a paleoproductivity proxy. Global and Planetary Change, 26(4): 317–365. doi: 10.1016/S0921-8181(00)00052-7
|
| [44] |
Ramsey C B. 2009. Bayesian analysis of radiocarbon dates. Radiocarbon, 51(1): 337–360. doi: 10.1017/S0033822200033865
|
| [45] |
Ran Lihua, Chen Jianfang, Wiesner M G, et al. 2015. Variability in the abundance and species composition of diatoms in sinking particles in the northern South China Sea: results from time-series moored sediment traps. Deep Sea Research Part II: Topical Studies in Oceanography, 122: 15–24. doi: 10.1016/j.dsr2.2015.07.004
|
| [46] |
Reimer P J, Baillie M G L, Bard E, et al. 2009. IntCal09 and Marine09 radiocarbon age calibration curves, 0–50, 000 years cal BP. Radiocarbon, 51(4): 1111–1150. doi: 10.1017/S0033822200034202
|
| [47] |
Ribeiro S, Moros M, Ellegaard M, et al. 2012. Climate variability in West Greenland during the past 1500 years: evidence from a high-resolution marine palynological record from Disko Bay. Boreas, 41(1): 68–83. doi: 10.1111/j.1502-3885.2011.00216.x
|
| [48] |
Ribeiro S, Sejr M K, Limoges A, et al. 2017. Sea ice and primary production proxies in surface sediments from a High Arctic Greenland fjord: spatial distribution and implications for palaeoenvironmental studies. Ambio, 46(S1): 106–118. doi: 10.1007/s13280-016-0894-2
|
| [49] |
Ribergaard M H. 2011. Oceanographic investigations off West Greenland 2010. Danish: Danish Metrological Institute Centre for Ocean and Ice (DMI), 1–44
|
| [50] |
Rickert D. 2000. Dissolution kinetics of biogenic silica in marine environments Lösungskinetik von biogenem Opal in marinen Systemen. Berichte zur Polarforschung (Reports on Polar Research), 351: 1–182
|
| [51] |
Romero O, Hebbeln D. 2003. Biogenic silica and diatom thanatocoenosis in surface sediments below the Peru-Chile Current: controlling mechanisms and relationship with productivity of surface waters. Marine Micropaleontology, 48(1–2): 71–90
|
| [52] |
Roncaglia L, Kuijpers A. 2004. Palynofacies analysis and organic-walled dinoflagellate cysts in late-Holocene sediments from Igaliku Fjord, South Greenland. The Holocene, 14(2): 172–184. doi: 10.1191/0959683604hl700rp
|
| [53] |
Schelske C L, Stoermer E F, Conley D J, et al. 1983. Early eutrophication in the Lower Great Lakes: new evidence from biogenic silica in sediments. Science, 222(4621): 320–322. doi: 10.1126/science.222.4621.320
|
| [54] |
Schlüter M, Sauter E. 2000. Biogenic silica cycle in surface sediments of the Greenland Sea. Journal of Marine Systems, 23(4): 333–342. doi: 10.1016/S0924-7963(99)00070-6
|
| [55] |
Seidenkrantz M S, Roncaglia L, Fischel A, et al. 2008. Variable North Atlantic climate seesaw patterns documented by a late Holocene marine record from Disko Bugt, West Greenland. Marine Micropaleontology, 68(1–2): 66–83
|
| [56] |
Sejr M K, Blicher M E, Rysgaard S. 2009. Sea ice cover affects inter-annual and geographic variation in growth of the Arctic cockle Clinocardium ciliatum (Bivalvia) in Greenland. Marine Ecology Progress Series, 389: 149–158. doi: 10.3354/meps08200
|
| [57] |
Sha Longbin, Jiang Hui, Knudsen K L. 2012. Diatom evidence of climatic change in Holsteinsborg Dyb, west of Greenland, during the last 1200 years. The Holocene, 22(3): 347–358. doi: 10.1177/0959683611423684
|
| [58] |
Sha Longbin, Jiang Hui, Seidenkrantz M S, et al. 2016. Solar forcing as an important trigger for West Greenland sea-ice variability over the last millennium. Quaternary Science Reviews, 131: 148–156. doi: 10.1016/j.quascirev.2015.11.002
|
| [59] |
Solignac S, Seidenkrantz M S, Jessen C, et al. 2011. Late-Holocene sea-surface conditions offshore Newfoundland based on dinoflagellate cysts. The Holocene, 21(4): 539–552. doi: 10.1177/0959683610385720
|
| [60] |
St-Onge G, Mulder T, Francus P, et al. 2007. Chapter two continuous physical properties of cored marine sediments. Developments in Marine Geology, 1: 63–98. doi: 10.1016/S1572-5480(07)01007-X
|
| [61] |
Swann G E A, Mackay A W. 2006. Potential limitations of biogenic silica as an indicator of abrupt climate change in Lake Baikal, Russia. Journal of Paleolimnology, 36(1): 81–89. doi: 10.1007/s10933-006-0005-7
|
| [62] |
Tang C C L, Ross C K, Yao T, et al. 2004. The circulation, water masses and sea-ice of Baffin Bay. Progress in Oceanography, 63(4): 183–228. doi: 10.1016/j.pocean.2004.09.005
|
| [63] |
Trouet V, Esper J, Graham N E, et al. 2009. Persistent positive North Atlantic oscillation mode dominated the Medieval Climate Anomaly. Science, 324(5923): 78–80. doi: 10.1126/science.1166349
|
| [64] |
Van Cappellen P, Dixit S, van Beusekom J. 2002. Biogenic silica dissolution in the oceans: reconciling experimental and field-based dissolution rates. Global Biogeochemical Cycles, 16(4): 1075
|
| [65] |
van der Weijden A J, van der Weijden C H. 2002. Silica fluxes and opal dissolution rates in the northern Arabian Sea. Deep Sea Research Part I: Oceanographic Research Papers, 49(1): 157–173. doi: 10.1016/S0967-0637(01)00050-4
|
| [66] |
Vinther B M, Buchardt S L, Clausen H B, et al. 2009. Holocene thinning of the Greenland ice sheet. Nature, 461(7262): 385–388. doi: 10.1038/nature08355
|
| [67] |
Wassmann P, Duarte C M, Agustí S, et al. 2011. Footprints of climate change in the Arctic marine ecosystem. Global Change Biology, 17(2): 1235–1249. doi: 10.1111/j.1365-2486.2010.02311.x
|
| [68] |
Wu Bin, Lu Chao, Liu Sumei. 2015. Dynamics of biogenic silica dissolution in Jiaozhou Bay, western Yellow Sea. Marine Chemistry, 174: 58–66. doi: 10.1016/j.marchem.2015.05.004
|
| [69] |
Yarincik K M, Murray R W, Peterson L C. 2000. Climatically sensitive eolian and hemipelagic deposition in the Cariaco Basin, Venezuela, over the past 578, 000 years: results from Al/Ti and K/Al. Paleoceanography and Paleoclimatology, 15(2): 210–228
|
| [70] |
Ye Xiwen, Liu Sumei, Zhao Yingfei, et al. 2004. The distribution of biogenic silica in the sediments of the East China Sea and the Yellow Sea and its environmental signification. China Environmental Science (in Chinese), 24(3): 265–269
|


Figures(4)

Supported by:
Beijing Renhe Information Technology Co. Ltd

Longbin Sha, Dongling Li, Yanguang Liu, Bin Wu, Yanni Wu, Karen Luise Knudsen, Zhongqiao Li, Hao Xu. Biogenic silica concentration as a marine primary productivity proxy in the Holsteinsborg Dyb, West Greenland, during the last millennium[J]. Acta Oceanologica Sinica, 2020, 39(9): 78-85. doi: 10.1007/s13131-020-1648-3

 DownLoad:


 DownLoad: