State Key Laboratory of Lithospheric Evolution, Institute of Geology and Geophysics, Chinese Academy of Sciences, Beijing 100029, China
2.
Northwest Institute of Eco-Environment and Resources, Chinese Academy of Sciences, Lanzhou 730000, China
3.
Key Laboratory of Petroleum Resources, Gansu Province, Lanzhou 730000, China
4.
Innovation Academy for Earth Science, Chinese Academy of Sciences, Beijing 100029, China
5.
University of Chinese Academy of Sciences, Beijing 100049, China
6.
CNOOC Research Institute Co., Ltd., Beijing 100028, China
7.
State Key Laboratory of Marine Geology, Tongji University, Shanghai 200092, China
8.
Research Institute of Petroleum Exploration & Development, PetroChina, Beijing 100083, China
9.
Department of Geology, Northwest University, Xi’an 710069, China
Funds:
The National Natural Science Foundation of China under contract No. 91528303; the National Science and Technology Major Project under contract Nos 2016ZX05026, 2011ZX05025 and 2008ZX05025; the National Basic Research Program (973 Program) of China under contract No. 2009CB219400; the Foundation for Excellent Youth Scholars of NIEER, CAS.
In this study, element geochemistry and zircon chronology are used to analyze the Oligocene sediments in the Baiyun Sag, Zhujiang River Mouth Basin. The experimental results are discussed with respect to weathering conditions, parent rock lithologies, and provenances. The chemical index of alteration and the chemical index of weathering values of mudstone samples from the lower Oligocene Enping Formation indicate that clastic particles in the study area underwent moderate weathering. Mudstone samples exhibit relatively enriched light rare earth elements and depleted heavy rare earth elements, “V”-shaped negative Eu anomalies, and negligible Ce anomalies. The rare earth element distribution curves are obviously right-inclined, with shapes and contents similar to those of post-Archean Australian shale and upper continental crust, indicating that the samples originated from acid rocks in the upper crust. The Hf-La/Th and La/Sc-Co/Th diagrams show this same origin for the sediments in the study area. For the samples from the upper Enping deltas, the overall age spectrum shows four major age peaks ca. 59–68 Ma, 98–136 Ma, 153–168 Ma and 239–260 Ma. For the Zhuhai Formation samples, the overall age spectrum shows three major age peaks ca. 149 Ma, 252 Ma and 380 Ma. The detrital zircon shapes and U-Pb ages reveal that during Oligocene sedimentation, the sediments on the northwestern margin of the Baiyun Sag were supplied jointly from two provenances: Precambrian-Paleozoic metamorphic rocks in the extrabasinal South China fold zone and Mesozoic volcanic rocks in the intrabasinal Panyu Low Uplift, and the former supply became stronger through time. Thus, the provenance of the Oligocene deltas experienced a transition from an early proximal intrabasinal source to a late distal extrabasinal source.
Previous studies on provenance in the South China Sea (SCS) area mainly focused on the Neogene (postrift units), whereas provenance evolution in the Paleogene (synrift units) was rarely investigated (Cao et al., 2015, 2018; Wang et al., 2019; Zeng et al., 2019). The SCS has sparse borehole coverage of the Paleogene strata because of high drilling costs together with a complex geological setting and deeply buried units (Shao et al., 2016a). For provenance analysis in the Zhujiang River Mouth Basin (ZRMB) of the northern SCS, the intrabasinal uplifts of the ZRMB also formed a series of important source regions during the Paleogene synrift stage (Wang et al., 2017, 2019; Liu et al., 2017; Cao et al., 2018; Zeng et al., 2019), but their ability to provide debris is still unclear. An important issue is determining the roles of the intrabasinal source system from the uplifts and the potential extrabasinal provenance from the South China Block.
Element geochemistry analysis is an efficient method to identify the weathering conditions, parent rock lithology and provenance of sedimentary rocks (Castillo et al., 2015; Amendola et al., 2016; Shu et al., 2016; Ma et al., 2019). The trace element contents of sedimentary rock are closely related to its environment of formation; thus, the contents and ratios of trace elements can be analyzed to infer the sedimentary environment and invert for the relevant geological conditions (Domini and Stanley, 1993). Rare earth elements (REEs), with good chemical stability, may not undergo unbalanced fractionation during the weathering, denudation, transport, deposition and early diagenesis of clastic particles. Changes in REE contents are believed to be highly relevant to the source composition, exchange reactions and diagenesis. As one of the key geochemical indicators, the REE contents and their changes can indicate the environment of formation and the sources and can imply the diagenesis of sedimentary rocks (Nesbitt and Young, 1982; Taylor and McClennan, 1985; McLennan, 1989; Condie, 1993; Fedo et al., 1995, 1997; Ma et al., 2019). The detrital zircon U-Pb chronology can define the maximum depositional age; thus, it has become a useful tool widely applied around the world to analyze basin provenance in recent decades (Cao et al., 2015; Jiang et al., 2015; Shao et al., 2016b; Liu et al., 2016; Zeng et al., 2019). Detrital zircons in sedimentary basins are stable and widespread, and can preserve the original source information well, so detrital zircon age dating is popular for analyzing provenance systems (Wu and Zheng, 2004; Wang et al., 2015; Fan et al., 2015; Benyon et al., 2016). In this study, major elements, trace elements and detrital zircon U-Pb ages were combined to identify the weathering conditions, parent rock lithology and provenance of the Oligocene sediments in the Baiyun Sag of the ZRMB.
2.
Geological setting
The ZRMB is located in the northern SCS and the southern margin of the South China continent and near the intersection of the Eurasian, Pacific and Indian plates (Zhang et al., 2007; Zhang, 2010). As a large deep sag in the basin, the Baiyun Sag has a deep-water area of more than 1×10⁴ km2, a maximum sedimentary thickness exceeding 10 000 m and the most complete Cenozoic strata in the ZRMB. It neighbors the Dongsha Uplift to the east, the Yunkai Low Uplift to the west, the Panyu Low Uplift to the north, and the southern uplift to the south (Fig. 1). The Baiyun Sag experienced three stages of tectonic evolution: a rifting stage, transitional stage, and depression stage. The environmental characteristics are as follows: the lacustrine facies is present in the Eocene Wenchang Formation; the marine-continental transitional facies, in the Eocene−lower Oligocene Enping Formation; the neritic facies, in the upper Oligocene Zhuhai Formation; and the bathyal to abyssal facies, in the Miocene Zhujiang Formation and the overlying strata (Shao et al., 2005; Sun et al., 2011; Zhang et al., 2015) (Fig. 2). In the late depositional period of the Enping Formation, the sedimentary environment gradually changed from lacustrine to marine-continental transitional conditions, and the wide and gentle paleogeographic setting on the northern slope facilitated the development of great deltas (Zhang et al., 2014; Zeng et al., 2017; Sun et al., 2020).
Figure
1.
Location and tectonic units of the Baiyun Sag and the locations of sampled boreholes. Major and trace element analyses were performed for samples from wells BY1–BY5, and detrital zircon dating was performed for samples from Well BY3.
Figure
2.
Composite column of stratigraphy, tectonic evolution, and environmental characteristics in the Baiyun Sag (modified from Pang et al. (2008)).
The samples used in this paper were core and cutting samples, which were taken from gray to dark gray mudstones of the Oligocene Enping and Zhuhai Formations in the Baiyun Sag. In this study, major and trace element analyses and zircon U-Pb dating were carried out. The sample conditions and experimental methods are described as follows.
A total of 24 samples from the Enping Formation were used for major element analysis. Major element analysis was completed in two steps. (1) Powder sample pressing. Approximately 4 g of powder sample was weighed using a balance and then placed into the cylindrical mold of a semiautomatic presser. White boric acid solid powder was added around the mold. The mold was removed, the pressure cap was covered, and the sample was removed after 20 s at a pressure of 0.3 MPa. Thus, a sample cylinder of 4 cm in diameter and 8 mm in thickness was prepared. (2) X-ray fluorescence (XRF) testing. The testing was conducted using an E3080 XRF spectrometer (Rigaku, Japan). The accuracy of the XRF analysis was estimated to be better than 1% for all major oxides. All operations above were completed at the Key Laboratory of Petroleum Resources Research, Chinese Academy of Sciences.
In total, 24 mudstone samples from the Enping Formation were analyzed for trace elements using Inductively Coupled Plasma Mass Spectrometry (ICP-MS) (Thermo Fisher Scientific, USA) according to the following steps. (1) The sample was ground to approximately 200 mesh and placed in a drying oven at 55°C for 12 h. Approximately 20–30 mg of dried sample was weighed and placed in a Teflon container. A small amount of ultrapure water was added for wetting. (2) There are 1 mL nitric acid and 1 mL hydrofluoric acid were added to the Teflon container, and the container was vibrated in an ultrasonic oscillator for 20 min. Then, the plate was placed on a 150°C heating plate until it was nearly dry. (3) There are 1 mL nitric acid and 1 mL hydrofluoric acid were added to the Teflon container, and the container was vibrated in an ultrasonic oscillator for 20 min. The sample was inserted into a stainless steel tank and tightened. Then the tank was placed in a 190°C drying oven for at least 24 h. (4) The Teflon container was removed from the stainless steel tank after cooling. The Teflon container was placed on a 150°C heating plate until it was nearly dry. There is 1 mL nitric acid was added and dried. This operation was repeated twice. (5) There are 2 mL nitric acid and 3 mL ultrapure water were added to the Teflon container, which was placed in a stainless steel tank, tightened and left in a 150°C drying oven for at least 24 h. (6) The Teflon container was removed, and the volume was made approximately 2 000 times the sample weight. The minimum detection limit of the equipment was less than 1×10⁻⁹. The errors for trace and REEs in this study were within ±6%. All operations above were completed at the Institute of Tibetan Plateau Research, Chinese Academy of Sciences.
The samples used for zircon U-Pb age dating were taken from Well BY3, including 3 bags of samples from the upper Enping Formation and 1 bag of samples from the Zhuhai Formation. Forty zircons from each bag of samples were selected for dating analysis, and 160 zircons in total were obtained. The zircon grains for these samples were selected from the sandstones. The detrital zircon samples with high clarity and good crystal form under the microscope were selected randomly to make sample targets. After polishing, the sample target was subjected to cathodoluminescence (CL) imaging. Then, zircon U-Pb age dating was conducted using laser ablation (LA)-ICP-MS technology with a GeoLas 2005 laser denudation system (Coherent, Germany) and an Agilent 7500a ICP-MS (Agilent, Japan). Of the 160 detrital zircons analyzed, 134 results were considered adequate (concordance ≥90%) for evaluating provenance. Offline data processing, including the selection of sample and blank signals, drift correction of instrument sensitivity, and calculation of element contents, U-Th-Pb isotope ratios and ages, was completed using ICPMSDataCal (Liu et al., 2008, 2010). Because of the high content of radioactive Pb, 207Pb/206Pb ages were used for zircon particles older than 1 000 Ma, while for those younger than 1 000 Ma, the more reliable 206Pb/238U ages (Compston et al., 1992; Dickinson and Gehrels, 2003) were used. The dating ages were analyzed with 1σ absolute uncertainties. Zircon U-Pb dating was completed at the State Key Laboratory of Geological Processes and Mineral Resources, China University of Geosciences (Wuhan).
4.
Analytical results
4.1
Major element analysis
The major element contents, chemical index of alteration (CIA) values and chemical index of weathering (CIW) values for mudstone samples from the Enping Formation are reported in Table 1. The data of post-Archean Australian shale (PAAS) come from Taylor and McClennan (1985), and the data of upper continental crust (UCC) come from Rudnick and Gao (2003). In comparison with UCC, the samples have lower contents of Na2O. Most of the samples have higher Al2O3 contents than the UCC. The samples show obviously wide ranges of K2O and CaO contents. In general, the CIA values vary from 62.61 to 81.68 (mean 73.88), and the CIW values range from 68.51 to 96.11 (mean 85.65) (Table 1).
Table
1.
Major element contents, chemical index of alteration (CIA) and chemical index of weathering (CIW) of the lower Oligocene Enping Formation mudstones in the Baiyun Sag
The detailed REE contents are presented in Tables 2 and 3. The trace element compositions and the ratios of La/Th, La/Sc, and Co/Th for the mudstone samples in the Enping Formation are given in Table 4.
Table
2.
Rare earth element compositions (mass fractions) of the mudstone samples from the lower Oligocene Enping Formation
The mudstone samples generally have high REE contents, from 113.46×10⁻⁶ to 313.85×10⁻⁶ with an average of 205.66×10⁻⁶ (Table 3). The light REEs (LREEs) are relatively enriched, with LREE/heavy REE (HREE) ratios of 3.02–6.76 (4.16 on average). The chondrite-normalized values of (La/Yb)N are 7.76–20.45 (10.28 on average), and (La/Sm)N ratios are 3.31–5.78 (3.97 on average). The HREEs are relatively flat, with (Gd/Yb)N values of 1.14–2.12 (1.78 on average). Clear negative Eu anomalies are observed, and δEu (δEu = Eu/Eu* = 2(Eu)N/[(Sm)N+(Gd)N], where N means chondrite-normalized) ranges from 0.50 to 0.92 with an average of 0.62. The Ce anomalies are not evident, and δCe (δCe = Ce/Ce* = 2(Ce)N/[(La)N+(Pr)N]) ranges from 0.94 to 1.10 with an average of 1.03 (Table 3).
4.3
Zircon U-Pb ages
The kernel density estimation diagrams of U-Pb ages with relative ages are shown in Fig. 3. The CL images of representative zircons from the studied samples together with spot ages are also shown in Fig. 3. The Th/U ratios versus U-Pb ages of concordant zircons are plotted in Fig. 4. The upper Enping Formation in the Baiyun Sag has developed three stages of deltas: delta I, delta II and delta III. During the sedimentary period of the Zhuhai Formation, the deltas continued to develop in succession (Zhang et al., 2014).
Figure
3.
Results of the zircon U-Pb ages of the Oligocene sediments in the Baiyun Sag. The detrital zircon age concordance diagrams (a, d, g and j), and the kernel density estimations of the U-Pb age data with the relative ages (b, e, h and k), and the cathodoluminescence images, analyzed points, and geologic ages of detrital zircons (c, f, i and l).
For the samples collected from the upper Enping delta I, forty zircon grains were analyzed, and thirty-one usable ages were obtained (Figs 3j and k). The morphologies of these zircon grains show a wide range of shapes from prismatic crystals to oval grains with mostly subrounded corners (Fig. 3l), suggestive of middle distance grain transport prior to deposition. In addition, some zircon grains are incomplete, and they may have been damaged during transport. The zircon grains are stubby to elongate and variable in size, with the largest grains having lengths of around 230 μm, but most zircons range from 70 μm to 115 μm in length. Most grains show oscillatory growth zoning in CL (Fig. 3l) images and have high Th/U values (>0.4) (Fig. 4d), indicating that the majority of the analyzed zircons are of magmatic origin (Wu and Zheng, 2004). The measured 206Pb/238U (<1 000 Ma) and 207Pb/206Pb (>1 000 Ma) ages range from 1 933 Ma to 67.7 Ma. Seven grains show Precambrian ages from (1 933±35) Ma to (704±6.3) Ma, four grains have Ordovician ages from (483±5.5) Ma to (443±4) Ma, four grains show Triassic ages from (241±3.2) Ma to (236±2.3) Ma, eight grains display Jurassic ages from (169±2.1) Ma to (148±1.6) Ma, and seven grains show Cretaceous ages from (137±2.0) Ma to (67.7±0.9) Ma. Statistically, the overall age spectrum shows four major age peaks ca. 68 Ma, 136 Ma, 168 Ma and 239 Ma, along with several subordinate age peaks ca. 443 Ma, 705 Ma, 1 236 Ma and 1 949 Ma (Fig. 3k).
For the samples collected from the upper Enping delta II, forty zircon grains were analyzed, and thirty-two usable ages were obtained (Figs 3g and h). These zircon grains are colorless and transparent and show a wide range of morphologies from prismatic crystals to oval grains with mostly subrounded corners (Fig. 3i), suggestive of middle distance grain transport prior to deposition. The zircon grains are stubby to elongate and variable in size, with the largest grains having lengths of around 120 μm, but most of them range from 50 μm to 75 μm in length. Most grains show oscillatory growth zoning in CL images (Fig. 3i) and have high Th/U values (>0.4) (Fig. 4c), indicating that the majority of the analyzed zircons are of magmatic origin (Wu and Zheng, 2004). The measured 206Pb/238U (<1 000 Ma) and 207Pb/206Pb (>1 000 Ma) ages range from 2 427 Ma to 58.5 Ma. Three grains show Precambrian ages from (2 427±35.5) Ma to (1 007±9.2) Ma, four grains have Ordovician ages from (474±5.0) Ma to (460±3.8) Ma, three grains display Silurian ages from (440±5.6) Ma to (439±6.1) Ma, four grains show Permian ages from (292±2.7) Ma to (251±2.8) Ma, four grains exhibit Triassic ages from (242±2.5) Ma to (223±3.0) Ma, five grains have Jurassic ages from (169±2.1) Ma to (153±2.1) Ma, and four grains show Cretaceous ages from (128±2.5) Ma to (97.3±1.2) Ma. Statistically, the overall age spectrum shows four major age peaks ca. 59 Ma, 98 Ma, 153 Ma and 241 Ma, along with three subordinate age peaks ca. 441 Ma, 1 828 Ma and 2 452 Ma (Fig. 3h).
For the samples collected from the upper Enping delta III, forty zircon grains were analyzed, and thirty-eight usable ages were obtained (Figs 3d and e). The zircon grains are stubby to elongate and variable in size, with the largest grains having lengths of around 200 μm, but most of them range from 80 μm to 130 μm in length. Most grains show oscillatory growth zoning in CL images (Fig. 3f) and have moderate Th/U values (Fig. 4b), indicating that the grains are of magmatic origin (Wu and Zheng, 2004). The measured 206Pb/238U (<1 000 Ma) and 207Pb/206Pb (>1 000 Ma) ages range from 2 531 Ma to 116 Ma. Eight grains show Precambrian ages from (2 531±31.2) Ma to (769±6.5) Ma, six grains have Silurian ages from (479±5.1) Ma to (448±5.3) Ma, four grains exhibit Devonian ages from (438±3.9) Ma to (427±3.6) Ma, seven grains display Permian ages from (280±3.6) Ma to (252±3.7) Ma, four grains show Jurassic ages from (167±1.7) Ma to (143±2.1) Ma, and five grains have Cretaceous ages from (134±1.1) Ma to (116±1.1) Ma. Statistically, the overall age spectrum shows four major age peaks ca. 118 Ma, 167 Ma, 260 Ma and 437 Ma, along with several subordinate age peaks ca. 771 Ma, 830 Ma, 1 212 Ma, 1 837 Ma and 2 568 Ma (Fig. 3e).
For the samples collected from the Zhuhai Formation, forty zircon grains were analyzed, and thirty-two usable ages were obtained (Figs 3a and b). The morphologies of these zircon grains with mostly rounded corners (Fig. 3c) suggest long-distance grain transport prior to deposition. The zircon grains, with the largest grains having lengths of around 200 μm, are approximately 100 μm in length. Most grains show good roundness, ring structure, and secondary enlargement in CL images (Fig. 3c) and have low Th/U values (<0.4) (Fig. 4a), indicating that the majority of the analyzed zircons are of metamorphic origin (Wu and Zheng, 2004). The measured 206Pb/238U (<1 000 Ma) and 207Pb/206Pb (>1 000 Ma) ages range from 3 231 Ma to 141 Ma. Twenty grains show Precambrian ages from (3 231±32.1) Ma to (550±7.0) Ma, two grains have Carboniferous ages from (325±3.1) Ma to (308±3.9) Ma, two grains display Permian ages from (252±2.7) Ma to (251±2.7) Ma, three grains exhibit Jurassic ages from (176±2.6) Ma to (149±1.4) Ma, and two grains show Cretaceous ages from (143±1.7) Ma to (141±2.6) Ma. Statistically, the overall age spectrum shows three major age peaks ca. 149 Ma, 252 Ma and 380 Ma, along with numerous subordinate age peaks ca. 553 Ma, 765 Ma, 886 Ma, 1 160 Ma, 1 678 Ma, 1 923 Ma, 2 207 Ma, 2 522 Ma and 3 250 Ma (Fig. 3b).
5.
Discussion
5.1
Weathering conditions
The chemical compositions of clastic sediments are mainly controlled by a number of geological factors, including the source rock composition, intensity of weathering, rate of sediment supply, sorting during transport and deposition, and finally postdepositional weathering (Cullers et al., 1997; McLennan, 1989; Roddaz et al., 2006; Armstrong-Altrin et al., 2013). Currently, the CIA proposed by Nesbitt and Young (1982) is used to evaluate the weathering degree in the provenance of clastic rocks. It is defined as CIA = [Al2O3/(Al2O3+CaO*+Na2O+K2O)]×100, where Al2O3, CaO*, Na2O and K2O are molar contents, and CaO* refers to only the calcium in silicates, excluding the calcium in calcite, dolomite and apatite. The weathering degree is considered low if CIA ranges from 50 to 60, moderate if CIA ranges from 60 to 80, and high if CIA>80. For the Enping Formation, the mudstone samples exhibit CIA values of 62.61–81.68 (73.88 on average), indicative of a moderate weathering degree (Table 1).
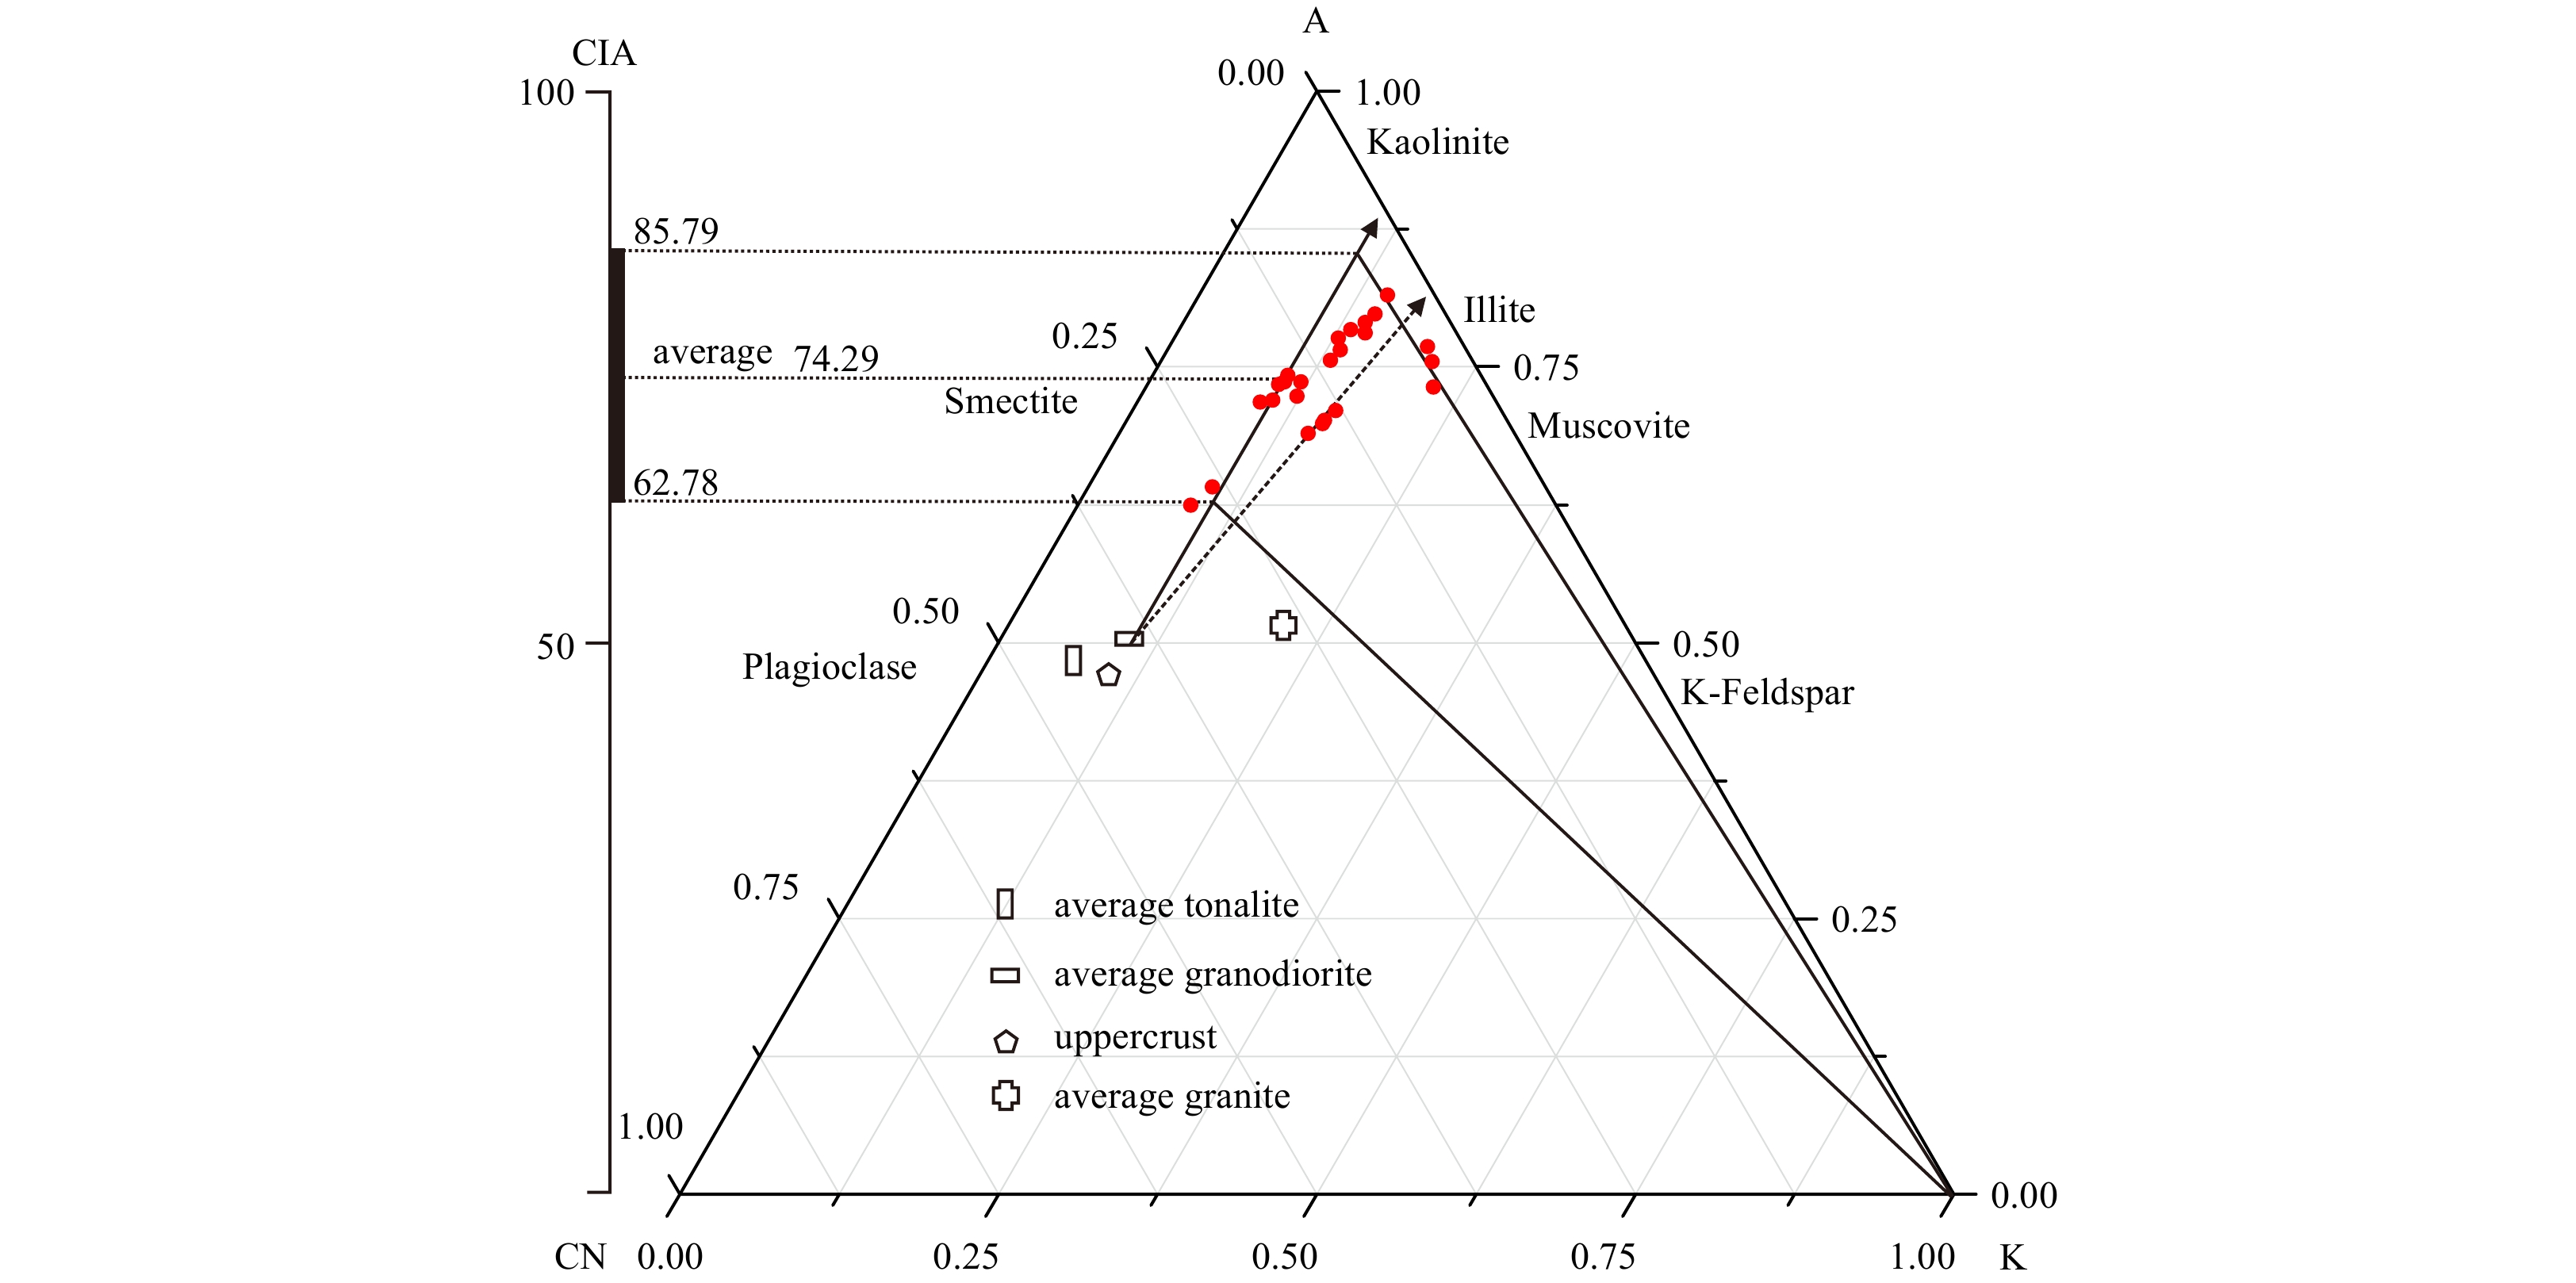
The CIA values can be projected on the triangular diagram of Al2O3-(CaO*+Na2O)-K2O (A-CN-K) to analyze the weathering history of the parent rock (Nesbitt and Young, 1982). The CIA distribution of the parent rock should be parallel to the A-CN trend (the solid line with an arrow in Fig. 5). However, the distribution may deviate from the theoretical line toward the K2O end when the sample undergoes potassic metasomatism to some extent (the dotted line with an arrow in Fig. 5). In this case, a line is extended from the K2O vertex through the sample points to intersect the A-CN theoretical weathering line, and the intersection point is deemed the CIA value before potassic metasomatism (Bhat and Ghosh, 2001). A great majority of mudstone sample points deviate from the theoretical weathering line, and the CIA values range from 62.78 to 85.79 with an average of 74.29 after correction using the mentioned method, indicating that the mudstone experienced moderate weathering.
Figure
5.
Al2O3-(CaO*+Na2O)-K2O (A-CN-K) triangular diagram showing the weathering degrees of the lower Oligocene Enping Formation mudstones in the Baiyun Sag (modified from Fedo et al. (1995)). The solid line with an arrow indicates the theoretical weathering line, and the dotted line with an arrow indicates the sample undergoes potassic metasomatism to some extent. CIA: chemical index of alteration.
Some scholars have proposed the CIW to evaluate the weathering degree, with the expression CIW = [Al2O3/(Al2O3+CaO*+Na2O)]×100 (molar contents), which removes the K2O value in the CIA formula to avoid the increment resulting from potassic metasomatism (Condie et al., 1992). The CIW values are 80 for unweathered potassic granite and 100 for fresh potash feldspar (Fedo et al., 1995). Similar to the CIA, the CIW evaluates the extent to which feldspar converts to clay minerals during the weathering process (Price and Velbel, 2003). The CIW values are 68.51–96.11 with an average of 85.65 for mudstone samples (Table 1). The CIW values also indicate that sediments underwent a moderate degree of weathering.
5.2
Parent rock lithology
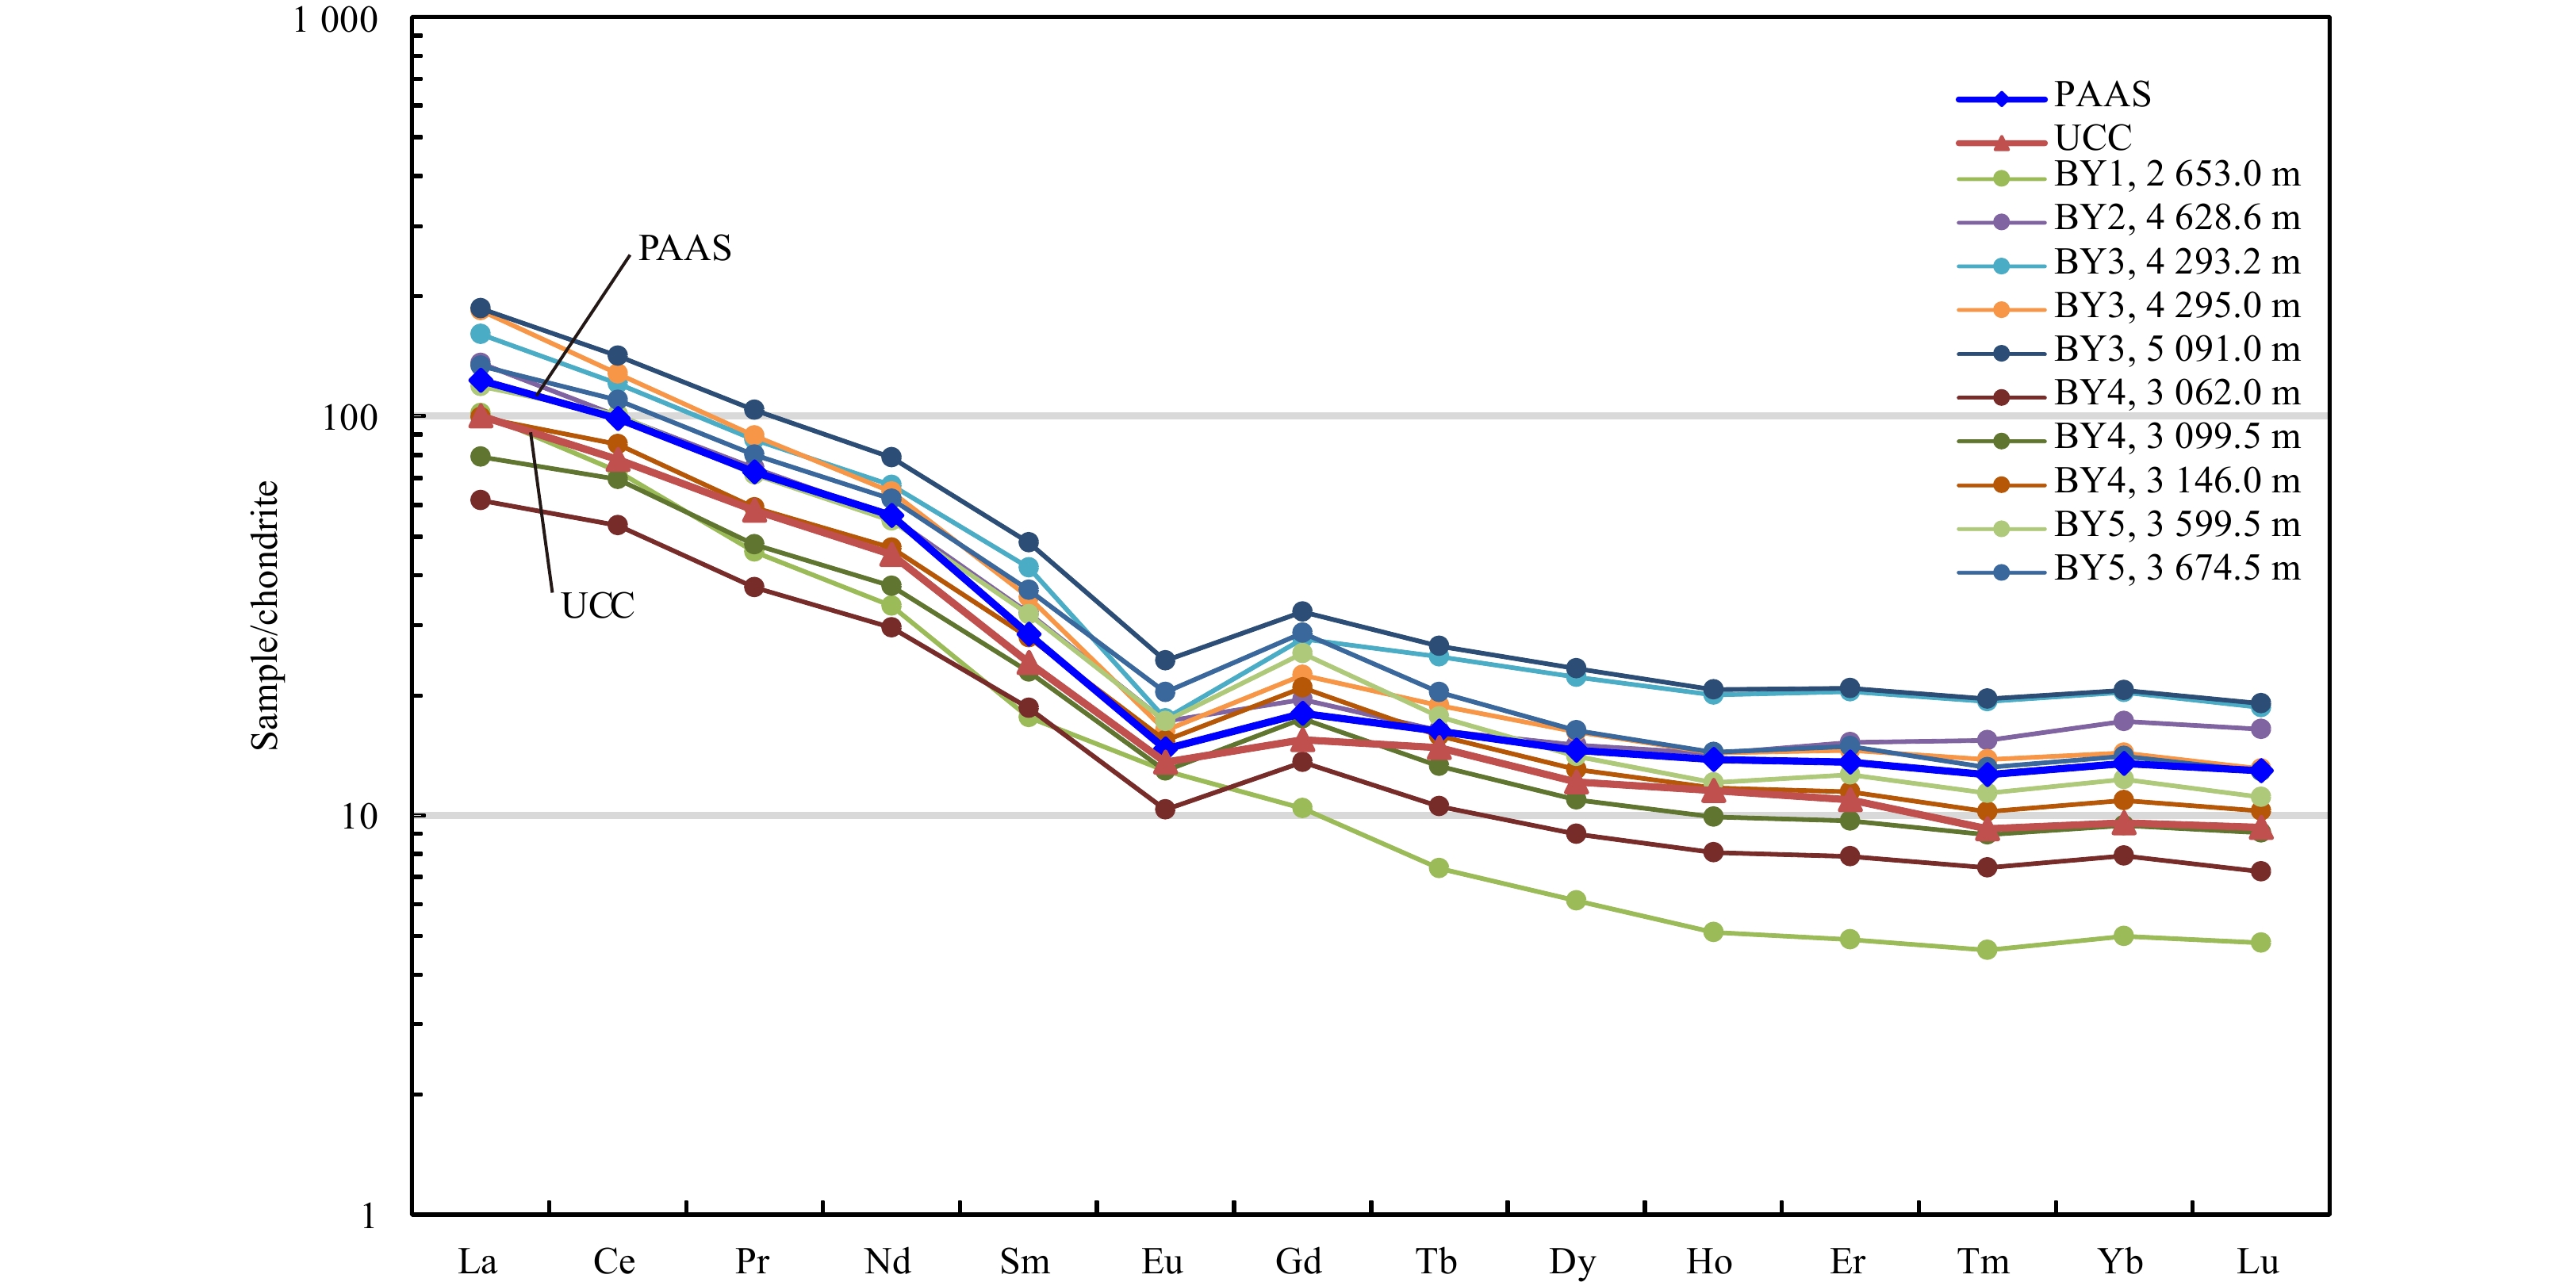
The chondrite-normalized REE patterns almost coincide (Fig. 6), showing a subparallel trend, and are similar to those of the PAAS and UCC. In summary, the lower Oligocene Enping Formation mudstone samples show enriched LREEs, flat HREEs, negative Eu anomalies, negligible Ce anomalies, and apparent right-inclined REEs after chondrite normalization. These characteristics are almost completely consistent with the PAAS and the UCC representing the average REE composition in the upper crust, indicating that the samples in the study area originated from the upper crust (Taylor and McClennan, 1985). In contrast, slight positive Eu anomalies are observed in samples from well BY5 (Fig. 6), showing potential provenances from intermediate to basic volcanic rocks, which indicates the possibility of other sources in local areas (Chen et al., 2018; Shao et al., 2019; Zhang et al., 2020).
Figure
6.
REE distribution of the lower Oligocene Enping Formation mudstones in the Baiyun Sag. PAAS: post-Archean Australian shale, UCC: upper continental crust.
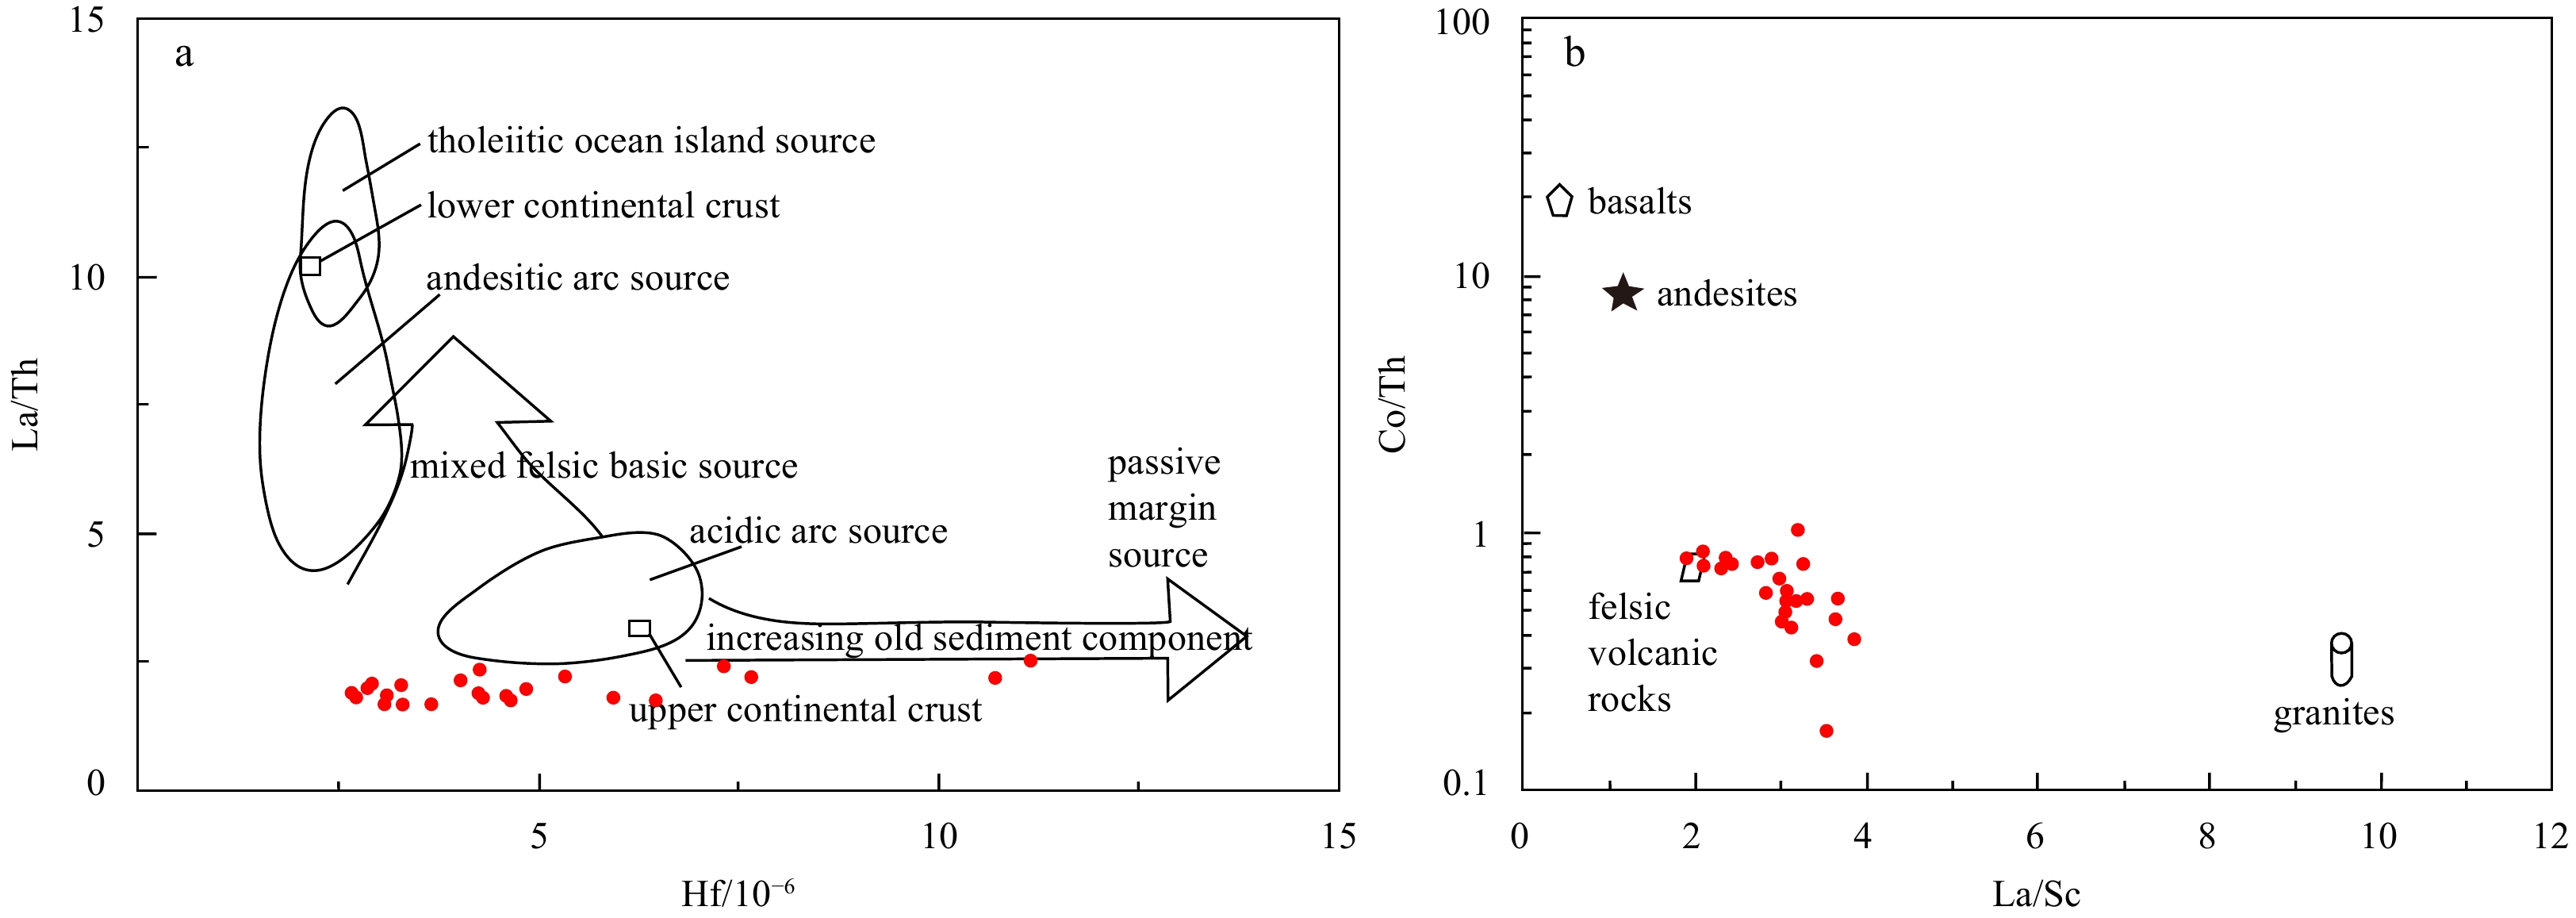
On the Hf-La/Th diagram (Fig. 7a), most mudstone samples plot in the field of acid sediments in the upper crust, and only a few mudstone samples plot in the field of ancient sediments from passive margin sources. On the La/Sc-Co/Th diagram (Fig. 7b), all samples plot in the field of acid volcanic rocks, indicating that the parent rocks were acid volcanic rocks. Based on the two diagrams, most mudstones in the Enping Formation are believed to have originated from acid volcanic rocks in the upper crust, with a few ancient sediments whose parent rocks were also acid volcanic rocks in the upper crust after multiple sedimentary cycles.
Figure
7.
The Hf-La/Th diagram (modified from Floyd and Leveridge (1987)) and the La/Sc-Co/Th diagram (modified from McLennan et al. (1993)) for the mudstone samples from the Enping Formation.
The basement lithology within the ZRMB is very different from that outside the basin, which lays a good foundation for zircon U-Pb dating to identify the provenance of the Oligocene rocks in the Baiyun Sag. Based on the latest research on detrital zircon geochronology in the SCS (Xu et al., 2007; Zhao et al., 2015; Shao et al., 2016a, 2016b; Liu et al., 2017; Wang et al., 2015, 2017), the extrabasinal South China Block and the intrabasinal uplifts in the ZRMB represent the two most important source regions for the Paleogene synrift sequences on the northwestern margin of the Baiyun Sag (Zeng et al., 2019).
The South China fold zone in the northern part of the basin is a provenance system based on the superposition of Precambrian to Paleozoic magmatic episodes and metamorphism and corresponds to complex parent rock lithologies and geologic ages (Yu et al., 2006), while the low uplifts within the basin dominantly contain Mesozoic intermediate-acid igneous basement rocks (Liu and Wu, 2011; Shi et al., 2011). Therefore, the Precambrian to Paleozoic metamorphic and igneous parent rocks are considered an extrabasinal provenance system (Shao et al., 2016a, 2016b; Wang et al., 2017), while the Mesozoic igneous parent rocks in the basement uplifts on the margin of the Baiyun Sag are classified as an intrabasinal provenance system (Li, 2000; Zhou and Li, 2000; Zhou et al., 2008; Yan et al., 2014; Liu et al., 2017). The detrital zircons with metamorphic genesis differ greatly from those with magmatic genesis in morphology and internal structure. Thus, the CL image analyses and U-Pb ages of detrital zircons can be combined to analyze the relative contents of Precambrian to Paleozoic zircons or Mesozoic zircons to identify the supply patterns of the two provenance systems.
Well BY3 is located in the predominant source pathway on the northwestern margin of the Baiyun Sag, which involves three stages of deltas in the upper Enping Formation, i.e., deltas I–III. During the sedimentary period of the Zhuhai Formation, the deltas continued to develop in succession (Zhang et al., 2014). In this study, zircon U-Pb dating of this well is used to study the provenance evolution on the northwestern margin of the Baiyun Sag in the Oligocene.
The U-Pb dating results show a large age span for zircons, with many ages in both the Precambrian to Paleozoic and the Mesozoic. The Mesozoic zircons are the most abundant in the Jurassic, followed by the Cretaceous, and finally the Triassic (Fig. 8). According to the U-Pb ages of zircons in the lithic sandstones in this well, from bottom to top, the content of zircons from Mesozoic igneous rocks decreases from 62% to 50% and further from 29% to 22% in the Zhuhai Formation (Fig. 8), and the Precambrian to Paleozoic detrital zircon content increases gradually. These results indicate that the supply of sediments originated from two provenance systems: the Precambrian-Paleozoic metamorphic rocks in the extrabasinal South China fold zone and the Mesozoic volcanic rocks in the intrabasinal Panyu Low Uplift, and the former supply increased from the early to the late sedimentation period.
Figure
8.
Zircon U-Pb age distributions in the upper Enping Formation to the Zhuhai Formation from Well BY3 in the Baiyun Sag. GR: natural gamma ray.
In this study, major elements, trace elements and detrital zircon U-Pb ages were combined to identify the weathering conditions, parent rock lithologies and provenances of the Oligocene sediments in the Baiyun Sag of the ZRMB. The following conclusions can be drawn:
(1) For the Enping Formation mudstone samples, the CIA values are 62.61–81.68 (73.88 on average), and the CIW values are 68.51–96.11 (85.65 on average), which indicate that the clastic particles in the study area experienced a moderate weathering degree during transport from the provenance to the sedimentary basin.
(2) The lower Oligocene mudstone samples feature enriched LREEs, depleted HREEs, “V”-shaped negative Eu anomalies, negligible Ce anomalies, and apparent inclinations toward the right, similar to the REE distributions and contents of PAAS and UCC and indicative of the upper crust as the provenance. Both the Hf-La/Th and La/Sc-Co/Th diagrams show that the parent rocks were mainly acid igneous rocks from the upper crust.
(3) The analysis of detrital zircon morphologies and U-Pb ages shows two provenance systems during the Oligocene epoch on the northwestern margin of the Baiyun Sag: the Precambrian-Paleozoic metamorphic rocks in the extrabasinal South China fold zone and the Mesozoic volcanic rocks in the intrabasinal Panyu Low Uplift, and the extrabasinal supply gradually became stronger from the early to late sedimentation period. The results indicate that the provenance of the Oligocene deltas underwent a transition from an early proximal source in the intrabasinal system to a late distal source in the extrabasinal system.
Acknowledgements
We thank Xianghua Yang from China University of Geosciences for his help. We specially thank to the anonymous reviewers for their constructive comments and corrections, which have greatly improved the quality of this manuscript.
Amendola U, Perri F, Critelli S, et al. 2016. Composition and provenance of the Macigno Formation (Late Oligocene-Early Miocene) in the Trasimeno Lake area (northern Apennines). Marine and Petroleum Geology, 69: 146–167. doi: 10.1016/j.marpetgeo.2015.10.019
[2]
Armstrong-Altrin J S, Nagarajan R, Madhavaraju J, et al. 2013. Geochemistry of the Jurassic and Upper Cretaceous shales from the Molango Region, Hidalgo, eastern Mexico: Implications for source-area weathering, provenance, and tectonic setting. Comptes Rendus Geoscience, 345(4): 185–202. doi: 10.1016/j.crte.2013.03.004
[3]
Benyon C, Leier A L, Leckie D A, et al. 2016. Sandstone provenance and insights into the paleogeography of the McMurray Formation from detrital zircon geochronology, Athabasca Oil Sands, Canada. AAPG Bulletin, 100(2): 269–287. doi: 10.1306/10191515029
[4]
Bhat M I, Ghosh S K. 2001. Geochemistry of the 2.51 Ga old Rampur group pelites, western Himalayas: implications for their provenance and weathering. Precambrian Research, 108(1–2): 1–16
[5]
Cao Licheng, Jiang Tao, Wang Zhenfeng, et al. 2015. Provenance of Upper Miocene sediments in the Yinggehai and Qiongdongnan basins, northwestern South China Sea: Evidence from REE, heavy minerals and zircon U–Pb ages. Marine Geology, 361: 136–146. doi: 10.1016/j.margeo.2015.01.007
[6]
Cao Licheng, Shao Lei, Qiao Peijun, et al. 2018. Early Miocene birth of modern Pearl River recorded low-relief, high-elevation surface formation of SE Tibetan Plateau. Earth and Planetary Science Letters, 496: 120–131. doi: 10.1016/j.jpgl.2018.05.039
[7]
Castillo P, Lacassie J P, Augustsson C, et al. 2015. Petrography and geochemistry of the carboniferous–Triassic trinity peninsula group, west Antarctica: implications for provenance and tectonic setting. Geological Magazine, 152(4): 575–588. doi: 10.1017/S0016756814000454
[8]
Chen Shuhui, Qiao Peijun, Zhang Houhe, et al. 2018. Geochemical characteristics of Oligocene-Miocene sediments from the deepwater area of the northern South China Sea and their provenance implications. Acta Oceanologica Sinica, 37(2): 35–43. doi: 10.1007/s13131-017-1127-7
[9]
Compston W, Williams I S, Kirschvink J L, et al. 1992. Zircon U-Pb ages for the early Cambrian time-scale. Journal of the Geological Society, 149(2): 171–184. doi: 10.1144/gsjgs.149.2.0171
[10]
Condie K C. 1993. Chemical composition and evolution of the upper continental crust: Contrasting results from surface samples and shales. Chemical Geology, 104(1–4): 1–37
[11]
Condie K C, Boryta M D, Liu Jinzhong, et al. 1992. The origin of khondalites: geochemical evidence from the Archean to Early Proterozoic granulite belt in the North China craton. Precambrian Research, 59(3–4): 207–223
[12]
Cullers R L, Bock B, Guidotti C. 1997. Elemental distributions and neodymium isotopic compositions of Silurian metasediments, western Maine, USA: Redistribution of the rare earth elements. Geochimica et Cosmochimica Acta, 61(9): 1847–1861. doi: 10.1016/S0016-7037(97)00048-3
[13]
Dickinson W R, Gehrels G E. 2003. U-Pb ages of detrital zircons from Permian and Jurassic eolian sandstones of the Colorado Plateau, USA: paleogeographic implications. Sedimentary Geology, 163(1–2): 29–66
[14]
Dominik J, Stanley D J. 1993. Boron, Beryllium and Sulfur in Holocene sediments and peats of the Nile delta, Egypt: Their use as indicators of salinity and climate. Chemical Geology, 104(1–4): 203–216
[15]
Fan Majie, Mankin A, Chamberlain K. 2015. Provenance and depositional ages of Late Paleogene fluvial sedimentary rocks in the Central Rocky Mountains, U.S.A. Journal of Sedimentary Research, 85(11): 1416–1430. doi: 10.2110/jsr.2015.87
[16]
Fedo C M, Nesbitt H W, Young G M. 1995. Unraveling the effects of potassium metasomatism in sedimentary rocks and paleosols, with implications for paleoweathering conditions and provenance. Geology, 23(10): 921–924. doi: 10.1130/0091-7613(1995)023<0921:UTEOPM>2.3.CO;2
[17]
Fedo C M, Young G M, Nesbitt H W, et al. 1997. Potassic and sodic metasomatism in the southern province of the Canadian shield: Evidence from the paleoproterozoic serpent formation, Huronian Supergroup, Canada. Precambrian Research, 84(1–2): 17–36
[18]
Floyd P A, Leveridge B E. 1987. Tectonic environment of the Devonian Gramscatho basin, south Cornwall: framework mode and geochemical evidence from turbiditic sandstones. Journal of the Geological Society, 144(4): 531–542. doi: 10.1144/gsjgs.144.4.0531
[19]
Jiang Tao, Cao Licheng, Xie Xinong, et al. 2015. Insights from heavy minerals and zircon U–Pb ages into the middle Miocene–Pliocene provenance evolution of the Yinggehai Basin, northwestern South China Sea. Sedimentary Geology, 327: 32–42. doi: 10.1016/j.sedgeo.2015.07.011
[20]
Li Xianhua. 2000. Cretaceous magmatism and lithospheric extension in Southeast China. Journal of Asian Earth Science, 18(3): 293–305. doi: 10.1016/S1367-9120(99)00060-7
[21]
Liu An, Wu Shimin. 2011. A discussion on the formation of granite in the Pearl River Mouth Basin and its implication to hydrocarbon resource. Earth Science Frontiers (in Chinese), 18(1): 141–148
[22]
Liu Chang, Clift P D, Carter A, et al. 2017. Controls on modern erosion and the development of the Pearl River drainage in the late Paleogene. Marine Geology, 394: 52–68. doi: 10.1016/j.margeo.2017.07.011
[23]
Liu Chaohui, Liu Fulai, Shi Jianrong, et al. 2016. Depositional age and provenance of the Wutai group: Evidence from zircon U-Pb and Lu-Hf isotopes and whole-rock geochemistry. Precambrian Research, 281: 269–290. doi: 10.1016/j.precamres.2016.06.002
[24]
Liu Yongsheng, Gao Shan, Hu Zhaochu, et al. 2010. Continental and oceanic crust recycling-induced melt-peridotite interactions in the trans-North China orogen: U-Pb dating, Hf isotopes and trace elements in zircons from mantle xenoliths. Journal of Petrology, 51(1–2): 537–571
[25]
Liu Yongsheng, Hu Zhaochu, Gao Shan, et al. 2008. In situ analysis of major and trace elements of anhydrous minerals by LA-ICP-MS without applying an internal standard. Chemical Geology, 257(1–2): 34–43
[26]
Ma Ming, Chen Guojun, Lyu Chengfu, et al. 2019. The formation and evolution of the Paleo-Pearl River and its influence on the source of the northern South China Sea. Marine and Petroleum Geology, 106: 171–189. doi: 10.1016/j.marpetgeo.2019.04.035
[27]
McLennan S M. 1989. Rare earth elements in sedimentary rocks: Influence of provenance and sedimentary processes. Reviews in Mineralogy and Geochemistry, 21(1): 169–200
[28]
McLennan S M, Hemming S, McDaniel D K, et al. 1993. Geochemical approaches to sedimentation, provenance, and tectonics. In: Johnsson M J, Basu A, eds. Processes Controlling the Composition of Clastic Sediments. Boulder: Geological Society of America, 21–40
[29]
Nesbitt H W, Young G M. 1982. Early proterozoic climates and plate motions inferred from major element chemistry of lutites. Nature, 299(5885): 715–717. doi: 10.1038/299715a0
[30]
Pang Xiong, Chen Changmin, Peng Dajun, et al. 2008. Basic geology of Baiyun deep-water area in the northern South China Sea. China Offshore Oil and Gas (in Chinese), 20(4): 215–222
[31]
Price J R, Velbel M A. 2003. Chemical weathering indices applied to weathering profiles developed on heterogeneous felsic metamorphic parent rocks. Chemical Geology, 202(3–4): 397–416
[32]
Roddaz M, Viers J, Brusset S, et al. 2006. Controls on weathering and provenance in the Amazonian foreland basin: Insights from major and trace element geochemistry of Neogene Amazonian sediments. Chemical Geology, 226(1–2): 31–65
[33]
Rudnick R L, Gao Shan. 2003. Composition of the continental crust. Treatise on Geochemistry, 3: 1–64
[34]
Shao Lei, Cao Licheng, Pang Xiong, et al. 2016a. Detrital zircon provenance of the Paleogene syn-rift sediments in the northern South China Sea. Geochemistry, Geophysics, Geosystems, 17(2): 255–269. doi: 10.1002/2015GC006113
[35]
Shao Lei, Cui Yuchi, Stattegger K, et al. 2019. Drainage control of Eocene to Miocene sedimentary records in the southeastern margin of Eurasian Plate. GSA Bulletin, 131(3–4): 461–478
[36]
Shao Lei, Lei Yongchang, Pang Xiong, et al. 2005. Tectonic evolution and its controlling for sedimentary environment in Pearl River Mouth Basin. Journal of Tongji University (Natural Science) (in Chinese), 33(9): 1177–1181
[37]
Shao Lei, Qiao Peijun, Zhao Meng, et al. 2016b. Depositional characteristics of the northern South China Sea in response to the evolution of the Pearl River. Geological Society of London Special Publications, 429(1): 31–44. doi: 10.1144/SP429.2
[38]
Shi Hesheng, Xu Changhai, Zhou Zuyi, et al. 2011. Zircon U-Pb dating on granitoids from the northern South China Sea and its geotectonic relevance. Acta Geologica Sinica, 85(6): 1359–1372. doi: 10.1111/j.1755-6724.2011.00592.x
[39]
Shu Tao, Shan Yansheng, Tang Dazhen, et al. 2016. Mineralogy, major and trace element geochemistry of Shichanggou oil shales, Jimusaer, southern Junggar Basin, China: Implications for provenance, palaeoenvironment and tectonic setting. Journal of Petroleum Science and Engineering, 146: 432–445. doi: 10.1016/j.petrol.2016.06.014
[40]
Sun Jie, Zhan Wenhuan, Qiu Xuelin. 2011. Relationship between tectonic evolution and petroleum systems in Baiyun Sag, Pearl River Mouth Basin. Marine Geology & Quaternary Geology (in Chinese), 31(1): 101–107
[41]
Sun Rui, Li Zhong, Zhao Zhigang, et al. 2020. Characteristics and origin of the Lower Oligocene marine source rocks controlled by terrigenous organic matter supply in the Baiyun Sag, northern South China Sea. Journal of Petroleum Science and Engineering, 187: 106821. doi: 10.1016/j.petrol.2019.106821
[42]
Taylor S R, McClennan S M, 1985. The Continental Crust: Its Composition and Evolution. Oxford: Blackwell Scientific Publications, 312
[43]
Wang Wei, Yang Xianghua, Bidgoli T S, et al. 2019. Detrital zircon geochronology reveals source-to-sink relationships in the Pearl River Mouth Basin, China. Sedimentary Geology, 388: 81–98. doi: 10.1016/j.sedgeo.2019.04.004
[44]
Wang Wei, Ye Jiaren, Bidgoli T, et al. 2017. Using detrital zircon geochronology to constrain Paleogene provenance and its relationship to rifting in the Zhu I depression, Pearl River Mouth Basin, South China Sea. Geochemistry, Geophysics, Geosystems, 18(11): 3976–3999. doi: 10.1002/2017GC007110
[45]
Wang Wei, Ye Jiaren, Yang Xianghua, et al. 2015. Sediment provenance and depositional response to multistage rifting, Paleogene, Huizhou Depression, Pearl River Mouth Basin. Earth Science—Journal of China University of Geosciences (in Chinese), 40(6): 1061–1071. doi: 10.3799/dqkx.2015.088
[46]
Wu Yuanbao, Zheng Yongfei. 2004. Genesis of zircon and its constraints on interpretation of U-Pb age. Chinese Science Bulletin, 49(15): 1554–1569. doi: 10.1007/BF03184122
[47]
Xu Xisheng, O’Reilly S Y, Griffin W L, et al. 2007. The crust of Cathaysia: Age, assembly and reworking of two terranes. Precambrian Research, 158(1–2): 51–78
[48]
Yan Quanshu, Shi Xuefa, Castillo P R. 2014. The late Mesozoic-Cenozoic tectonic evolution of the South China Sea: A petrologic perspective. Journal of Asian Earth Sciences, 85: 178–201. doi: 10.1016/j.jseaes.2014.02.005
[49]
Yu Jinhai, Wang Lijuan, Zhou Xinmin, et al. 2006. Compositions and formation history of the basement metamorphic rocks in Northeastern Guangdong Province. Earth Science (in Chinese), 31(1): 38–48
[50]
Zeng Zhiwei, Yang Xianghua, Zhu Hongtao, et al. 2017. Development characteristics and significance of large delta of upper Enping Formation, Baiyun sag. Earth Science (in Chinese), 42(1): 78–92
[51]
Zeng Zhiwei, Zhu Hongtao, Yang Xianghua, et al. 2019. Using seismic geomorphology and detrital zircon geochronology to constrain provenance evolution and its response of Paleogene Enping Formation in the Baiyun Sag, Pearl River Mouth Basin, South China Sea: Implications for paleo-Pearl River drainage evolution. Journal of Petroleum Science and Engineering, 177: 663–680. doi: 10.1016/j.petrol.2019.02.051
[52]
Zhang Gongcheng. 2010. Tectonic evolution of deepwater area of northern continental margin in South China Sea. Acta Petrolei Sinica (in Chinese), 31(4): 528–533, 541
[53]
Zhang Gongcheng, Mi Lijun, Wu Shiguo, et al. 2007. Deepwater area —the new prospecting targets of northern continental margin of South China Sea. Acta Petrolei Sinica (in Chinese), 28(2): 15–21
[54]
Zhang Gongcheng, Qu Hongjun, Liu Shixiang, et al. 2015. Tectonic cycle of marginal sea controlled the hydrocarbon accumulation in deep-water areas of South China Sea. Acta Petrolei Sinica (in Chinese), 36(5): 533–545
[55]
Zhang Gongcheng, Shao Lei, Qiao Peijun, et al. 2020. Cretaceous–Palaeogene sedimentary evolution of the South China Sea region: A preliminary synthesis. Geological Journal, 55(4): 2662–2683. doi: 10.1002/gj.3533
[56]
Zhang Gongcheng, Yang Haizhang, Chen Ying, et al. 2014. The Baiyun Sag: A giant rich gas-generation sag in the deepwater area of the Pearl River Mouth Basin. Natural Gas Industry (in Chinese), 34(11): 11–25
[57]
Zhao Meng, Shao Lei, Qiao Peijun. 2015. Characteristics of detrital zircon U-Pb geochronology of the Pearl River Sands and its implication on provenances. Journal of Tongji University (Natural Science) (in Chinese), 43(6): 915–923
[58]
Zhou Di, Sun Zhen, Chen Hanzong, et al. 2008. Mesozoic paleogeography and tectonic evolution of South China Sea and adjacent areas in the context of Tethyan and Paleo-Pacific interconnections. Island Arc, 17(2): 186–207. doi: 10.1111/j.1440-1738.2008.00611.x
[59]
Zhou Xinmin, Li Wuxian. 2000. Origin of Late Mesozoic igneous rocks in southeastern China: implications for lithosphere subduction and underplating of mafic magmas. Tectonophysics, 326(3–4): 269–287
Geer Zhao, Rui Zhu, Zhenyu Si, et al. The Association Between Sand Body Distribution and Fault of Zhuhai Formation on the North Slope of Baiyun Sag, Pearl River Mouth Basin, China. Applied Sciences, 2025, 15(1): 412. doi:10.3390/app15010412
2.
Gongcheng Zhang, Chengfu Lyu, Dongsheng Yang, et al. The dominant three-element model of oil and gas accumulation in basement buried hills: A discussion on new exploration frontiers in the deepwater area of the northern South China Sea. Journal of Natural Gas Geoscience, 2024, 9(2): 69. doi:10.1016/j.jnggs.2024.03.003
Table
1.
Major element contents, chemical index of alteration (CIA) and chemical index of weathering (CIW) of the lower Oligocene Enping Formation mudstones in the Baiyun Sag
Figure 1. Location and tectonic units of the Baiyun Sag and the locations of sampled boreholes. Major and trace element analyses were performed for samples from wells BY1–BY5, and detrital zircon dating was performed for samples from Well BY3.
Figure 2. Composite column of stratigraphy, tectonic evolution, and environmental characteristics in the Baiyun Sag (modified from Pang et al. (2008)).
Figure 3. Results of the zircon U-Pb ages of the Oligocene sediments in the Baiyun Sag. The detrital zircon age concordance diagrams (a, d, g and j), and the kernel density estimations of the U-Pb age data with the relative ages (b, e, h and k), and the cathodoluminescence images, analyzed points, and geologic ages of detrital zircons (c, f, i and l).
Figure 4. Th/U ratios versus U-Pb ages of concordant zircons from the Oligocene sediments in the Baiyun Sag.
Figure 5. Al2O3-(CaO*+Na2O)-K2O (A-CN-K) triangular diagram showing the weathering degrees of the lower Oligocene Enping Formation mudstones in the Baiyun Sag (modified from Fedo et al. (1995)). The solid line with an arrow indicates the theoretical weathering line, and the dotted line with an arrow indicates the sample undergoes potassic metasomatism to some extent. CIA: chemical index of alteration.
Figure 6. REE distribution of the lower Oligocene Enping Formation mudstones in the Baiyun Sag. PAAS: post-Archean Australian shale, UCC: upper continental crust.
Figure 7. The Hf-La/Th diagram (modified from Floyd and Leveridge (1987)) and the La/Sc-Co/Th diagram (modified from McLennan et al. (1993)) for the mudstone samples from the Enping Formation.
Figure 8. Zircon U-Pb age distributions in the upper Enping Formation to the Zhuhai Formation from Well BY3 in the Baiyun Sag. GR: natural gamma ray.


 DownLoad:

 DownLoad:


 DownLoad:


