

Response of harmful dinoflagellate distribution in the China Sea to global climate change
-
Abstract: By establishing a distribution and environmental factor database of 21 typical harmful dinoflagellates in global waters, the MaxEnt model was used to predict shifts in the habitat of harmful dinoflagellates in Chinese waters under global climate change. The results revealed that offshore distance was the most important predictive factor and that surface seawater temperature (SST), primary productivity, and nitrate concentration were the key ecological factors influencing the distribution of harmful dinoflagellates. Under the low greenhouse gas emission scenario defined by the Intergovernmental Panel on Climate Change (IPCC), by approximately 2050, 17 of the 21 harmful dinoflagellate species in high-suitability areas (HSA) will migrate northward, six species will migrate eastward, and six species will expand their HSA. By 2100, approximately 18 of the 21 harmful dinoflagellate species in HSA will have migrated northward, seven species will have migrated eastward, and four species will have expanded their HSA. Notably, the HSA content of highly toxic Alexandrium minutum is expected to increase by 13.4% and 9.4% by 2050 and 2100, respectively. Under the high greenhouse gas emissions, there will be 17 species migrating northward, 6 species migrating eastward, and 4 species increasing in their size in HSA by 2050; moreover, there will be 16 species migrating northward, 2 migrating eastward, and 4 species according to their size of HSA by 2100. Specifically, the HSA of A. minutum is predicted to increase by 7.0% and 25.9% by 2050 and 2100, respectively. Notably, Alexandrium ostenfeldii, which is currently seldom present in the China Sea, is predicted to exhibit an HSA in most coastal areas of the Yellow Sea, the Bohai Sea, the Hangzhou Bay, the Zhejiang Coast, and the Beibu Gulf of the South China Sea. Conversely, the HSA of Noctiluca scintillans, a typical red-tide species, will be reduced by 7%–90%. The northward migration of Karenia mikimotoi exceeded 100 and 300 km under low and high greenhouse gas emission scenarios, respectively. These changes underscore the significant impact of climate change on the distribution and habitat suitability of harmful dinoflagellates, thus indicating a potential shift in their ecological dynamics and consequent effects on marine ecosystems.
-
Key words:
- harmful dinoflagellate /
- climate change /
- suitable habitat /
- MaxEnt /
- species distribution shifts
-
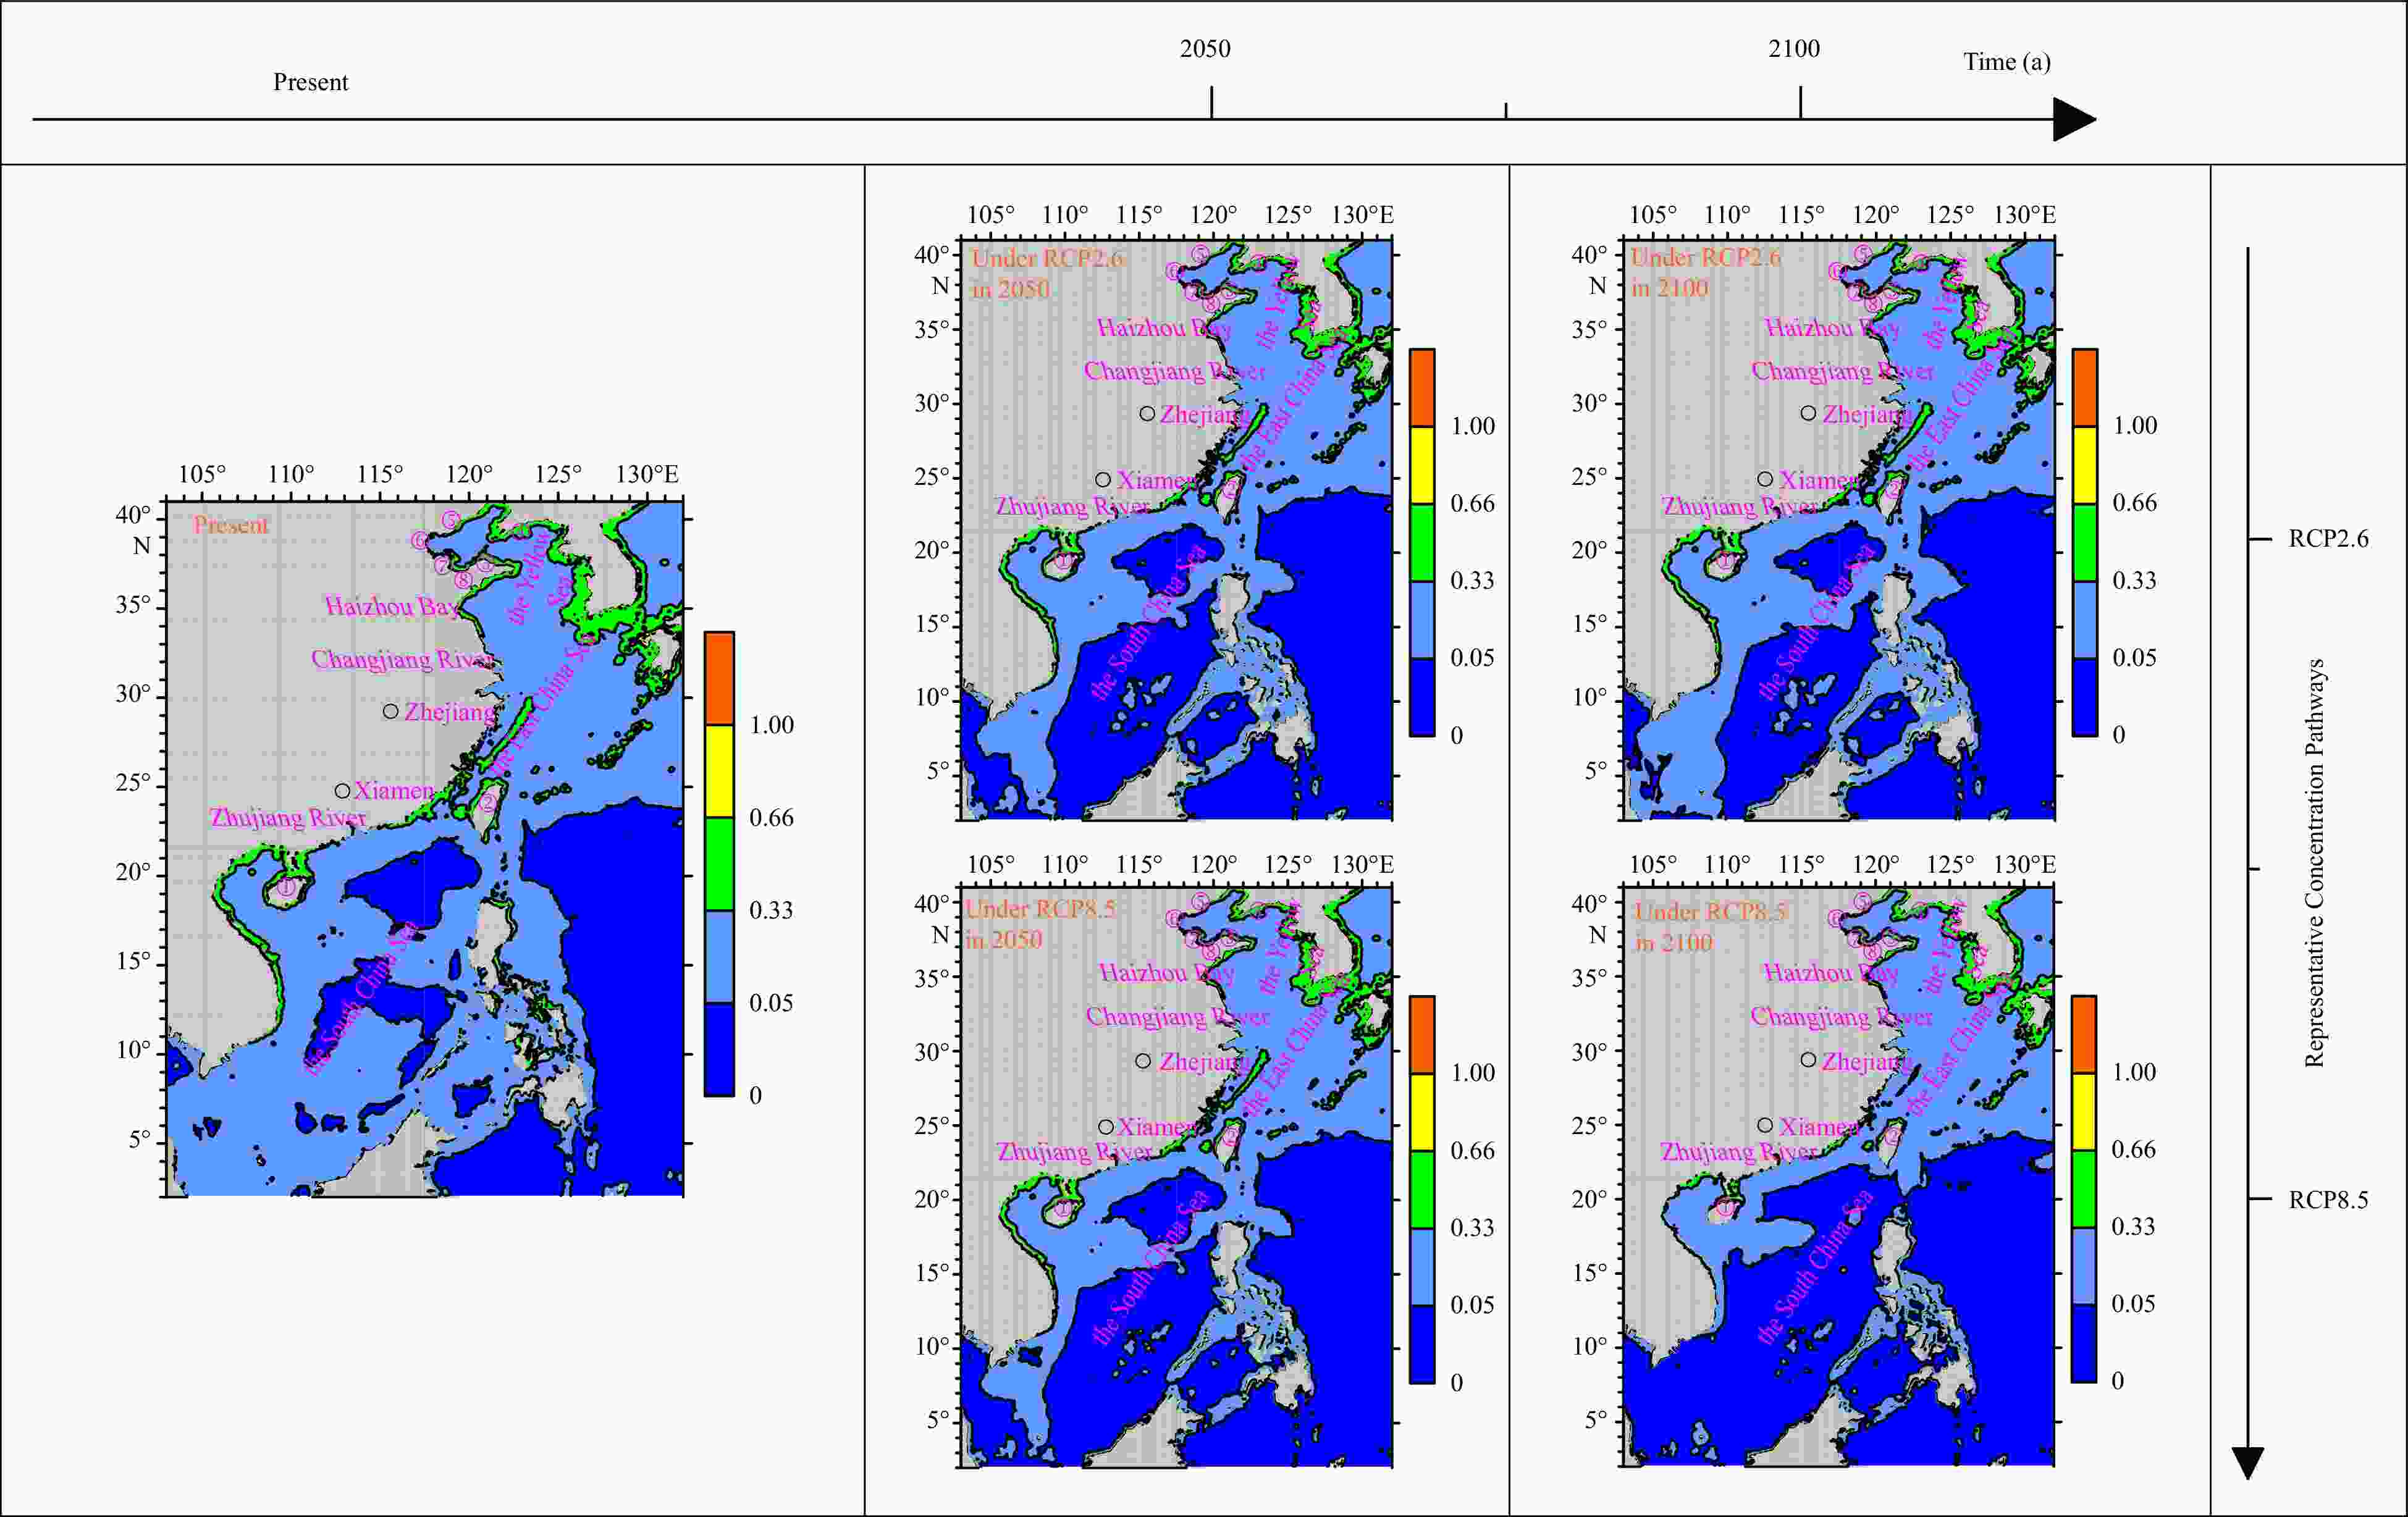
Figure 1. The average value of cloglog of 21 dinoflagellates in the China Sea and adjacent waters currently (left), under RCP2.6 (middle up) and RCP8.5 (middle down) in 2050, and under RCP2.6 (right up) and RCP8.5 (right down) in
2100 (Number symbol ①: Hainan Island; ②: Taiwan Island; ③: Shandong Peninsula; ④: Changshan Archipelago; ⑤: Zhimao Bay; ⑥: Bohai Bay; ⑦: Laizhou Bay; ⑧: Jiaozhou Bay; ⑨: Beibu Gulf; ⑩: Bohai Sea) (Color bar, Blue: unsuitable area; Baby blue: low suitable area; Green: moderate suitable area; Yellow: high suitable area; Orange: high suitable area with a presence probability of equal to1).Table 1. Number of distribution spots of 21 dinoflagellates in global oceans and the China Sea and adjacent waters
Species Spots in global
oceansSpots in the China Sea and adjacent
waters (2° –4° N, 103° –132° E)1 Akashiwo sanguinea (K.Hirasaka) Gert Hansen & Moestrup 7 751 201 2 Alexandrium minutum Halim 4 308 4 3 Alexandrium ostenfeldii (Paulsen) Balech & Tangen 1 265 1 4 Azadinium poporum Tillmann & Elbrächter 96 27 5 Azadinium spinosum Elbrächter & Tillmann 274 0 6 Coolia monotis Meunier 211 0 7 Dinophysis acuminata Claparède & Lachmann 32 775 27 8 Gambierdiscus toxicus R.Adachi & Y.Fukuyo 11 0 9 Gonyaulax spinifera (Claparède & Lachmann) Diesing 8 635 15 10 Gonyaulax verior Sournia 1 167 3 11 Gymnodinium catenatum H.W.Graham 1 030 8 12 Karenia mikimotoi (Miyake & Kominami ex Oda) Gert Hansen & Moestrup 7 285 280 13 Karlodinium veneficum (D.Ballantine) J.Larsen 5 685 4 14 Lingulodinium polyedra (F.Stein) J.D.Dodge 9 136 5 15 Margalefidinium polykrikoides (Margalef) F.Gómez, Richlen & D.M.Anderson 86 2 16 Noctiluca scintillans (Macartney) Kofoid & Swezy 25 959 1 098 17 Ostreopsis ovata Y.Fukuyo 30 5 18 Polykrikos hartmannii W.M.Zimmermann 262 2 19 Prorocentrum lima (Ehrenberg) F.Stein 2 538 152 20 Protoceratium reticulatum (Claparède & Lachmann) Bütschli 5 886 30 21 Pyrodinium bahamense var. compressum (Böhm) Steidinger, Tester & F.J.R.Taylor 71 40 Note: As some of the collected data detailing harmful dinoflagellate distribution spots were not readily available, this portion of the data was not used to establish a database of harmful dinoflagellate distribution spots. As the database of harmful dinoflagellate distribution areas did not include the appearance time, all collected data regarding harmful dinoflagellate distribution spots were applied when establishing the database of harmful dinoflagellate distribution areas. This resulted in some harmful dinoflagellate species possessing low times and sparse domain frequencies, and this is inconsistent with the data in Tables 1 and 2.  下载: 导出CSV
Table 2. Number of distribution areas of 21 dinoflagellates in global oceans and the China Sea and adjacent waters
Species Distribution areas in
global oceansDistribution areas in the China Sea and adjacent
waters (2°–4° N, 103°–132° E)1 Akashiwo sanguinea 389 25 2 Alexandrium minutum 136 5 3 Alexandrium ostenfeldii 149 1 4 Azadinium poporum 60 6 5 Azadinium spinosum 76 0 6 Coolia monotis 52 2 7 Dinophysis acuminata 1 337 15 8 Gambierdiscus toxicus 8 0 9 Gonyaulax spinifera 1 124 7 10 Gonyaulax verior 112 6 11 Gymnodinium catenatum 111 17 12 Karenia mikimotoi 148 18 13 Karlodinium veneficum 184 6 14 Lingulodinium polyedra 360 4 15 Margalefidinium polykrikoides 67 23 16 Noctiluca scintillans 2 716 76 17 Ostreopsis ovata 66 5 18 Polykrikos hartmannii 44 12 19 Prorocentrum lima 314 12 20 Protoceratium reticulatum 467 14 21 Pyrodinium bahamense var. compressum 72 19
下载: 导出CSV
Table 3. Selected environmental variables for the MaxEnt model of dinoflagellate distribution
Species Dominant environmental variable Common Current
velocityIce
thicknessNitrate Salinity Temperature Primary
productivity 1Primary
productivity 21 Akashiwo sanguinea CV.Min
Depth.Mean
Distance.Mean
DO.Range
Ice.Min
N.Range
S.Range
T.RangeCV.Range Ice.Lt.max N.Lt.max S.Min T.Mean Pr.Max Pr.Lt.min 2 Alexandrium minutum CV.Range Ice.Max N.Lt.max S.Min T.Lt.min Pr.Range Pr.Lt.min 3 Alexandrium ostenfeldii CV.Range Ice.Max N.Mean S.Min T.Mean Pr.Range Pr.Min 4 Azadinium poporum CV.Mean Ice.Max N.Lt.max S.Lt.min T.Min Pr.Range Pr.Lt.min 5 Azadinium spinosum CV.Lt.max Ice.Max N.Lt.max S.Min T.Mean Pr.Range Pr.Lt.min 6 Coolia monotis CV.Mean Ice.Max N.Lt.min S.Lt.min' T.Min Pr.Range Pr.Lt.min 7 Dinophysis acuminata CV.Max Ice.Range N.Mean S.Max T.Mean Pr.Range Pr.Lt.min 8 Gambierdiscus toxicus CV.Max Ice.Max N.Min S.Min T.Min Pr.Lt.max Pr.Lt.min 9 Gonyaulax spinifera CV.Lt.max Ice.Range N.Lt.min S.Min' T.Max Pr.Range Pr.Lt.min 10 Gonyaulax verior CV.Range Ice.Lt.max N.Lt.min S.Lt.max T.Max Pr.Max Pr.Lt.min 11 Gymnodinium catenatum CV.Lt.max Ice.Lt.max N.Mean S.Min T.Lt.min Pr.Range Pr.Min 12 Karenia mikimotoi CV.Lt.max Ice.Max N.Lt.min S.Mean T.Mean Pr.Lt.max Pr.Lt.min 13 Karlodinium veneficum CV.Lt.max Ice.Range N.Lt.min S.Max T.Max Pr.Lt.max Pr.Min 14 Lingulodinium polyedra CV.Lt.max Ice.Lt.max N.Max S.Min T.Mean Pr.Max Pr.Min 15 Margalefidinium polykrikoides CV.Range Ice.Lt.max N.Mean S.Lt.min T.Max Pr.Max Pr.Min 16 Noctiluca scintillans CV.Range Ice.Max N.Lt.min S.Min T.Lt.min Pr.Max Pr.Lt.min 17 Ostreopsis ovata CV.Lt.max Ice.Max N.Lt.max S.Lt.min T.Mean Pr.Range Pr.Min 18 Polykrikos hartmannii CV.Mean Ice.Lt.max N.Mean S.Min T.Lt.min Pr.Range Pr.Lt.min 19 Prorocentrum lima CV.Lt.max Ice.Lt.max N.Lt.max S.Lt.min T.Lt.min Pr.Range Pr.Lt.min 20 Protoceratium reticulatum CV.Lt.max Ice.Range N.Lt.min S.Lt.min T.Mean Pr.Max Pr.Min 21 Pyrodinium bahamense var. compressum CV.Lt.max Ice.Max N.Min S.Min T.Min Pr.Lt.max Pr.Lt.min Note: CV represents current velocity; Ice represents ice thickness; DO represents dissolved oxygen; N represents nitrate; S represents salinity; T represents temperature; Pr represents primary productivity.
下载: 导出CSV
Table 4. Number of changes in the suitable habitat for 21 typical harmful dinoflagellates
Year Scenario Number of dinoflagellates Low suitable area Moderate suitable area High suitable area N/km E/km S/% N/km E/km S/% N/km E/km S/% 2050 RCP2.6 16 3 2 16 6 4 17 6 6 RCP8.5 17 4 2 16 4 3 17 6 4 2100 RCP2.6 15 5 3 16 8 4 18 7 4 RCP8.5 17 2 2 16 4 2 16 2 4 Note: N, moves northward; E, moves eastward; S, size increases by.
下载: 导出CSV
Table 5. Changes in the habitat of 21 typical harmful dinoflagellates
Species HSA at
present/
km2RCP2.6 RCP8.5 2050 2100 2050 2100 N/km E/km S/% N/km E/km S/% N/km E/km S/% N/km E/km S/% 1 Akashiwo sanguinea 200 209.6 245.9 72.3 –28.6 231.2 68.8 –26.5 323.1 54.6 –29.8 762.9 –199.2 –63.4 2 Alexandrium minutum 67 571.9 30.7 –6.7 13.4 30.9 –4.7 9.4 59.5 –21.8 7.0 166.9 –49.4 25.9 3 Alexandrium ostenfeldii 216 556.8 –2.1 17.2 13.6 6.6 14.7 7.3 22.8 10.1 3.3 145.0 –24.5 12.1 4 Azadinium poporum 41 364.8 4.6 –13.2 –6.6 30.5 –16.5 –8.0 7.6 –18.5 –14.8 34.6 –41.7 –36.8 5 Azadinium spinosum 619 102.0 –34.2 –17.0 8.5 –33.7 –5.1 3.8 –20.4 –20.8 11.3 –42.3 –46.7 16.9 6 Coolia monotis 69 597.8 174.1 24.7 0.1 159.8 11.4 –8.2 173.2 19.1 0.3 427.2 72.0 24.5 7 Dinophysis acuminata 914 189.6 147.7 –12.4 –2.9 131.0 –6.7 –4.7 170.0 –17.1 –4.1 302.4 –82.9 –13.9 8 Gambierdiscus toxicus 1 723 326.5 61.3 –47.5 –31.6 52.2 –22.2 –25.6 28.8 –81.6 –41.8 14.4 –89.2 –47.1 9 Gonyaulax spinifera 584 764.3 433.0 –51.3 –47.4 375.3 –55.8 –37.3 815.9 –110.2 –64.3 1254.0 –306.5 –94.5 10 Gonyaulax verior 0.0 0.0 0.0 0.0 0.0 0.0 0.0 0.0 0.0 0.0 0.0 0.0 0.0 11 Gymnodinium catenatum 189 890.6 173.1 –72.8 –24.6 138.5 –59.5 –25.4 160.2 –67.2 –22.4 385.4 –159.0 –46.5 12 Karenia mikimotoi 139 071.7 102.3 –66.3 –23.0 74.3 –55.0 –22.6 128.9 –70.9 –25.7 325.0 –117.4 –59.8 13 Karlodinium veneficum 370 537.3 130.4 –8.9 –14.0 99.6 –7.9 –14.7 217.2 –1.1 –22.8 371.0 –101.8 –28.7 14 Lingulodinium polyedra 808 766.7 486.3 –29.1 –30.2 457.6 –19.6 –27.2 551.7 –45.3 –34.0 750.3 –102.4 –48.4 15 Margalefidinium polykrikoides 227 992.4 –270.1 15.0 –21.2 –195.0 6.5 –14.7 –246.6 3.5 –28.3 –410.1 –1.1 –49.3 16 Noctiluca scintillans 1 600 532.5 182.3 32.3 –13.7 132.7 36.9 –6.7 283.1 8.7 –19.8 571.8 –86.1 –30.6 17 Ostreopsis ovata 6 608.2 360.3 –28.9 –79.9 254.2 –31.9 –78.6 601.5 –289.9 –89.5 – – –100.0 18 Polykrikos hartmannii 28 540.8 1.7 0.1 –29.9 27.6 10.8 –20.4 –13.3 19.9 –39.8 –85.9 31.5 –55.1 19 Prorocentrum lima 738 403.0 178.5 –2.9 0.2 166.0 –8.1 –0.7 187.0 –1.4 –1.6 351.4 –36.0 –8.5 20 Protoceratium reticulatum 581 481.4 14.9 –3.8 0.6 7.1 –1.3 0.003 35.6 –9.5 –2.2 100.8 –43.2 –13.0 21 Pyrodinium bahamense
var. compressum96 582.8 60.9 –8.7 –19.3 46.5 6.2 –13.3 92.9 –20.2 –35.9 150.6 –104.7 –59.5 Note: HSA represents highly suitable area; N represents moving northward; E represents moving eastward; S represents size increase; RCP represents representative concentration pathway.
下载: 导出CSV
Table 6. Rank of environmental function variables impacts on the distribution of species of dinoflagellates
Species ST5/
%Environmental factors rank 1 2 3 4 5 1 Akashiwo sanguinea 84 Distance.Mean Depth.Mean Nitrate.Lt.max Primary.
productivity.Lt.minTemperature.Mean 2 Alexandrium minutum 85 Depth.Mean Distance.Mean Primary.
productivity.Lt.minTemperature.Lt.min Dissolved.oxygen.
Range3 Alexandrium ostenfeldii 83 Depth.Mean Nitrate.Mean Distance.Mean Dissolved.oxygen.Range Temperature.Mean 4 Azadinium poporum 85 Depth.Mean Primary.
productivity.Lt.minDistance.Mean Nitrate.Range Temperature.Min 5 Azadinium spinosum 79 Primary.
productivity.Lt.minDepth.Mean Distance.Mean Dissolved.oxygen.Range Nitrate.Range 6 Coolia monotis 92 Distance.Mean Depth.Mean Temperature.Range Ice.thickness.Max Primary.
productivity.Lt.min7 Dinophysis acuminata 84 Distance.Mean Depth.Mean Nitrate.Mean Temperature.Mean Primary.
productivity.Lt.min8 Gambierdiscus toxicus 97 Distance.Mean Nitrate.Min Temperature.Min Salinity.Range Ice.thickness.Max 9 Gonyaulax spinifera 71 Distance.Mean Depth.Mean Dissolved.oxygen.
RangeTemperature.Max Primary.
productivity.Lt.min10 Gonyaulax verior 87 Depth.Mean Distance.Mean Temperature.Max Primary.
productivity.Lt.minSalinity.Range 11 Gymnodinium catenatum 86 Distance.Mean Depth.Mean Temperature.Lt.min Ice.thickness.Lt.max Temperature.Range 12 Karenia mikimotoi 88 Temperature.Mean Depth.Mean Primary.
productivity.Lt.minDistance.Mean Nitrate.Lt.min 13 Karlodinium veneficum 84 Depth.Mean Distance.Mean Salinity.Range Current.Velocity.Lt.max Dissolved.oxygen.
Range14 Lingulodinium polyedra 77 Distance.Mean Temperature.Mean Primary.
productivity.MinTemperature.Range Depth.Mean 15 Margalefidinium
polykrikoides84 Depth.Mean Distance.Mean Ice.thickness.Min Ice.thickness.Lt.max Salinity.Range 16 Noctiluca scintillans 88 Distance.Mean Primary.
productivity.Lt.minTemperature.Lt.min Salinity.Min Depth.Mean 17 Ostreopsis ovata 91 Distance.Mean Temperature.Mean Ice.thickness.Max Temperature.Range Current.Velocity.
Lt.max18 Polykrikos hartmannii 86 Distance.Mean Depth.Mean Temperature.Lt.min Primary.
productivity.RangeTemperature.Range 19 Prorocentrum lima 87 Distance.Mean Primary.
productivity.Lt.minDepth.Mean Temperature.Lt.min Primary.
productivity.Range20 Protoceratium reticulatum 79 Depth.Mean Temperature.Mean Dissolved.oxygen.
RangeDistance.Mean Temperature.Range 21 Pyrodinium bahamense
var. compressum94 Distance.Mean Temperature.Min Current.Velocity.
Lt.maxDepth.Mean Temperature.Range Note: CV represents current velocity; Ice represents ice thickness; DO represents dissolved oxygen; N represents nitrate; S represents salinity; T represents temperature; Pr represents primary productivity; ST5 represents sum of the top five environmental variables contributing to the model’s predictive ability.
下载: 导出CSV
Table 7. Importance rank of environmental factors on the distribution of dinoflagellates
Environmental factors Spatial variables Ecological factor Distance Depth Temperature Primary productivity Nitrate Ice thickness Dissolved oxygen Salinity Current velocity EFR 1.8 2.1 3.2 3.3 3.4 3.8 4.0 4.2 4.0 n 21 19 18 13 7 5 6 5 3 Note: EFR represents importance rank of environmental factors on the distribution of dinoflagellates; n represents number of species among the 21 typical dinoflagellate species.
下载: 导出CSV
-
Assis J, Tyberghein L, Bosch S, et al. 2018. Bio-ORACLE v2.0: Extending marine data layers for bioclimatic modelling. Global Ecology and Biogeography, 27(3): 277–284, doi: 10.1111/geb.12693 Beaumont C D. 1981. Regression diagnostics—Identifying influential data and sources of collinearity. Journal of the Operational Research Society, 32(2): 157–158 Bertram J, Newman E A, Dewar R C. 2019. Comparison of two maximum entropy models highlights the metabolic structure of metacommunities as a key determinant of local community assembly. Ecological Modelling, 407: 108720, doi: 10.1016/j.ecolmodel.2019.108720 Burkholder J M, Glibert P M, Skelton H M. 2008. Mixotrophy, a major mode of nutrition for harmful algal species in eutrophic waters. Harmful Algae, 8(1): 77–93, doi: 10.1016/j.hal.2008.08.010 Cai Rongshuo, Han Zhiqiang, Yang Zhengxian. 2020. Impacts and risks of changing ocean on marine ecosystems and dependent communities and related responses. Climate Change Research (in Chinese), 16(2): 182–193 Cai Rongshuo, Tan Hongjian, Guo Haixia. 2019. Responses and compound risks of the coastal China areas to global change. Journal of Applied Oceanography (in Chinese), 38(4): 514–527 Chen Baohong, Wang Kang, Lin Hui. 2019. Akashiwo sanguinea blooms in Chinese waters in 1998–2017. Marine Pollution Bulletin, 149: 110652, doi: 10.1016/j.marpolbul.2019.110652 China National Marine Science Data Center. 2021. Further analysis of global monthly average data (in Chinese). http://mds.nmdis.org.cn/[2019-08-06/2021-05-16] Elith J, Phillips S J, Hastie T, et al. 2011. A statistical explanation of MaxEnt for ecologists. Diversity and Distributions, 17(1): 43–57, doi: 10.1111/j.1472-4642.2010.00725.x Gu Haifeng. 2011. Morphology, phylogenetic position, and ecophysiology of Alexandrium ostenfeldii (Dinophyceae) from the Bohai Sea, China. Journal of Systematics and Evolution, 49(6): 606–616, doi: 10.1111/j.1759-6831.2011.00160.x Gu Haifeng, Liu Tingting, Vale P, et al. 2013. Morphology, phylogeny and toxin profiles of Gymnodinium inusitatum sp. nov. , Gymnodinium catenatum and Gymnodinium microreticulatum (Dinophyceae) from the Yellow Sea, China. Harmful Algae, 28: 97-107 Gu Haifeng, Wu Yiran, Lü Songhui, et al. 2022. Emerging harmful algal bloom species over the last four decades in China. Harmful Algae, 111: 102059, doi: 10.1016/j.hal.2021.102059 Guo Hao, Ding Dewei, Lin Feng’ao, et al. 2015. Characteristics and patterns of red tide in China coastal waters during the last 20a. Advances in Marine Science (in Chinese), 33(4): 547–558 Guo Hao, Lin Feng’ao, Liu Yongjian, et al. 2014. High-incidence HABs causative species in China coastal waters and the forewarning method based on the HABs risk index. Marine Environmental Science (in Chinese), 33(1): 94–98 IPCC. 2013. Summary for policymakers. In: Climate Change 2013: The Physical Science Basis. Contribution of Working Group I to the Fifth Assessment Report of the Intergovernmental Panel on Climate Change. Cambridge, United Kingdom and New York, NY, USA: Cambridge University Press, 3-29 IPCC. 2019. Summary for policymakers. In: Climate Change and Land: An IPCC Special Report on Climate Change, Desertification, Land Degradation, Sustainable Land Management, Food Security, and Greenhouse Gas Fluxes in Terrestrial Ecosystems. Cambridge, United Kingdom and New York, NY, USA: Cambridge University Press, 3-34 IPCC. 2021. Summary for policymakers. In: Climate Change 2021: The Physical Science Basis. Contribution of Working Group Ito the Sixth Assessment Report of the Intergovernmental Panel on Climate Change. Cambridge, United Kingdom and New York, NY, USA: Cambridge University Press, 3-32 Kariya T, Kurata H, Hayashi T. 2024. A modelling framework for regression with collinearity. Journal of Statistical Planning and Inference, 228: 95–115, doi: 10.1016/j.jspi.2023.07.001 Li Xueding. 2021. Occurrence characteristics of the red tide in Fujian coastal waters during the last two decades. Marine Environmental Science (in Chinese), 40(4): 601–610 Li Jiangyue, Chang Hong, Liu Tong, et al. 2019. The potential geographical distribution of Haloxylon across Central Asia under climate change in the 21st century. Agricultural and Forest Meteorology, 275: 243–254, doi: 10.1016/j.agrformet.2019.05.027 Lin Senjie, Ji, Nanjing, Luo Hao. 2019. Recent progress in marine harmful algal bloom research. Oceanologia et Limnologia Sinica (in Chinese), 50(3): 495–510 Liu Guiying, Ge Kun, Song Lun, et al. 2015. The research trend of Karenia mikimotoi. Marine Sciences (in Chinese), 39(9): 117–122 Lü Songhui, Cen Jingyi, Wang Jianyan, et al. 2019. The research status quo, hazard, and ecological mechanisms of Karenia mikimotoi red tide in coastal waters of China. Oceanologia et Limnologia Sinica (in Chinese), 50(3): 487–494 Melo-Merino S M, Reyes-Bonilla H, Lira-Noriega A. 2020. Ecological niche models and species distribution models in marine environments: A literature review and spatial analysis of evidence. Ecological Modelling, 415: 108837, doi: 10.1016/j.ecolmodel.2019.108837 Merow C, Smith M J, Silander J A. 2013. A practical guide to MaxEnt for modeling species' distributions: what it does, and why inputs and settings matter. Ecography, 36(10): 1058–1069, doi: 10.1111/j.1600-0587.2013.07872.x Meshgi B, Majidi-Rad M, Hanafi-Bojd A A, et al. 2019. Ecological niche modeling for predicting the habitat suitability of fascioliasis based on maximum entropy model in southern Caspian Sea littoral, Iran. Acta Tropica, 198: 105079, doi: 10.1016/j.actatropica.2019.105079 Ministry of Natural Resources of the People’s Republic of China. 1989–2022. Bulletin of China Marine Disaster (1989–2022) (in Chinese). https://www.mnr.gov.cn/sj/sjfw/hy/gbgg/zghyzhgb/index_1.html[2023-12-13/2023-04-08] Phillips S J, Anderson R P, Dudík M, et al. 2017. Opening the black box: An open-source release of MaxEnt. Ecography, 40(7): 887–893, doi: 10.1111/ecog.03049 Phillips S J, Anderson R P, Schapire R E. 2006. Maximum entropy modeling of species geographic distributions. Ecological Modelling, 190(3-4): 231–259, doi: 10.1016/j.ecolmodel.2005.03.026 Phillips S J, Dudík M. 2008. Modeling of species distributions with MaxEnt: New extensions and a comprehensive evaluation. Ecography, 31(2): 161–175, doi: 10.1111/j.0906-7590.2008.5203.x Phillips S J, Dudík M, Schapire R E. 2004. A maximum entropy approach to species distribution modeling. In: Proceedings of the Twenty-First International Conference on Machine Learning. Banff, Alberta, Canada: ACM, 83 Qi Yuzao, Zou Jingzhong, Liang Song. 2003. Red Tide along the Coast of China (in Chinese). Beijing: Science Press, 1–2 Shen Yongping, Wang Guoya. 2013. Key findings and assessment results of IPCC WGI Fifth Assessment Report. Journal of Glaciology and Geocryology (in Chinese), 35(5): 1068–1076 Soofi E S. 2000. Principal information theoretic approaches. Journal of the American Statistical Association, 95(452): 1349–1353, doi: 10.1080/01621459.2000.10474346 Tillmann U, Elbrächter M, Krock B, et al. 2009. Azadinium spinosum gen. et sp. nov. (Dinophyceae) identified as a primary producer of azaspiracid toxins. European Journal of Phycology, 44(1): 63–79, doi: 10.1080/09670260802578534 Tyberghein L, Verbruggen H, Pauly K, et al. 2012. Bio-ORACLE: A global environmental dataset for marine species distribution modelling. Global Ecology and Biogeography, 21(2): 272–281, doi: 10.1111/j.1466-8238.2011.00656.x Wang Rulin, Li Qing, Feng Chuanhong, et al. 2017. Predicting potential ecological distribution of Locusta migratoria tibetensis in China using MaxEnt ecological niche modeling. Acta Ecologica Sinica (in Chinese), 37(24): 8556–8566 Wang Changyou, Wang Xiulin, Liang Shengkang, et al. 2010. The methods for calibrating average concentration in the domain and estimating average annual concentration of pollutants in the sea area being partially or totally different from target domains. Haiyang Xuebao (in Chinese), 32(2): 155–160 Wang Changyou, Xu Yiwen, Gu Haifeng, et al. 2023a. Expansion risk of the toxic dinoflagellate Gymnodinium catenatum blooms in Chinese waters under climate change. Ecological Informatics, 75: 102042, doi: 10.1016/j.ecoinf.2023.102042 Wang Changyou, Xu Yiwen, Gu Haifeng, et al. 2024. Potential geographical distribution of harmful algal blooms caused by the toxic dinoflagellate Karenia mikimotoi in the China Sea. Science of the Total Environment, 906: 167741, doi: 10.1016/j.scitotenv.2023.167741 Wang Endong, Zhang Lianjun, Chen Hong, et al. 2023b. Collinearity-oriented sensitivity analysis for patterning energy factor significance in buildings. Journal of Building Engineering, 73: 106685, doi: 10.1016/j.jobe.2023.106685 Wang Zhaohui, Zhang Yuning, Wang Wenting, et al. 2022. Distribution of dinoflagellate cysts in surface sediments on the Dongshan Bay, Fujian province, China. Journal of Tropical Oceanography (in Chinese), 41(4): 154–162 Xie Pengfei, Gu Yanbin, Sui Weina, et al. 2019. Big data challenges for species distribution models in predicting potential distribution of marine species. Marine Information (in Chinese), 34(1): 51–61 Xu Yixiao, He Xilin, Lee Wai Hin, et al. 2021. Ciguatoxin-producing dinoflagellate Gambierdiscus in the Beibu Gulf: First report of toxic Gambierdiscus in Chinese Waters. Toxins (Basel), 13(9): 643, doi: 10.3390/toxins13090643 Yan Huyong, Feng Lei, Zhao Yufei, et al. 2020. Predicting the potential distribution of an invasive species, Erigeron canadensis L., in China with a maximum entropy model. Global Ecology and Conservation, 21: e00822 Yu Zhiming, Chen Nansheng. 2019. Emerging trends in red tide and major research progresses. Oceanologia et Limnologia Sinica (in Chinese), 50(3): 474–486 Zhang Qingtian. 2013. Review on the annual variation of red tides in China Sea. Environmental Monitoring in China (in Chinese), 29(5): 98–102 Zhang Danhua, Hu Yuanman, Liu Miao. 2019. Potential distribution of Spartinal alterniflora in China coastal areas based on MaxEnt niche model. Chinese Journal of Applied Ecology (in Chinese), 30(7): 2329–2337 Zhou Jian, Wang Wei, Wu Zhihong, et al. 2020. The basic characteristics and prevention countermeasures of red tide in Shandong coast waters. Marine Environmental Science (in Chinese), 39(4): 537–543 -


 点击查看大图
计量
- 文章访问数: 78
- HTML全文浏览量: 34
- 被引次数: 0

