

Interannual variability of surface Indonesian Throughflow and its relationships with Pacific and Indian Oceans derived from satellite observation
-
Abstract: The Indonesian Throughflow (ITF) plays important roles in global ocean circulation and climate systems. Previous studies suggested the ITF interannual variability is driven by both the El Niño-Southern Oscillation (ENSO) and the Indian Ocean Dipole (IOD) events. The detailed processes of ENSO and/or IOD induced anomalies impacting on the ITF, however, are still not clear. In this study, this issue is investigated through causal relation, statistical and dynamical analyses based on satellite observation. The results show that the driven mechanisms of ENSO on the ITF include two aspects. Firstly, the ENSO related wind field anomalies driven anomalous cyclonic ocean circulation in the western Pacific, and off equatorial upwelling Rossby waves propagating westward to arrive at the western boundary of the Pacific, both tend to induce negative sea surface height anomalies (SSHA) in the western Pacific, favoring ITF reduction since the develop of the El Niño through the following year. Secondly, the ENSO events modulate equatorial Indian Ocean zonal winds through Walker Circulation, which in turn trigger eastward propagating upwelling Kelvin waves and westward propagating downwelling Rossby waves. The Rossby waves are reflected into downwelling Kelvin waves, which then propagate eastward along the equator and the Sumatra-Java coast in the Indian Ocean. As a result, the wave dynamics tend to generate negative (positive) SSHA in the eastern Indian Ocean, and thus enhance (reduce) the ITF transport with time lag of 0–6 (9–12) month, respectively. Under the IOD condition, the wave dynamics also tend to enhance the ITF in the positive IOD year, and reduce the ITF in the following year.
-
1. Introduction
The Indonesian throughflow (ITF), which carries warmer and fresher waters from the western Pacific to the eastern Indian Ocean via the Indonesian seas, is basically driven by the sea level gradient between the two oceans (Wyrtki, 1987). The ITF volume and heat transports are estimated of approximately 10–15 Sv (1 Sv = 106 m3s–1) (Sprintall et al., 2009; Feng et al., 2018; Gordon et al., 2019) and 0.24–1.15 PW (1 PW = 1015 W) (Hirst and Godfrey, 1993; Vranes et al., 2002; Tillinger and Gordon, 2010; Xie et al., 2019; Zhang et al., 2019). Thus, the ITF is a vital component of the so called “Great Ocean Conveyor Belt” (Broecker, 1991; Gordon, 2001; Talley, 2013) and plays important roles in the Indo-Pacific climate variability (Song et al., 2007; Zhou et al., 2008; Santoso et al., 2011; Sprintall and Révelard, 2014; Kajtar et al., 2015; Yuan et al., 2011, 2013).
One of the fundamental issues for ITF investigation is to estimate its water transport. So far, the most comprehensive direct measurement of the ITF was during the International Nusantara Stratification and Transport (INSTANT) program, when simultaneous mooring observations of current profile were carried out in the major inflow and outflow passages from the end of 2003 to early 2007 (Sprintall et al., 2004, 2009; Gordon et al., 2010). The INSTANT gives a 3-year averaged inflow transport of ~12.7 Sv through the Makassar Strait and the Lifamatola Passage, and outflow transport of ~15 Sv through the Lombok and Ombai Straits, and the Timor Passage (Sprintall et al., 2009; Gordon et al., 2010). In addition to the direct measurement of current profile, the repeated Expendable Bathythermograph (XBT) survey along the IX1 section between Fremantle, Western Australia, and Sunda Strait, Indonesia, provide monthly or bimonthly temperature of upper 800 m since 1983 (Meyers, 1996). The ITF volume transport can be estimated by the geostrophic plus Ekman transport based on the XBT and wind stress data (Meyers et al., 1995; Wijffels et al., 2008). The estimates of 30-year (from January 1984 to December 2013) averaged geostrophic transport across the IX1 section are approximately 5 Sv and 8.6 Sv relative to a reference depth of 400 m and 700 m, respectively (Liu et al., 2015).
The ocean is dominated by the first baroclinic mode (Wunsch, 1997). This mode has the greatest influence on the ITF and its variations can be well represented by sea surface height (SSH) (Zhai and Hu, 2012). The ITF is driven by the pressure head between the Pacific and Indian Ocean (Wyrtki, 1987; Wunsch, 2010). Therefore, several approaches have been made to derive ITF transport proxy based on satellite altimetry SSH and/or gravimetry ocean bottom pressure (OBP) data (Potemra, 2005; Sprintall and Révelard, 2014; Susanto and Song, 2015). Additionally, deep learning approach based on SSH data was used to predict the ITF transport, showing advantage by reproducing approximately 90% of the total variance of ITF transport (Xin et al., 2023).
The ITF exhibits multi-scale variations, which are closely linked to various climate modes such as the Madden-Julian Oscillation (MJO) (Napitu et al., 2019), monsoons (Sprintall et al., 2009), the Indian Ocean Dipole (IOD) and the El Niño-Southern Oscillation (ENSO) (Wang et al., 2014; Sprintall and Révelard, 2014; Liu et al., 2015; Pujiana et al., 2019), the Pacific Decadal Oscillation (PDO) (Li et al., 2018; Feng et al., 2018), as well as the Interdecadal Pacific Oscillation (IPO) (Li et al., 2020). Additionally, the South China Sea Throughflow (SCSTF) also tend to modulate the ITF through the “freshwater plug” and “salinity effect” (Fang et al., 2010; Gordon et al., 2012; Hu and Sprintall, 2016, 2017; Xu et al., 2021). Numerical experiments show that the SCSTF and ITF are out of phase at interannual time scale when they entering the Sulawesi Sea (Wei et al., 2016). As the SCSTF carries fresher waters than the ITF, it would modulate the vertical structure of the ITF (Li et al., 2019; Jiang et al., 2019).
The ITF connects the low-latitude western boundary of the Pacific Ocean and the equatorial and coastal currents system of the eastern Indian Ocean. Consequently, a relationship between them is expected under the wind driven and planetary wave dynamics over the Indo-Pacific basin. Based on the Simple Ocean Data Assimilation (SODA) reanalysis product, we have shown a potential link between the ITF in the Makassar Strait and the Pacific North Equatorial Current (NEC)-Kuroshio current (KC)-Mindanao Current (MC) (hereafter the NEC-KC-MC system is referred to as NKM) responding to the ENSO (Zhao et al., 2015). The Indian and Pacific Oceanic wave propagation plays an important role in modulating ocean circulation in the entrance of the ITF (Hu et al., 2019, 2022). However, the SODA products fail to reproduce the significant correlation between the ITF and the IOD, attributing to model deficiency in simulating the propagation of planetary waves in the equatorial Indian Ocean (Xu et al., 2024).
In this study, the relationships of the ITF with the Pacific and Indian ocean circulation will be revisited based on satellite observed SSH and satellite derived near surface velocities. Meanwhile, the Liang-Kleeman information flow method will be employed to give a quantified causality of these relationships (Liang and Kleeman, 2005; Liang, 2008, 2014). The remainder of this paper is organized as follows: Section 2 describes the data and methods. The interannual variability of the ITF are shown in Section 3. Section 4 analyzes the potential relationship between the ITF and the Indo-Pacific. Section 5 gives a summary.
2. Data and methods
2.1 Data
The monthly SSH were obtained from Version 5.0 of the daily gridded absolute dynamic topography products. The products were created by the Segment Sol multi-missions dALTimetrie, d'orbitographie et de localisation précise/Data Unification and Altimeter Combination System (SSALTO/DUACS), and distributed by the Archiving, Validation, and Interpretation of Satellite Oceanographic data (AVISO). The data is accessible for download at
http://www.aviso.altimetry.fr/duacs/ . Dataset is daily, with a resolution of 0.25° × 0.25° and available from October 1992 to date (Ducet et al., 2000).Monthly near-surface velocity data were provided by the Ocean Surface Current Analyses Real-time (OSCAR) version 2.0, with a horizontal resolution of 0.25° × 0.25°. The OSCAR sea surface velocity is derived from satellite SSH, sea surface winds, and sea surface temperature (SST) using geostrophy, Ekman, and thermal wind dynamics (Lagerloef et al., 1999; Bonjean and Lagerloef, 2002).
Monthly 10 m wind were obtained from ERA5 high resolution reanalysis archive, which is provided by the European Centre for Medium-Range Weather Forecasts (ECMWF). Horizontal resolution of dataset is 0.25° × 0.25° per grid. Wind stress is calculated by the bulk formula of Large and Pond (1981).
Sea surface Temperature (SST) were obtained from Version 2.1 of the Optimum Interpolation Sea Surface Temperature (OISST V2.1), which provided by the US National Oceanic and Atmospheric Administration (NOAA). This daily gridded product has a spatial resolution of 0.25°×0.25° in longitude/latitude, available from 1 September 1981 to present (Reynolds et al., 2007; Banzon et al., 2016; Huang et al., 2021). Monthly SST data were calculated by monthly averaging of daily data.
The Nino3.4 index was downloaded from
https://psl.noaa.gov/data/timeseries/monthly/NIÑO34/ . The Dipole Mode Index (DMI) defined by Saji et al. (1999) was obtained fromhttps://psl.noaa.gov/gcos_wgsp/Timeseries/Data/dmi.had.long.data .All of the analyzed data were monthly averaged and consistently from January 1993 to December 2020.
2.2 Methods
The NEC, KC and MC are well identified by the satellite derived sea surface currents (Fig. 1). The surface transports of the NEC (TNEC), MC (TMC), KC (TKC), and ITF (TITF) are calculated by integrating the normal velocity of the sea surface current across a defined section following previous investigations (Toole et al., 1988, 1990; Qu et al., 1998; Kashino et al., 2009; Zhai et al., 2014).
 Figure 1. Annual mean sea surface currents (vector) and SSHA (shaded) in the western Pacific and eastern Indian Oceans. Sections for surface transport calculation are NEC: 8°–18°N, 130°E; MC: 8°N, 126°–130°E; KC: 18°N, 122.25°–130°E; IX1: 26°S, 113.76°E–4.95°S, 104.32°E.
$$ {T}_{surface}=\sum _{i=1}^{n}{v}_{i}{\Delta l}_{i} $$ (1) where subscripts
$ i $ represents the grid number along the horizontal direction of the section,$ {v}_{i} $ and$ \Delta {l}_{i} $ are the normal velocity at the center of the grid and the width of the grid, respectively. In terms of ITF surface transport, the horizontal velocities are projected to the along (y) and across-section (x) axis of the IX1 section, which are oriented 24.15° and −65.85° (Positive values represent a clockwise direction relative to north) respectively, to yield along (v’) and across-section (u’) surface currents.The latitude where the zonal velocity is 0 (Latu=0) along the IX1 section is selected to approximate the southernmost boundary of the ITF. In this paper, we refer to the method of Kim et al. (2004) to calculate the NEC bifurcation latitude (NECBL), i.e., the latitude with an average meridional velocity is 0 within two degrees of longitude from the coast of the Philippines.
Information flow, which refers to the process of information transfer between two entities in a dynamic system, is used to reveal the causality of the ITF interannual variability with the Pacific and Indian Oceans (Liang, 2014). The potential dynamical causality between time series X1 and X2, can be quantitatively derived by calculating the maximum likelihood estimation of the information flow, namely, the unidirectional information transmission from X2 to X1 (T2→1):
$$ {T}_{2\to 1}=\frac{{C}_{11}{C}_{12}{C}_{2,d1}-{C}_{12}^{2}{C}_{1,d1}}{{C2}_{11}^{2}{C}_{22}-{C}_{11}{C}_{12}^{2}} $$ (2) where
$ {C}_{ij} $ is the sample covariance between$ {X}_{i} $ and$ {X}_{j} $ , and$ {C}_{i,dj} $ is the sample covariance between$ {X}_{i} $ and the sequence derived from$ {X}_{j} $ using the Euler forward difference. If the information flow from$ {X}_{2} $ to$ {X}_{1} $ is zero, then$ {X}_{2} $ has no influence on$ {X}_{1} $ ; otherwise,$ {X}_{1} $ is the cause of the phenomenon$ {X}_{2} $ . Causality is a sufficient condition for a correlation, identifying two variables as causal to each other.3. Interannual variability of the ITF
In this study, we use two indices to reveal the ITF characteristic and variability, i.e., the TITF across the IX1 section, and the southernmost boundary of the surface ITF. As shown in Fig. 2a, the zonal velocity in the IX1 section shows not only variation in velocity magnitudes, but also in width of the westward flow. Since the northern boundary of the ITF is distinguished from the South Java Coastal Current with relatively smaller meridional migration. Therefore, Latu=0 can be roughly considered as the width of the ITF. The Latu=0 is also associated with the south boundary of the South Equatorial Current (SEC), of which the ITF confluences into after flowing out of the Indonesian seas (van Sebille et al., 2014; Gruenburg et al., 2023). The annual mean TITF is 5.65 ± 1.94 Sv/m (1 Sv = 106 m3/s), generally larger/smaller in boreal summer/winter; the Latu=0 migrates approximately between 10.78°S and 14.26°S, with climatological northmost/southmost latitudes of 12.55°S and 12.28°S in September and May, respectively. The TITF and Latu=0 tend to show out of phase, rather than in phase relationships between each other, with correlation coefficient of -0.38, above the 95% significance level. Causality calculations give values of 9.3 × 10⁻³ and −6.4 × 10⁻³ Nat/month, from TITF to Latu=0, and from Latu=0 to TITF, both below the 90% significance level, suggesting that the causal relationship between the TITF and Latu=0 (Fig. 2b) is not significant. The insignificant causal relationship may attribute to that the TITF is more dominated by the wind field over the Pacific Ocean, whereas Latu=0 is more dominated by the wind field over the Indian Ocean.
 Figure 2. (a) Hovmöller plot of zonal velocity along the IX1 section; (b) TITF and the Latu=0 in the IX1 section; (c) surface transport anomalies of the Pacific NEC, MC, KC, and the ITF; (d) NECBL anomalies (solid line) and ITF southernmost boundary latitude (Latu=0) anomalies (dashed line).
It is known that the ITF is derived from the Pacific NEC: the westward advected Pacific NEC bifurcated into northward KC and southward MC at the western boundary; the MC penetrating into the Sulawesi Sea, which in turn flowing into the Indian Ocean passing by the Makassar Strait and eastern Indonesian seas (Zhou et al., 2021; Guo et al., 2019). Thus, we show the interannual anomalies of the surface transport of the Pacific NEC, KC, MC, and ITF, as well as the NECBL and Latu=0 in Fig. 2c and Fig. 2d, and calculate the information flow among them. The NEC transport anomalies are generally in phase with those of MC, rather than with KC, in agreement with Zhai et al. (2014). In comparison, the ITF transport does not show obviously in phase or out of phase relationships with the NKM transports. The information flow calculations give values of −35.7 × 10⁻³ (from TNEC to TMC), −5.2 × 10⁻³ (from TNEC to TKC), and −2.6 × 10⁻³ Nat/month (from TMC to TITF), above the 95% significance level, suggesting causal relationship of transport between NEC and MC/KC, and between MC and ITF, at interannual time scale, respectively. In addition, there is significant causal relationship of the interannual variations between the NECBL and Latu=0, with a value of −1.2 × 10⁻³ Nat/month. Furthermore, the information flows from TNEC, TMC, and TKC, to Latu=0, are all significant, with values of 12.7 × 10⁻³, 8.7 × 10⁻³, and 6.6 × 10⁻³ Nat/month, respectively, implying potential modulation of NKM system on the ITF variability.
Figure 3 shows the lag correlations between the TITF/Latu=0 and the NKM system. The TITF is not significantly correlated to the TNEC with time lag of 0–24 months; and the information flows from TNEC to TITF is -0.5 × 10⁻³ Nat/month. The lag correlation between TITF and TMC anomalies are significant above the 95% confidence level with time lag of 7–21 months; and the information flow from TMC to TITF is −2.6 × 10⁻³ Nat/month, above the 95% confidence level. The lag correlation between TITF and TKC anomalies are significant above the 95% confidence level from a leading time of 9 months to a lagging time of 6 months; however, the information flows from TKC to TITF is 3.4 × 10⁻³ Nat/month, below the 95% confidence level. There are significant negative correlations between the TITF and NECBL anomalies lagging by 15 months with value of -0.49, suggesting that northward shift of NECBL generally followed by weakened TITF. The underlying mechanism can be explained by that the NECBL is critical for the water partition of MC and KC, i.e., northward NECBL favors enhanced MC, which in turn results in weakened intrusion of MC waters into the Sulawesi Sea (van Sebille et al., 2009; Qiu and Chen, 2010; Li et al., 2020). The lag correlations of Latu=0 with TNEC and TMC are significantly maximum positive with time lag of 12 months. The significant positive lag correlations are also identified between the Latu=0 and the NECBL anomalies when the former lags by 13 months. The causality analysis shows significant information flows both from the TNEC, TMC, and NECBL to Latu=0, and from Latu=0 to TNEC, TMC, and NECBL, suggesting underlying interactions between the Latu=0 and the NKM system.
 Figure 3. Lag correlations of (a) TITF anomalies with TNEC (black solid line), TMC (red solid line), TKC (blue solid line), and NECBL anomalies (black dashed line); (b) Latu=0 anomalies with TNEC (black solid line), TMC (red solid line), TKC (blue solid line), and NECBL anomalies (black dashed line). Positive/negative months on the x-axes indicate TITF and Latu=0 anomalies lagging/leading the other anomalies; and dashed horizontal lines stand for the 95% significance level.
During the period of 1993–2020, the El Niño/La Niña, and positive/negative IOD (pIOD/nIOD) events are identified as: El Niño (1994–1995, 1997–1998, 2002–2003, 2009–2010, and 2015–2016), La Niña (1995–1996, 1998–1999, 1999–2000, 2007–2008, 2010–2011, 2011–2012), pIOD (1994, 1997, 2006, 2015, 2018, 2019), nIOD (1996, 1999, 2006, 2016), El Niño + pIOD (1994, 1997, 2015), and La Niña + nIOD (1996, 1999) (Fig. 4a and 4b). Statistically, the lag correlations of TITF anomalies with Niño3.4 indices are significantly negative with time lag of 3–20 months, and peaking at 9 months lagging (Fig. 4c). Additionally, there are also significant positive correlations when TITF leading Niño3.4 by 3–7 months (Fig. 4c). The correlations between TITF anomalies and DMI indices show significant positive coefficients from a leading time of 6 months to a lag time of 5 months, peaking at lag time of 0 month (Fig. 4c). The correlations of TITF anomalies with Niño3.4 and DMI are generally in agreement with previously investigations, which suggest that weakened ITF tend to occur following El Niño or nOD events. The mechanism is explained by that El Niño/nIOD events favor to induce shallowed/deepened thermocline in the western equatorial Pacific/southeastern tropical Indian Oceans, resulting in reduced pressure head span over the Indonesian seas, thereby weakening the ITF; otherwise, weakened ITF tends to driven less upper layer water towards Indian Ocean, resulting in anomalous deeper thermocline depth in the equatorial Pacific to propagate eastward as equatorial Kelvin waves, favoring to trigger a La Niña states (Liu et al., 2015; Yuan et al., 2013). The lag correlation of Latu=0 anomalies with Niño3.4 and DMI show similar distribution, with significantly negative correlations when leading by 0–15 months, whereas significantly positive when lagging by 6–12 months (Fig. 4d). The lag correlation of Latu=0 may associate with the wind fields in the Indian Ocean in response to the ENSO cycle.
 Figure 4. (a) Niño3.4, and (b) DMI indices; lag correlations of (c) TITF and (d) Latu=0 anomalies with Niño3.4 (blue line) and DMI (red line) indices. Positive months indicate that Indo-Pacific climate indices lead ITF variability. Dashed line stands for the 95% confidence level.
Figure 5a show the composite analysis of TITF anomalies in different phases of ENSO and IOD. During the El Niño period, the TITF anomalies decreases from positive value to ~0 Sv/m at the peak of El Niño events, and continue to decrease in the following year (Year +1). During the pIOD period, the TITF anomalies increases from negative value to ~0 Sv/m at the peak of pIOD events and continue to increase and reaches its positive peak value of 0.19 Sv/m in April of Year +1. During the El Niño-pIOD co-occurred period, the positive TITF anomalies could persist for one more month and decrease to ~0 Sv/m in January of Year +1. The evolutions of TITF anomalies are generally opposite during the La Niña and La Niña-nIOD co-occurred periods. Meanwhile, the composed Latu=0 anomalies show the opposite evolutions with those of TITF anomalies, which may attribute to that the Latu=0 is dynamically linked to the wind field in the Indian Ocean, and will be discussed below (Fig. 5b).
 Figure 5. Composite (a) TITF and (b) Latu=0 anomalies for El Niño, La Niña, pIOD, and El Niño-pIOD, La Niña-nIOD co-occurred events.
4. Causal relations between ITF and the Indo-Pacific interannual variability
The absolute information flow from the SSHA in the tropical Indo-Pacific to TITF anomalies shows ENSO-like evolution patterns (Fig. 6a-6e). The significant causal relations occur in the central equatorial Pacific, and off equator in the eastern boundary of the Pacific Ocean, with SSHA leading by 1 years (Fig. 6a). The absolute information flow shows increased value with eastward/westward extension in the equatorial/off equatorial Pacific Ocean, in accordance with the propagation of the Pacific Kelvin/Rossby waves (Fig. 6b–6c). There are also enhancing causal relations between SSHA in the southeastern tropical Indian Ocean and TITF from 9–3 months leading time, suggesting influences of the IOD on the ITF transport (Fig. 6b–6d). The distribution of significant causal relation in Fig. 6e is reminiscent that of the correlation between SSHA and ITF transport (see Figure 2 in Sprintall and Révelard, 2014). The significant absolute information flow from zonal wind stress anomalies (ZWSA) to TITF basically distribute in the south and equatorial Pacific and east tropical Indian Oceans, as well as the ITF local regions, with time lags of 12–0 months (Fig. 6f–6j). These results consolidate previous investigations that suggest the ITF and its variability are forced by large scale wind field over the south Pacific, local monsoon wind field, and propagation of equatorial wind driven Kelvin and Rossby waves in the Indian and Pacific Oceans (e.g., Godfrey, 1989; Yuan et al., 2011; Sprintall and Révelard, 2014; Susanto and Song, 2015; Li et al., 2024).
 Figure 6. (a)–(e) Absolute information flow from SSHA in the tropical Indo-Pacific Ocean to TITF anomalies, with the later lagging by 12–0 months; (f)–(j) same as (a)–(e), but from ZWSA to TITF anomalies. Shadings indicate those above the 95% significance level.
Figure 7 shows the distribution of SSHA and wind stress anomalies (WSA) regressed on to the Niño3.4 indices from a leading time of 3 months to a lagging time of 12 months. The negative SSHA in the western tropical Pacific suggests anomalous cyclonic circulation (Fig. 7a–7d), which favors strengthened NEC and norward shift of NECBL (Qu and Lukas, 2003; Wang et al., 2022). The northward shift of NECBL tends to be followed by weakened ITF (Fig. 3). Additionally, during the develop phase of El Niño, there are westerlies over the central equatorial Pacific, which force downwelling Kelvin waves and upwelling Rossby waves, propagating eastward and westward, respectively. While arriving at the western boundary, the upwelling Rossby waves favored to shoal the thermocline and thus decreased SSHA, tend to weaken the ITF in the following 9 months (Fig. 7b–7e). Meanwhile, there are southeasterly and upwelling anomalies along the Java coast, favoring enhanced ITF in the following 6 months (Fig. 7a–7d). At the time lag of 9–12 months, positive SSHA occurred along the Java coast, because of both locally northwesterly driven on shore Ekman transport and propagation of downwelling Kelvin waves (Fig. 7d–7f).
 Figure 7. SSHA (shading) and wind stress anomalies (vector) regressed on Niño3.4 indices, with (a) leading time of 3 months, (b) synchronous regression, and (c)–(f) lagging time of 3–12 months. Only values above the 95% significance level are shown.
Figure 8 shows the distribution of SSHA and WSA regressed on to the DMI indices from a leading time of 3 months to a lagging time of 12 months. From −3 to 3 months, there are southeasterly and easterly anomalies in the southeastern tropical and central equatorial Indian Ocean, which induce offshore Ekman transport and upwelling Kelvin waves propagating eastward, both favoring the development of positive IOD events (Fig. 8a-8c). Consequently, there are negative SSHA along the south Java coast and tend to enhance ITF. According to Yuan and Liu (2009), two downwelling Kelvin waves are generated from the western boundary reflection during the positive IOD events. The first downwelling Kelvin wave contributes to weaken the positive IOD events, evidenced by that there are no negative SSHA along the south Java coast, albeit there are southeasterly anomalies favoring offshore Ekman transport (Fig. 8d). The second downwelling Kelvin waves arrive at the south Java coast, and induce positive SSHA at time lag of 9–12 months (Fig. 8e-8f).
 Figure 8. SSHA (shading) and wind stress anomalies (vector) regressed on DMI indices, with (a) leading time of 3 months, (b) synchronous regression, and (c)–(f) lagging time of 3–12 months. Only values above the 95% significance level are shown.
The role of planetary wave dynamics can be evidenced by the Hovmöller diagram of sea surface wind and SSHA in the Pacific and Indian Oceans (Fig. 9). In the central equatorial Indian Ocean, there are interannual easterly (westerly) anomalies associated with El Niño (La Niña) via the modulation of Walker Circulation, which in turn induce upwelling (downwelling) Kelvin waves to propagate eastward, and result in negative (positive) SSHA along the south Java coast (Fig. 9a-9b), favoring increased (decreased) ITF transport (Fig. 9c). Cyclonic (anticyclonic) wind stress curl anomalies in the central Pacific may excite westward propagating upwelling (downwelling) Rossby waves as revealed by the negative (positive) SSHA (Fig. 9d-9e), which eventually result in a northward (southward) displacement of the NECBL along the Philippine coast (Kim et al., 2004; Wang et al., 2014), and subsequently decreased (increased) ITF transport. The first mode Rossby waves propagate across the Pacific would take 6–9 months, and the Kelvin waves propagate from the central equatorial Indian Ocean to the south Java coast would takes 15–30 days (Yuan et al., 2004; Xu et al., 2016). Consequently, there combined influence on the ITF transport is not synchronized.
 Figure 9. (a) Hovmöller diagram of wind stress (vector) and wind stress curl (shading) anomalies averaged between 12°–14°N in the Pacific Ocean; (b) same as (a), but for SSHA; (c) time series of TITF; (d) and (e) are same as (a) and (b), but averaged between 2°N–2°S in the Indian Ocean.
In addition to the Kelvin waves derived from the central Indian Ocean, the reflected Kelvin waves also impact on the SSHA along the south Java coast at a longer time lag (Yuan and Liu, 2009; Wang and Yuan, 2015). As shown in Fig. 10, three negative SSHA events along the south Java coast were selected (Fig. 10a). The composite analysis shows negative SSHA in the central Indian Ocean in month −1 (Fig. 10b), and propagate eastward in the following months, together with local wind driven offshore Ekman transport, contributing to the negative SSHA in the southeastern tropical Indian Ocean until month +4 (Fig. 10c-10g). In month −1, off equatorial downwelling Rossby waves are also excited, which propagate westward and reflect into downwelling Kelvin waves in month +4 (Fig. 10g). In the following 3 months, the reflected downwelling Kelvin waves propagate eastward to arrive the eastern boundary of the Indian Ocean, contributing to the positive SSHA in the south Java coast (Fig. 10h-10j). Therefore, in response to the anomalous easterly over the central tropical Indian Ocean, the equatorial wave dynamics would contribute to negative SSHA lagging by 1–4 months, whereas positive SSHA lagging by 7 months.
 Figure 10. (a) Time series of area averaged SSHA (2°N–2°S, 98°–100°E); (b)–(j) composite SSHA (shading) and sea surface wind anomalies (vector) in the tropical Indian Ocean from month -1 to month +7, with month 0 refer to as the peak of the selected negative SSHA events as shown in (a).
5. Discussion and conclusions
In this study, we tried to reveal the relationship of ITF with the Pacific and Indian Ocean anomalies at the interannual time scale based on satellite observations. Correlation analysis implies that the ITF is significantly correlated to the MC and NECBL, with a lagging time of around 7-21 months. The relationship of ITF with the NKM system is further consolidated by the calculation of absolute information flow, which shows significant causal relation between the NEC and MC/KC, between MC and ITF, and between the NECBL and ITF, at interannual time scale. ITF connects the low latitude western boundary current system in the Pacific Ocean and the equatorial current system in the Indian Ocean. Thus, its variability is driven by both the Pacific and Indian Ocean anomalies. The interannual variability of ITF is driven by the pressure head span over the Indonesian seas (Wyrtki, 1987). This pressure head is established by the SSH gradient between the western equatorial Pacific and southeastern tropical Indian Oceans. Therefore, both the ENSO and IOD events are supposed to modulate the ITF transport by inducing SSH anomalies in the western equatorial Pacific and southeastern tropical Indian Oceans (Yuan et al., 2011; Sprintall and Révelard, 2014; Liu et al., 2015; Susanto and Song, 2015; Li et al., 2023).
As evidenced in Fig. 7, during the development and mature phases, there are negative SSHA, implying anomalous cyclonic circulation in the western tropical Pacific (Zhai and Hu, 2013). Meanwhile, anomalous cyclonic wind stress curl in the central Pacific excites upwelling Rossby waves, propagating westward and taking around 6–9 months to arrive at the east Philippine coast, favoring a northward displacement of the NECBL (White et al., 1985; Qu and Lukas, 2003; Wang et al., 2022). Above two processes tend to weaken the ITF transport during the period of El Niño develop phase throughout the following one year, as corroborated by the significant causal relations in Fig. 6.
ENSO could impact on the Indian Ocean through the Walker Circulation (Annamalai et al., 2003; Gualdi et al., 2003; Wang and Wang, 2014). El Niño events are associated with weakened Walker Circulation span over the Indo-Pacific Ocean. Consequently, there are easterly anomalies in the central equatorial Indian Ocean, exciting upwelling Kelvin waves to propagate eastward along the equator and the south Java coast (Fig. 9). Meanwhile, there are anomalous southeasterly along the south Java coast, driving offshore Ekman transport from -3 months to +6 months refer to the El Niño peak as 0 month (Fig. 7). On the other hand, there were downwelling Rossby waves off the equator of central Indian Ocean, which accompanied with the upwelling Kelvin waves. The westward propagating downwelling Rossby waves then arrived at the west boundary, and reflected into downwelling Kelvin waves to travel along the equator Indian Ocean and south Java coast, contributing to positive SSHA in the southeastern tropical Indian Ocean with a time lag of around 9 months refer to the El Niño peak (Fig. 7, 10). As a result, the El Niño induced Indian Ocean anomalies tend to generate negative (positive) SSHA, and thus enhance (reduce) the ITF transport with time lag of 0–6 (9–12) months, respectively. The overall Schematic of the ITF in response to the El Niño condition is summarized in Fig. 11.
 Figure 11. Schematic of the ITF in response to the El Niño condition. SST (shading) and wind stress anomalies (vector) regressed on Niño3.4 indices.
Positive IOD events are associated with interannual variability in the ITF. When positive IOD occurs, easterly wind anomalies over the equatorial Indian Ocean excite upwelling Kelvin waves to propagate eastward along the equator and south coast of Java (Fig. 8), corresponding to an increase in the ITF. Additionally, the downwelling Rossby waves off equator reflect as downwelling Kelvin waves, which, after nine months, initiate positive SSHA in the southeastern tropical Indian Ocean. The positive IOD event drives more warm water from the Pacific to the Indian Ocean, causing the thermocline in the western equatorial Pacific to rise and exciting upwelling Kelvin waves, which are conducive to ending El Niño and initiating La Niña after one year. The IOD-induced wave dynamics in the Indian Ocean are similar to those induced by ENSO. Figure 12 summarizes a schematic of the overall response of the ITF to the positive IOD conditions.
Acknowledgement: The altimeter products were produced by Ssalto/Ducas and distributed by AVISO ( Figure 12. Schematic of the ITF in response to the positive IOD condition. SST (shading) and wind stress anomalies (vector) regressed on DMI indices: (a) synchronous regression and (b) lagging time of 12 months.
https://www.aviso.altimetry.fr/en/home.html ) and Copernicus Marine Environment Monitoring Service (CMEMS) (https://marine.copernicus.eu/ ). The ERA5 wind data are derived from European Centre for Medium-Range Weather Forecasts (ECMWF) data server,https://www.ecmwf.int/en/forecasts/dataset/ecmwf-reanalysis-v5 . OSCAR product is available fromhttps://podaac.jpl.nasa.gov/dataset/OSCAR_L4_OC_INTERIM_V2.0 . OISST v2.1 data download fromhttps://www.ncei.noaa.gov/products/optimum-interpolation-sst# . The authors thank Ruixin Huang and Qingye Wang for their helpful discussion on the manuscript. -
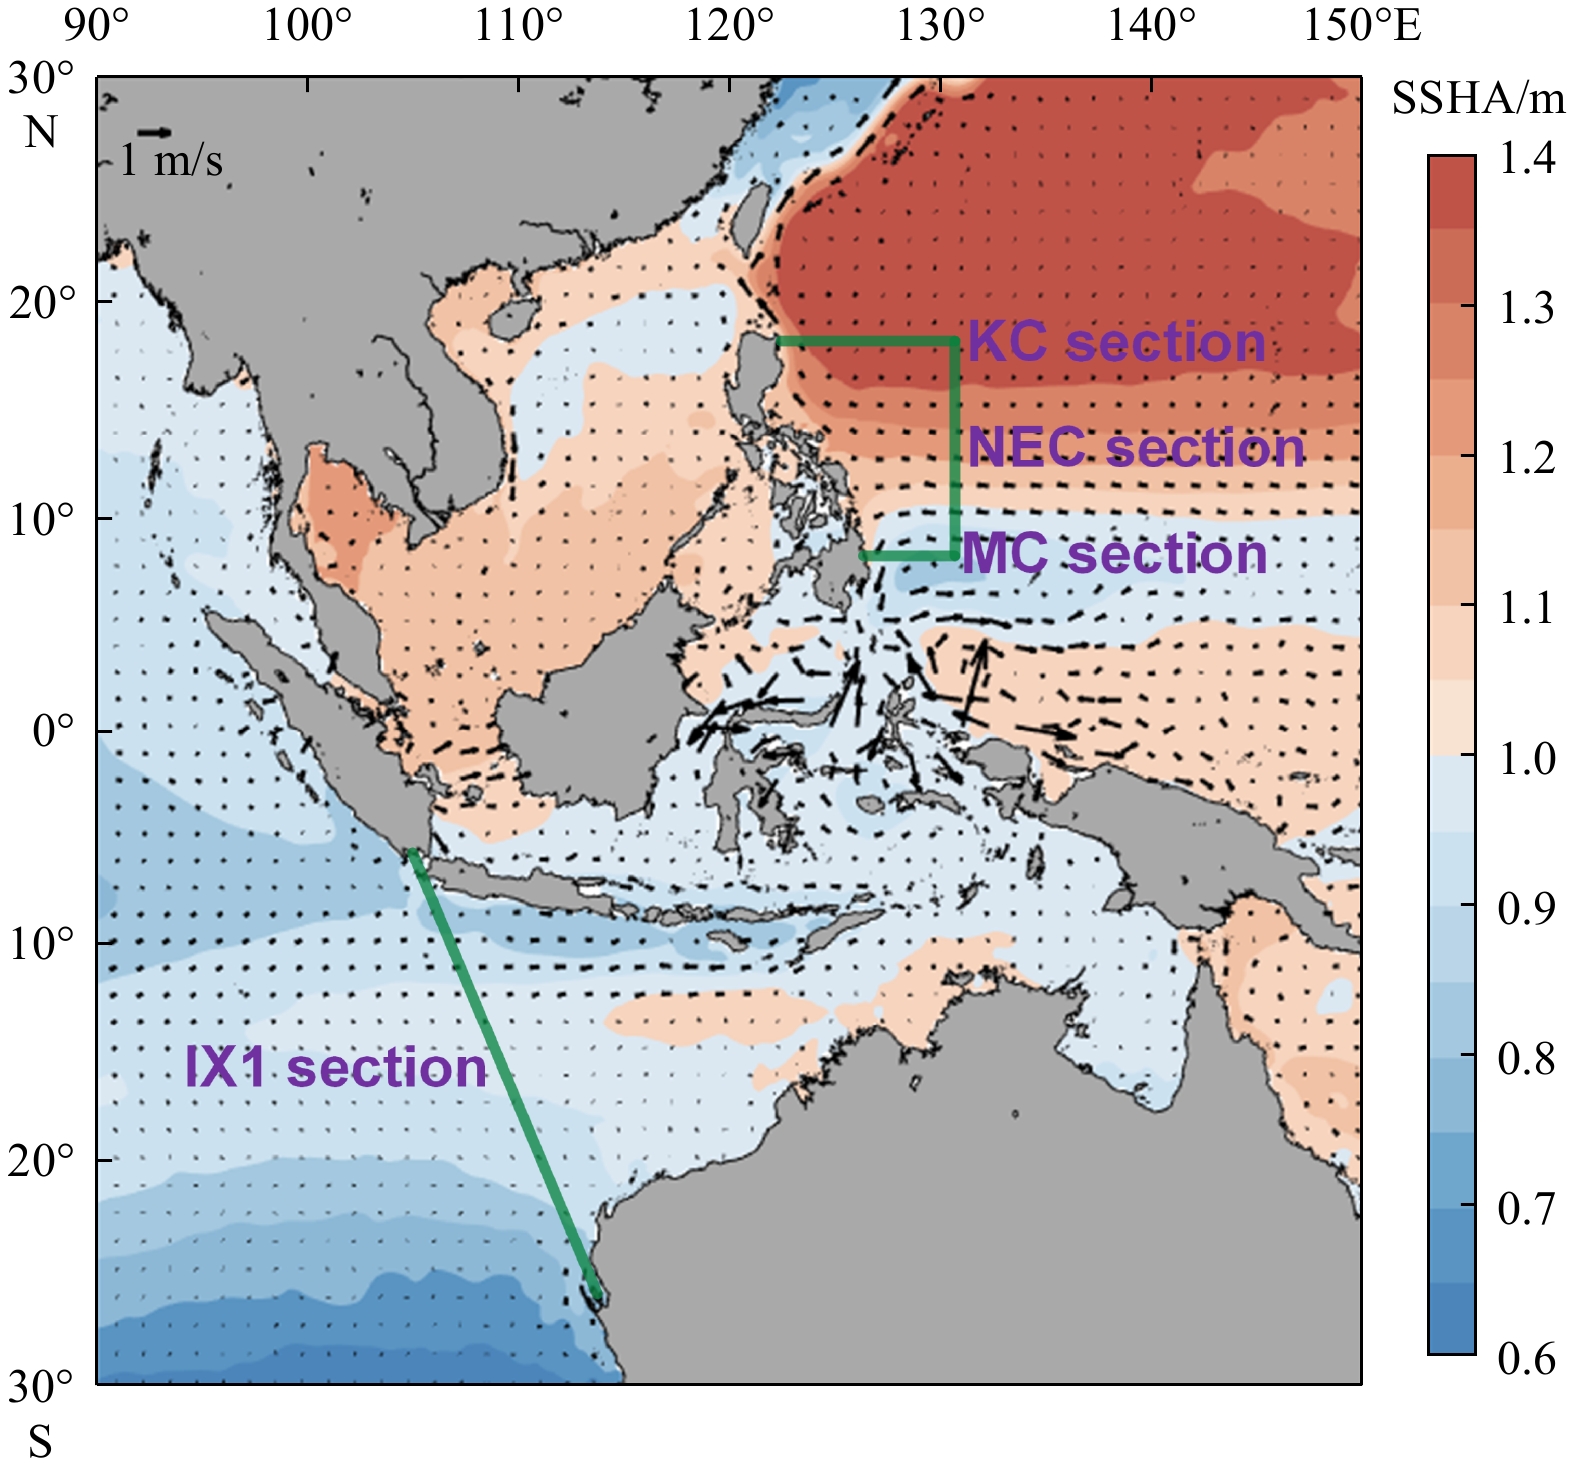
Figure 1. Annual mean sea surface currents (vector) and SSHA (shaded) in the western Pacific and eastern Indian Oceans. Sections for surface transport calculation are NEC: 8°–18°N, 130°E; MC: 8°N, 126°–130°E; KC: 18°N, 122.25°–130°E; IX1: 26°S, 113.76°E–4.95°S, 104.32°E.
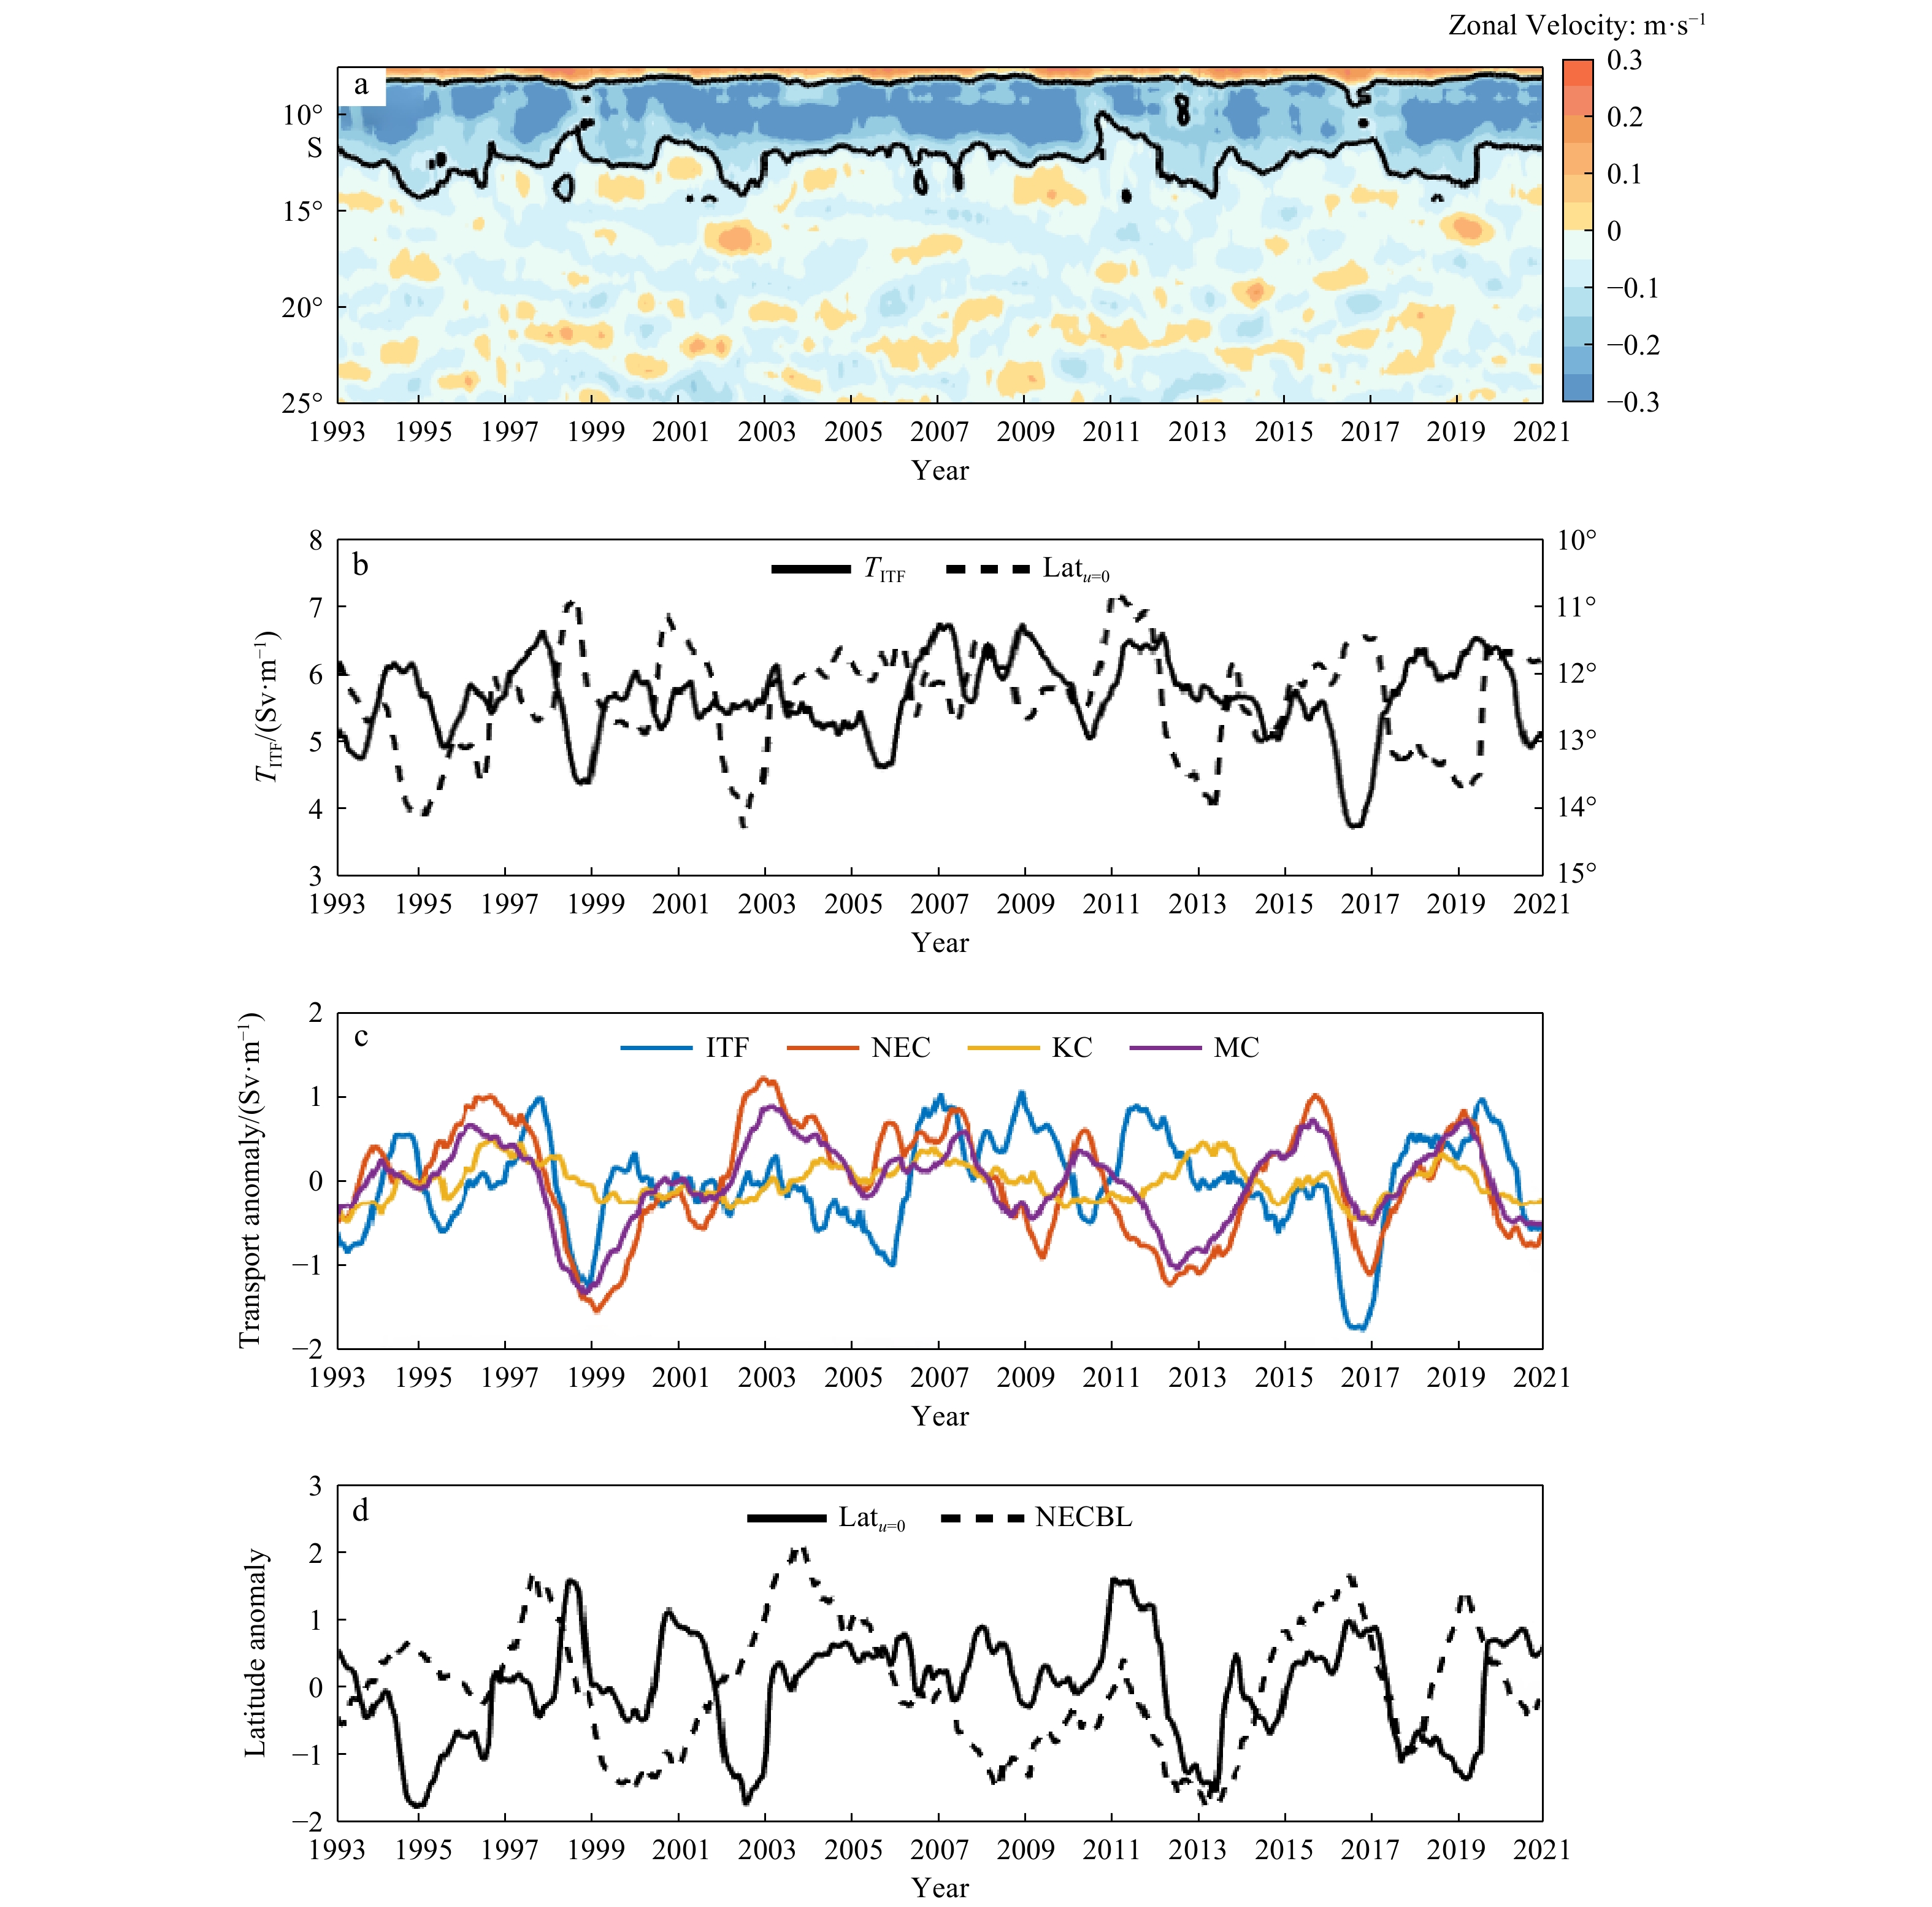
Figure 2. (a) Hovmöller plot of zonal velocity along the IX1 section; (b) TITF and the Latu=0 in the IX1 section; (c) surface transport anomalies of the Pacific NEC, MC, KC, and the ITF; (d) NECBL anomalies (solid line) and ITF southernmost boundary latitude (Latu=0) anomalies (dashed line).
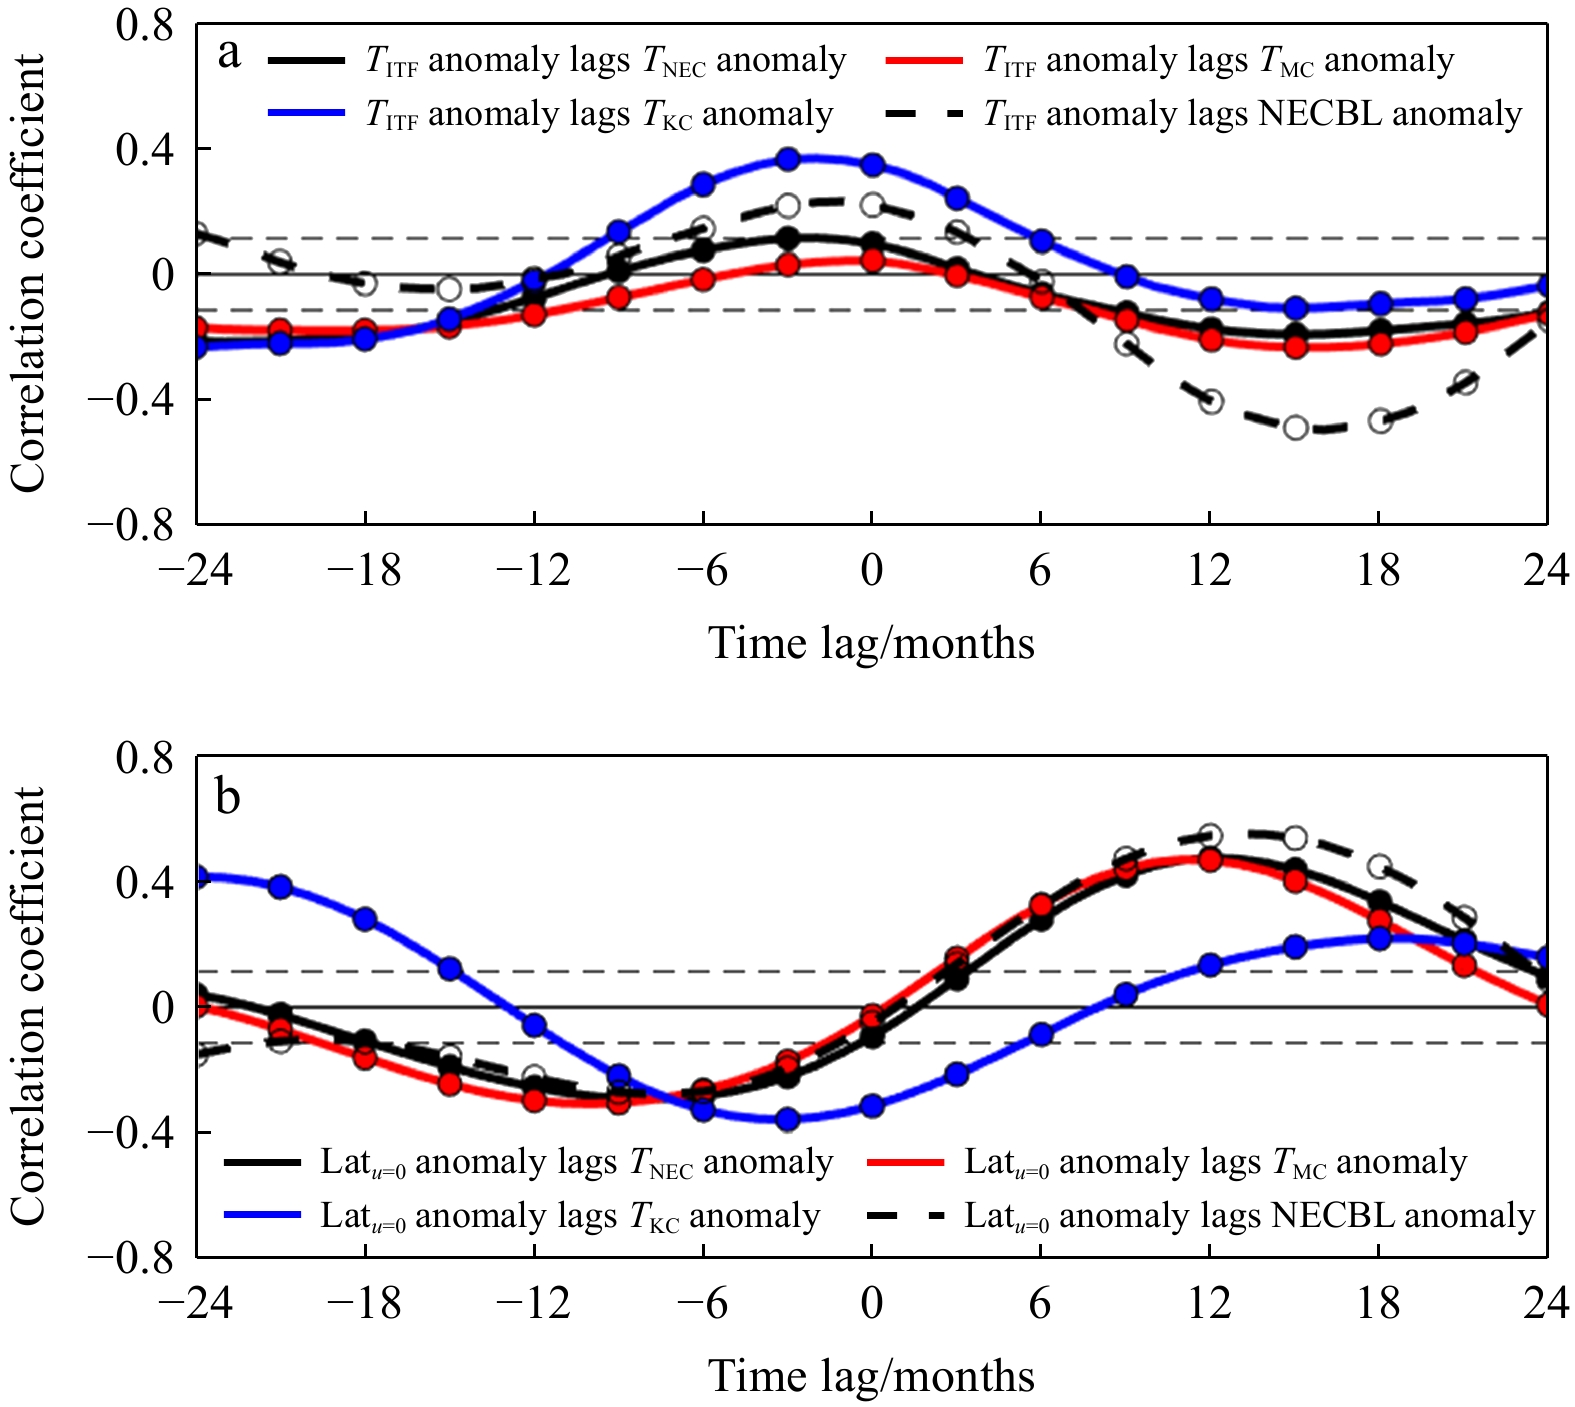
Figure 3. Lag correlations of (a) TITF anomalies with TNEC (black solid line), TMC (red solid line), TKC (blue solid line), and NECBL anomalies (black dashed line); (b) Latu=0 anomalies with TNEC (black solid line), TMC (red solid line), TKC (blue solid line), and NECBL anomalies (black dashed line). Positive/negative months on the x-axes indicate TITF and Latu=0 anomalies lagging/leading the other anomalies; and dashed horizontal lines stand for the 95% significance level.
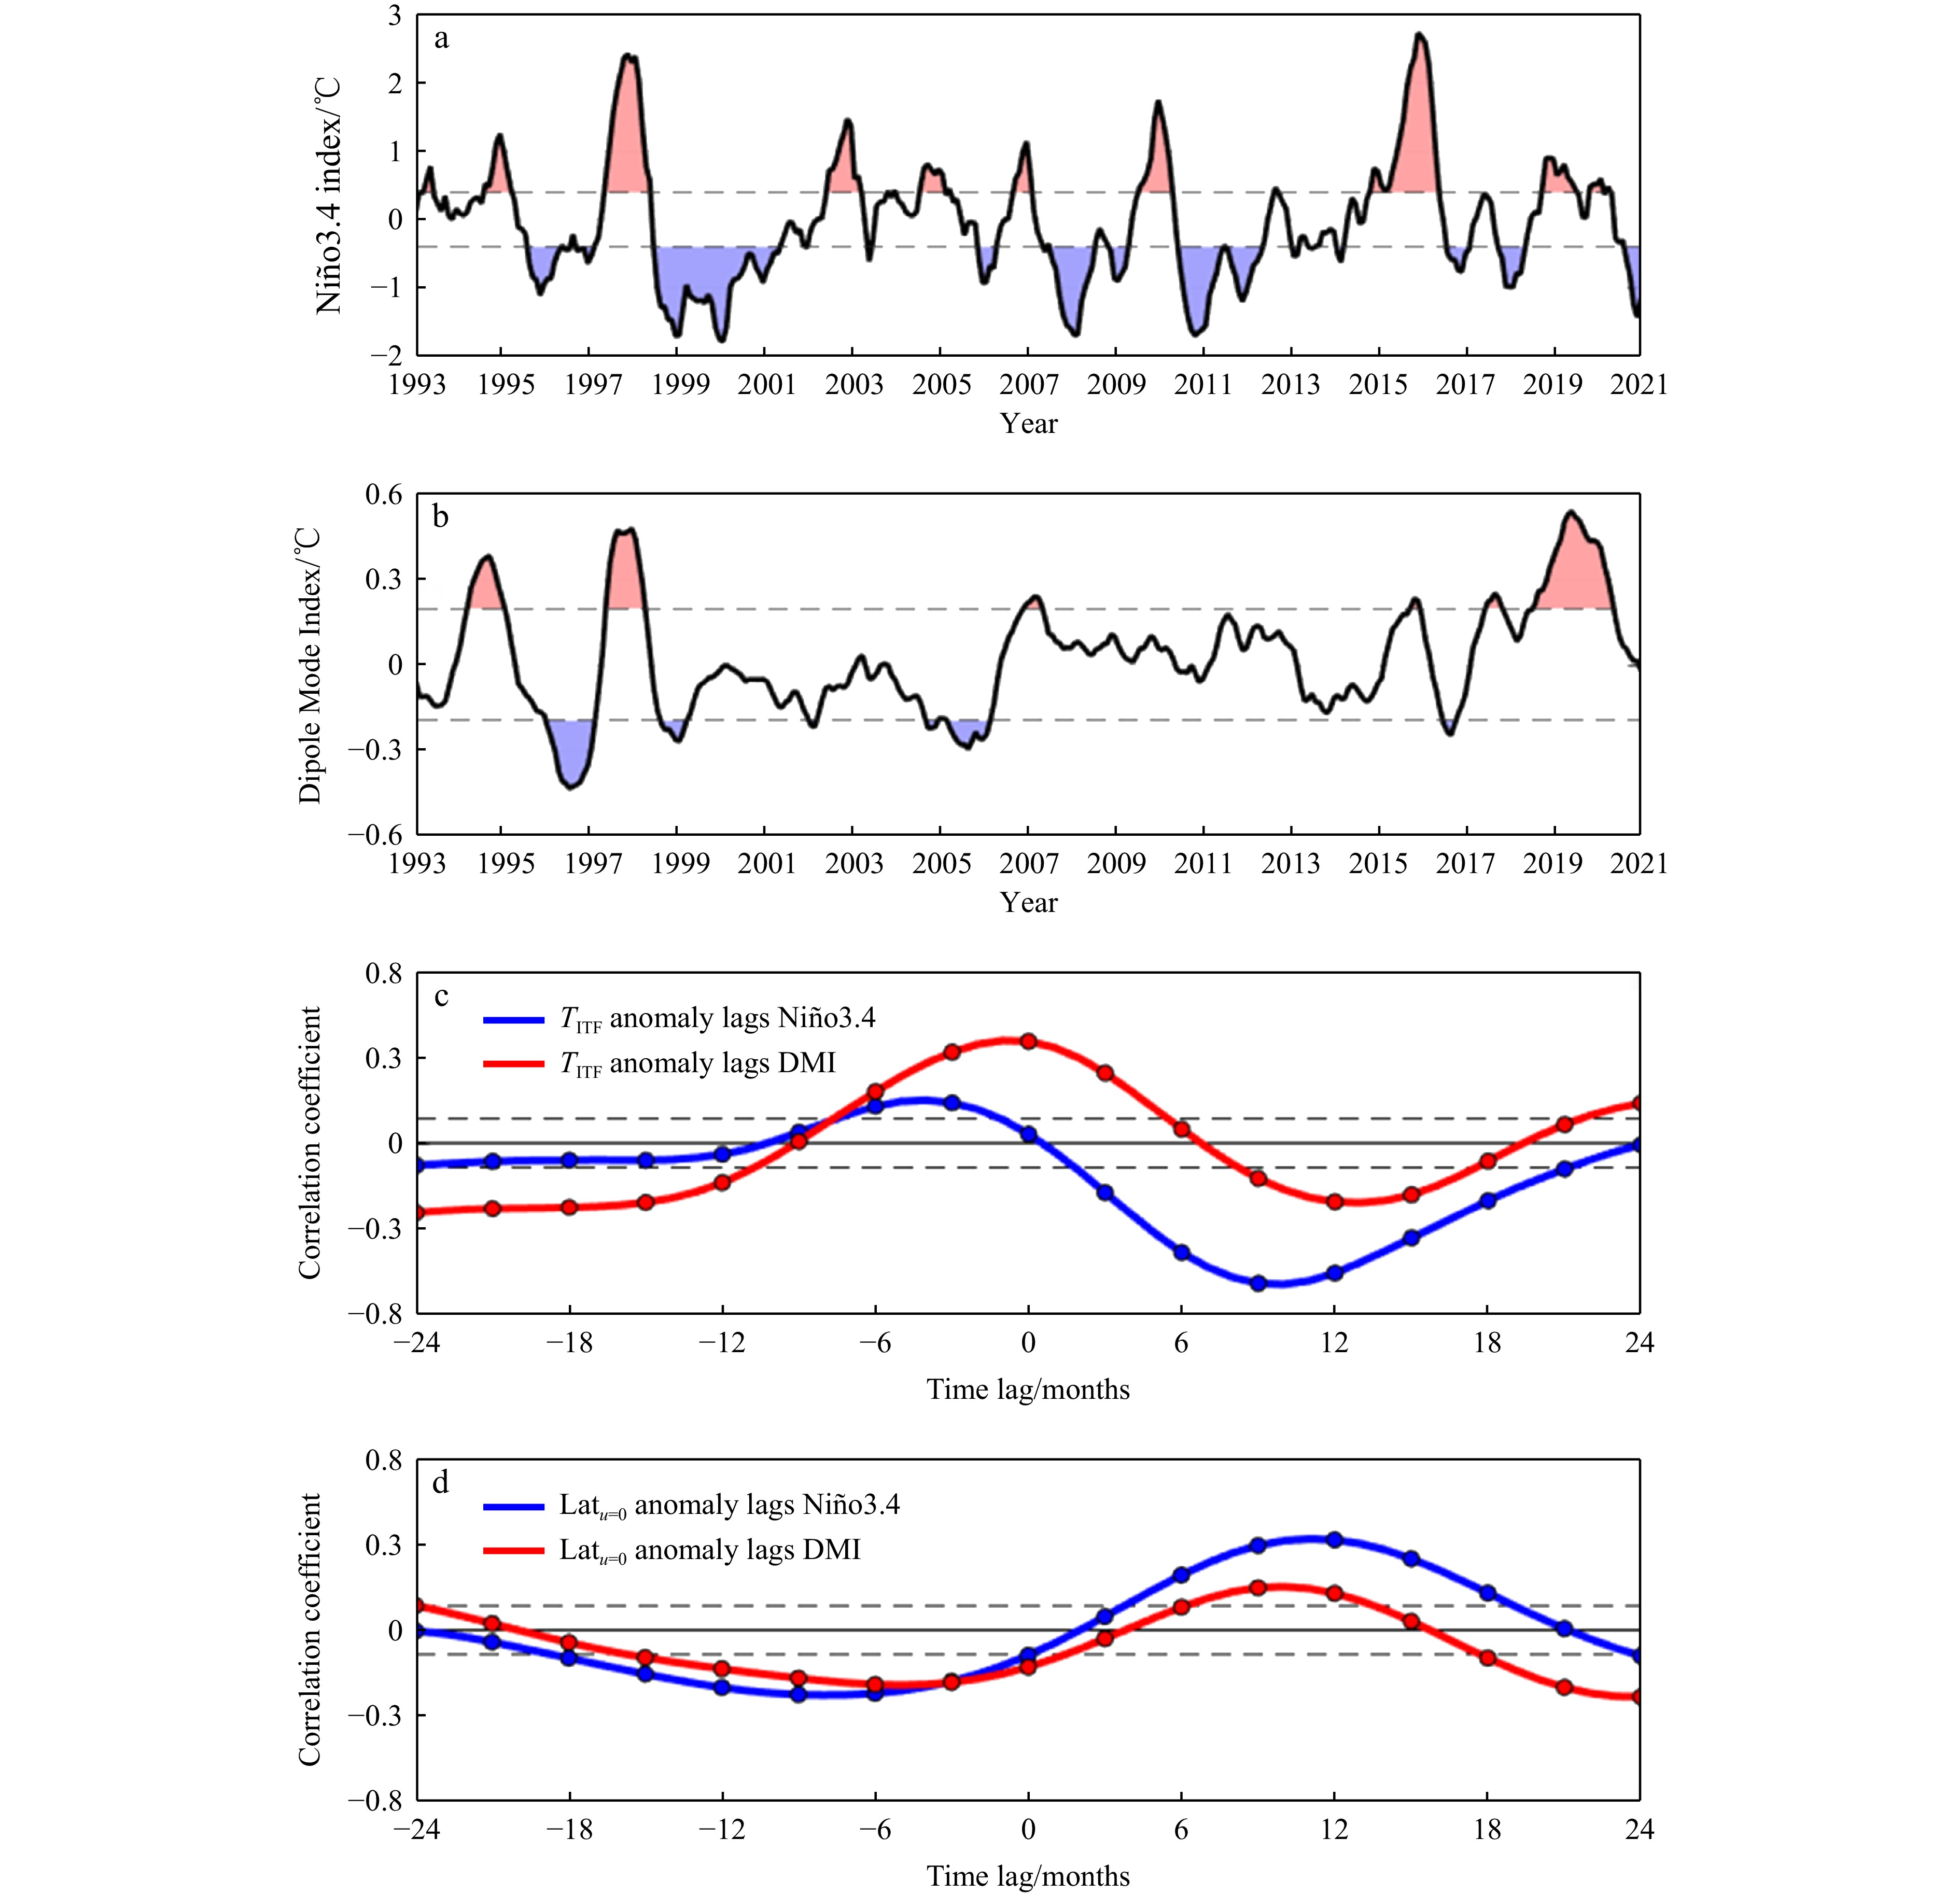
Figure 4. (a) Niño3.4, and (b) DMI indices; lag correlations of (c) TITF and (d) Latu=0 anomalies with Niño3.4 (blue line) and DMI (red line) indices. Positive months indicate that Indo-Pacific climate indices lead ITF variability. Dashed line stands for the 95% confidence level.
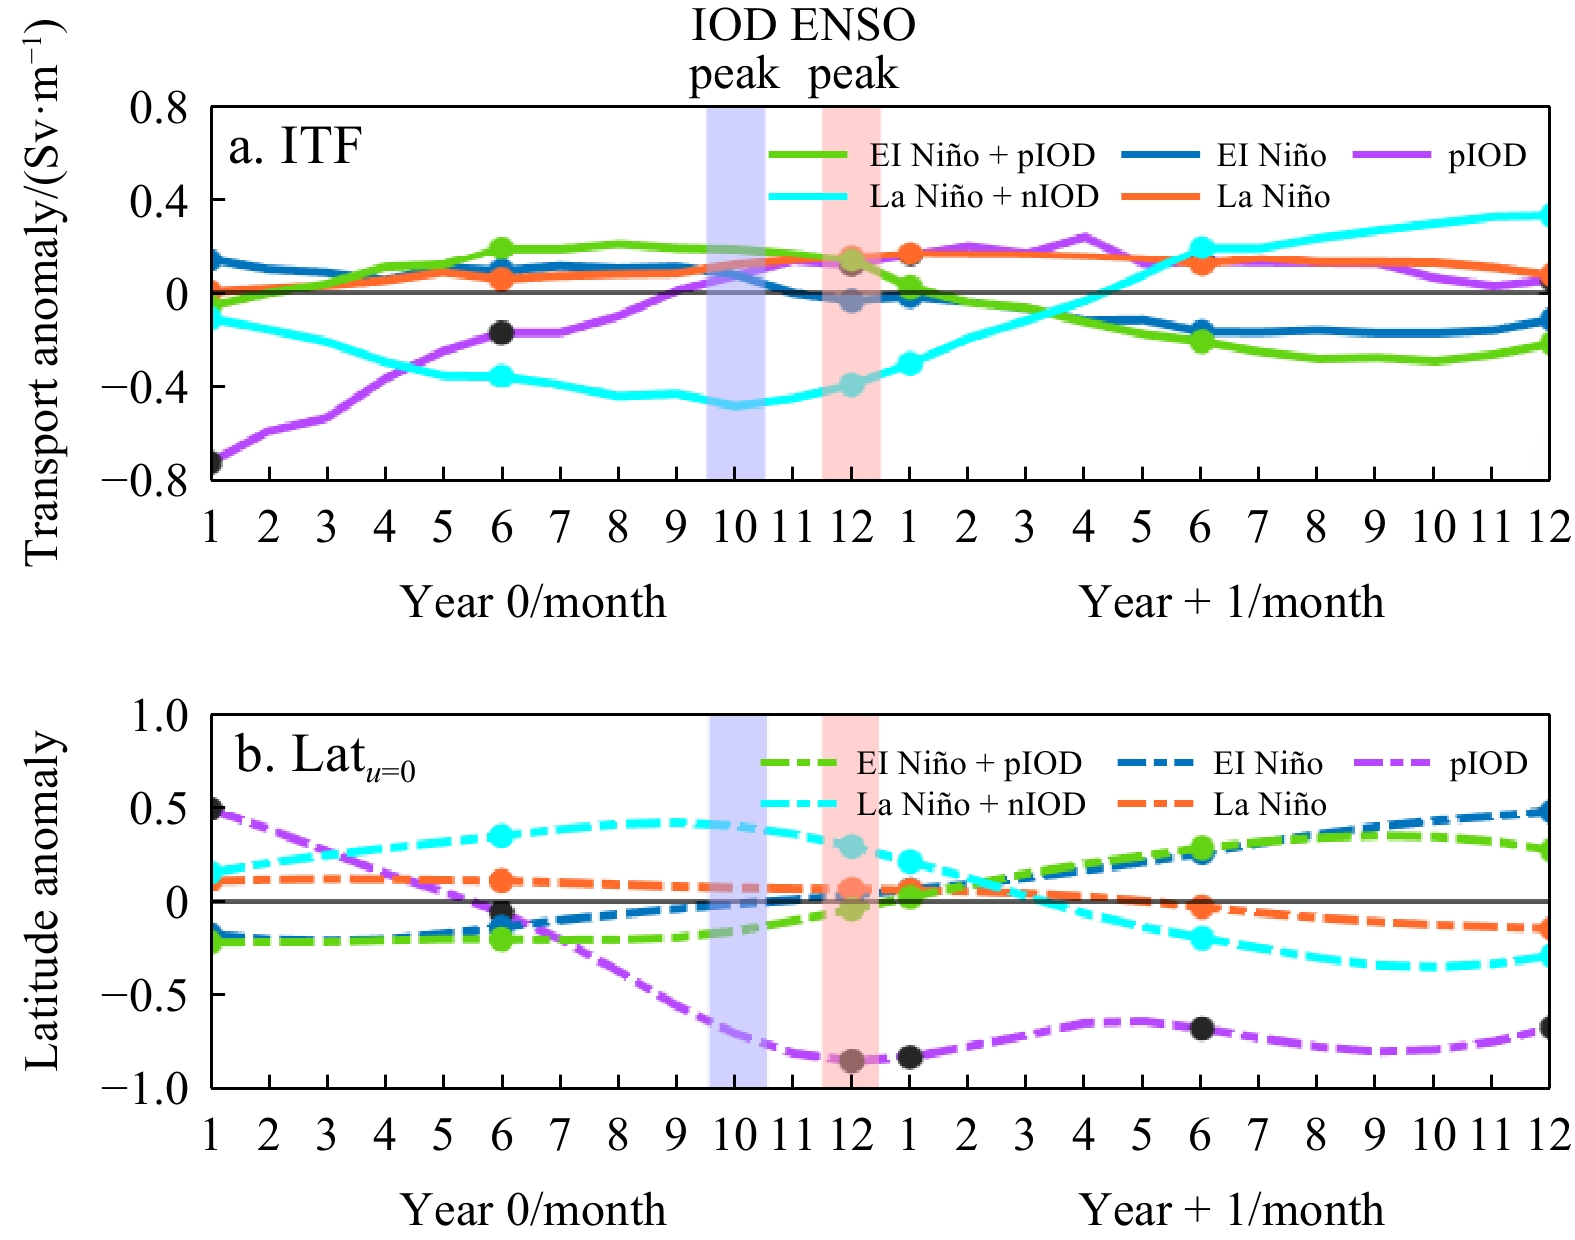
Figure 5. Composite (a) TITF and (b) Latu=0 anomalies for El Niño, La Niña, pIOD, and El Niño-pIOD, La Niña-nIOD co-occurred events.
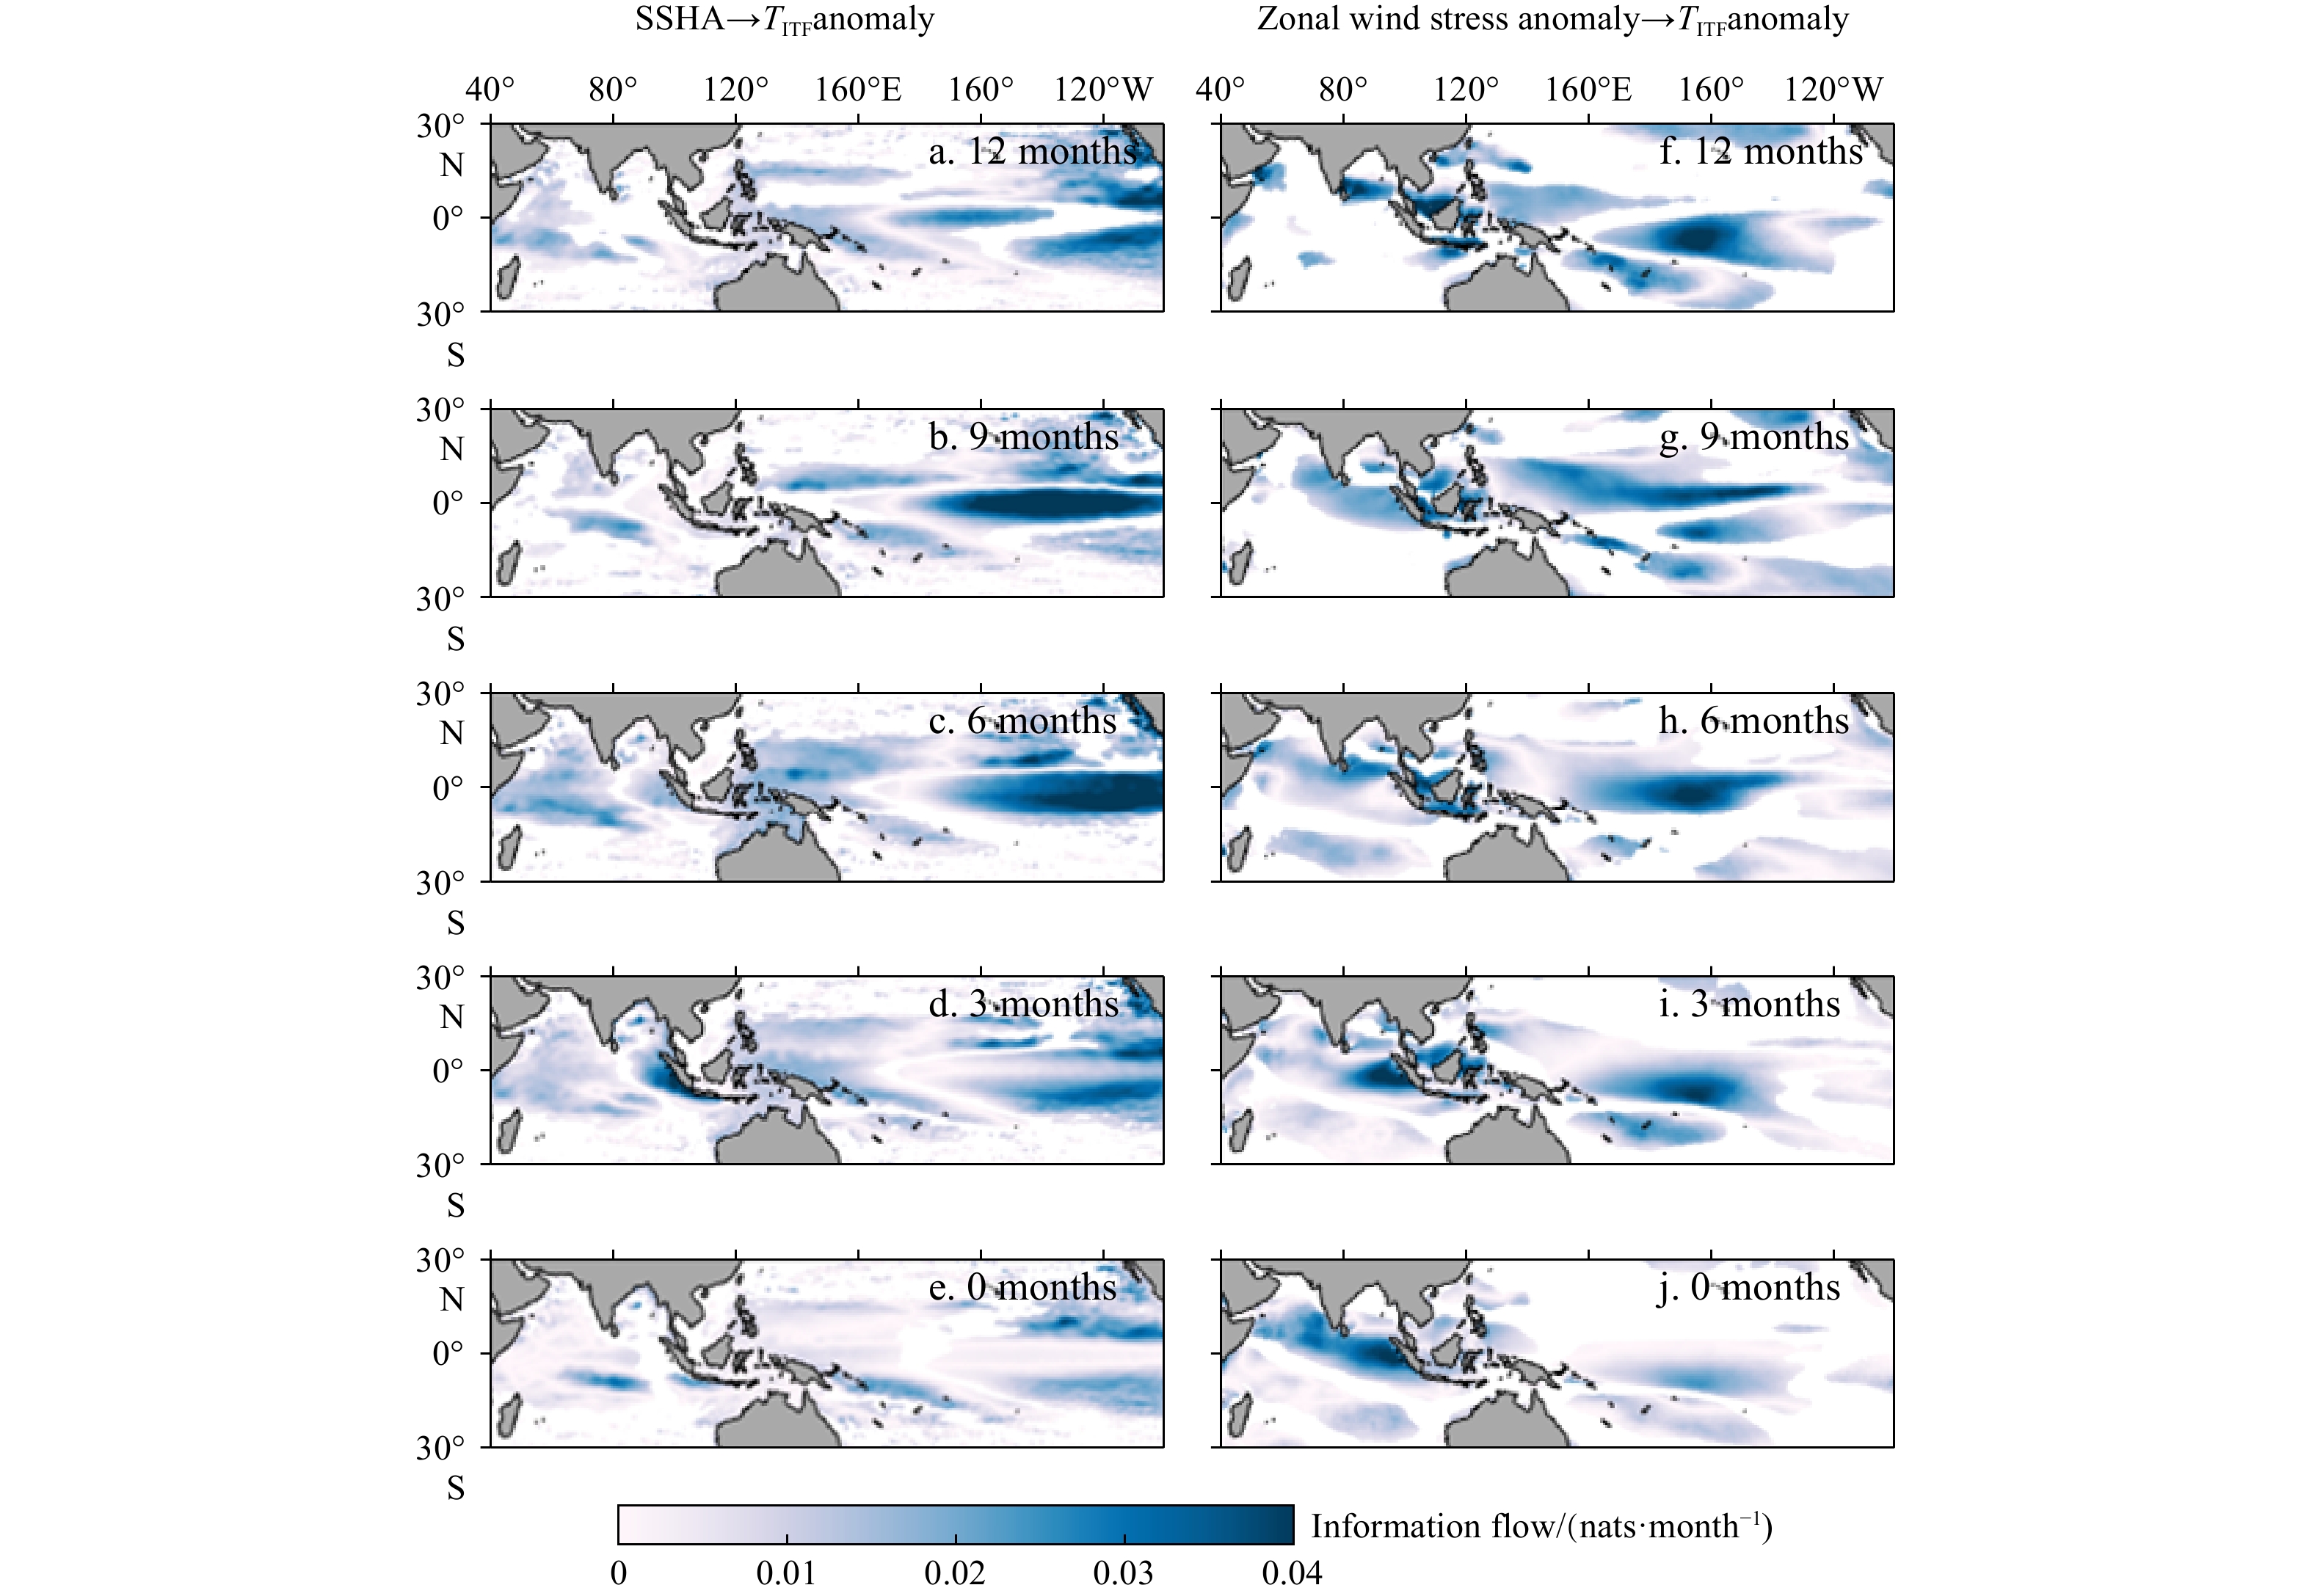
Figure 6. (a)–(e) Absolute information flow from SSHA in the tropical Indo-Pacific Ocean to TITF anomalies, with the later lagging by 12–0 months; (f)–(j) same as (a)–(e), but from ZWSA to TITF anomalies. Shadings indicate those above the 95% significance level.
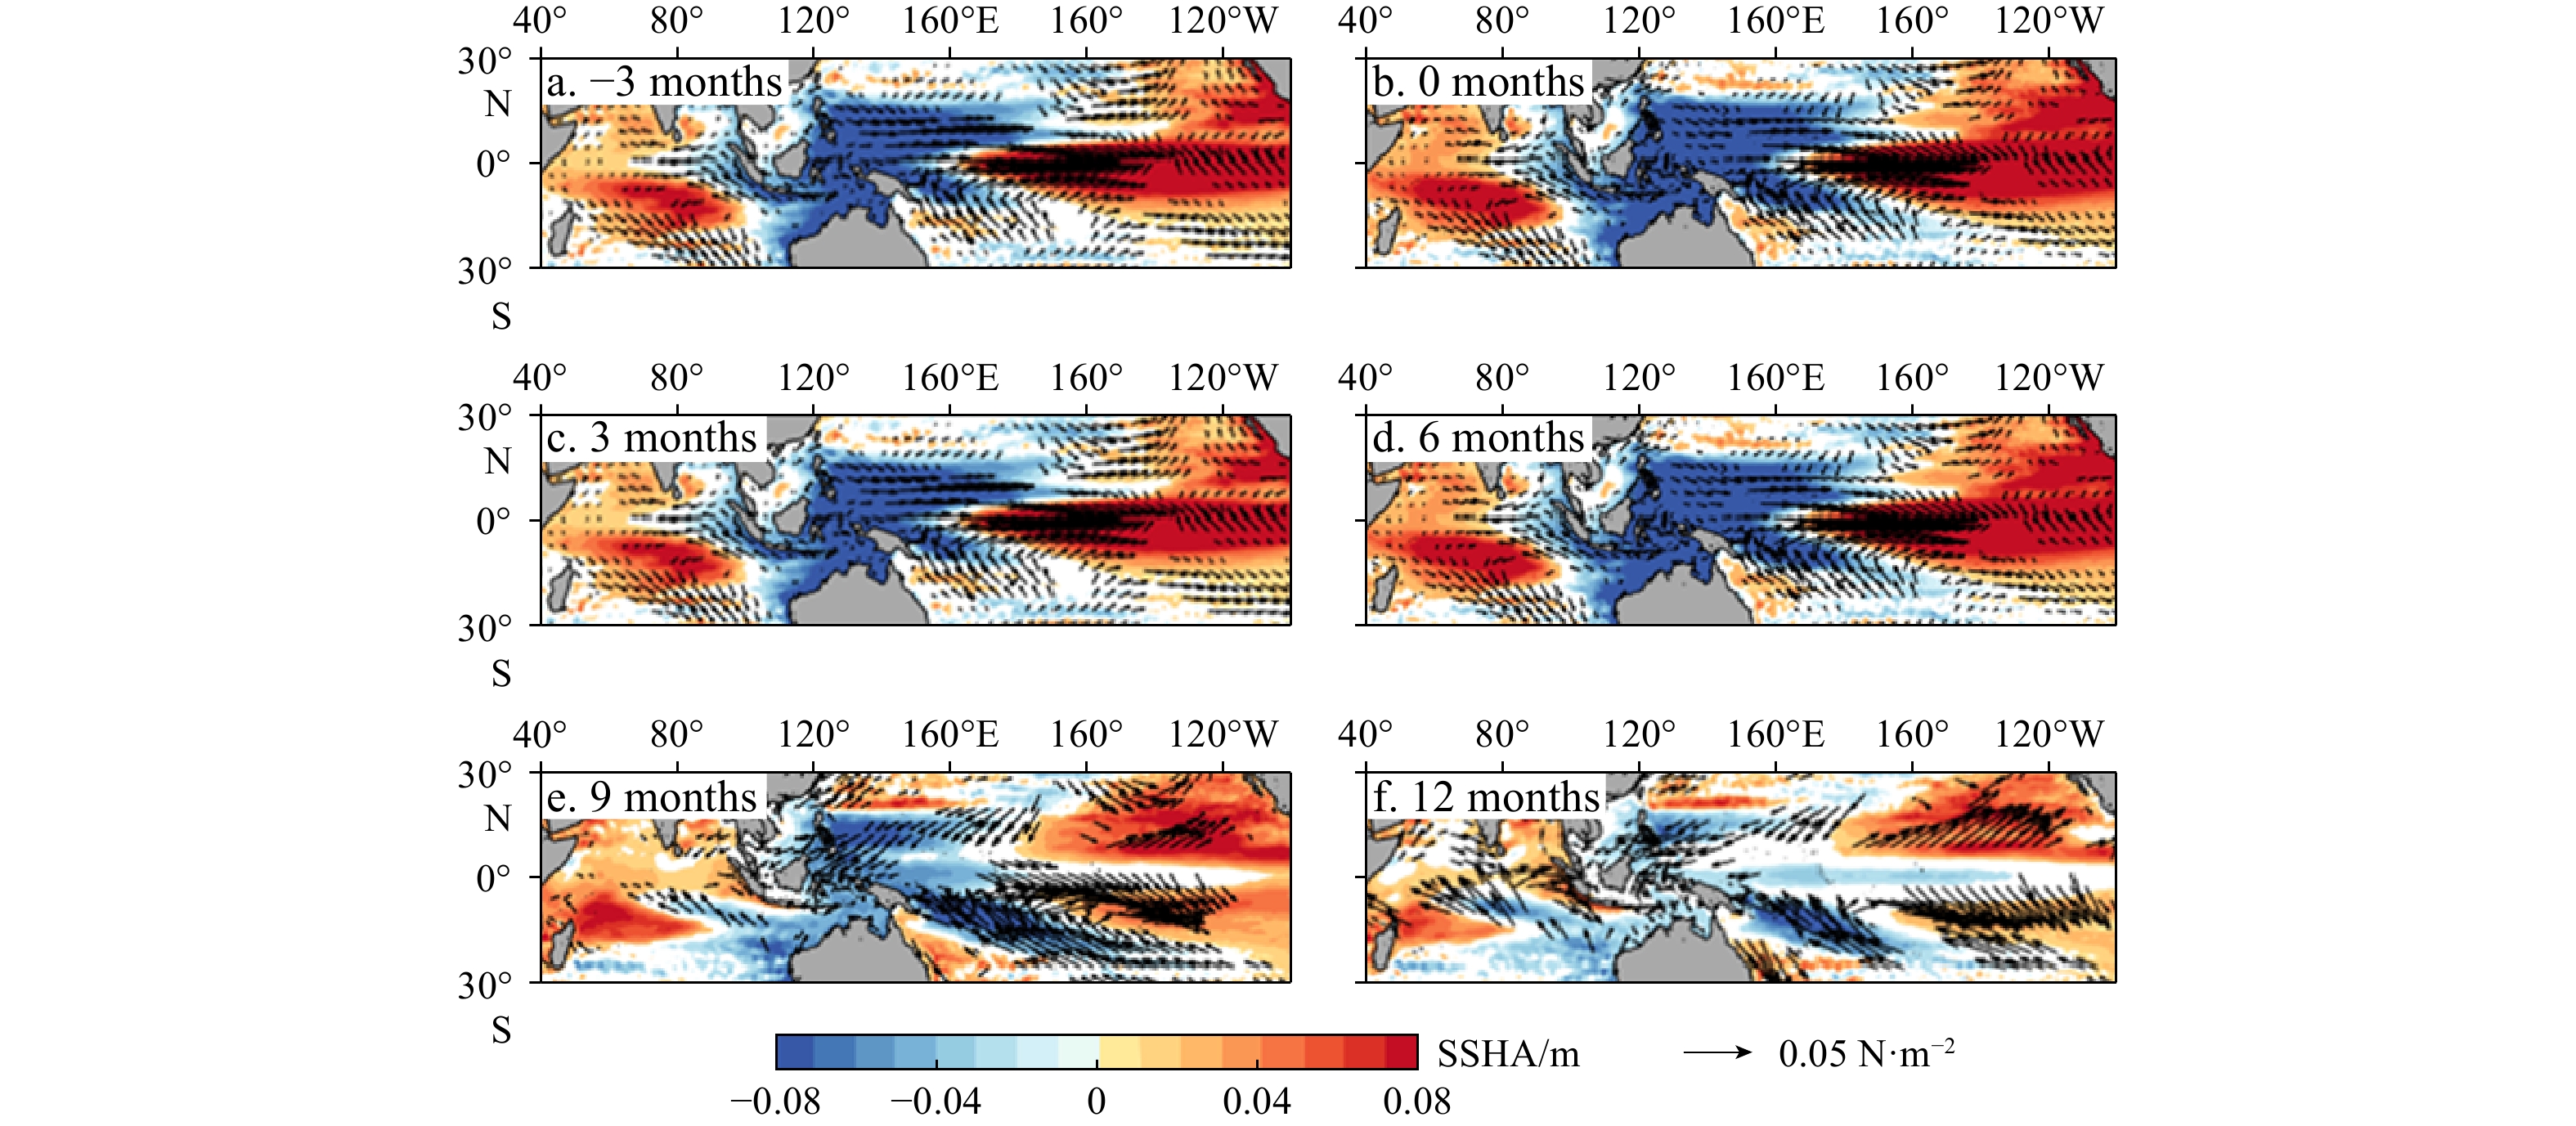
Figure 7. SSHA (shading) and wind stress anomalies (vector) regressed on Niño3.4 indices, with (a) leading time of 3 months, (b) synchronous regression, and (c)–(f) lagging time of 3–12 months. Only values above the 95% significance level are shown.

Figure 8. SSHA (shading) and wind stress anomalies (vector) regressed on DMI indices, with (a) leading time of 3 months, (b) synchronous regression, and (c)–(f) lagging time of 3–12 months. Only values above the 95% significance level are shown.

Figure 9. (a) Hovmöller diagram of wind stress (vector) and wind stress curl (shading) anomalies averaged between 12°–14°N in the Pacific Ocean; (b) same as (a), but for SSHA; (c) time series of TITF; (d) and (e) are same as (a) and (b), but averaged between 2°N–2°S in the Indian Ocean.

Figure 10. (a) Time series of area averaged SSHA (2°N–2°S, 98°–100°E); (b)–(j) composite SSHA (shading) and sea surface wind anomalies (vector) in the tropical Indian Ocean from month -1 to month +7, with month 0 refer to as the peak of the selected negative SSHA events as shown in (a).
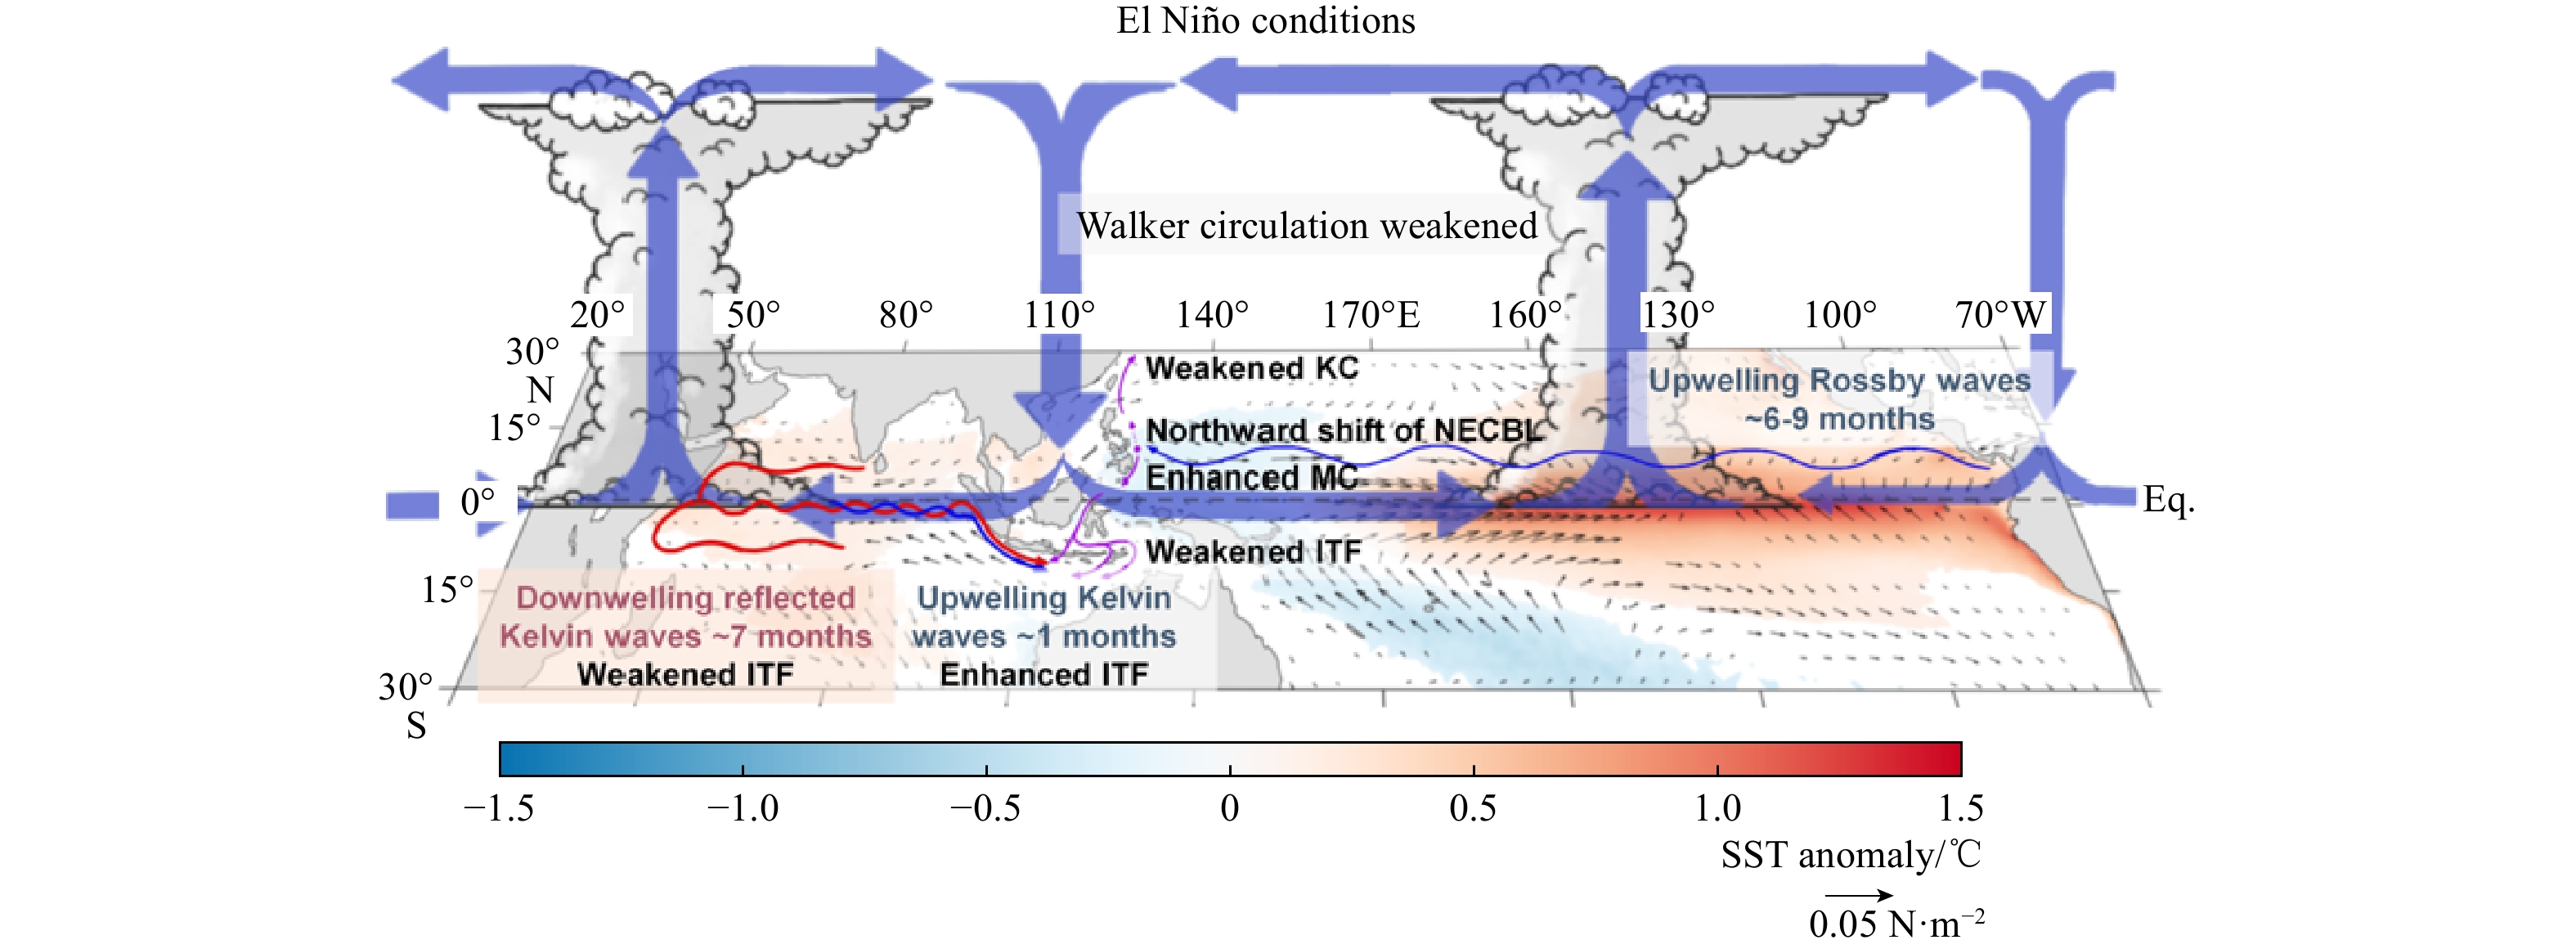
Figure 11. Schematic of the ITF in response to the El Niño condition. SST (shading) and wind stress anomalies (vector) regressed on Niño3.4 indices.
-
Annamalai H, Murtugudde R, Potemra J, et al. 2003. Coupled dynamics over the Indian Ocean: spring initiation of the Zonal Mode. Deep-Sea Research Part II: Topical Studies in Oceanography, 50(12–13): 2305–2330, doi: 10.1016/S0967-0645(03)00058-4 Banzon V, Smith T M, Chin T M, et al. 2016. A long-term record of blended satellite and in situ sea-surface temperature for climate monitoring, modeling and environmental studies. Earth System Science Data, 8(1): 165–176, doi: 10.5194/essd-8-165-2016 Bonjean F, Lagerloef G S E. 2002. Diagnostic model and analysis of the surface currents in the tropical pacific ocean. Journal of Physical Oceanography, 32(10): 2938–2954, doi: 10.1175/1520-0485(2002)032<2938:DMAAOT>2.0.CO;2 Broecker W S. 1991. Keeping global change honest. Global Biogeochemical Cycles, 5(3): 191–192, doi: 10.1029/91GB01421 Ducet N, Le Traon P Y, Reverdin G. 2000. Global high-resolution mapping of ocean circulation from TOPEX/Poseidon and ERS-1 and -2. Journal of Geophysical Research: Oceans, 105(C8): 19477–19498, doi: 10.1029/2000JC900063 Fang Guohong, Susanto R D, Wirasantosa S, et al. 2010. Volume, heat, and freshwater transports from the South China Sea to Indonesian seas in the boreal winter of 2007–2008. Journal of Geophysical Research: Oceans, 115(C12): C12020, doi: 10.1029/2010JC006225 Feng Ming, Zhang Ningning, Liu Qinyan, et al. 2018. The Indonesian Throughflow, its variability and centennial change. Geoscience Letters, 5(1): 3, doi: 10.1186/s40562-018-0102-2 Godfrey J S. 1989. A Sverdrup model of the depth-integrated flow for the world ocean allowing for island circulations. Geophysical & Astrophysical Fluid Dynamics, 45(1-2): 89–112, doi: 10.1080/03091928908208894 Gordon A L. 2001. Chapter 4.7 Interocean exchange. International Geophysics, 77: 303–314, doi: 10.1016/S0074-6142(01)80125-X Gordon A L, Huber B A, Metzger E J, et al. 2012. South China Sea throughflow impact on the Indonesian Throughflow. Geophysical Research Letters, 39(11): L11602, doi: 10.1029/2012GL052021 Gordon A L, Napitu A, Huber B A, et al. 2019. Makassar strait throughflow seasonal and interannual variability: an overview. Journal of Geophysical Research: Oceans, 124(6): 3724–3736, doi: 10.1029/2018JC014502 Gordon A L, Sprintall J, Van Aken H M, et al. 2010. The Indonesian Throughflow during 2004–2006 as observed by the INSTANT program. Dynamics of Atmospheres and Oceans, 50(2): 115–128, doi: 10.1016/j.dynatmoce.2009.12.002 Gruenburg L K, Gordon A L, Thurnherr A M. 2023. Indonesian Throughflow partitioning between leeuwin and south equatorial currents. Journal of Physical Oceanography, 53(9): 2159–2170, doi: 10.1175/JPO-D-22-0205.1 Gualdi S, Guilyardi E, Navarra A, et al. 2003. The interannual variability in the tropical Indian Ocean as simulated by a CGCM. Climate Dynamics, 20(6): 567–582, doi: 10.1007/s00382-002-0295-z Guo Haihong, Chen Zhaohui, Yang Haiyuan. 2019. Poleward shift of the pacific north equatorial current bifurcation. Journal of Geophysical Research: Oceans, 124(7): 4557–4571, doi: 10.1029/2019JC015019 Hirst A C, Godfrey J S. 1993. The role of Indonesian Throughflow in a global ocean GCM. Journal of Physical Oceanography, 23(6): 1057–1086, doi: 10.1175/1520-0485(1993)023<1057:TROITI>2.0.CO;2 Hu Shijian, Sprintall J. 2016. Interannual variability of the Indonesian Throughflow: the salinity effect. Journal of Geophysical Research: Oceans, 121(4): 2596–2615, doi: 10.1002/2015JC011495 Hu Shijian, Sprintall J. 2017. Observed strengthening of interbasin exchange via the Indonesian seas due to rainfall intensification. Geophysical Research Letters, 44(3): 1448–1456, doi: 10.1002/2016GL072494 Hu Xiaoyue, Sprintall J, Yuan Dongliang, et al. 2019. Interannual variability of the Sulawesi sea circulation forced by indo-pacific planetary waves. Journal of Geophysical Research: Oceans, 124(3): 1616–1633, doi: 10.1029/2018JC014356 Hu Xiaoyue, Xue Huijie, Liang Linlin. 2022. Impact of ENSO on the entrance of the Indonesian Throughflow: the oceanic wave propagation. Journal of Geophysical Research: Oceans, 127(12): e2022JC018782, doi: 10.1029/2022JC018782 Huang Boyin, Liu Chunying, Banzon V, et al. 2021. Improvements of the daily optimum interpolation sea surface temperature (DOISST) version 2.1. Journal of Climate, 34(8): 2923–2939, doi: 10.1175/JCLI-D-20-0166.1 Jiang Guoqing, Wei Jun, Malanotte-Rizzoli P, et al. 2019. Seasonal and interannual variability of the subsurface velocity profile of the Indonesian Throughflow at Makassar strait. Journal of Geophysical Research: Oceans, 124(12): 9644–9657, doi: 10.1029/2018JC014884 Kajtar J B, Santoso A, England M H, et al. 2015. Indo-pacific climate interactions in the absence of an Indonesian Throughflow. Journal of Climate, 28(13): 5017–5029, doi: 10.1175/JCLI-D-14-00114.1 Kashino Y, España N, Syamsudin F, et al. 2009. Observations of the North Equatorial Current, Mindanao Current, and Kuroshio current system during the 2006/07 El Niño and 2007/08 La Niña. Journal of Oceanography, 65(3): 325–333, doi: 10.1007/s10872-009-0030-z Kim Y Y, Qu Tangdong, Jensen T, et al. 2004. Seasonal and interannual variations of the North Equatorial Current bifurcation in a high-resolution OGCM. Journal of Geophysical Research: Oceans, 109(C3): C03040, doi: 10.1029/2003JC002013 Lagerloef G S E, Mitchum G T, Lukas R B, et al. 1999. Tropical Pacific near-surface currents estimated from altimeter, wind, and drifter data. Journal of Geophysical Research: Oceans, 104(C10): 23313–23326, doi: 10.1029/1999JC900197 Large W G, Pond S. 1981. Open ocean momentum flux measurements in moderate to strong winds. Journal of Physical Oceanography, 11(3): 324–336, doi: 10.1175/1520-0485(1981)011<0324:OOMFMI>2.0.CO;2 Li Mingting, Gordon A L, Gruenburg L K, et al. 2020. Interannual to decadal response of the Indonesian Throughflow vertical profile to indo-pacific forcing. Geophysical Research Letters, 47(11): e2020GL087679, doi: 10.1029/2020GL087679 Li Mingting, Gordon A L, Wei Jun, et al. 2018. Multi-decadal timeseries of the Indonesian Throughflow. Dynamics of Atmospheres and Oceans, 81: 84–95, doi: 10.1016/j.dynatmoce.2018.02.001 Li Mingting, Wei Jun, Wang Dongxiao, et al. 2019. Exploring the importance of the Mindoro-Sibutu pathway to the upper-layer circulation of the South China Sea and the Indonesian Throughflow. Journal of Geophysical Research: Oceans, 124(7): 5054–5066, doi: 10.1029/2018JC014910 Li Bo, Yuan Dongliang, Hu Xiaoyue, et al. 2024. Variability and dynamics of the Kuroshio and Mindanao current during the 2010/11 La Niña and in late 2012. Journal of Physical Oceanography, 54(7): 1431–1448, doi: 10.1175/JPO-D-23-0124.1 Li Aojie, Zhang Yongchui, Hong Mei, et al. 2023. Relative importance of ENSO and IOD on interannual variability of Indonesian Throughflow transport. Frontiers in Marine Science, 10: 1182255, doi: 10.3389/fmars.2023.1182255 Liang X S. 2008. Information flow within stochastic dynamical systems. Physical Review E, 78(3): 031113, doi: 10.1103/PhysRevE.78.031113 Liang X S. 2014. Unraveling the cause-effect relation between time series. Physical Review E, 90(5): 052150, doi: 10.1103/PhysRevE.90.052150 Liang X S, Kleeman R. 2005. Information transfer between dynamical system components. Physical Review Letters, 95(24): 244101, doi: 10.1103/PhysRevLett.95.244101 Liu Qinyan, Feng Ming, Wang Dongxiao, et al. 2015. Interannual variability of the Indonesian throughflow transport: a revisit based on 30 year expendable bathythermograph data. Journal of Geophysical Research: Oceans, 120(12): 8270–8282, doi: 10.1002/2015JC011351 Meyers G. 1996. Variation of Indonesian Throughflow and the El Niño-southern oscillation. Journal of Geophysical Research: Oceans, 101(C5): 12255–12263, doi: 10.1029/95JC03729 Meyers G, Bailey R J, Worby A P. 1995. Geostrophic transport of Indonesian Throughflow. Deep-Sea Research Part I: Oceanographic Research Papers, 42(7): 1163–1174, doi: 10.1016/0967-0637(95)00037-7 Napitu A M, Pujiana K, Gordon A L. 2019. The madden-Julian oscillation’s impact on the Makassar strait surface layer transport. Journal of Geophysical Research: Oceans, 124(6): 3538–3550, doi: 10.1029/2018JC014729 Potemra J T. 2005. Indonesian Throughflow transport variability estimated from satellite altimetry. Oceanography, 18(4): 98–107, doi: 10.5670/oceanog.2005.10 Pujiana K, McPhaden M J, Gordon A L, et al. 2019. Unprecedented response of Indonesian Throughflow to anomalous indo-pacific climatic forcing in 2016. Journal of Geophysical Research: Oceans, 124(6): 3737–3754, doi: 10.1029/2018JC014574 Qiu Bo, Chen Shuiming. 2010. Interannual-to-decadal variability in the bifurcation of the north equatorial current off the Philippines. Journal of Physical Oceanography, 40(11): 2525–2538, doi: 10.1175/2010JPO4462.1 Qu Tangdong, Lukas R. 2003. The bifurcation of the north equatorial current in the pacific. Journal of Physical Oceanography, 33(1): 5–18, doi: 10.1175/1520-0485(2003)033<0005:TBOTNE>2.0.CO;2 Qu Tangdong, Mitsudera H, Yamagata T. 1998. On the western boundary currents in the Philippine Sea. Journal of Geophysical Research: Oceans, 103(C4): 7537–7548, doi: 10.1029/98JC00263 Reynolds R W, Smith T M, Liu Chunying, et al. 2007. Daily high-resolution-blended analyses for sea surface temperature. Journal of Climate, 20(22): 5473–5496, doi: 10.1175/2007JCLI1824.1 Saji N H, Goswami B N, Vinayachandran P N, et al. 1999. A dipole mode in the tropical Indian Ocean. Nature, 401(6751): 360–363, doi: 10.1038/43854 Santoso A, Cai W, England M H, et al. 2011. The role of the Indonesian Throughflow on ENSO dynamics in a coupled climate model. Journal of Climate, 24(3): 585–601, doi: 10.1175/2010JCLI3745.1 Song Qian, Vecchi G A, Rosati A J. 2007. The role of the Indonesian Throughflow in the indo–pacific climate variability in the GFDL coupled climate model. Journal of Climate, 20(11): 2434–2451, doi: 10.1175/JCLI4133.1 Sprintall J, Révelard A. 2014. The Indonesian Throughflow response to Indo-Pacific climate variability. Journal of Geophysical Research: Oceans, 119(2): 1161–1175, doi: 10.1002/2013JC009533 Sprintall J, Wijffels S, Gordon A L, et al. 2004. INSTANT: a new international array to measure the Indonesian Throughflow. Eos, Transactions American Geophysical Union, 85(39): 369–376, doi: 10.1029/2004EO390002 Sprintall J, Wijffels S E, Molcard R, et al. 2009. Direct estimates of the Indonesian Throughflow entering the Indian Ocean: 2004–2006. Journal of Geophysical Research: Oceans, 114(C7): C07001, doi: 10.1029/2008JC005257 Susanto R D, Song Y T. 2015. Indonesian Throughflow proxy from satellite altimeters and gravimeters. Journal of Geophysical Research: Oceans, 120(4): 2844–2855, doi: 10.1002/2014JC010382 Talley L D. 2013. Closure of the global overturning circulation through the Indian, pacific, and southern oceans: schematics and transports. Oceanography, 26(1): 80–97, doi: 10.5670/oceanog.2013.07 Tillinger D, Gordon A L. 2010. Transport weighted temperature and internal energy transport of the Indonesian Throughflow. Dynamics of Atmospheres and Oceans, 50(2): 224–232, doi: 10.1016/j.dynatmoce.2010.01.002 Toole, J. M., Zou, E., & Millard, R. C. 1988. On the circulation of the upper waters in the western equatorial Pacific Ocean. Deep Sea Research Part A. Oceanographic Research Papers, 35(9): 1451–1482, doi: 10.1016/0198-0149(88)90097-0 Toole J M, Millard R C, Wang Z, et al. 1990. Observations of the Pacific North equatorial current bifurcation at the Philippine coast. Journal of Physical Oceanography, 20(2): 307–318, doi: 10.1175/1520-0485(1990)020<0307:OOTPNE>2.0.CO;2 van Sebille E, Barron C N, Biastoch A, et al. 2009. Relating Agulhas leakage to the Agulhas Current retroflection location. Ocean Science, 5(4): 511–521, doi: 10.5194/os-5-511-2009 van Sebille E, Sprintall J, Schwarzkopf F U, et al. 2014. Pacific-to-Indian Ocean connectivity: Tasman leakage, Indonesian Throughflow, and the role of ENSO. Journal of Geophysical Research: Oceans, 119(2): 1365–1382, doi: 10.1002/2013JC009525 Vranes K, Gordon A L, Ffield A. 2002. The heat transport of the Indonesian Throughflow and implications for the Indian Ocean heat budget. Deep-Sea Research Part II: Topical Studies in Oceanography, 49(7-8): 1391–1410, doi: 10.1016/S0967-0645(01)00150-3 Wang Li-Chiao, Lin Yongfu, Wu Chau-Ron. 2022. Intensified modulation of the Pacific north equatorial current bifurcation by the southern annular mode since the early 1990s. Scientific Reports, 12(1): 21210, doi: 10.1038/s41598-022-25661-w Wang Xin, Wang Chunzai. 2014. Different impacts of various El Niño events on the Indian Ocean Dipole. Climate Dynamics, 42(3-4): 991–1005, doi: 10.1007/s00382-013-1711-2 Wang Jing, Yuan Dongliang. 2015. Roles of western and eastern boundary reflections in the Interannual sea level variations during negative Indian Ocean dipole events. Journal of Physical Oceanography, 45(7): 1804–1821, doi: 10.1175/JPO-D-14-0124.1 Wang Qingye, Zhai Fangguo, Wang Fujun, et al. 2014. Intraseasonal variability of the subthermocline current east of Mindanao. Journal of Geophysical Research: Oceans, 119(12): 8552–8566, doi: 10.1002/2014JC010343 Wei Jun, Li Mingting, Malanotte-Rizzoli P, et al. 2016. Opposite variability of Indonesian Throughflow and South China Sea throughflow in the Sulawesi sea. Journal of Physical Oceanography, 46(10): 3165–3180, doi: 10.1175/JPO-D-16-0132.1 White W B, Meyers G A, Donguy J R, et al. 1985. Short-term climatic variability in the thermal structure of the Pacific Ocean during 1979–82. Journal of Physical Oceanography, 15(7): 917–935, doi: 10.1175/1520-0485(1985)015<0917:STCVIT>2.0.CO;2 Wijffels S E, Willis J, Domingues C M, et al. 2008. Changing expendable bathythermograph fall rates and their impact on estimates of thermosteric sea level rise. Journal of Climate, 21(21): 5657–5672, doi: 10.1175/2008JCLI2290.1 Wunsch C. 1997. The vertical partition of oceanic horizontal kinetic energy. Journal of Physical Oceanography, 27(8): 1770–1794, doi: 10.1175/1520-0485(1997)027<1770:TVPOOH>2.0.CO;2 Wunsch C. 2010. Towards understanding the Paleocean. Quaternary Science Reviews, 29(17-18): 1960–1967, doi: 10.1016/j.quascirev.2010.05.020 Wyrtki K. 1987. Indonesian through flow and the associated pressure gradient. Journal of Geophysical Research: Oceans, 92(C12): 12941–12946, doi: 10.1029/JC092iC12p12941 Xie Tengxiang, Newton R, Schlosser P, et al. 2019. Long-term mean mass, heat and nutrient flux through the Indonesian seas, based on the tritium inventory in the pacific and Indian Oceans. Journal of Geophysical Research: Oceans, 124(6): 3859–3875, doi: 10.1029/2018JC014863 Xin Linchao, Hu Shijian, Wang Fan, et al. 2023. Using a deep-learning approach to infer and forecast the Indonesian Throughflow transport from sea surface height. Frontiers in Marine Science, 10: 1079286, doi: 10.3389/fmars.2023.1079286 Xu Tengfei, Wei Zexun, Cao Guojiao, et al. 2016. Pathways of intraseasonal Kelvin waves in the Indonesian Throughflow regions derived from satellite altimeter observation. Atmospheric and Oceanic Science Letters, 9(5): 375–380, doi: 10.1080/16742834.2016.1208047 Xu Tengfei, Wei Zexun, Susanto R D, et al. 2021. Observed water exchange between the South China Sea and java sea through Karimata strait. Journal of Geophysical Research: Oceans, 126(2): e2020JC016608, doi: 10.1029/2020JC016608 Xu Tengfei, Wei Zexun, Zhao Haifeng, et al. 2024. Simulated Indonesian Throughflow in Makassar strait across the SODA3 products. Acta Oceanologica Sinica, 43(1): 80–98, doi: 10.1007/s13131-023-2186-6 Yuan Dongliang, Liu Haihong. 2009. Long-wave dynamics of sea level variations during Indian Ocean dipole events. Journal of Physical Oceanography, 39(5): 1115–1132, doi: 10.1175/2008JPO3900.1 Yuan Dongliang, Rienecker M M, Schopf P S. 2004. Long wave dynamics of the interannual variability in a numerical hindcast of the equatorial Pacific Ocean circulation during the 1990s. Journal of Geophysical Research: Oceans, 109(C5): C05019, doi: 10.1029/2003JC001936 Yuan Dongliang, Wang Jing, Xu Tengfei, et al. 2011. Forcing of the Indian Ocean dipole on the interannual variations of the tropical pacific ocean: roles of the Indonesian Throughflow. Journal of Climate, 24(14): 3593–3608, doi: 10.1175/2011JCLI3649.1 Yuan Dongliang, Zhou Hui, Zhao Xia. 2013. Interannual climate variability over the tropical pacific ocean induced by the Indian Ocean dipole through the Indonesian Throughflow. Journal of Climate, 26(9): 2845–2861, doi: 10.1175/JCLI-D-12-00117.1 Zhai Fangguo, Hu Dunxin. 2012. Interannual variability of transport and bifurcation of the North Equatorial Current in the tropical North Pacific Ocean. Chinese Journal of Oceanology and Limnology, 30(1): 177–185, doi: 10.1007/s00343-012-1194-8 Zhai Fangguo, Hu Dunxin. 2013. Revisit the interannual variability of the North Equatorial Current transport with ECMWF ORA-S3. Journal of Geophysical Research: Oceans, 118(3): 1349–1366, doi: 10.1002/jgrc.20093 Zhai Fangguo, Wang Qingye, Wang Fujun, et al. 2014. Variation of the North Equatorial Current, Mindanao Current, and Kuroshio Current in a high-resolution data assimilation during 2008–2012. Advances in Atmospheric Sciences, 31(6): 1445–1459, doi: 10.1007/s00376-014-3241-1 Zhang Tiecheng, Wang Weiqiang, Xie Qiang, et al. 2019. Heat contribution of the Indonesian Throughflow to the Indian Ocean. Acta Oceanologica Sinica, 38(4): 72–79, doi: 10.1007/s13131-019-1414-6 Zhao Yunxia, Wei Zexun, Wang Yonggang, et al. 2015. Correlation analysis of the North Equatorial Current bifurcation and the Indonesian Throughflow. Acta Oceanologica Sinica, 34(9): 1–11, doi: 10.1007/s13131-015-0736-2 Zhou Hui, Liu Xueqi, Li Ruixiang, et al. 2021. Intraseasonal variability of the north equatorial current bifurcation off the Philippines. Journal of Geophysical Research: Oceans, 126(11): e2021JC017646, doi: 10.1029/2021JC017646 Zhou Lei, Murtugudde R, Jochum M. 2008. Seasonal influence of Indonesian Throughflow in the southwestern Indian Ocean. Journal of Physical Oceanography, 38(7): 1529–1541, doi: 10.1175/2007JPO3851.1 -

 DownLoad:


 下载:
下载:
 点击查看大图
计量
- 文章访问数: 60
- HTML全文浏览量: 15
- 被引次数: 0

