

-
Abstract: The nutrients from the East China Sea (ECS) through the Tsushima/Korea Strait (TS) strongly impact the ecosystem of the Japan Sea (JS). The complex origins of the Tsushima Warm Current and the various nutrient sources in the ECS result in complex spatial-temporal variations in nutrients in the TS. Using a physical-biological model with a tracking technique, we studied the effects of nutrient sources from the ECS on the TS. Among all the nutrient sources, the Kuroshio has the highest nutrient concentrations in the TS. Its maximum concentration occurs at the bottom, while those of rivers and atmospheric deposition occur at the surface, and that of the Taiwan Strait occurs in the middle layer. The nutrient transport through the TS exhibits similar seasonal variations, as does the volume transport. The transport of nutrients from the Kuroshio accounts for more than 85% of the total. The transport of nutrients from the Taiwan Strait is greater during autumn and winter. The transport of dissolved inorganic nitrogen (DIN) from both rivers and atmospheric deposition through the TS peak in August. Nutrient transport cannot be equated with volume transport. The DIN in the less saline zone originates not only from rivers but also from atmospheric deposition and the Kuroshio. The transport of nutrients from the Taiwan Strait is not as significant as its volume transport in the TS.
-
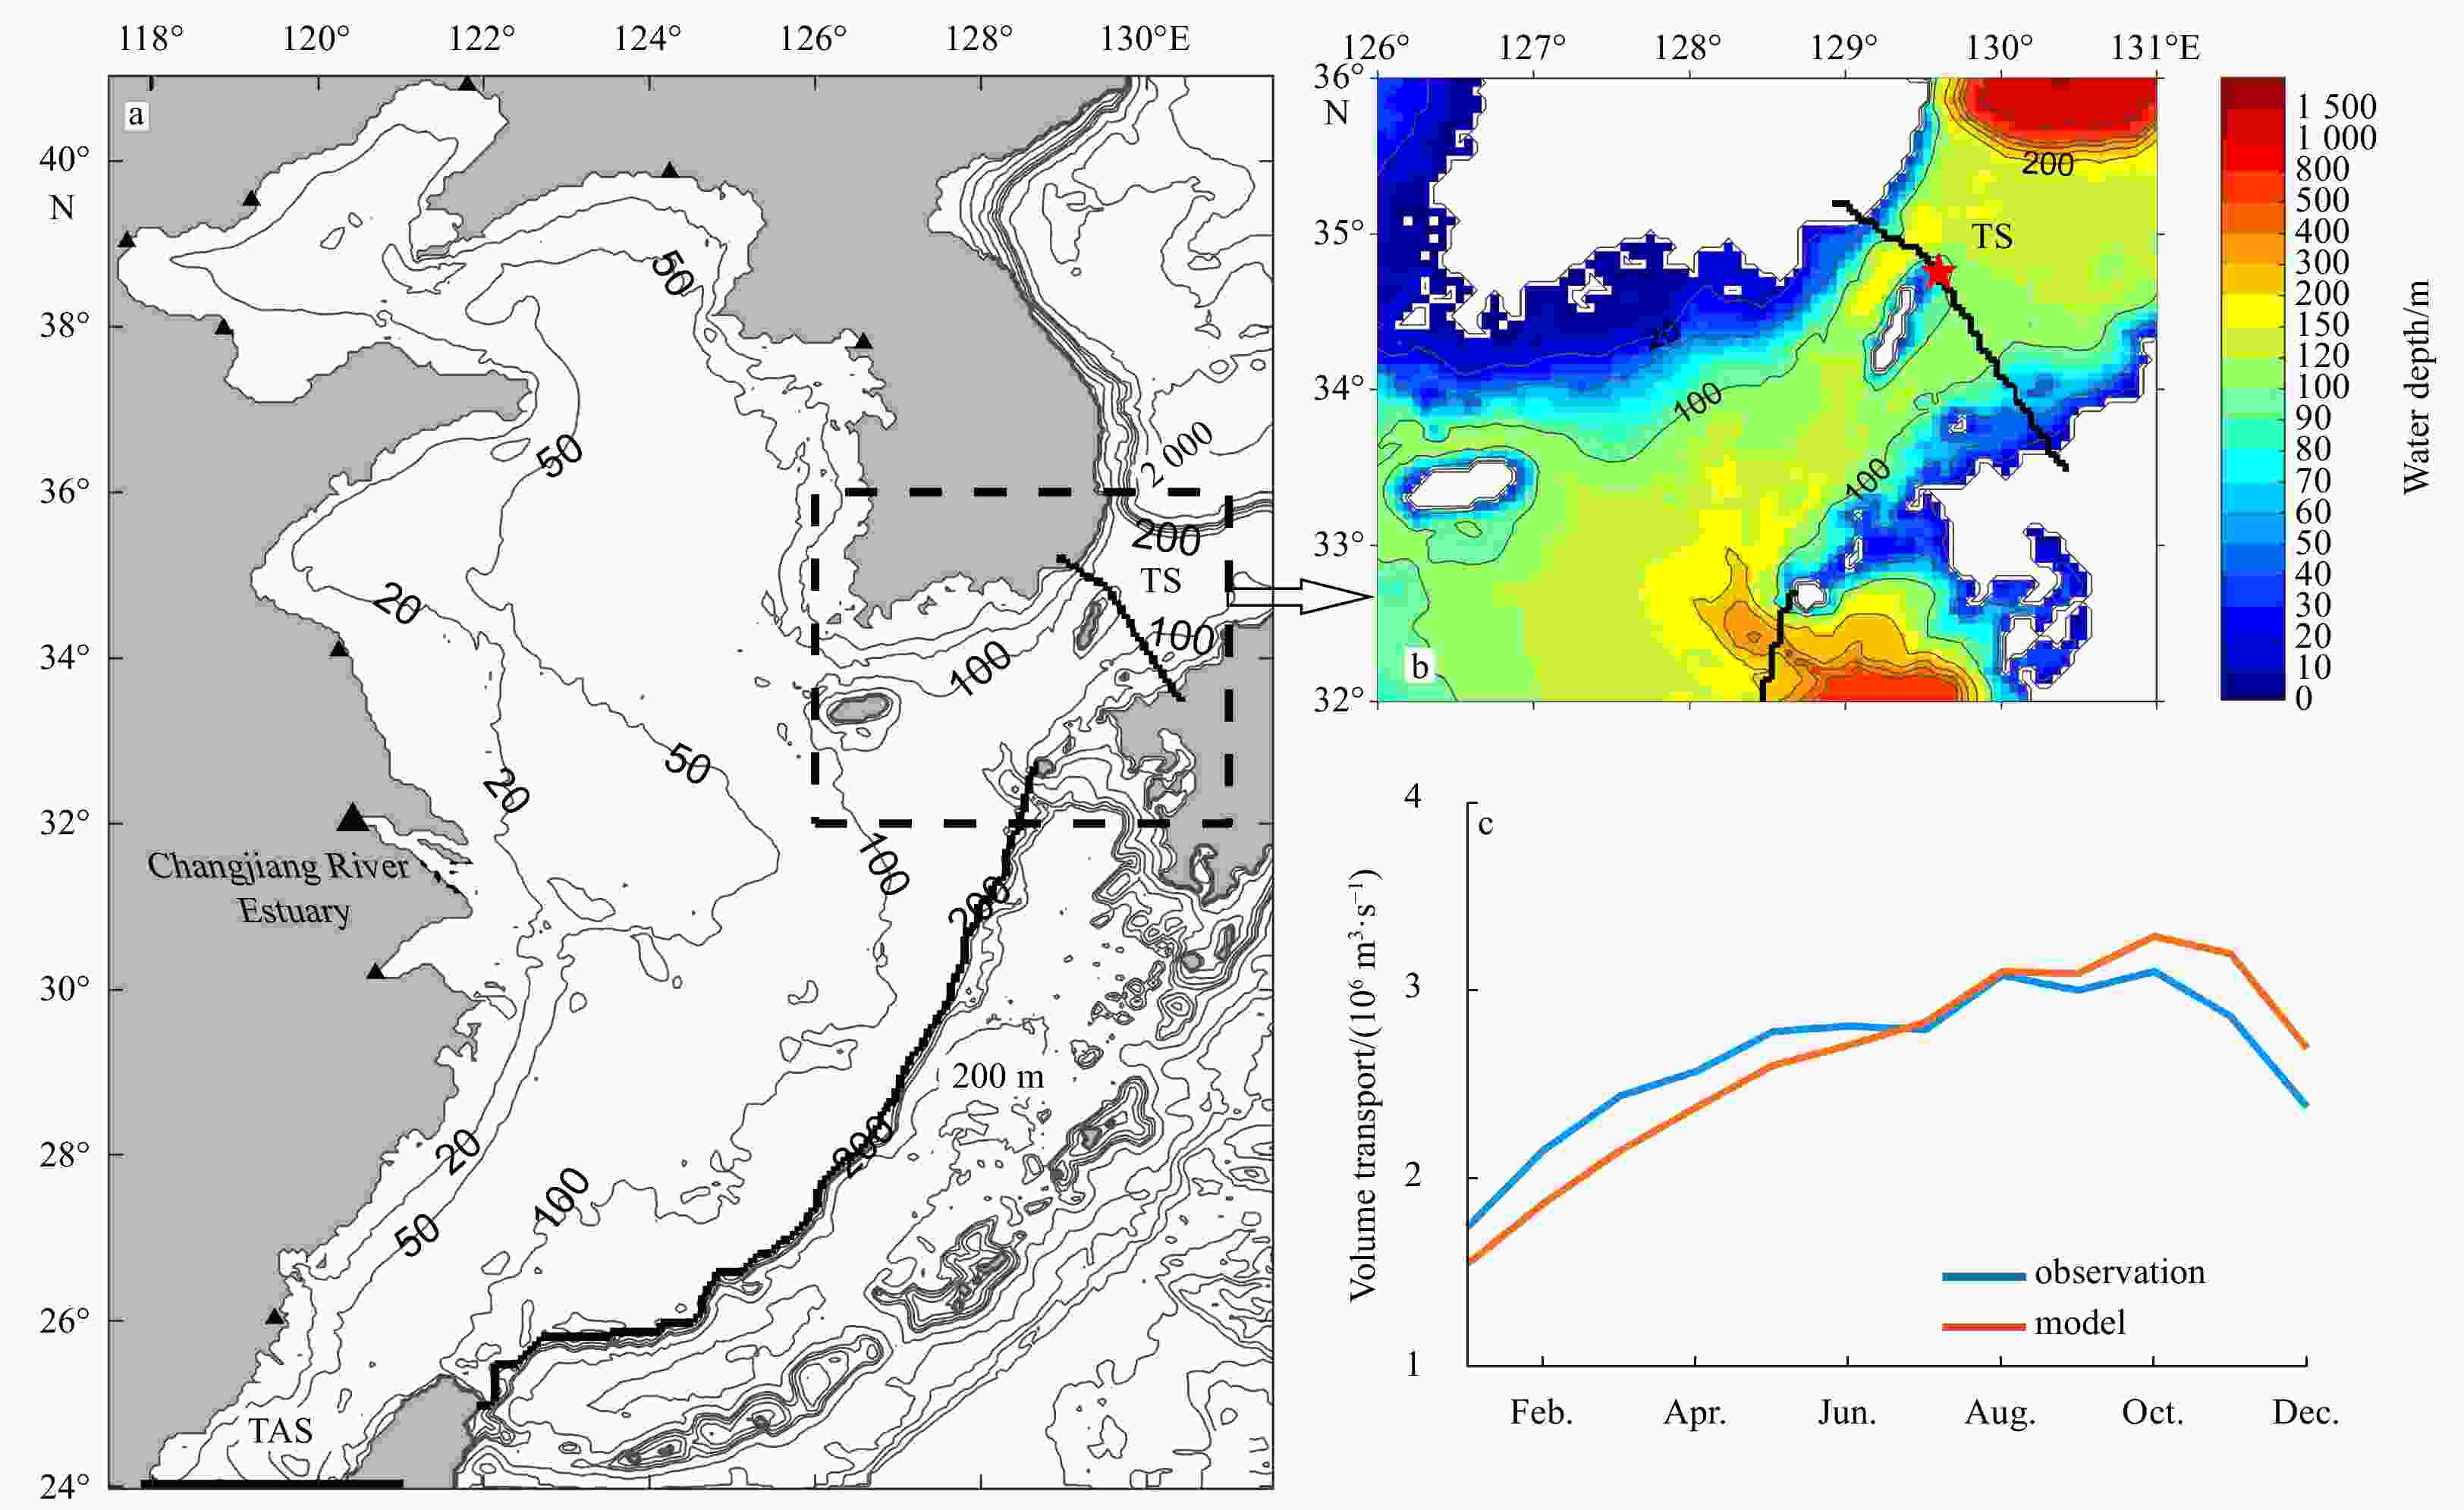
Figure 1. Model bathymetry in the East China Sea and location of the Tsushima Strait section (TS), the Taiwan Strait section (TAS), and the 200-m isobath (200 m) (a). b. The dashed-line encircled area in Fig. 1a is displayed. The red pentagram marks the boundary between the eastern (ETS) and western (WTS) channels. The locations of the ETS and WTS are described previously by Takikawa et al. (2005). c. Monthly variations in volume transport through the TS. Red and blue represent the model and observation results, respectively.
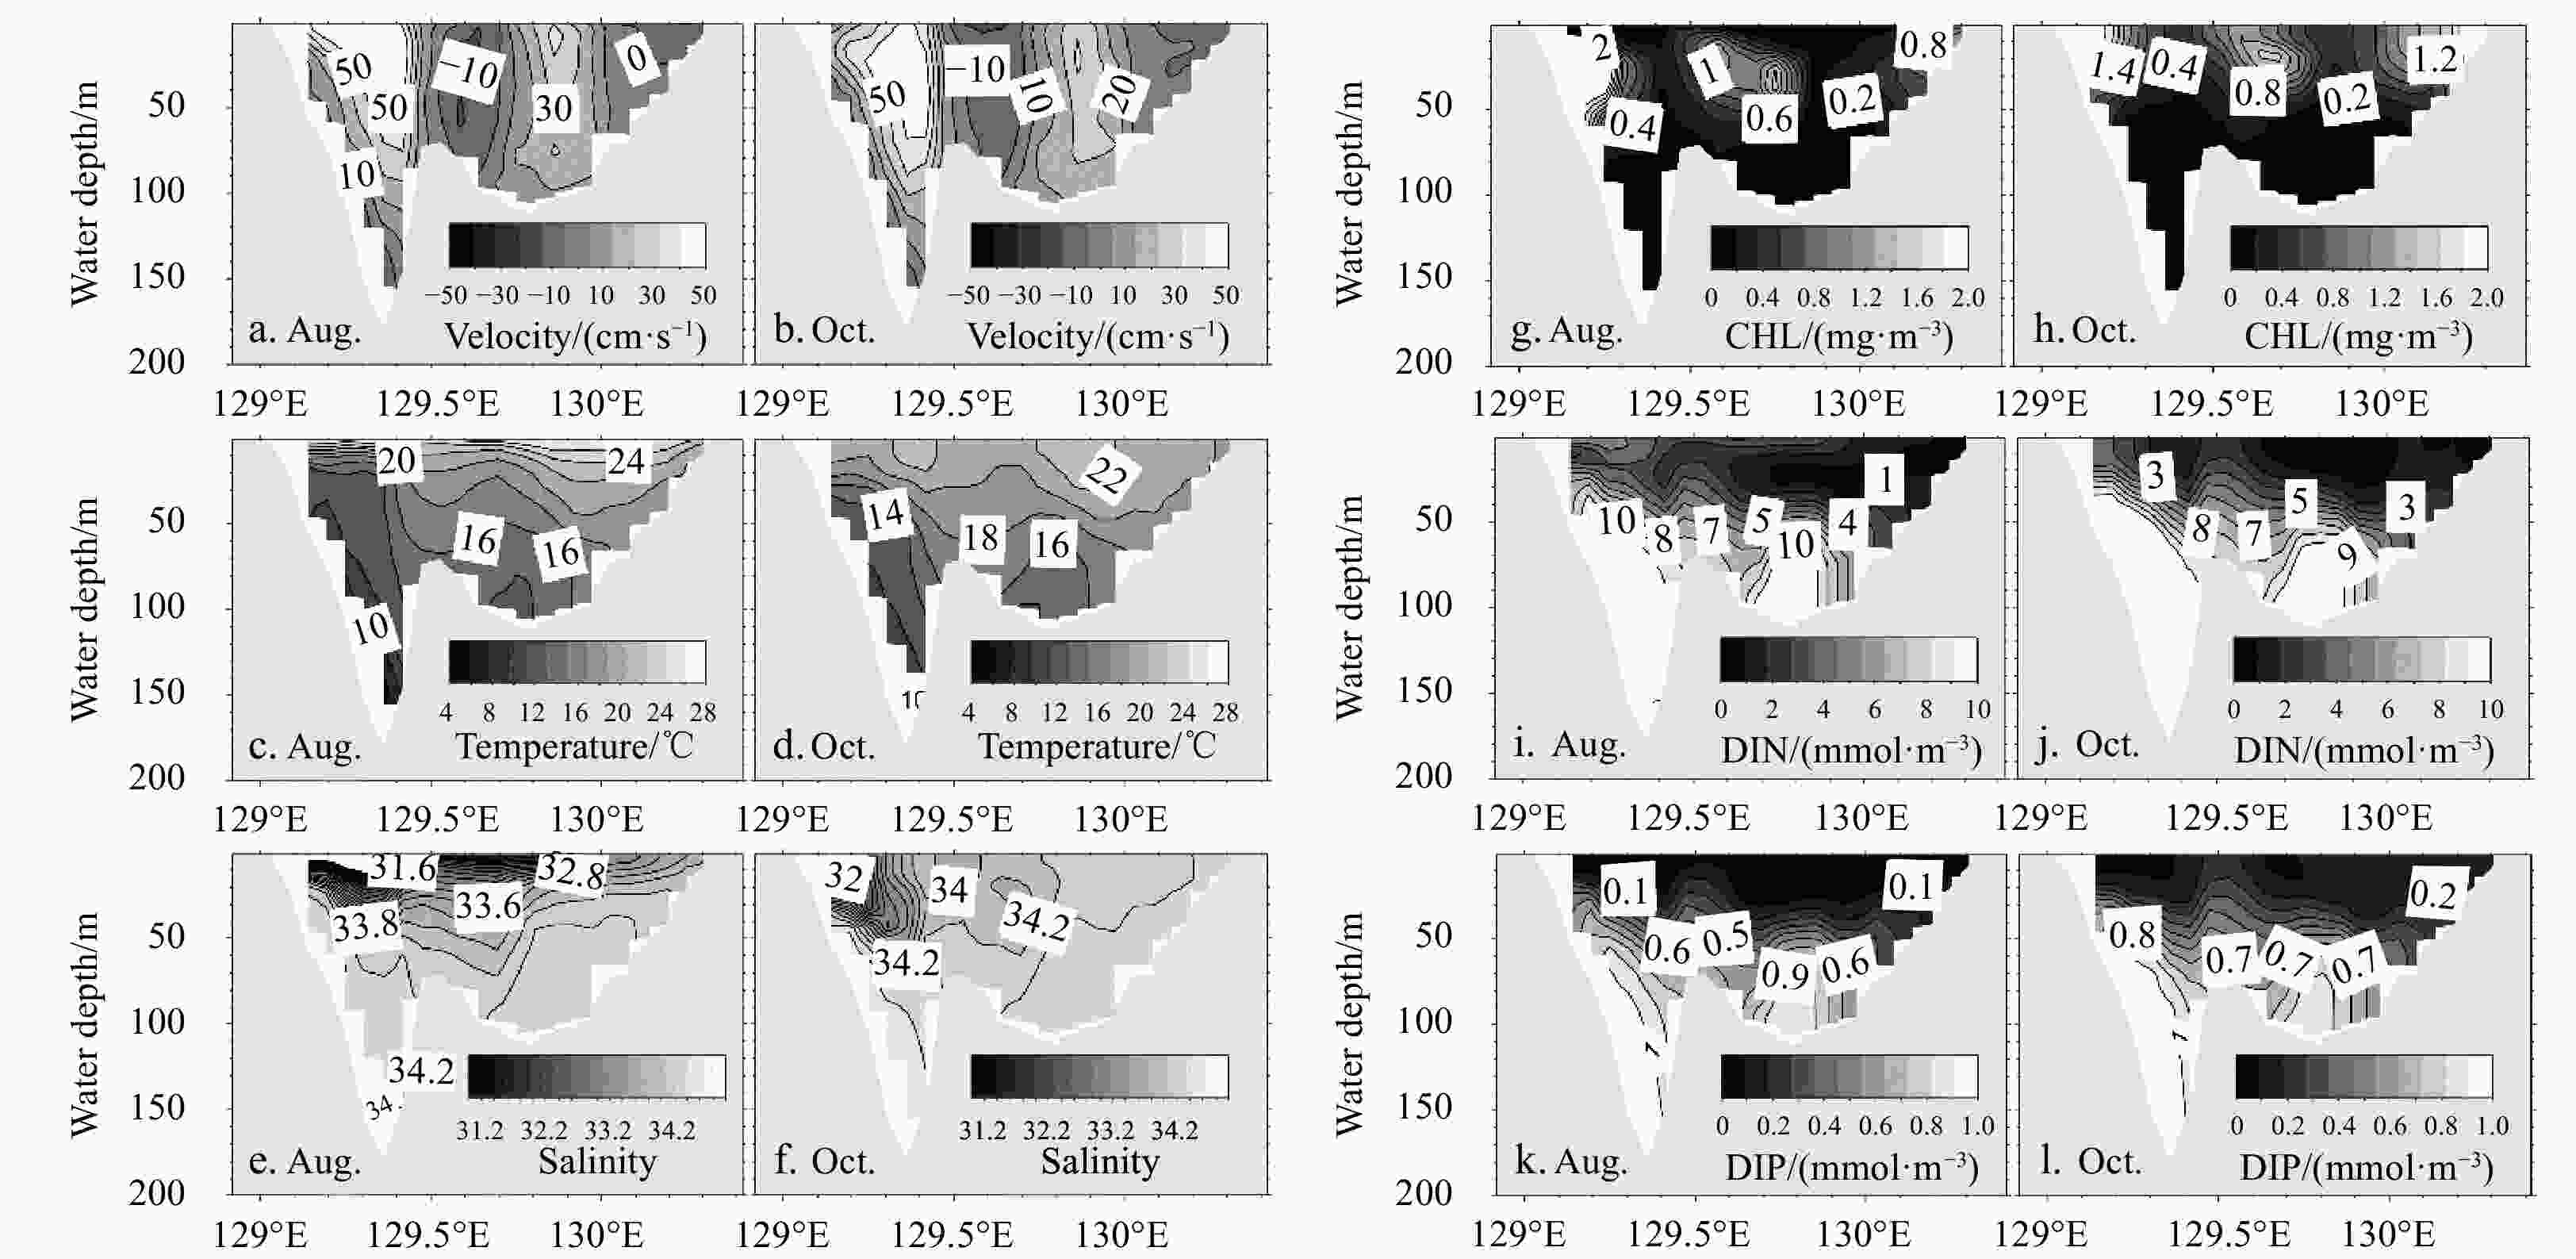
Figure 2. Vertical distributions of the velocity normal to the section (cm/s) (a, b), the temperature (℃) (c, d), the salinity (e, f), the CHL concentration (mg/m3) (g, h), the DIN concentration (mmol/m3) (i, j) and the DIP concentration (mmol/m3) (k, l) in the TS section in August and October from the model results. A positive velocity indicates transport in the direction from the ECS to the JS.

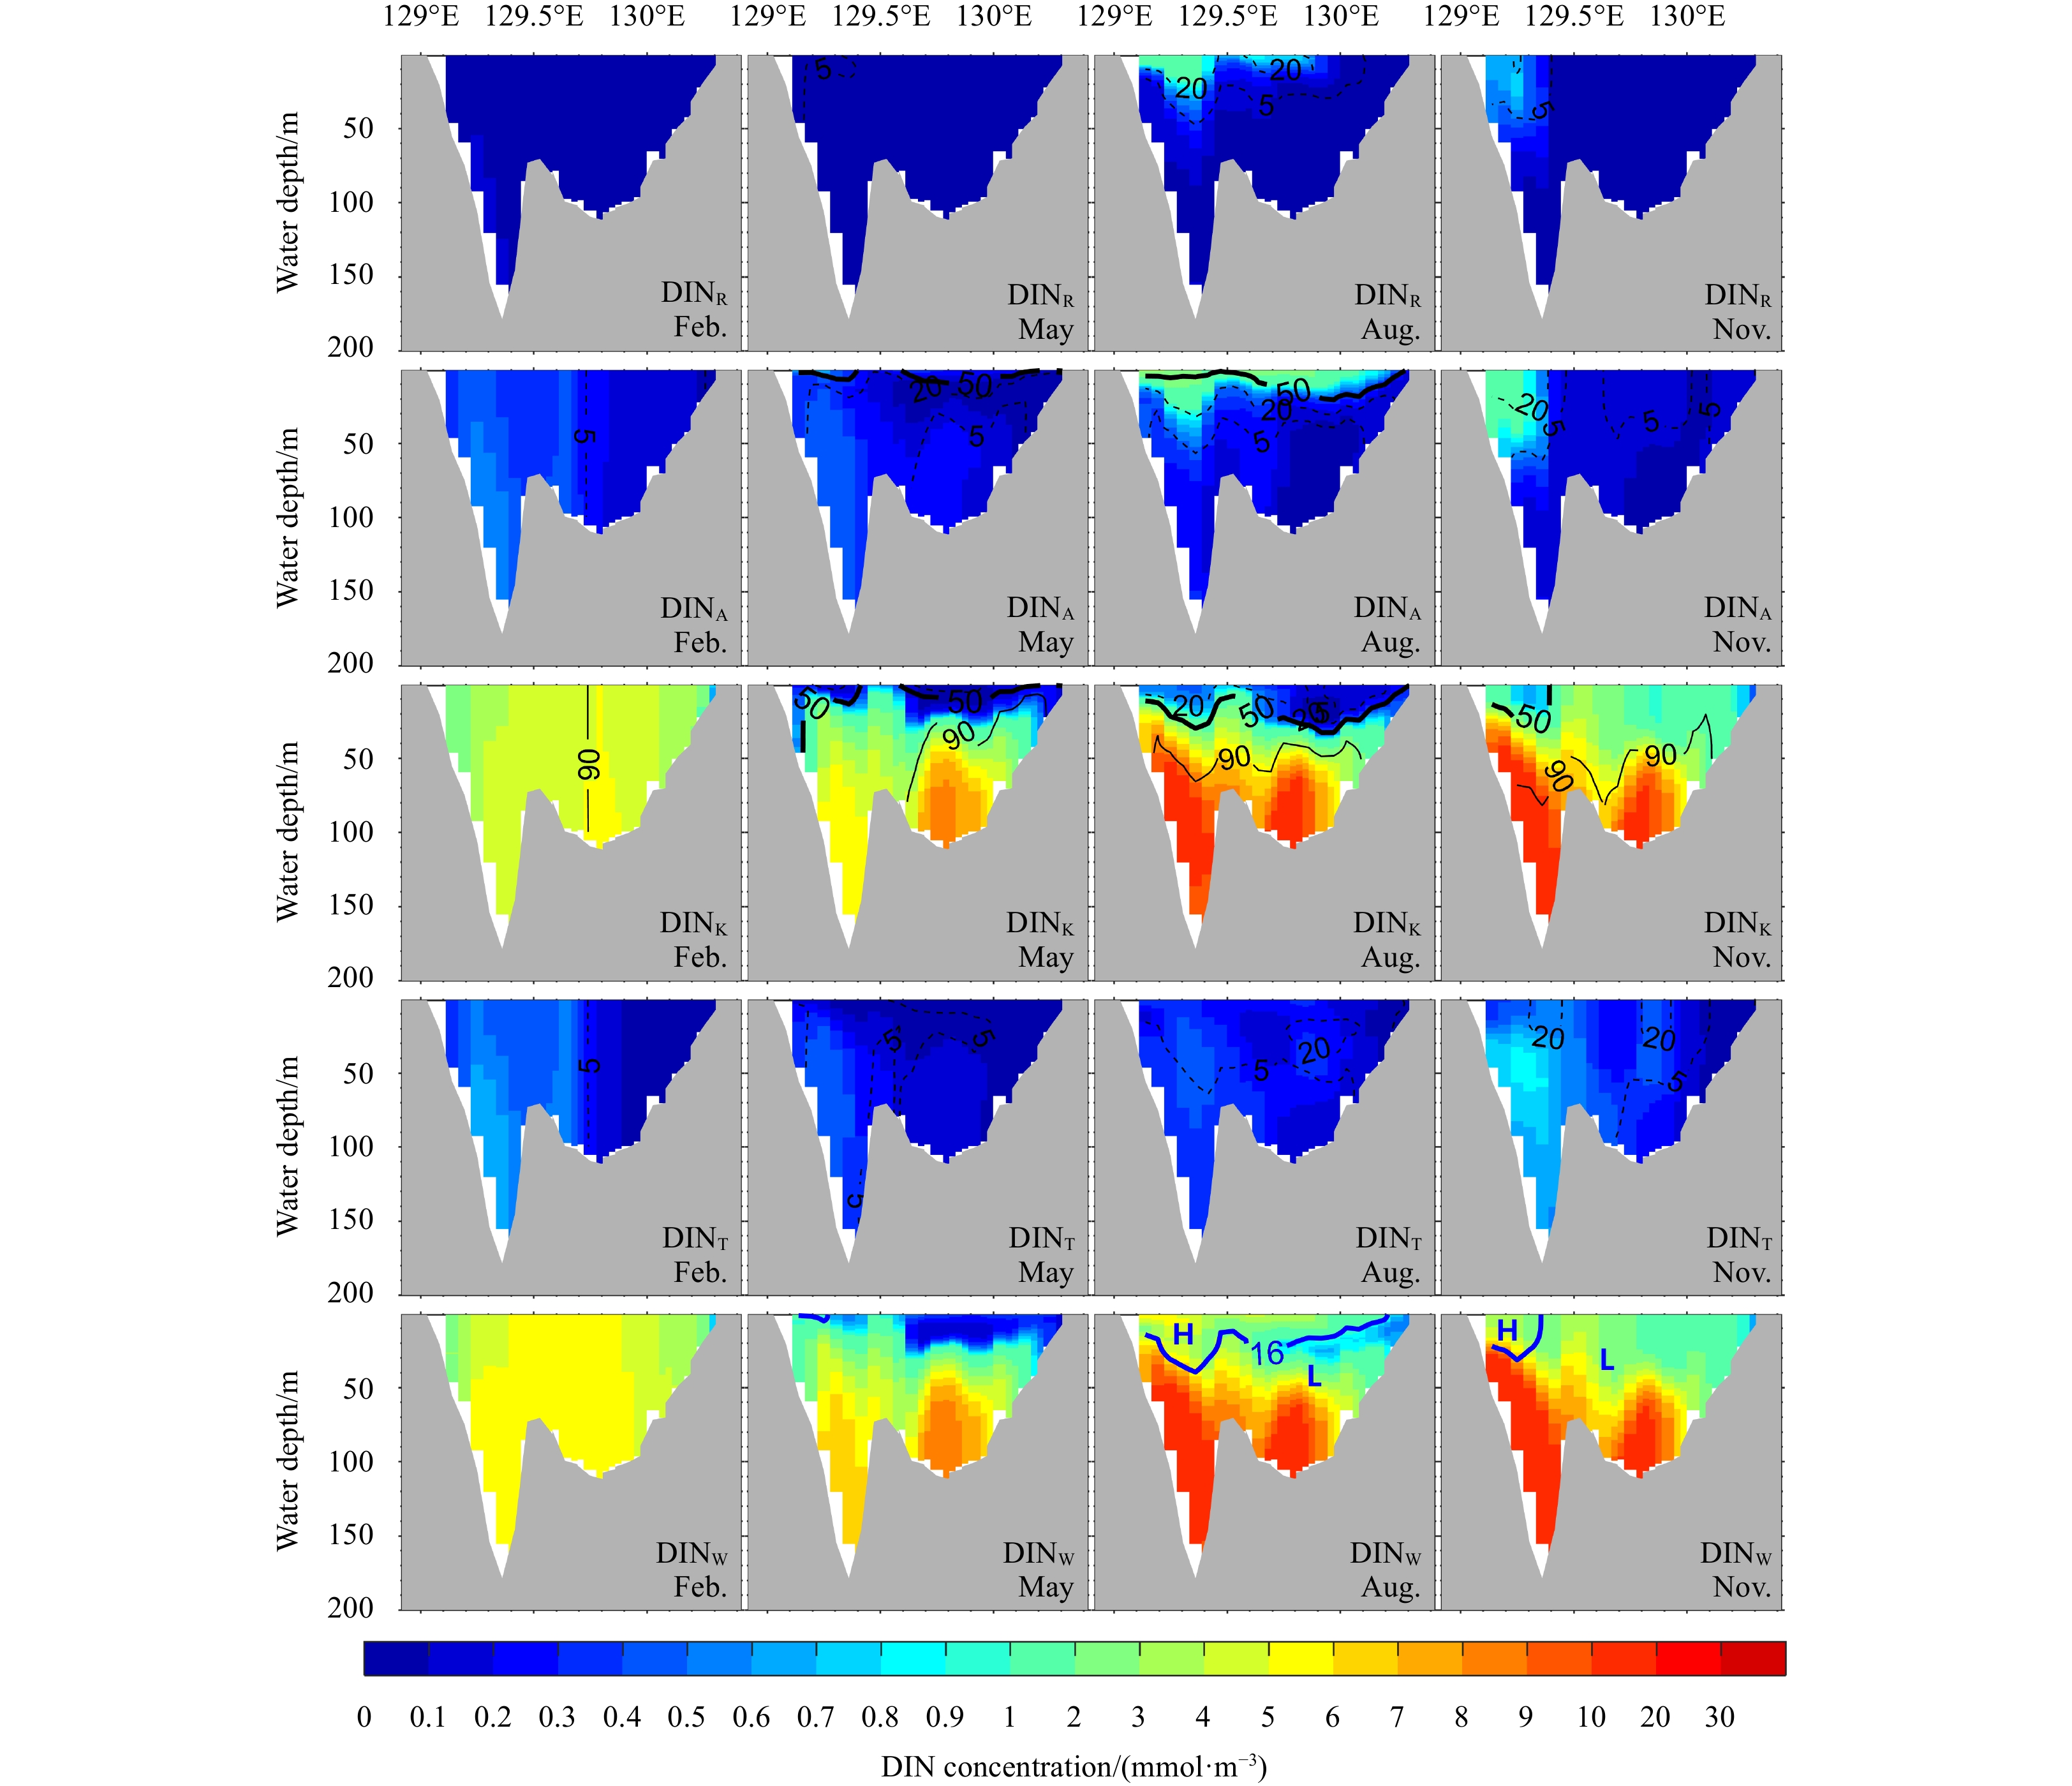
Figure 3. Vertical distributions of DIN (mmol/m3) in the TS from rivers (DINR), the atmosphere (DINA), the Kuroshio (DINK), the Taiwan Strait (DINT), and the sum of the four sources (DINW) in four seasons. The proportion of DIN from a single source to DINW is shown by the black contour lines in the first four rows. The black dash lines indicate 5% and 20%. The thin black line represents 90%. The thick black line represents 50%, which suggests the dominant role of the DIN source. The blue contours in the last row denote an N/P ratio of 16. The letters “H” and “L” represent N/P ratios higher than 16 and lower than 16, respectively.
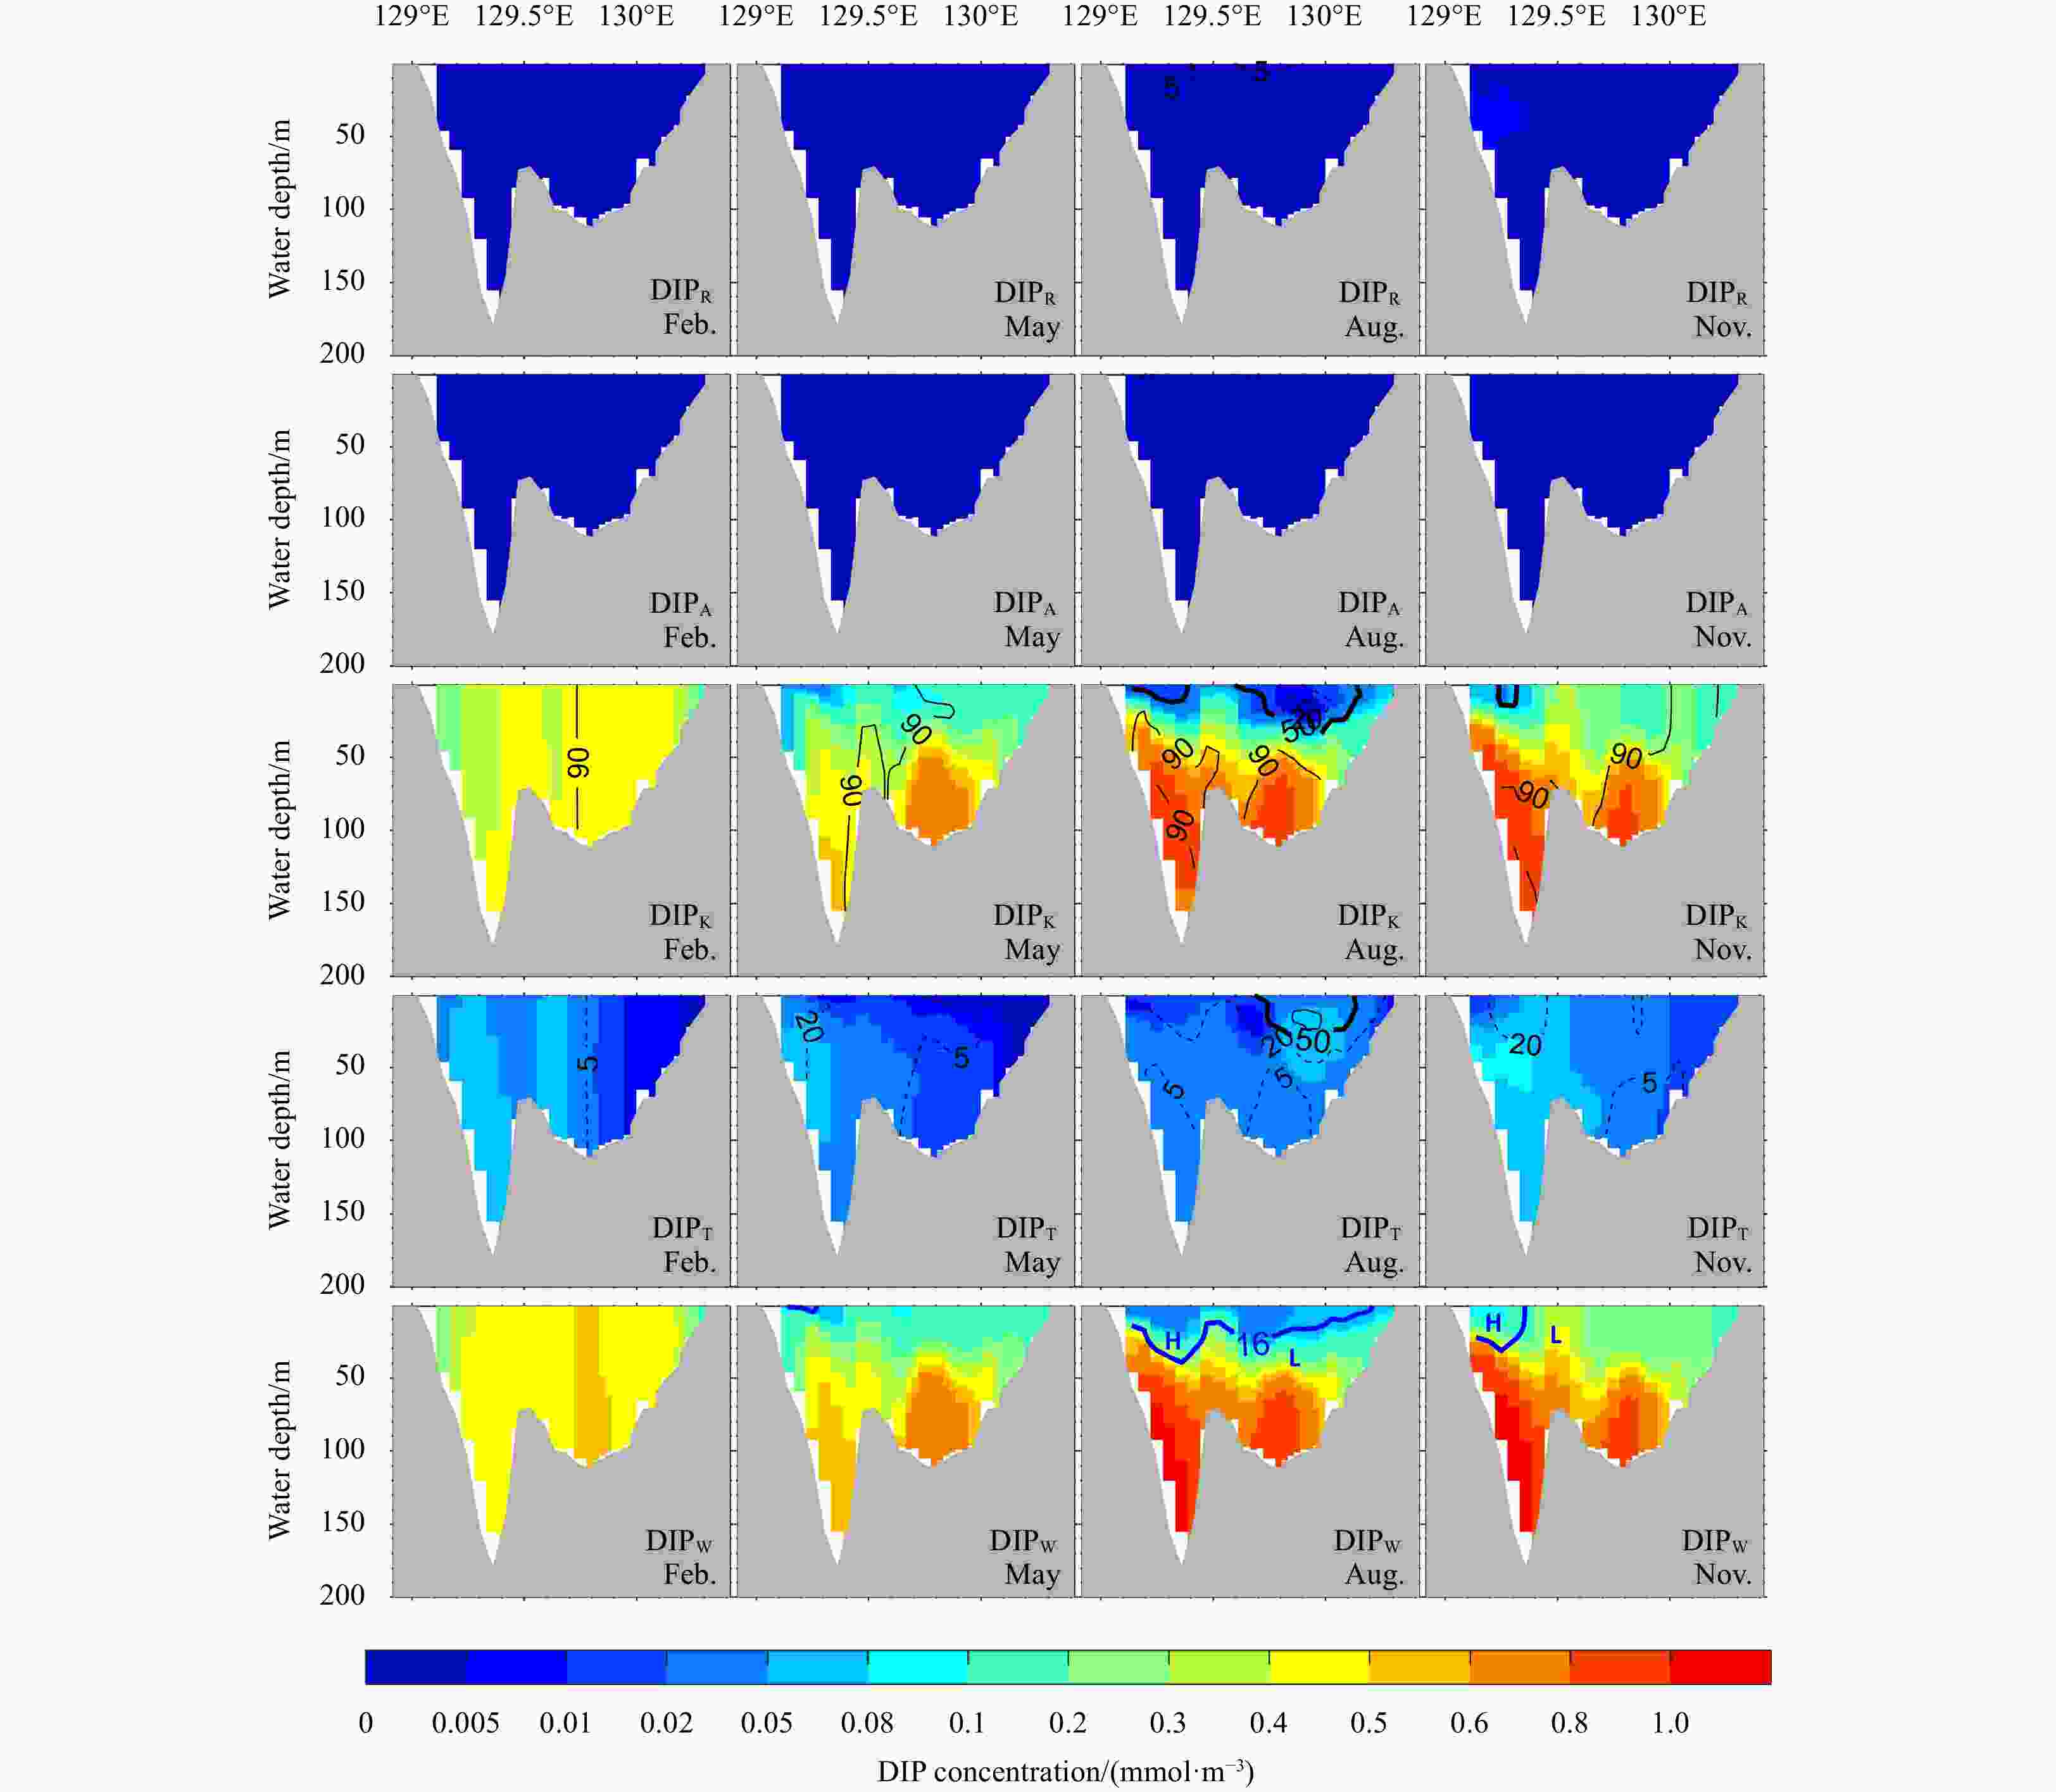
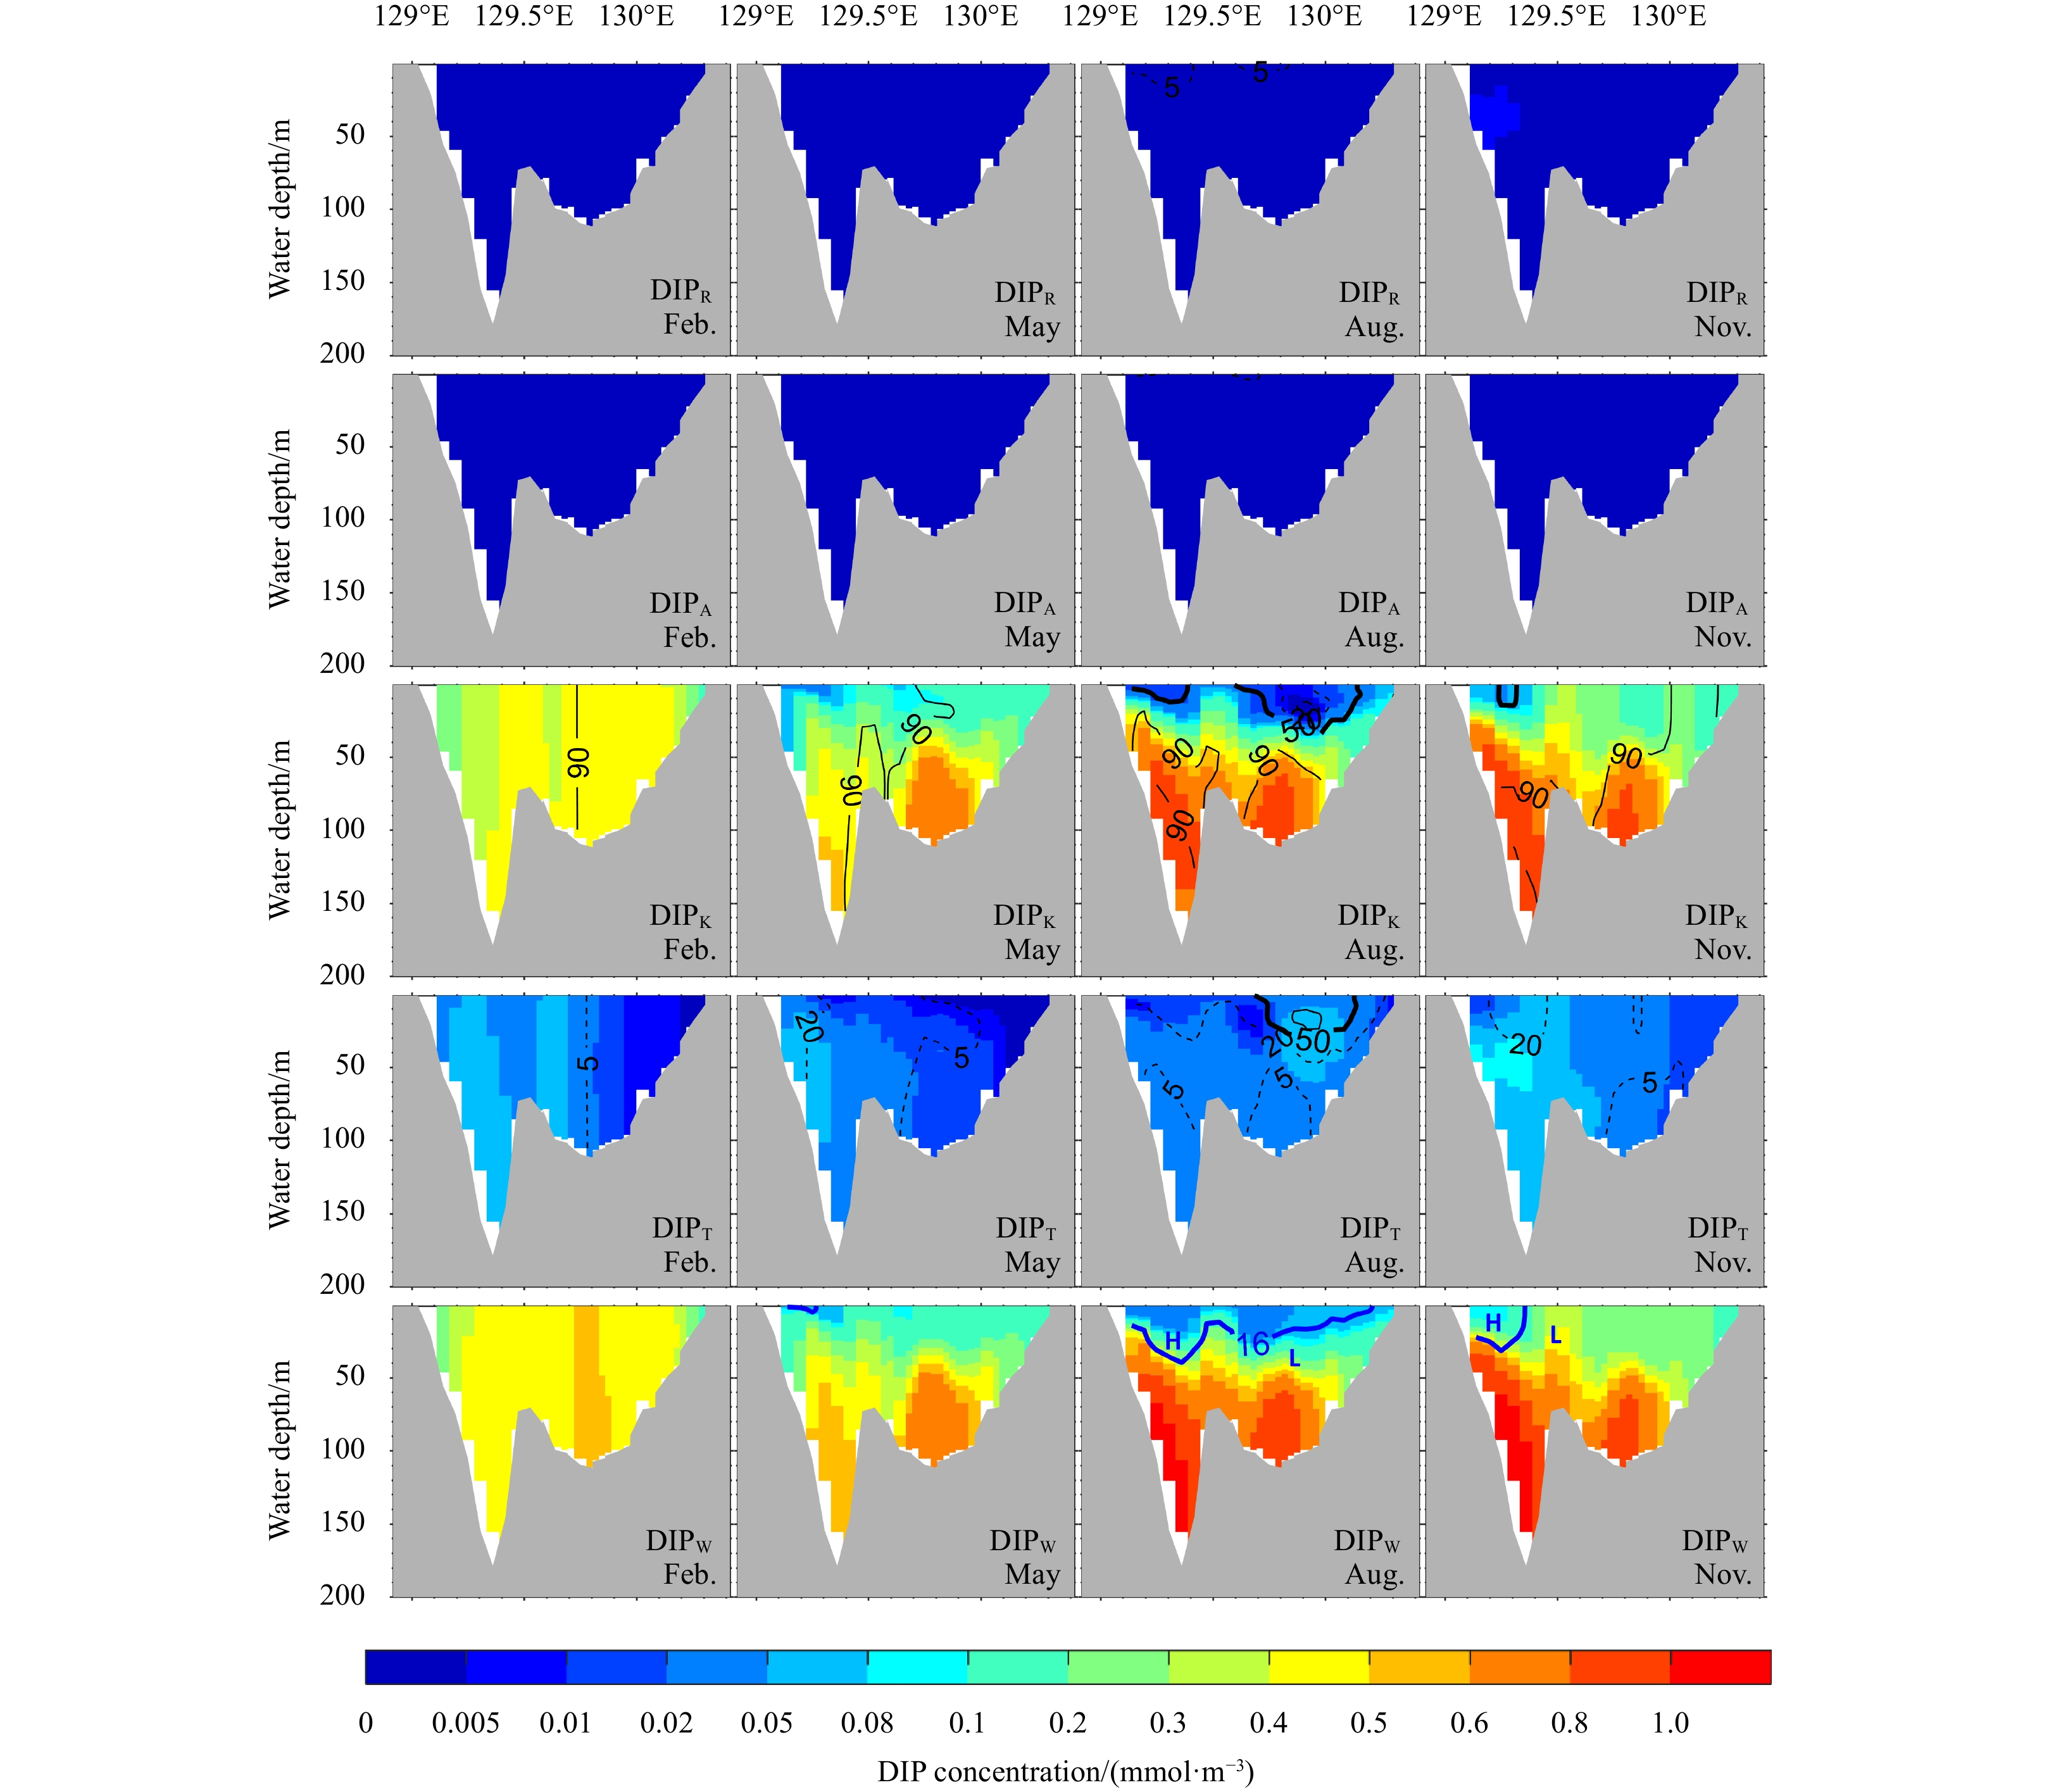
Figure 4. Vertical distributions of DIP (mmol/m3) in the TS from rivers (DIPR), the atmosphere (DIPA), the Kuroshio (DIPK), the Taiwan Strait (DIPT), and the sum of the four sources (DIPW) in four seasons. The proportion of DIP from a single source to DIPW is shown by the black contour lines in the first four rows. The black dash lines with 5 and 20 indicate 5% and 20%. The thin black line with 90 represents 90%. The thick black line with 50 represents 50%, which suggests the dominant role of the DIP source. The blue contours in the last row denote an N/P ratio of 16. The letters “H” and “L” represent N/P ratios higher than 16 and lower than 16, respectively.
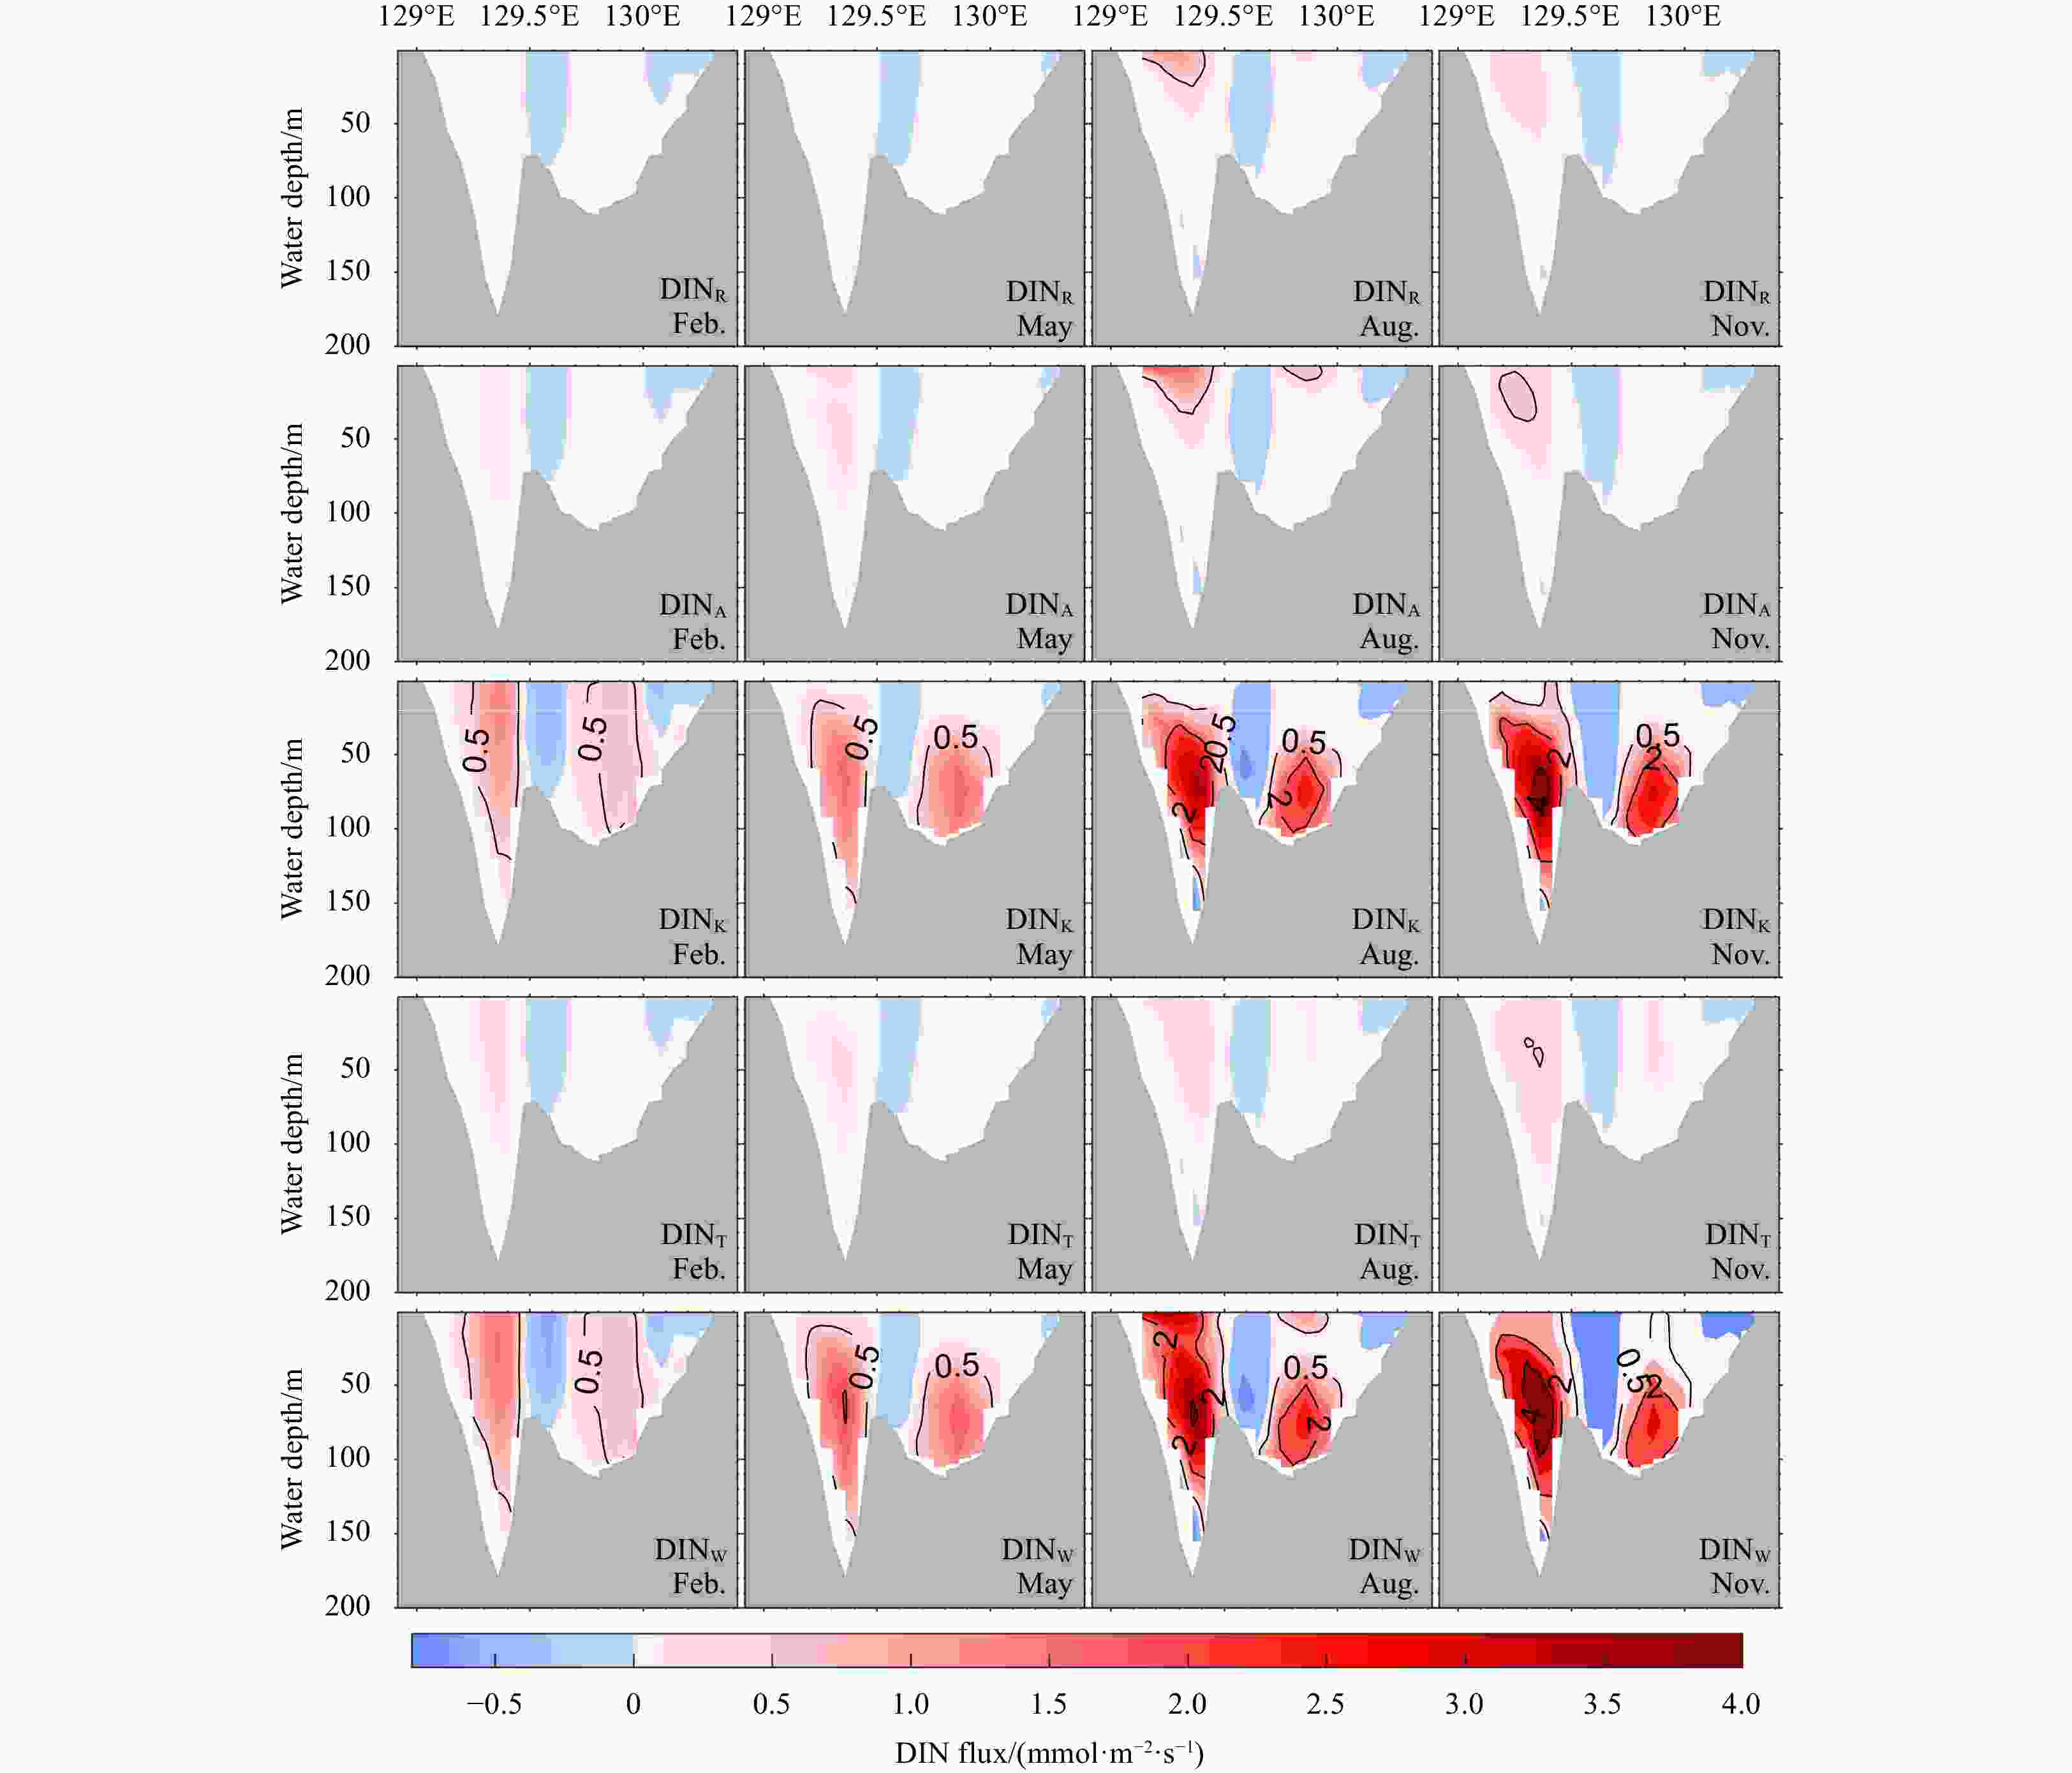
Figure 5. Vertical distributions of DIN fluxes (mmol/(m2·s)) at the TS from rivers (DINR), the atmosphere (DINA), the Kuroshio (DINK), the Taiwan Strait (DINT) and the sum of the four sources (DINW) in four seasons.
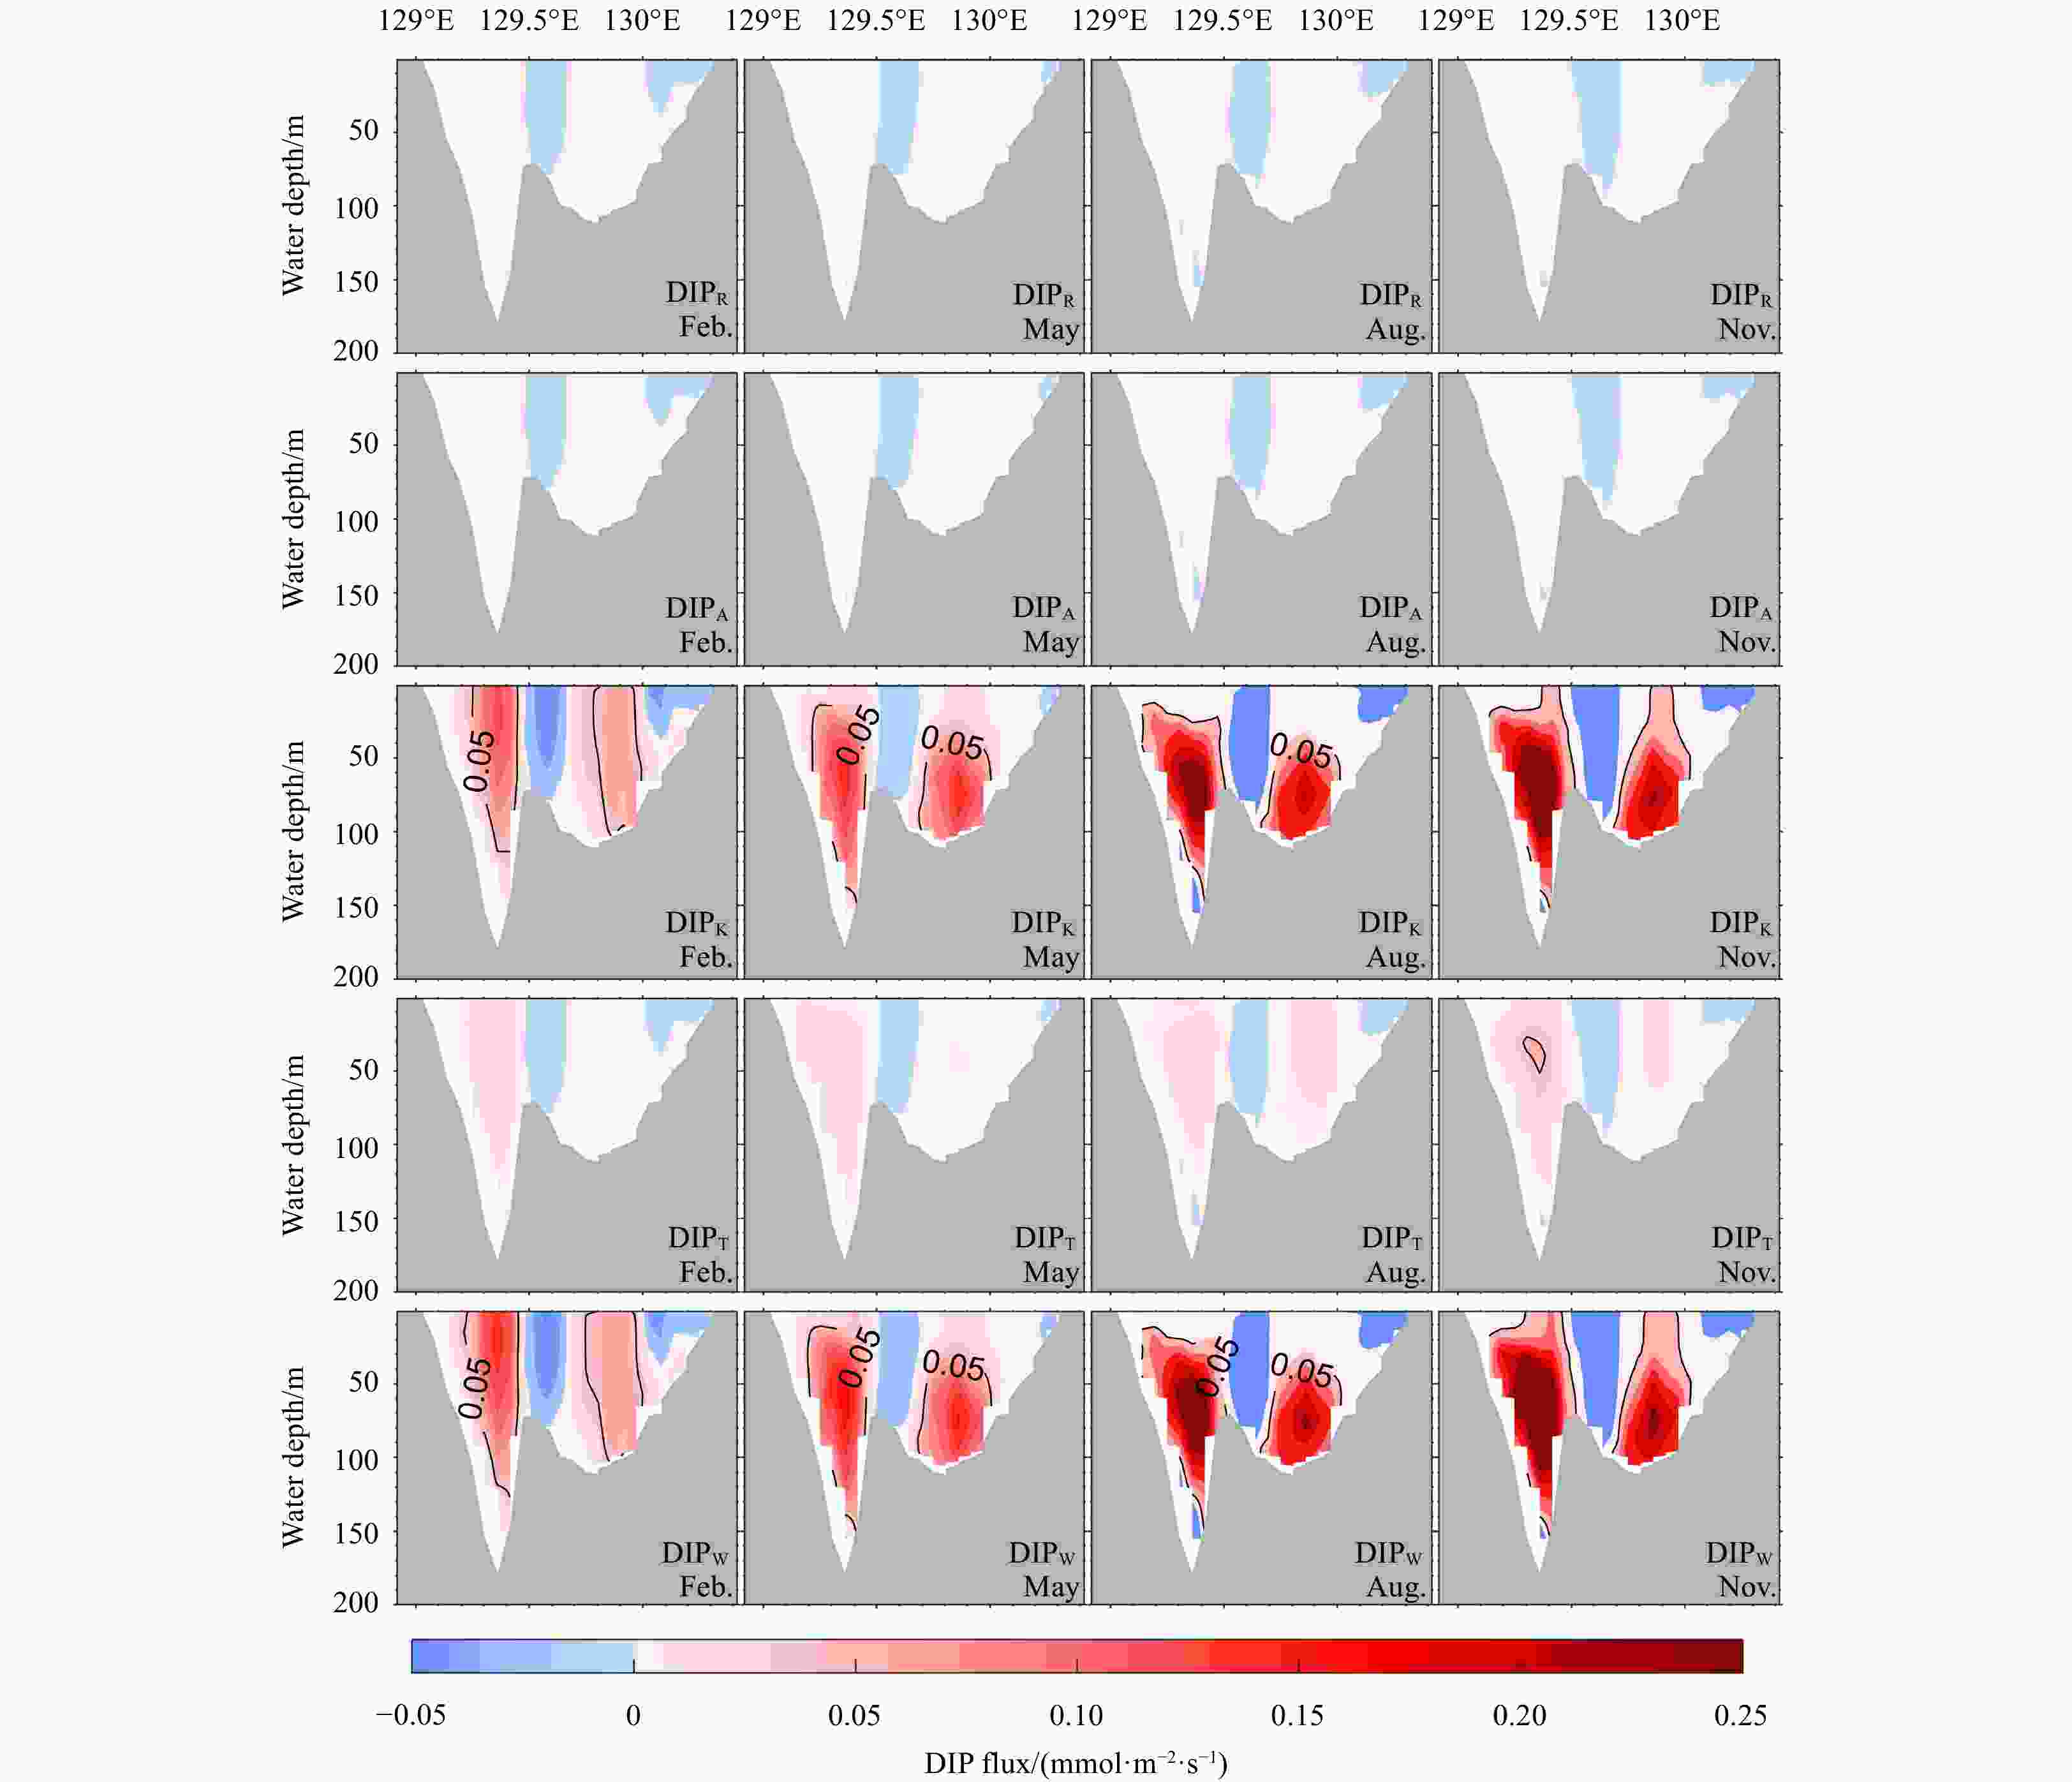
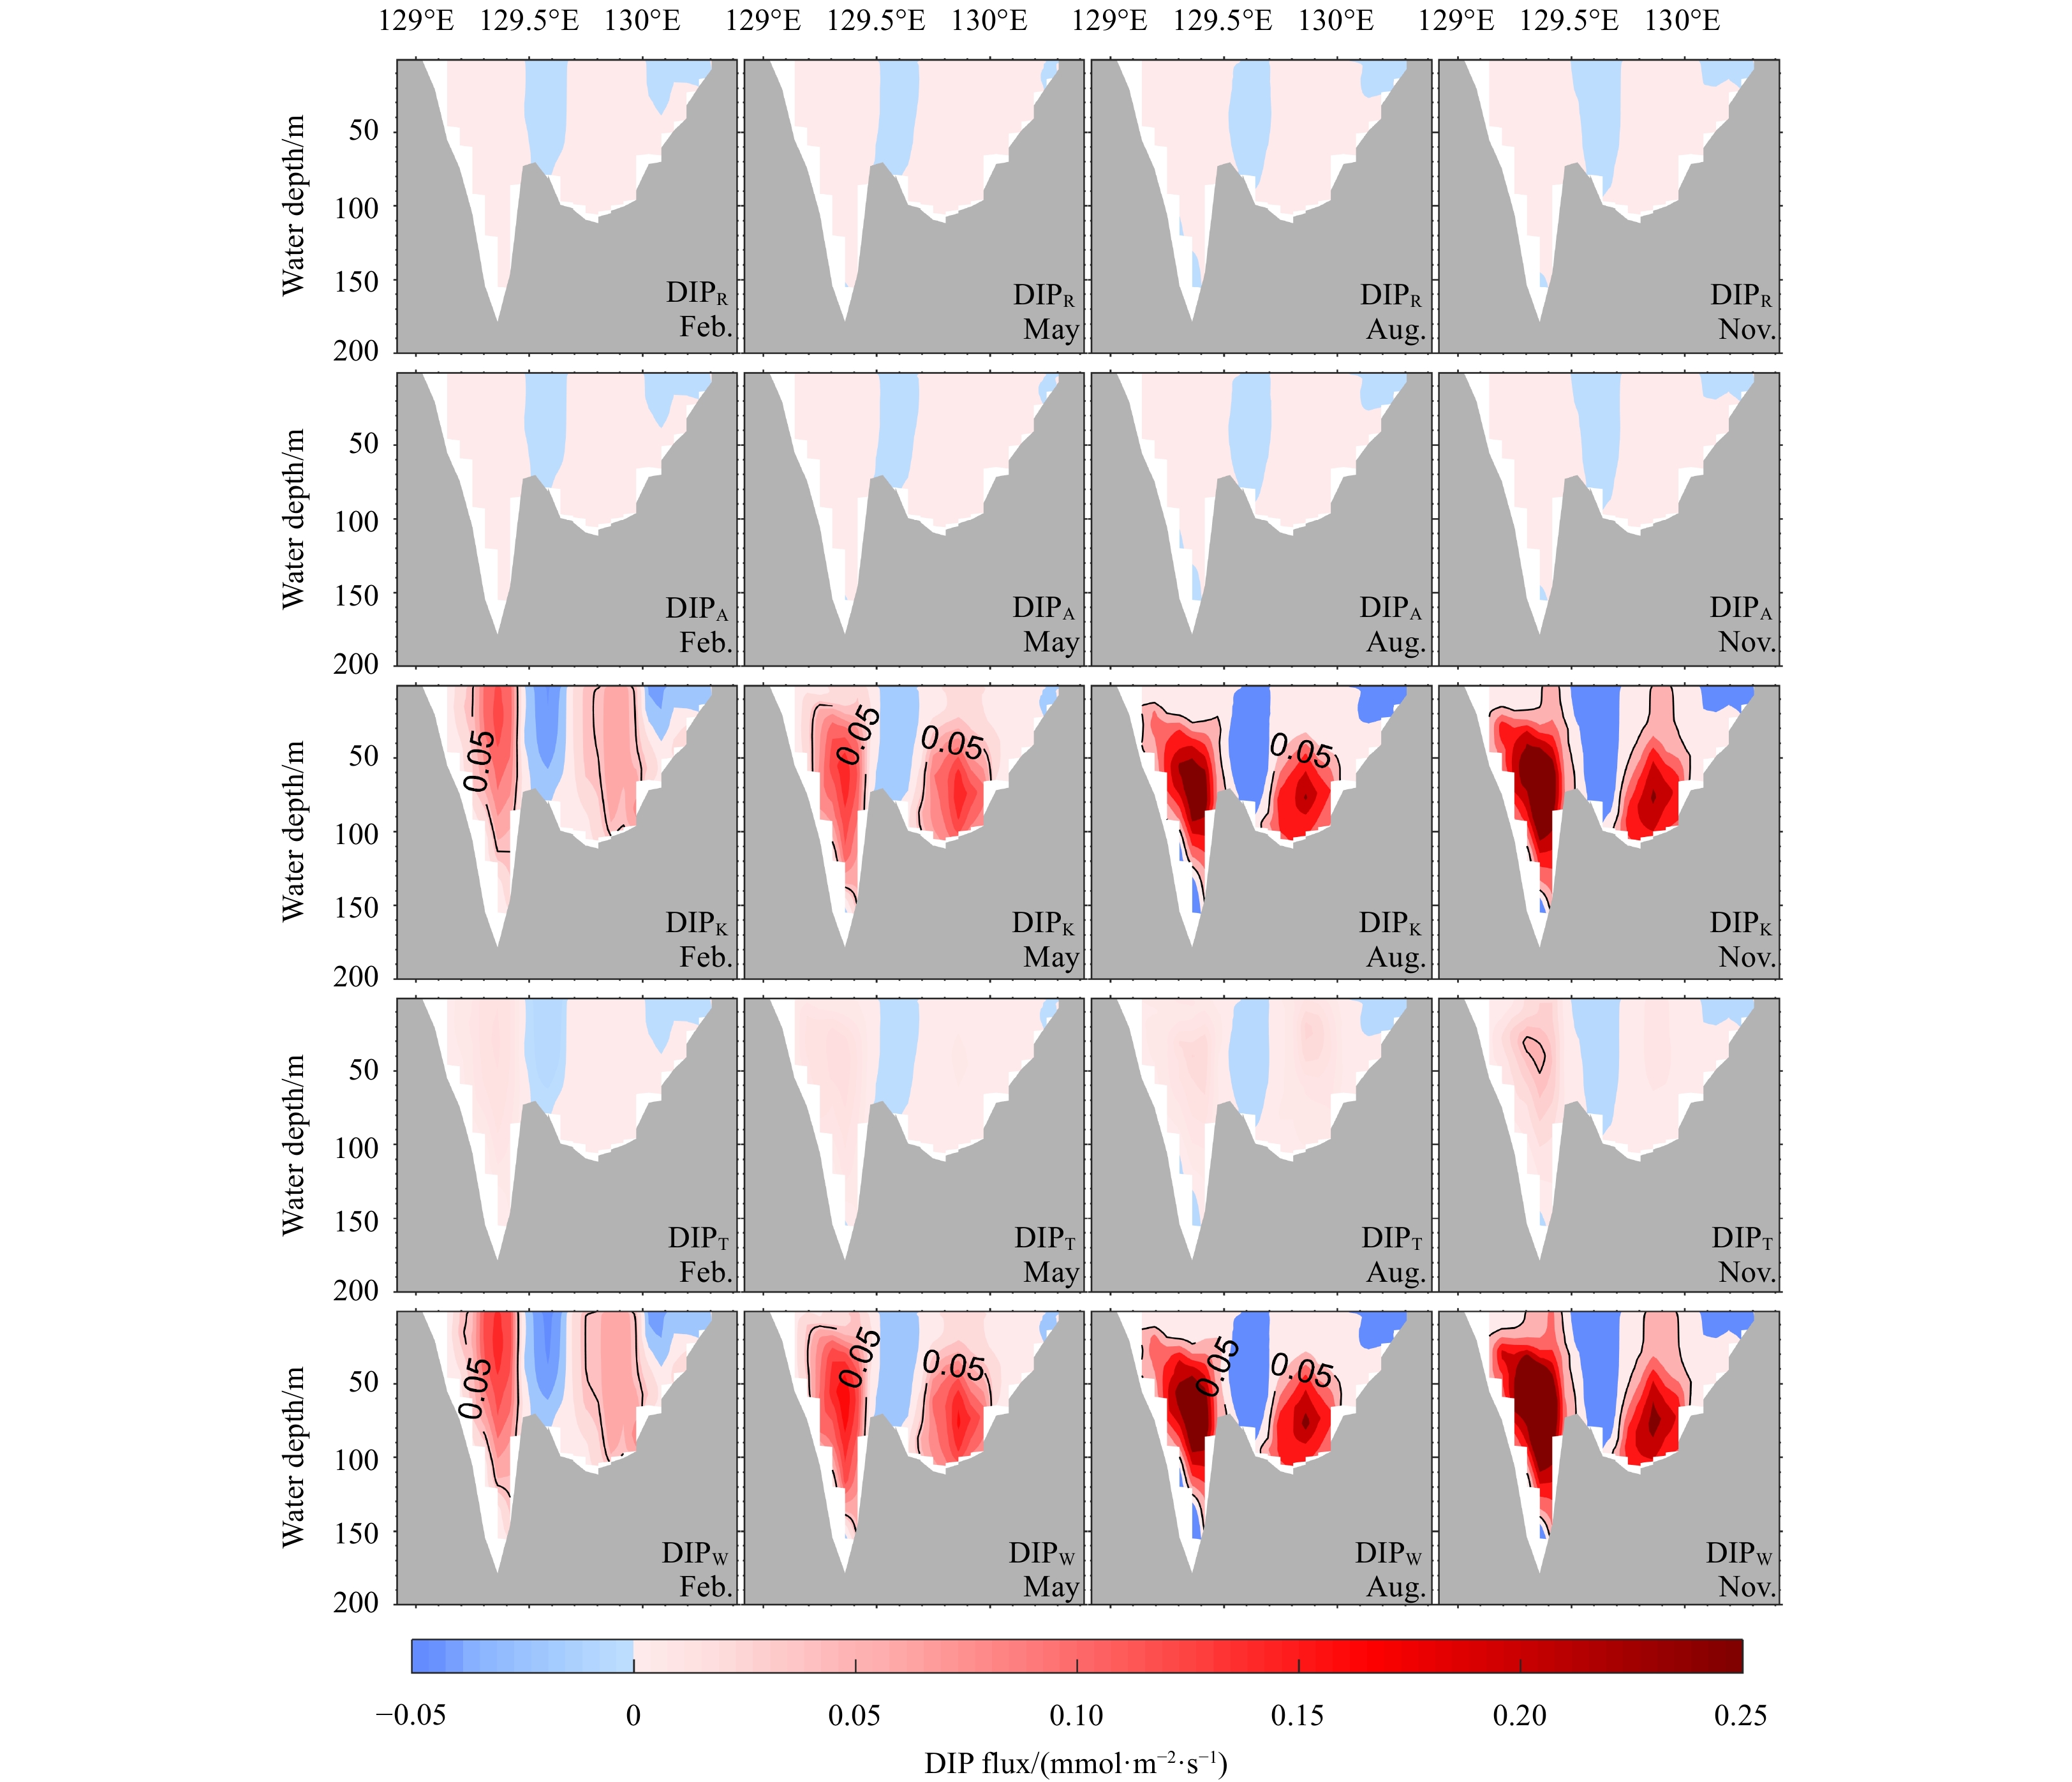
Figure 6. Vertical distributions of DIP fluxes [mmol/(m2·s)] at the TS from rivers (DIPR), the atmosphere (DIPA), the Kuroshio (DIPK), the Taiwan Strait (DIPT) and the sum of the four sources (DINW) in four seasons.
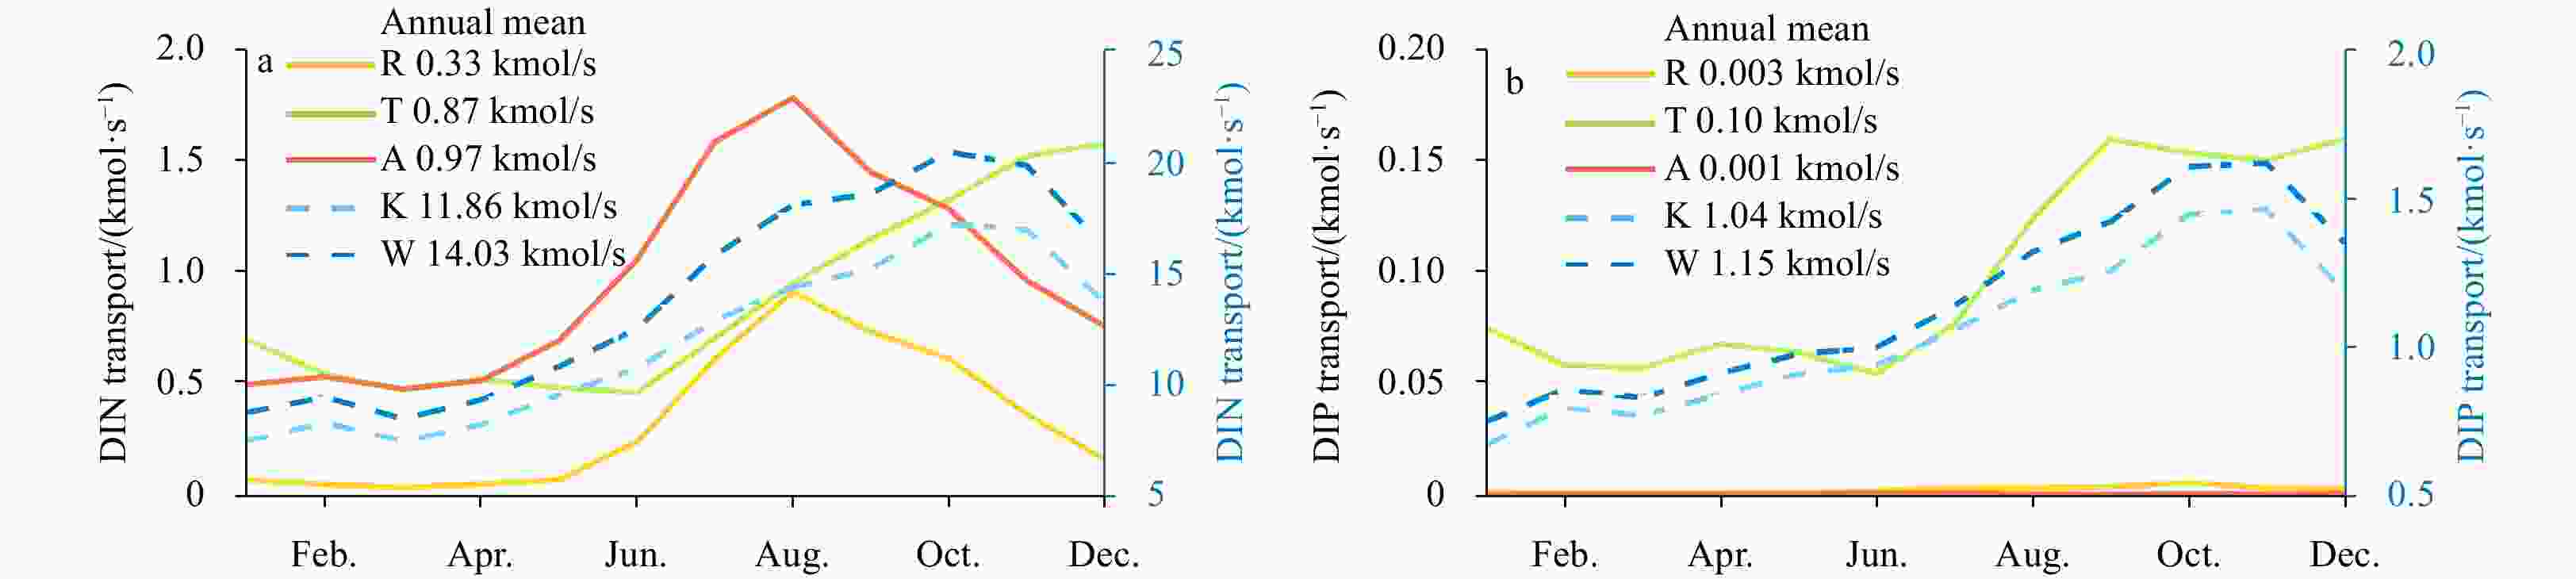
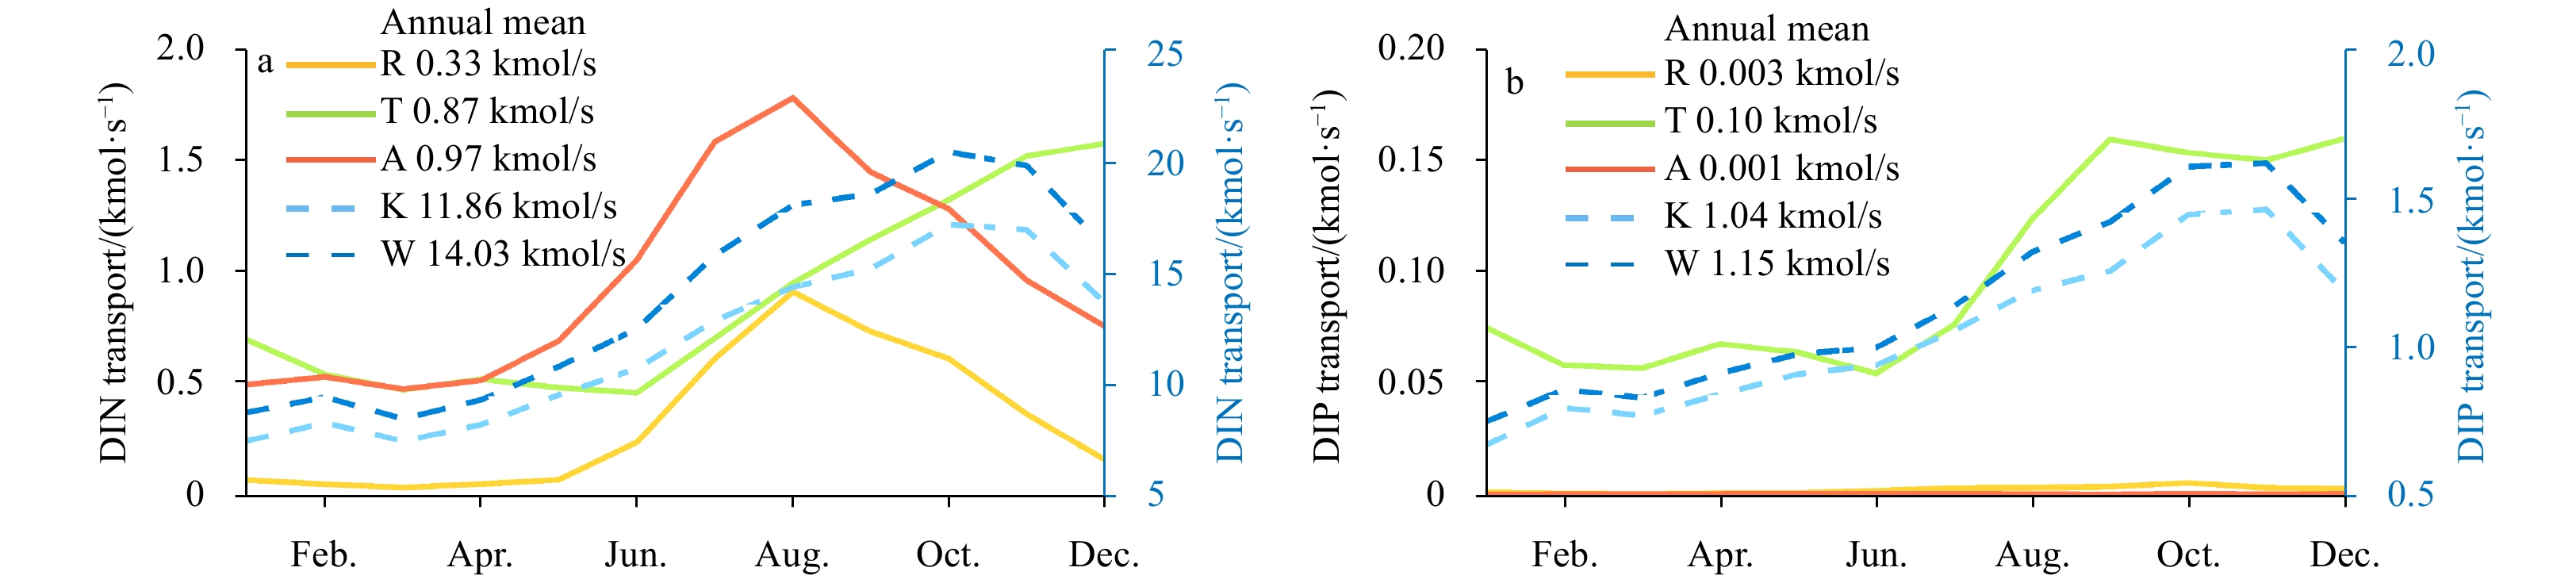
Figure 7. DIN (a) and DIP (b) transport across the TS. R, A, T, K, and W represent nutrients from the river, atmospheric deposition, the Taiwan Strait, the Kuroshio, and total nutrients, respectively. The annual mean of each transport is shown behind these letters in the legend. The transports of nutrients from the Kuroshio and the total are indicated by the dashed line and correspond to the right y-axis.
-
Bi Rong, Chen Xi, Zhang Jing, et al. 2018. Water mass control on phytoplankton spatiotemporal variations in the northeastern East China Sea and the western Tsushima Strait revealed by lipid biomarkers. Journal of Geophysical Research: Biogeosciences, 123(4): 1318–1332, doi: 10.1002/2017JG004340 Chang PH, Isobe A. 2003. A numerical study on the Changjiang diluted water in the Yellow and East China Seas. Journal of Geophysical Research: Oceans, 108(C9): 3299 Chen Changsheng, Beardsley R C, Limeburner R, et al. 1994. Comparison of winter and summer hydrographic observations in the Yellow and East China Seas and adjacent Kuroshio during 1986. Continental Shelf Research, 14(7-8): 909–929, doi: 10.1016/0278-4343(94)90079-5 Cho Y K, Seo G H, Choi B J, et al. 2009. Connectivity among straits of the northwest Pacific marginal seas. Journal of Geophysical Research: Oceans, 114(C6): C06018 Chung C S, Hong G H, Kim S H, et al. 1998. Shore based observation on wet deposition of inorganic nutrients in the Korean Yellow Sea coast. The Yellow Sea, 4: 30–39 Große F, Fennel K, Zhang Haiyan, et al. 2020. Quantifying the contributions of riverine vs. oceanic nitrogen to hypoxia in the East China Sea. Biogeosciences, 17(10): 2701–2714, doi: 10.5194/bg-17-2701-2020 Guo Xinyu, Miyazawa Y, Yamagata T. 2006. The Kuroshio onshore intrusion along the shelf break of the East China Sea: the origin of the Tsushima Warm Current. Journal of Physical Oceanography, 36(12): 2205–2231, doi: 10.1175/JPO2976.1 Guo Xinyu, Zhu Xiaohua, Wu Qingsong, et al. 2012. The Kuroshio nutrient stream and its temporal variation in the East China Sea. Journal Geophysical Research: Ocean, 117(C1): C01026 Ichikawa H, Beardsley R C. 2002. The current system in the Yellow and East China Seas. Journal of Oceanography, 58(1): 77–92, doi: 10.1023/A:1015876701363 Isobe A. 1999. On the origin of the Tsushima Warm Current and its seasonality. Continental Shelf Research, 19(1): 117–133, doi: 10.1016/S0278-4343(98)00065-X Isobe A, Ando M, Watanabe T, et al. 2002. Freshwater and temperature transports through the Tsushima-Korea Straits. Journal of Geophysical Research: Oceans, 107(C7): 2-1–2-20 Jin Haoyu, Zhang Chao, Meng Siyu, et al. 2024. Atmospheric deposition and river runoff stimulate the utilization of dissolved organic phosphorus in coastal seas. Nature Communications, 15(1): 658, doi: 10.1038/s41467-024-44838-7 Kim S K, Chang K I, Kim B, et al. 2013. Contribution of ocean current to the increase in N abundance in the Northwestern Pacific marginal seas. Geophysical Research Letters, 40(1): 143–148, doi: 10.1029/2012GL054545 Kim T W, Lee K, Najjar R G, et al. 2011. Increasing N abundance in the northwestern Pacific Ocean due to atmospheric nitrogen deposition. Science, 334(6055): 505–509, doi: 10.1126/science.1206583 Kim H C, Yamaguchi H, Yoo S, et al. 2009. Distribution of Changjiang Diluted Water detected by satellite chlorophyll-a and its interannual variation during 1998–2007. Journal of Oceanography, 65(1): 129–135, doi: 10.1007/s10872-009-0013-0 Kodama T, Morimoto A, Takikawa T, et al. 2017. Presence of high nitrate to phosphate ratio subsurface water in the Tsushima Strait during summer. Journal of Oceanography, 73(6): 759–769, doi: 10.1007/s10872-017-0430-4 Kodama T, Setou T, Masujima M, et al. 2015. Intrusions of excess nitrate in the Kuroshio subsurface layer. Continental Shelf Research, 110: 191–200, doi: 10.1016/j.csr.2015.10.012 Kwak J H, Lee S H, Hwang J, et al. 2014. Summer primary productivity and phytoplankton community composition driven by different hydrographic structures in the East/Japan Sea and the Western Subarctic Pacific. Journal of Geophysical Research: Oceans, 119(7): 4505–4519, doi: 10.1002/2014JC009874 Lee J Y, Kang D J, Kim I N, et al. 2009. Spatial and temporal variability in the pelagic ecosystem of the East Sea (Sea of Japan): A review. Journal of Marine Systems, 78(2): 288–300, doi: 10.1016/j.jmarsys.2009.02.013 Lie H J, Cho C H. 2016. Seasonal circulation patterns of the Yellow and East China Seas derived from satellite-tracked drifter trajectories and hydrographic observations. Progress in Oceanography, 146: 121–141, doi: 10.1016/j.pocean.2016.06.004 Liu Sumei, Hong G H, Zhang Jing, et al. 2009. Nutrient budgets for large Chinese estuaries. Biogeosciences, 6(10): 2245–2263, doi: 10.5194/bg-6-2245-2009 Liu Sumei, Zhang Jing, Chen Hongtao. 2000. Chemical oceanography of bioactive elements in the Yellow Sea and the East China Sea. Marine Environmental Science (in Chinese), 19(1): 68–74 Ménesguen A, Cugier P, Leblond I. 2006. A new numerical technique for tracking chemical species in a multi-source, coastal ecosystem, applied to nitrogen causing ulva blooms in the Bay of Brest (France). Limnology and Oceanography, 51(1part2): 591–601, doi: 10.4319/lo.2006.51.1_part_2.0591 Morimoto A, Takikawa T, Onitsuka G, et al. 2009. Seasonal variation of horizontal material transport through the eastern channel of the Tsushima Straits. Journal of Oceanography, 65(1): 61–71, doi: 10.1007/s10872-009-0006-z Onitsuka G, Yanagi T, Yoon J H. 2007. A numerical study on nutrient sources in the surface layer of the Japan Sea using a coupled physical-ecosystem model. Journal of Geophysical Research: Oceans, 112(C5): C05042 Shen Jiawei, Zhao Liang, Zhang Honghai, et al. 2021. Controlling factors of annual cycle of dimethylsulfide in the Yellow and East China seas. Marine Pollution Bulletin, 169: 112517, doi: 10.1016/j.marpolbul.2021.112517 Shibano R, Morimoto A, Takayama K, et al. 2019. Response of lower trophic ecosystem in the Japan Sea to horizontal nutrient flux change through the Tsushima Strait. Estuarine, Coastal and Shelf Science, 229: 106386 Shin H R, Lee J H, Kim C H, et al. 2022. Long-term variation in volume transport of the Tsushima warm current estimated from ADCP current measurement and sea level differences in the Korea/Tsushima Strait. Journal of Marine Systems, 232: 103750, doi: 10.1016/j.jmarsys.2022.103750 Skogen M D, Søiland H. 1998. A user’s guide to NORVECOM v2.0: The Norwegian ecological model system. Institute of Marine Research, 42, https://core.ac.uk/outputs/30846984/[1998-01-01/2022-05-23] Skogen M D, Svendsen E, Berntsen J, et al. 1995. Modelling the primary production in the North Sea using a coupled three-dimensional physical-chemical-biological ocean model. Estuarine, Coastal and Shelf Science, 41(5): 545–565 Takikawa T, Yoon J H, Cho K D. 2005. The Tsushima warm current through Tsushima Straits estimated from ferryboat ADCP data. Journal of Physical Oceanography, 35(6): 1154–1168, doi: 10.1175/JPO2742.1 Teague W J, Jacobs G A, Ko D S, et al. 2003. Connectivity of the Taiwan, Cheju, and Korea straits. Continental Shelf Research, 23(1): 63–77, doi: 10.1016/S0278-4343(02)00150-4 Umezawa Y, Yamaguchi A, Ishizaka J, et al. 2014. Seasonal shifts in the contributions of the Changjiang River and the Kuroshio current to nitrate dynamics in the continental shelf of the northern East China Sea based on a nitrate dual isotopic composition approach. Biogeosciences, 11(4): 1297–1317, doi: 10.5194/bg-11-1297-2014 Wang Yucheng, Guo Xinyu, Zhao Liang, et al. 2019. Seasonal variations in nutrients and biogenic particles in the upper and lower layers of East China Sea Shelf and their export to adjacent seas. Progress in Oceanography, 176: 102138, doi: 10.1016/j.pocean.2019.102138 Wu Wentao, Wang Junjie, Wang Hao, et al. 2023. Trends in nutrients in the Changjiang River. Science of the Total Environment, 872: 162268, doi: 10.1016/j.scitotenv.2023.162268 Yamada K, Ishizaka J, Nagata H. 2005. Spatial and temporal variability of satellite primary production in the Japan Sea from 1998 to 2002. Journal of Oceanography, 61(5): 857–869, doi: 10.1007/s10872-006-0005-2 Yanagi T. 2002. Water, salt, phosphorus and nitrogen budgets of the Japan Sea. Journal of Oceanography, 58(6): 797–804, doi: 10.1023/A:1022815027968 Zhang Jing. 1996. Nutrient elements in large Chinese estuaries. Continental Shelf Research, 16(8): 1023–1045, doi: 10.1016/0278-4343(95)00055-0 Zhang Jing, Guo Xinyu, Zhao Liang. 2019. Tracing external sources of nutrients in the East China Sea and evaluating their contributions to primary production. Progress in Oceanography, 176: 102122, doi: 10.1016/j.pocean.2019.102122 Zhang Jing, Guo Xinyu, Zhao Liang. 2021. Budget of riverine nitrogen over the East China Sea shelf. Environmental Pollution, 289: 117915, doi: 10.1016/j.envpol.2021.117915 Zhang Jing, Liu Minguang. 1994. Observations on nutrient elements and sulphate in atmospheric wet depositions over the northwest Pacific coastal oceans—Yellow Sea. Marine Chemistry, 47(2): 173–189, doi: 10.1016/0304-4203(94)90107-4 Zhang Jing, Liu Sumei, Ren Jingling, et al. 2007. Nutrient gradients from the eutrophic Changjiang (Yangtze River) Estuary to the oligotrophic Kuroshio waters and re-evaluation of budgets for the East China Sea Shelf. Progress in Oceanography, 74(4): 449–478, doi: 10.1016/j.pocean.2007.04.019 Zhang Renjian, Wang Mingxing, Sheng Lifang, et al. 2004. Seasonal characterization of dust days, mass concentration and dry deposition of atmospheric aerosols over Qingdao, China. China Particuology, 2(5): 196–199, doi: 10.1016/S1672-2515(07)60058-X Zhang Jing, Zhang Guosen, Bi Y F, et al. 2011. Nitrogen species in rainwater and aerosols of the Yellow and East China seas: Effects of the East Asian monsoon and anthropogenic emissions and relevance for the NW Pacific Ocean. Global Biogeochemical Cycles, 25(3): GB3020 Zhao Liang, Guo Xinyu. 2011. Influence of cross-shelf water transport on nutrients and phytoplankton in the East China Sea: A model study. Ocean Science, 7(1): 27–43, doi: 10.5194/os-7-27-2011 -

 下载:
下载:


 点击查看大图

计量
- 文章访问数: 72
- HTML全文浏览量: 28
- PDF下载量: 5
- 被引次数: 0

