

Spatiotemporal variation and freeze-thaw asymmetry of Arctic sea ice in multiple dimensions during 1979 to 2020
-
Abstract: Arctic sea ice is broadly regarded as an indicator and amplifier of global climate change. The rapid changes in Arctic sea ice have been widely concerned. However, the spatiotemporal changes in the horizontal and vertical dimensions of Arctic sea ice and its asymmetry during the melt and freeze seasons are rarely quantified simultaneously based on multiple sources of the same long time series. In this study, the spatiotemporal variation and freeze-thaw asymmetry of Arctic sea ice were investigated from both the horizontal and vertical dimensions during 1979–2020 based on remote sensing and assimilation data. The results indicated that Arctic sea ice was declining at a remarkably high rate of –5.4 × 10⁴ km2/a in sea ice area (SIA) and –2.2 cm/a in sea ice thickness (SIT) during 1979 to 2020, and the reduction of SIA and SIT was the largest in summer and the smallest in winter. Spatially, compared with other sub-regions, SIA showed a sharper declining trend in the Barents Sea, Kara Sea, and East Siberian Sea, while SIT presented a larger downward trend in the northern Canadian Archipelago, northern Greenland, and the East Siberian Sea. Regarding to the seasonal trend of sea ice on sub-region scale, the reduction rate of SIA exhibited an apparent spatial heterogeneity among seasons, especially in summer and winter, i.e., the sub-regions linked to the open ocean exhibited a higher decline rate in winter; however, the other sub-regions blocked by the coastlines presented a greater decline rate in summer. For SIT, the sub-regions such as the Beaufort Sea, East Siberian Sea, Chukchi Sea, Central Arctic, and Canadian Archipelago always showed a higher downward rate in all seasons. Furthermore, a striking freeze-thaw asymmetry of Arctic sea ice was also detected. Comparing sea ice changes in different dimensions, sea ice over most regions in the Arctic showed an early retreat and rapid advance in the horizontal dimension but late melting and gradual freezing in the vertical dimension. The amount of sea ice melting and freezing was disequilibrium in the Arctic during the considered period, and the rate of sea ice melting was 0.3 × 10⁴ km2/a and 0.01 cm/a higher than that of freezing in the horizontal and vertical dimensions, respectively. Moreover, there were notable shifts in the melting and freezing of Arctic sea ice in 1997/2003 and 2000/2004, respectively, in the horizontal/vertical dimension.
-
Key words:
- Arctic sea ice /
- sea ice area /
- sea ice thickness /
- spatiotemporal variation /
- freeze-thaw asymmetry
-
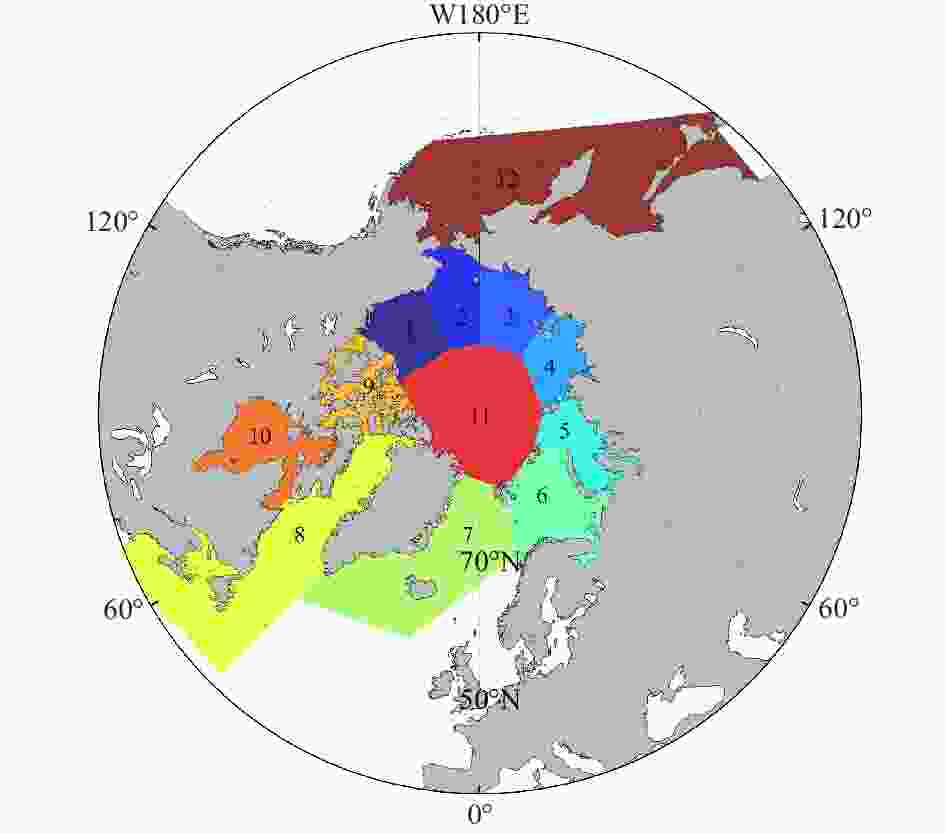
Figure 1. Location map of sub-regions in the Arctic. 1. Beaufort Sea, 2. Chukchi Sea, 3. East Siberian Sea, 4. Laptev Sea, 5. Kara Sea, 6. Barents Sea, 7. Greenland Sea, 8. Baffin Bay & Gulf of St. Lawrence Sea, 9. Canadian Archipelago, 10. Hudson Bay, 11. Central Arctic, and 12. Bering Sea & Sea of Okhotsk.
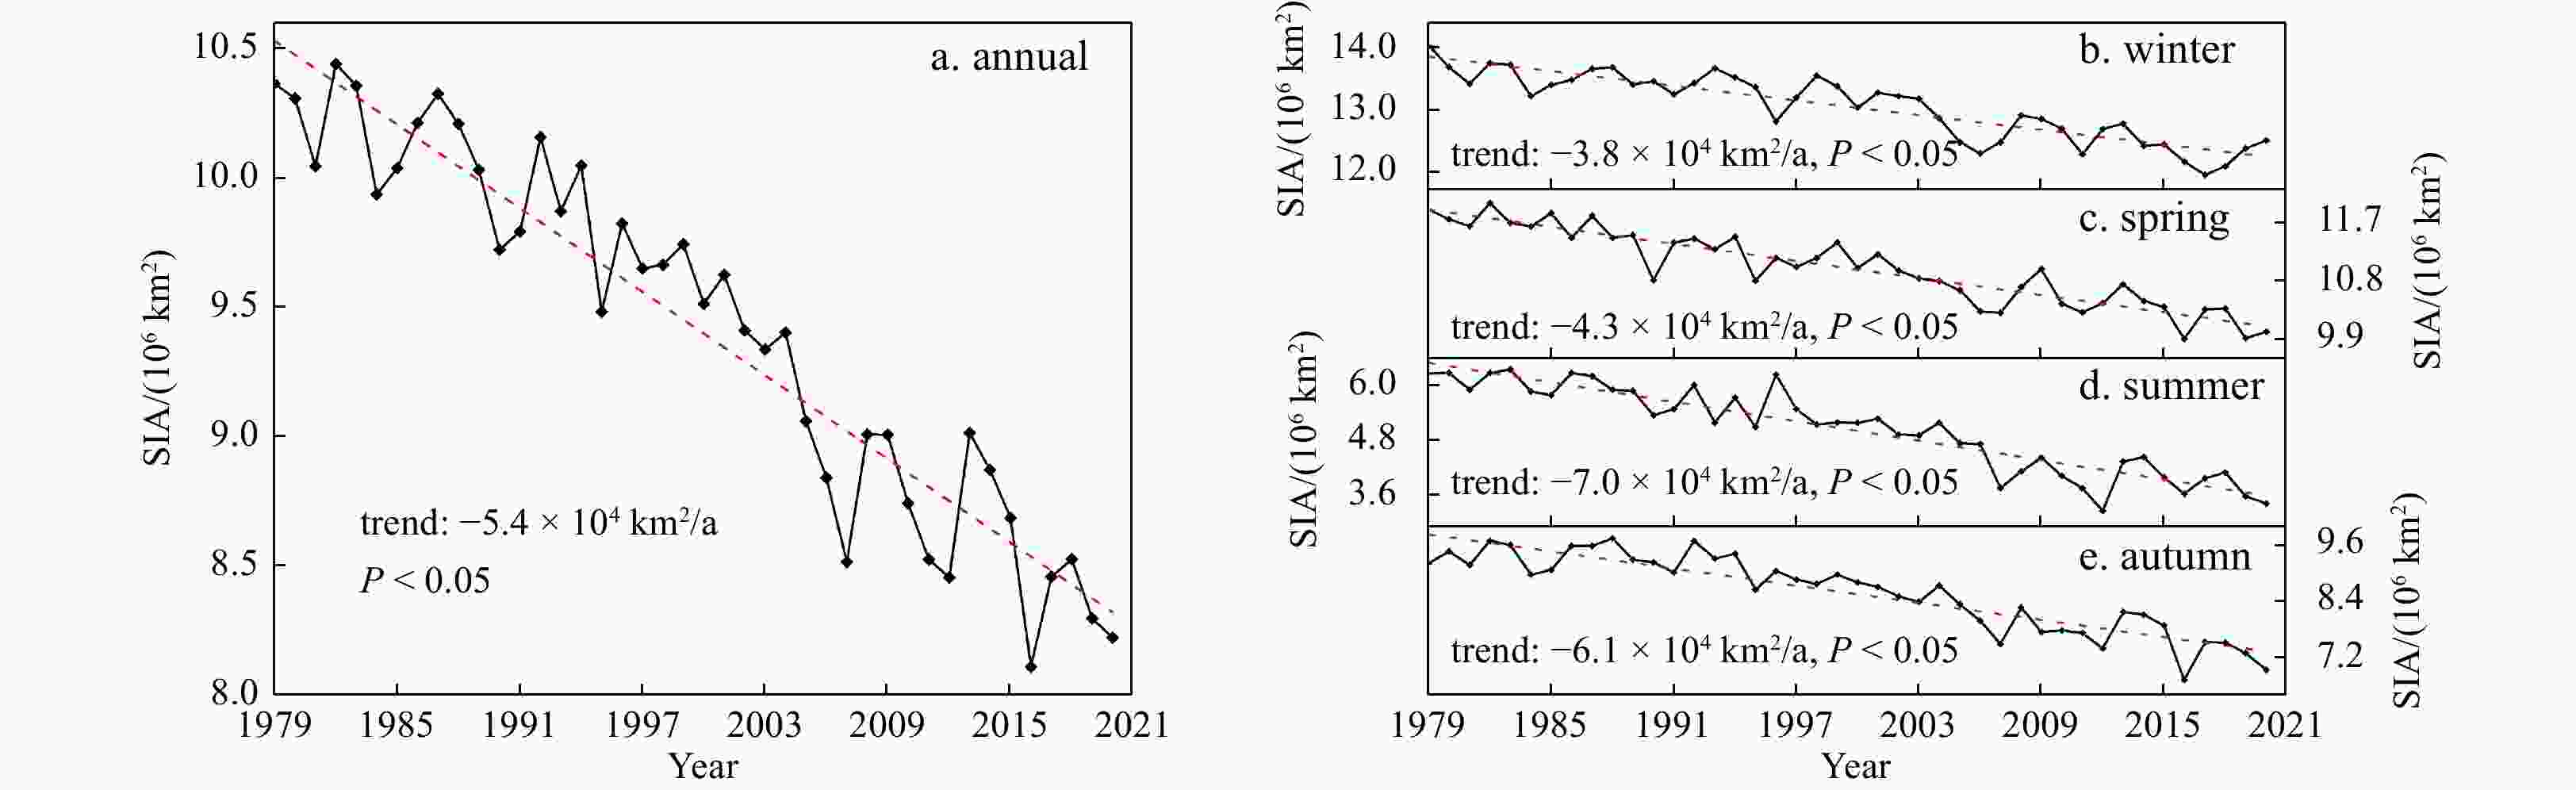
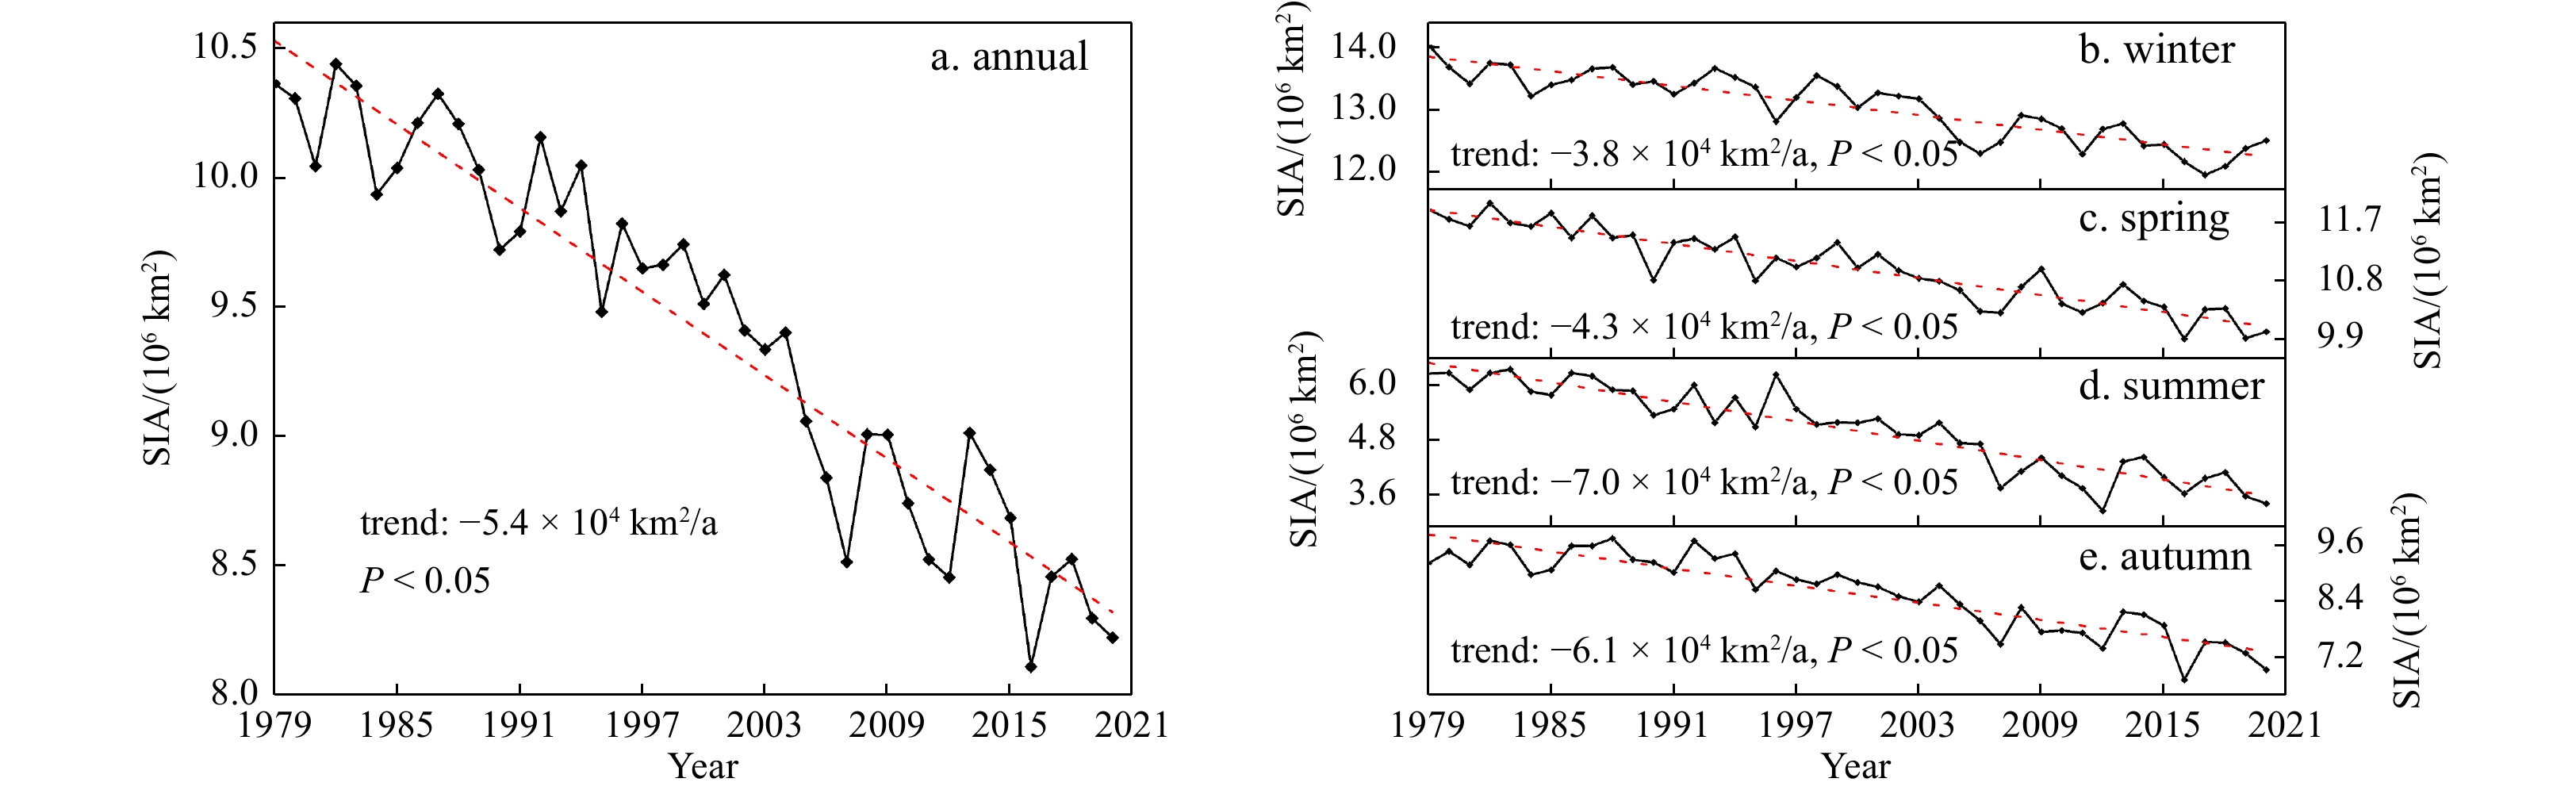
Figure 3. The annual (a) and seasonal (b–e) variations of sea ice area (SIA) during 1979 to 2020. The red dashed line represents the trend line.
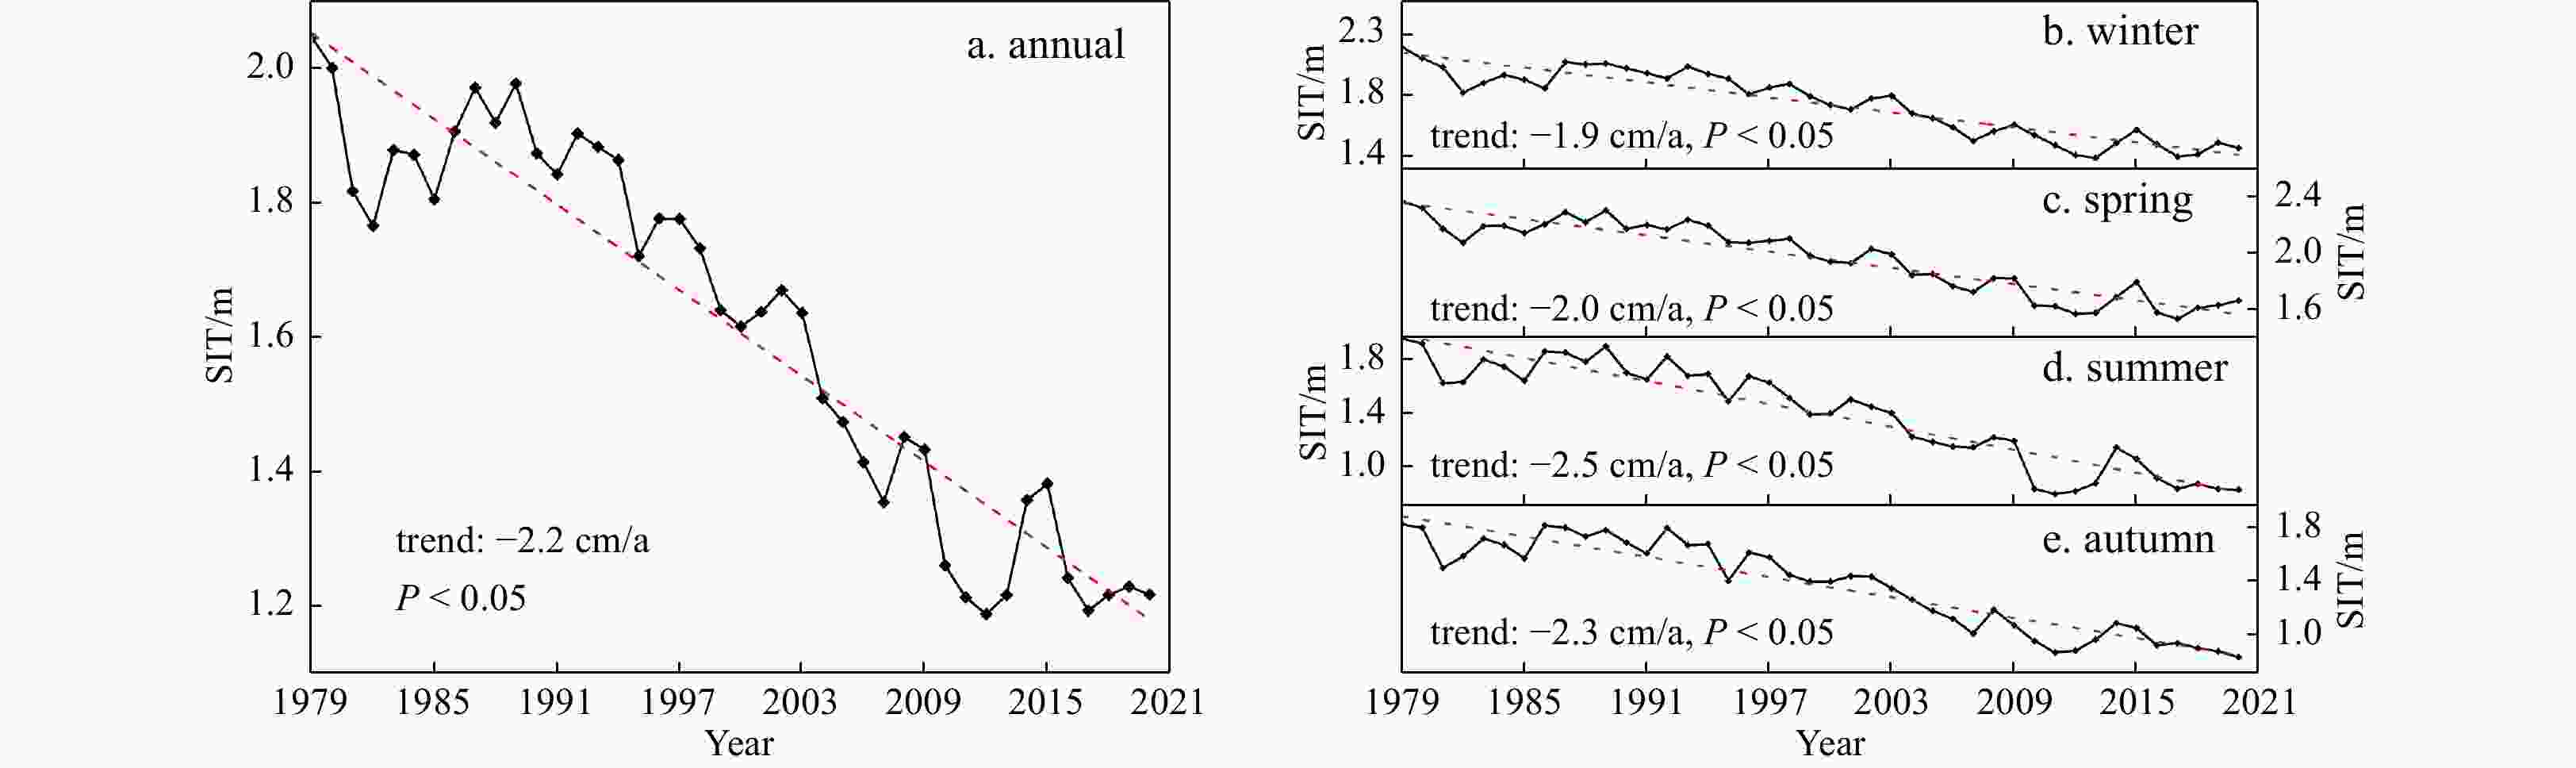
Figure 4. The annual (a) and seasonal (b−e) variations of sea ice thickness (SIT) during 1979 to 2020. The red dashed line represents the trend line.
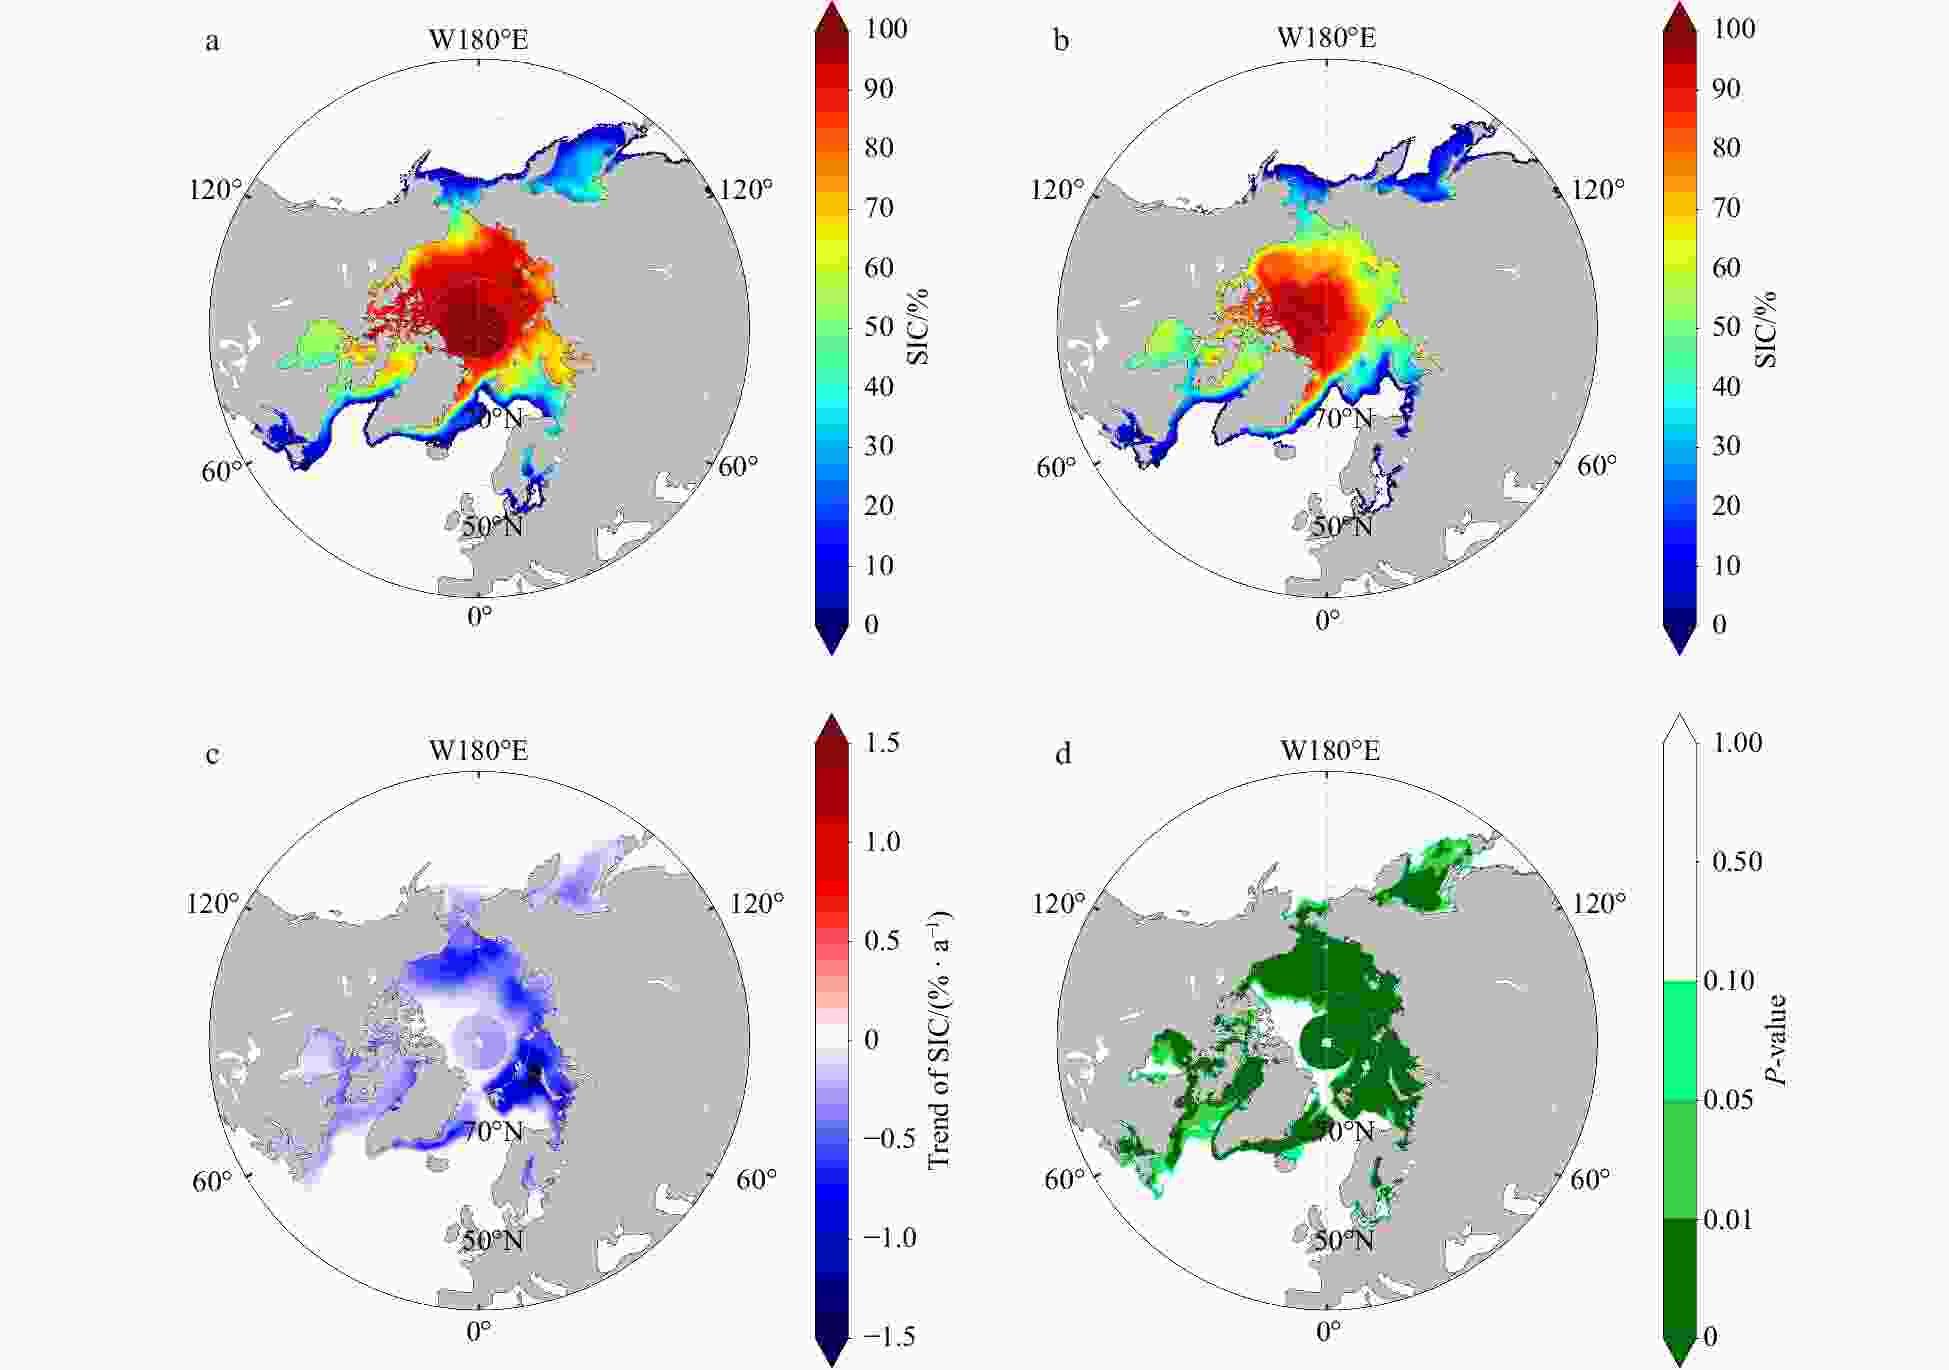
Figure 5. Spatial patterns of Arctic sea ice concentration (SIC). a and b indicate the initial and final states of SIC in 1979 and 2020, respectively, and c and d represent the annual trend rate of SIC and its P-value of significance test, respectively.

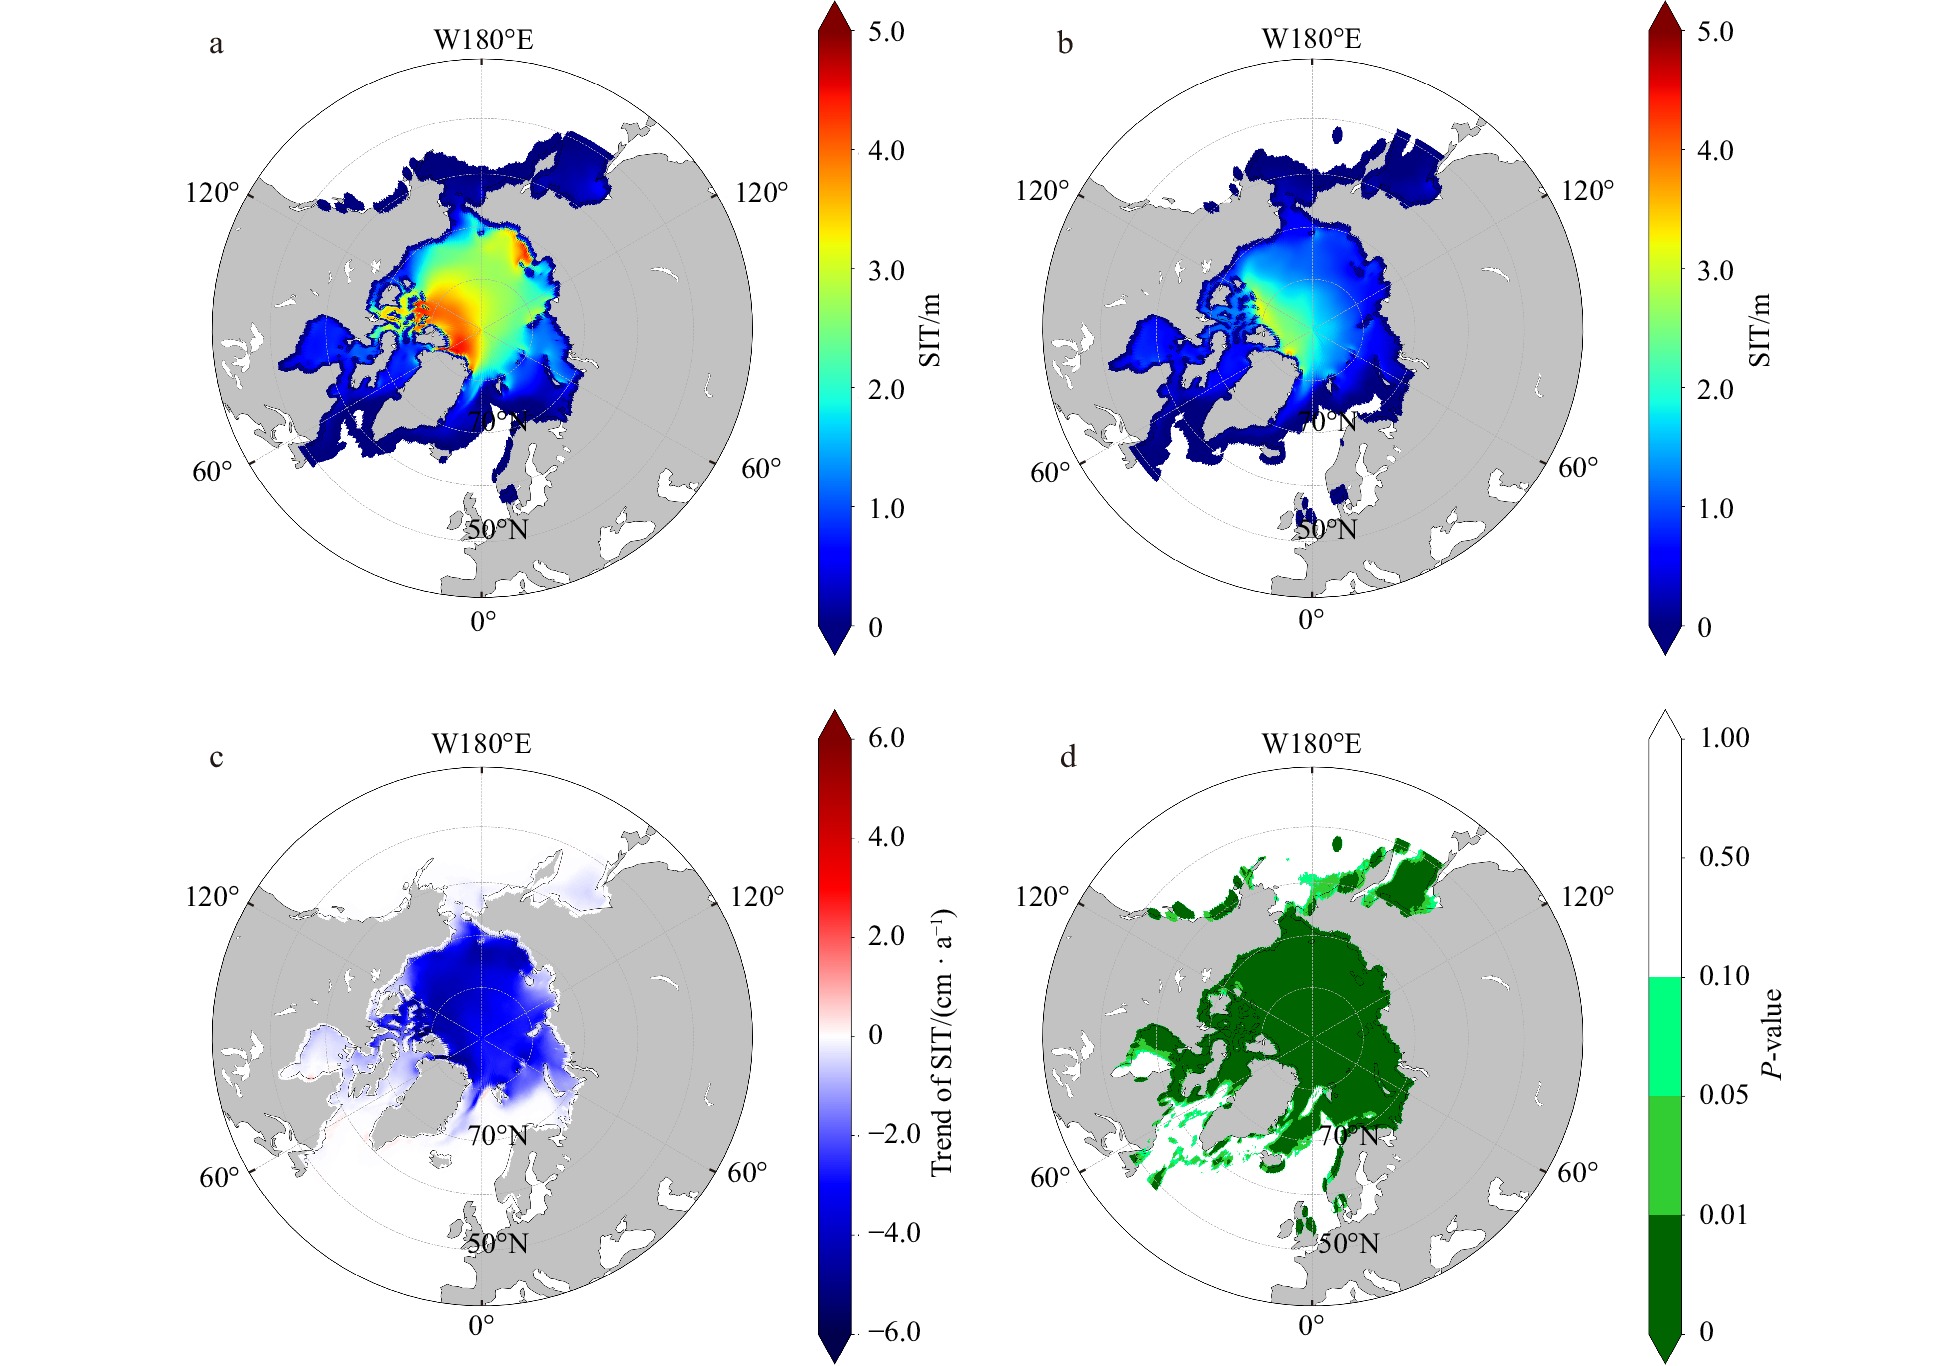
Figure 6. Spatial patterns of Arctic Sea ice thickenss (SIT). a and b indicate the initial and final states of SIT in 1979 and 2020, respectively; c and d represent the annual trend rate of SIT and its P-value of significance test, respectively.
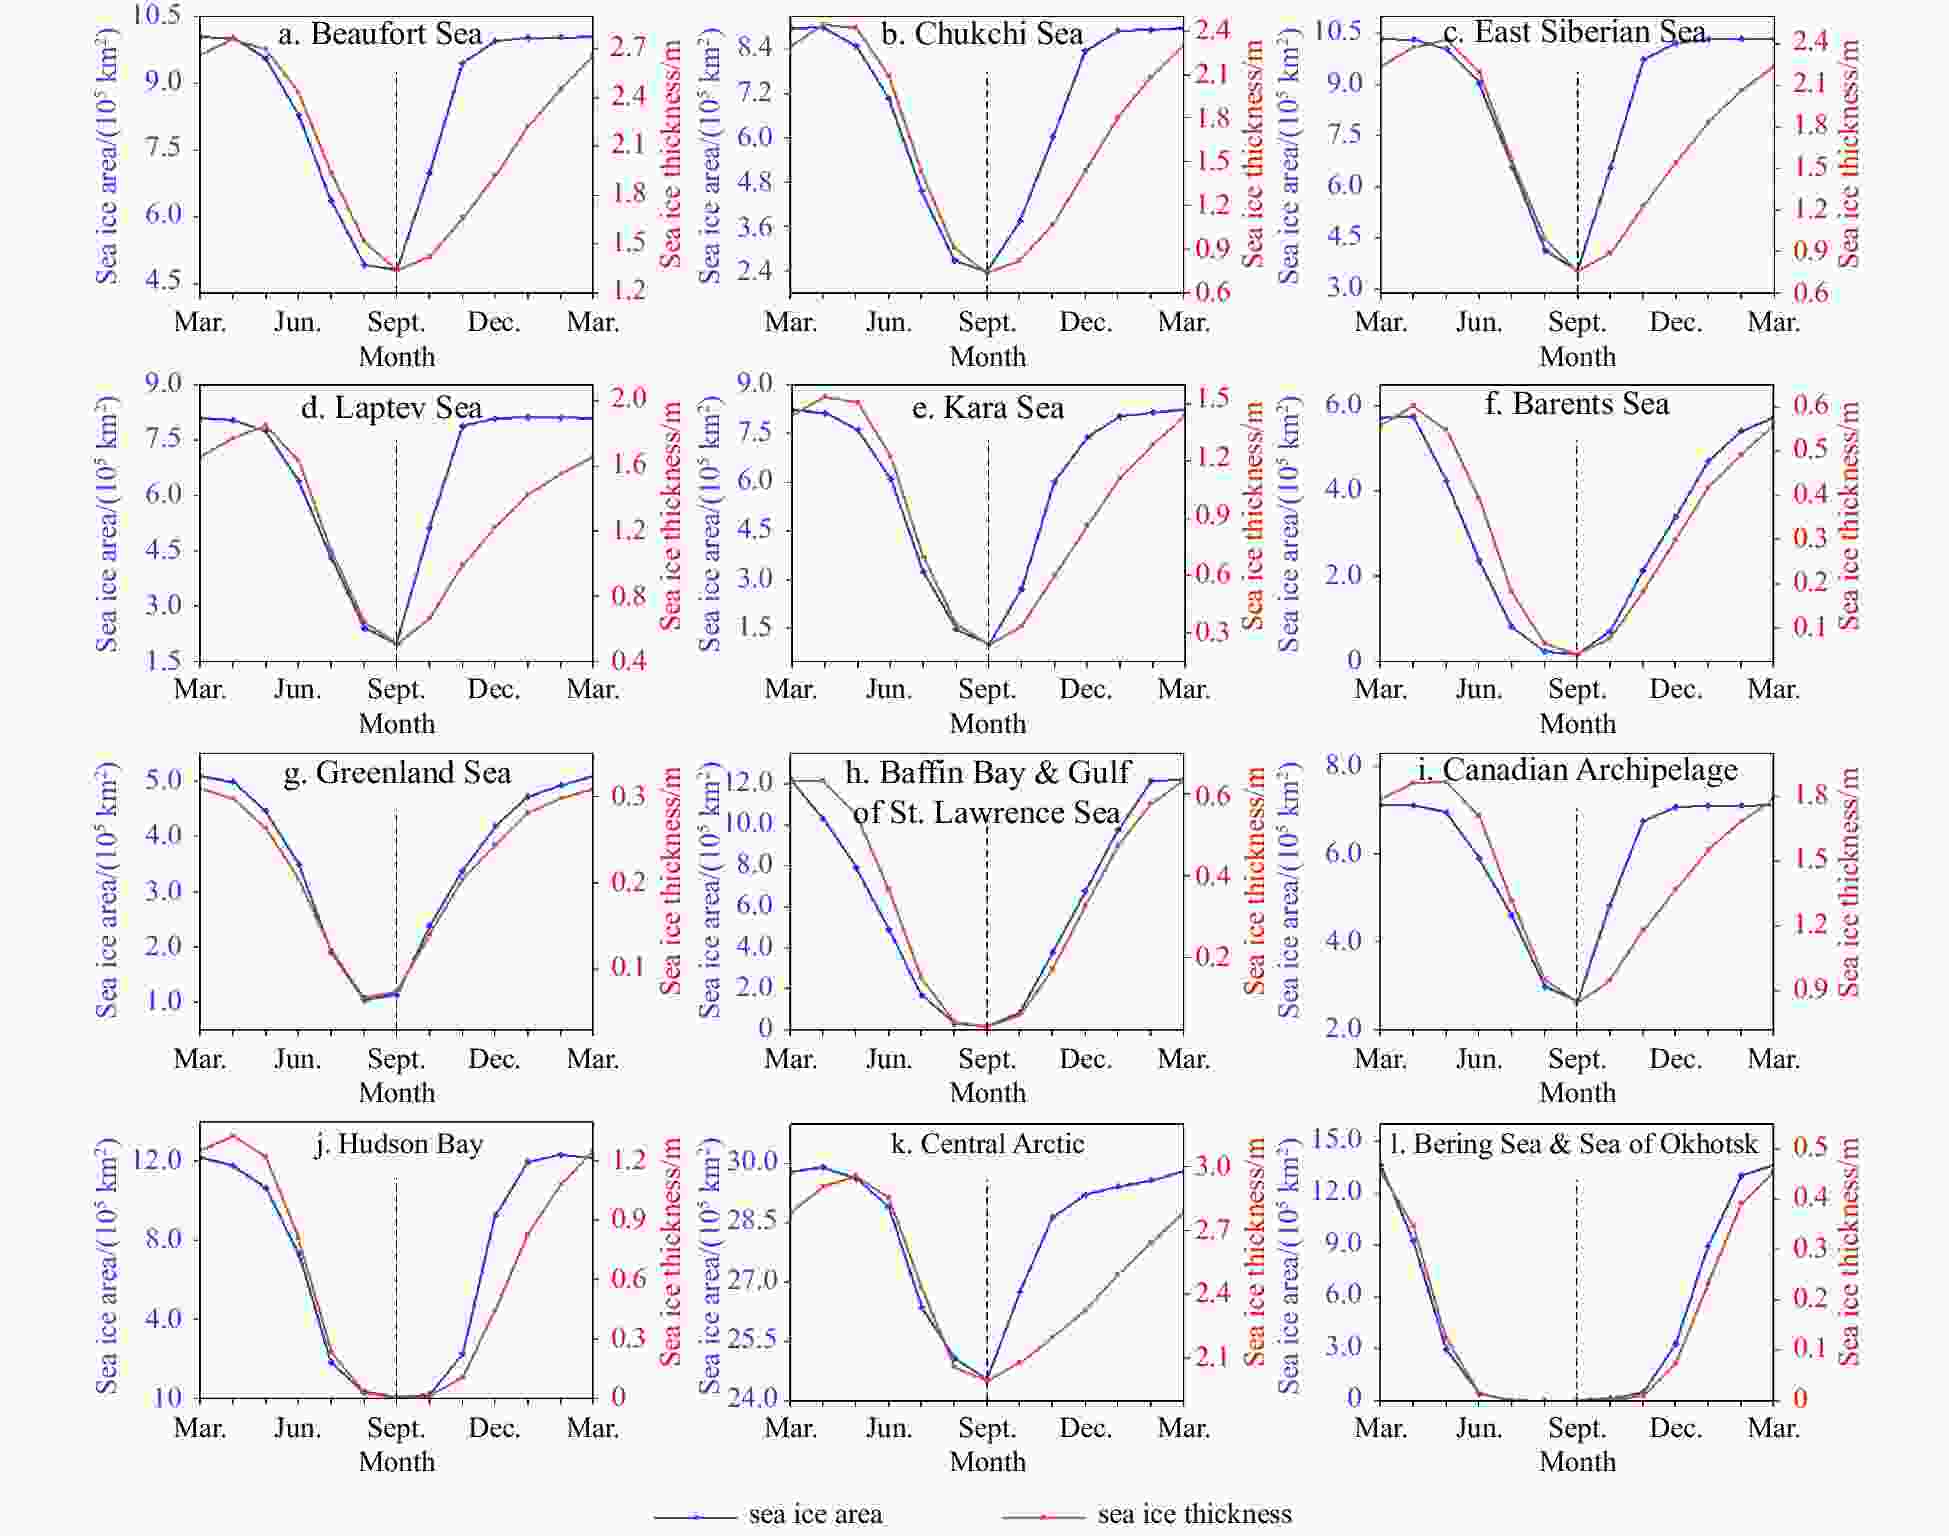
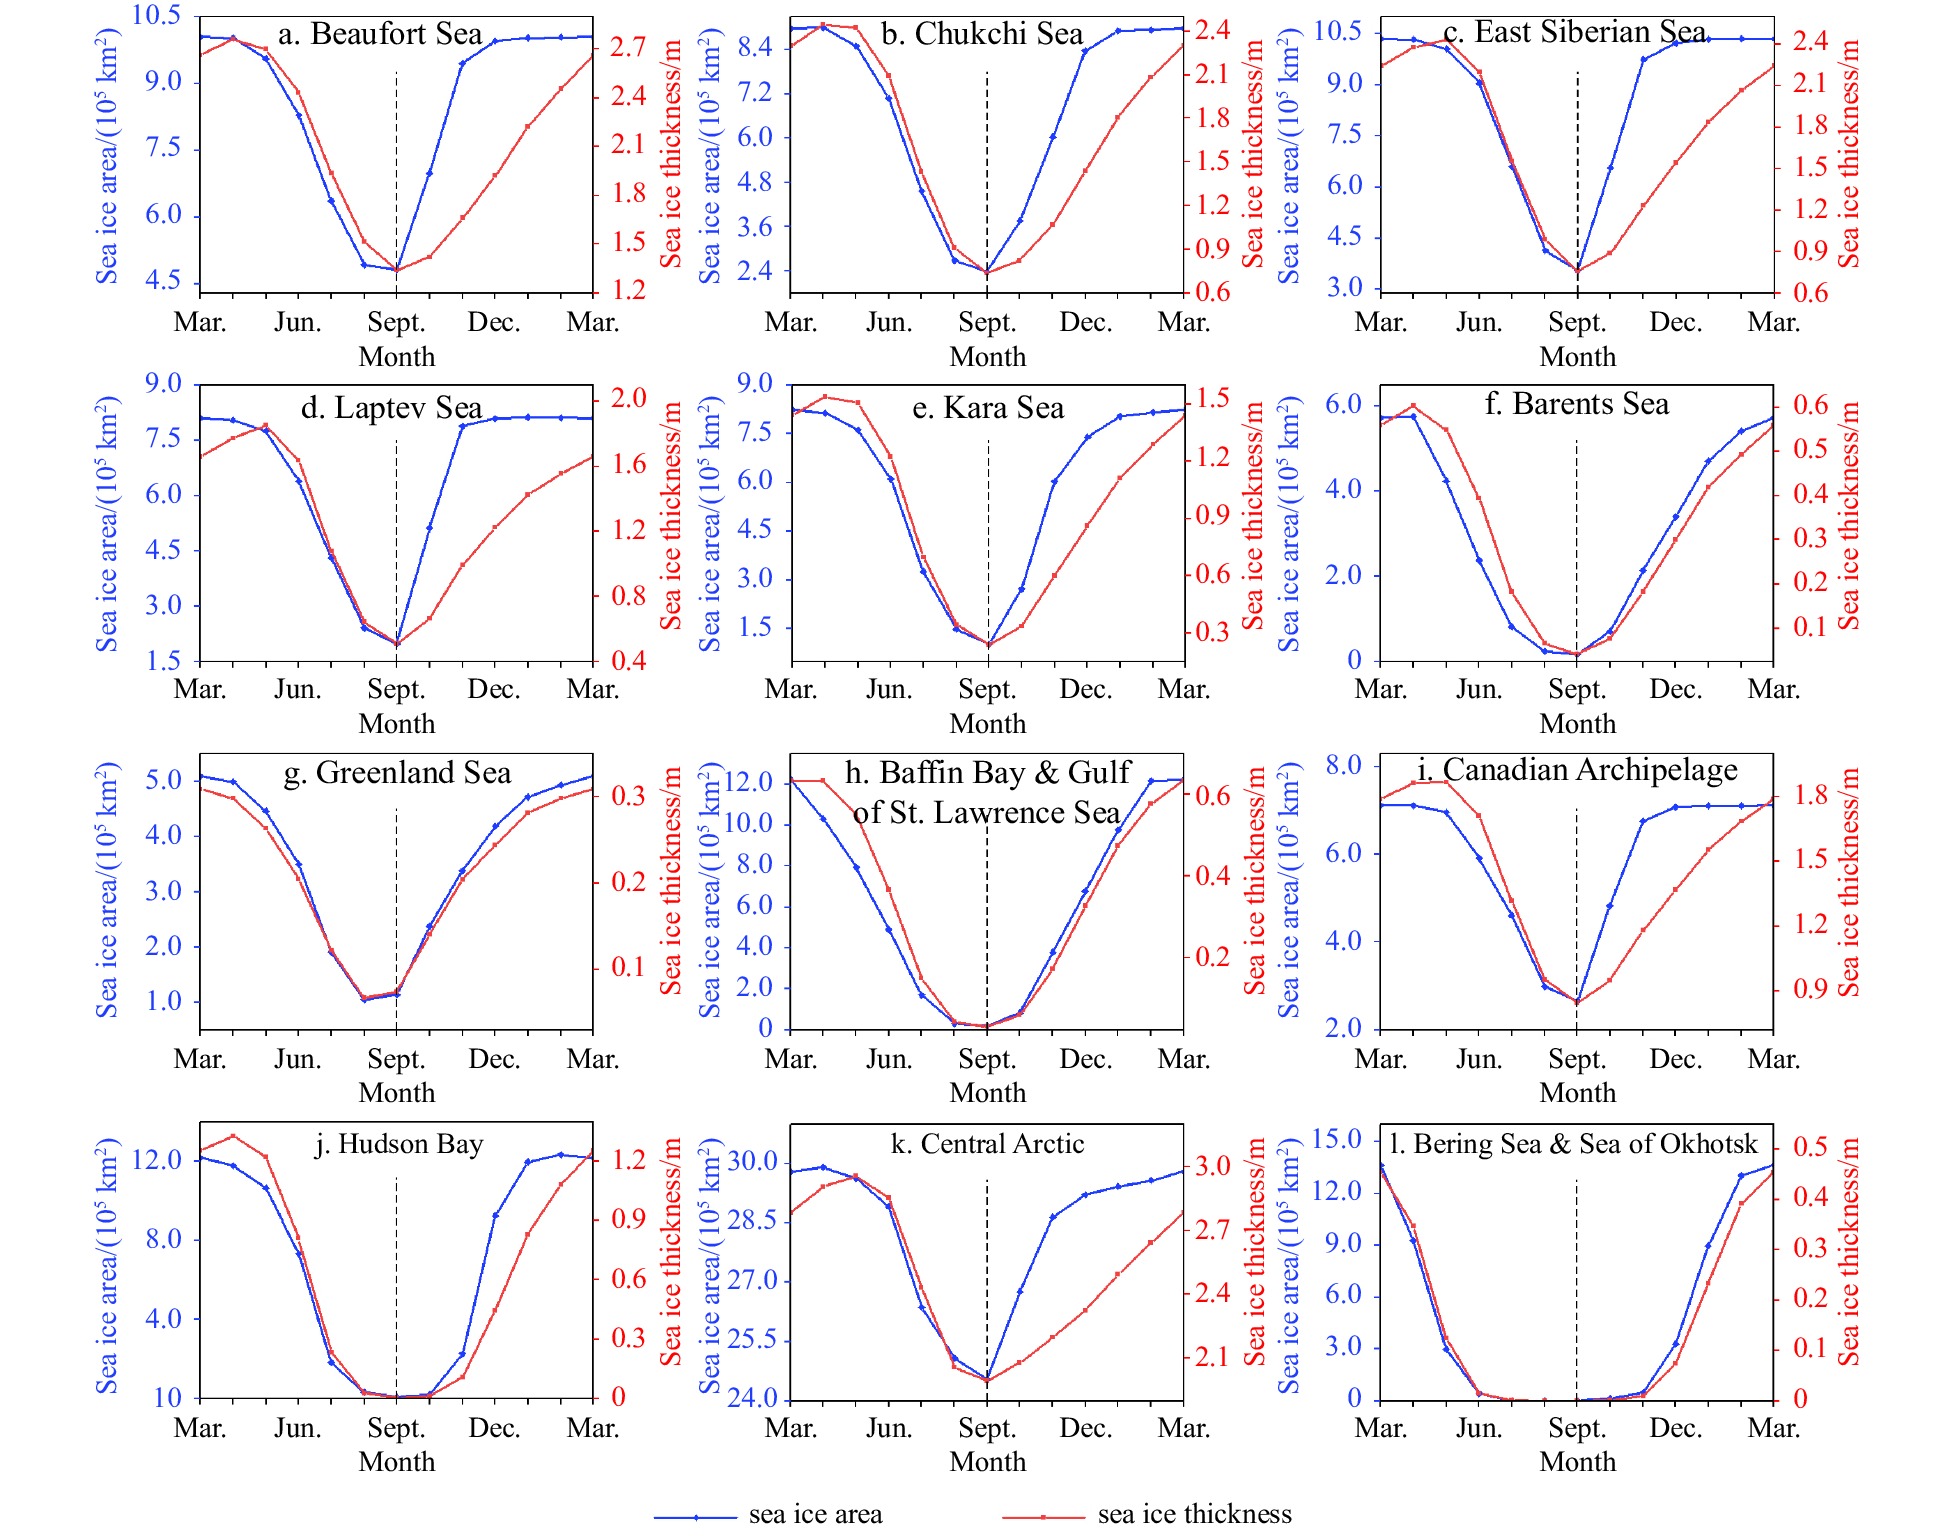
Figure 7. The monthly changes of sea ice area and sea ice thickness in the 12 sub-regions from 1979 to 2020. a. Beaufort Sea, b. Chukchi Sea, c. East Siberian Sea, d. Laptev Sea, e. Kara Sea, f. Barents Sea, g. Greenland Sea, h. Baffin Bay & Gulf of St. Lawrence Sea, i. Canadian Archipelago, j. Hudson Bay, k. Central Arctic, and l. Bering Sea & Sea of Okhotsk.
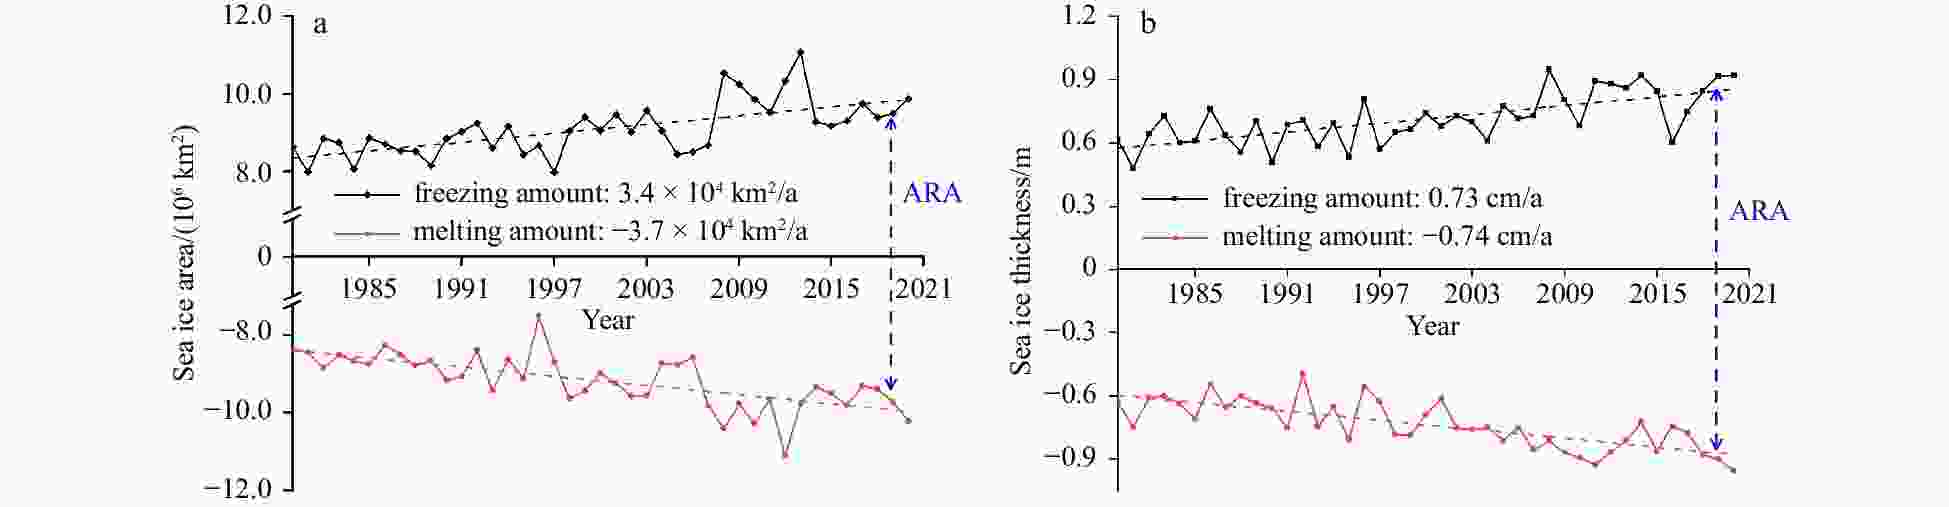
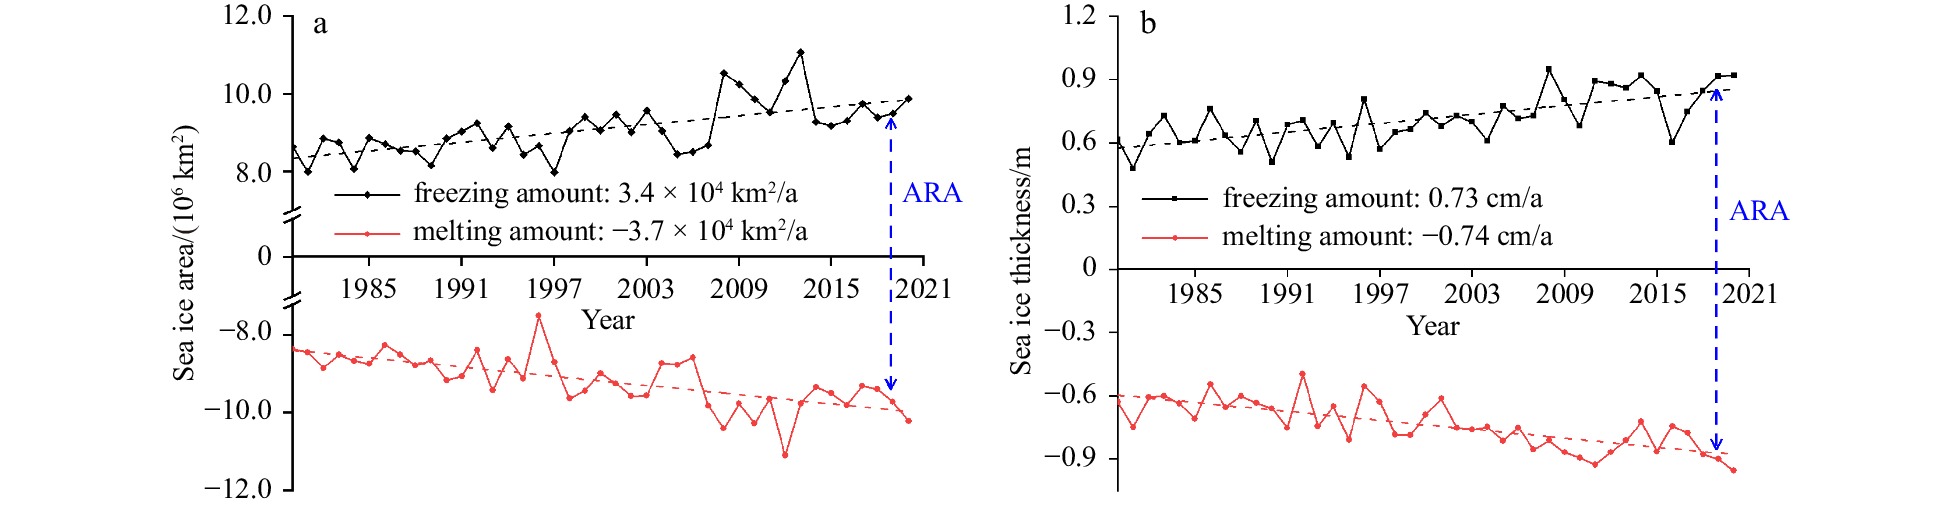
Figure 8. The annual variation of sea ice melting and freezing amount in the horizontal dimension (a) and vertical dimension (b) during 1980 to 2020.

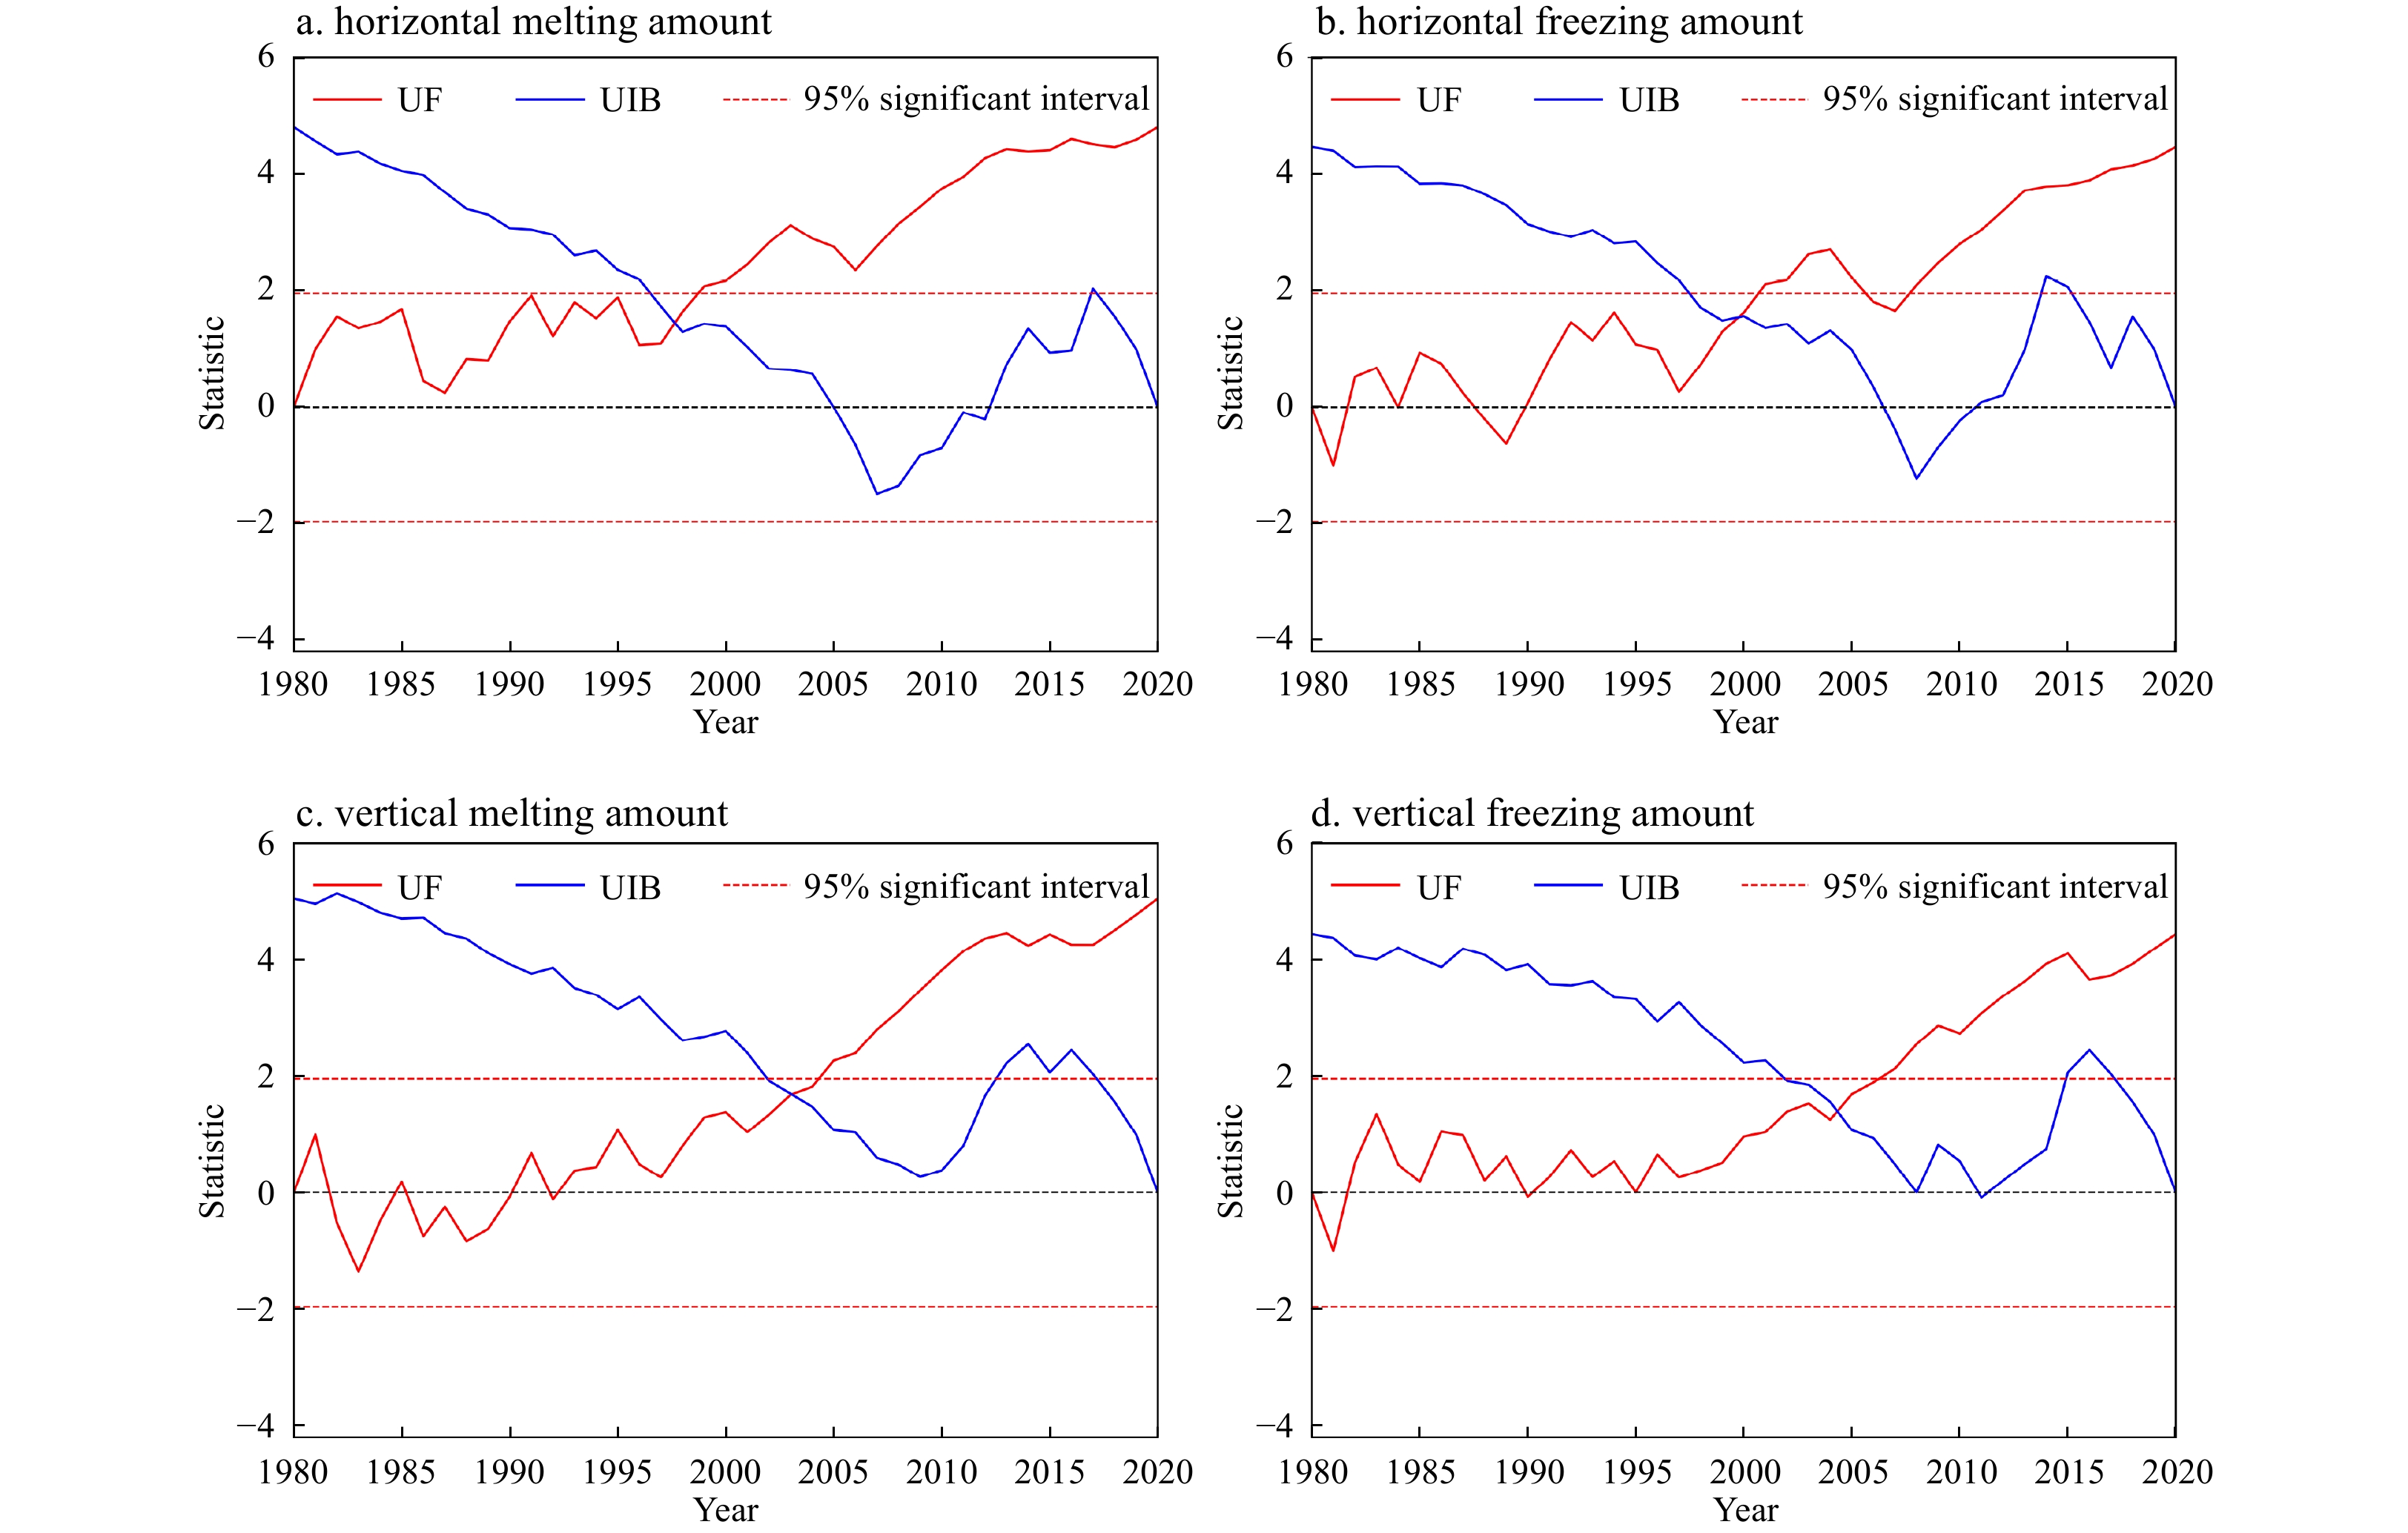
Figure 9. M-K mutation test for the changes in the amount of sea ice melting and freezing in the horizontal (a and b) and vertical dimensions (c and d) from 1980 to 2020.
Table 1. The annual and seasonal trend rates of SIA in different periods
Time scale Trend rate of SIA/(104 km2 · a–1) 1979–1990 1991–2000 2001–2010 2011–2020 Winter −2.5 −2.4 −5.4 −2.8 Spring −4.8 −4.1 −7.2 −5.0 Summer −4.2 −4.6 −13.4 −3.8 Autumn 0.7 −8.9 −11.0 −13.0 Annual −3.4 −5.1 −8.8 −7.8 Note: The bold numbers indicate that the trends are significant at the 95% confidence level.  下载: 导出CSV
Table 2. The annual and seasonal trend rates and mean of SIA in the sub-regions of the Arctic from 1979 to 2020
Region Trend rate of SIA/(103 km2 · a−1) and mean SIA/ (104 km2) Annual Winter Spring Summer Autumn Trend Mean Trend Mean Trend Mean Trend Mean Trend Mean Beaufort Sea −3.3 83.7 0.6 100.3 −1.4 92.9 −9.5 53.7 −2.9 88.0 Chukchi Sea −4.6 66.0 0.2 89.5 −2.1 81.9 −9.3 32.1 −7.5 60.5 East Siberian Sea −5.0 84.4 0.3 103.4 −1.2 98.1 −12.8 47.7 −6.4 88.4 Laptev Sea −3.8 63.6 −0.4 80.0 −7.2 43.7 −7.5 50.0 −0.2 80.8 Kara Sea −5.3 56.9 −1.4 81.5 −4.0 72.9 −7.6 19.3 −7.8 53.9 Barents Sea −8.1 29.8 −11.4 52.9 −10.7 41.3 −1.7 4.1 −7.5 20.9 Greenland Sea −3.4 34.8 −5.0 49.1 −3.1 43.2 −2.1 13.7 −3.0 33.1 Baffin Bay & Gulf of St. Lawrence Sea −5.1 59.1 −7.6 113.9 −5.4 77.2 −2.3 7.5 −4.8 38.0 Canadian Archipelago −1.2 58.5 0.6 71.1 −0.7 66.6 −3.1 34.2 −1.5 62.2 Hudson Bay −2.5 66.9 −0.3 121.7 −3.1 99.3 −1.5 7.4 −4.1 39.1 Central Arctic −4.9 281.6 −0.9 296.0 −1.3 294.9 −12.1 253.3 −4.8 282.1 Bering Sea & Sea of Okhotsk −4.4 43.6 −10.2 118.8 −5.1 42.2 0.0 0.0 −2.0 12.9 Note: The bold numbers indicate that the trends are significant at the 95% confidence level.
下载: 导出CSV
Table 3. The annual and seasonal trend rates of SIT in different periods
Time scale Trend rate of SIT/(cm · a–1) 1979–1990 1991–2000 2001–2010 2011–2020 Winter −0.5 −2.9 −3.2 0.1 Spring 0.2 −2.9 −3.4 0.7 Summer −0.3 −3.5 −4.4 −0.2 Autumn 0.0 −3.8 −5.1 −1.1 Annual 0.2 −2.9 −4.1 0.1 Note: The bold numbers indicate that the trends are significant at the 95% confidence level.
下载: 导出CSV
Table 4. The annual and seasonal trend rates and mean of SIT in the sub-regions of the Arctic during 1979 to 2020
Region Trend rate (cm/a) and mean (m) of SIT Annual Winter Spring Summer Autumn Trend Mean Trend Mean Trend Mean Trend Mean Trend Mean Beaufort Sea −3.6 2.1 −3.0 2.4 −3.5 2.6 −4.5 1.6 −3.7 1.7 Chukchi Sea −3.4 1.6 −2.8 2.1 −3.4 2.3 −4.0 1.0 −3.5 1.1 East Siberian Sea −3.5 1.7 −2.7 2.0 −3.3 2.3 −4.5 1.1 −3.7 1.2 Laptev Sea −1.8 1.3 −1.3 1.5 −1.6 1.8 −2.5 0.7 −2.1 1.0 Kara Sea −2.0 0.9 −1.8 1.3 −2.5 1.4 −1.9 0.4 −1.7 0.6 Barents Sea −0.9 0.3 −1.3 0.5 −1.4 0.5 −0.4 0.1 −0.7 0.2 Greenland Sea −0.2 0.2 −0.3 0.3 −0.1 0.3 −0.2 0.1 −0.3 0.2 Baffin Bay & Gulf of St. Lawrence Sea −0.3 0.3 −0.3 0.6 −0.4 0.5 −0.3 0.1 −0.3 0.2 Canadian Archipelago −2.4 1.4 −1.9 1.7 −2.1 1.8 −3.2 1.0 −2.4 1.2 Hudson Bay −0.4 0.6 −0.1 1.1 −0.7 1.1 −0.3 0.1 −0.2 0.2 Central Arctic −3.2 2.5 −3.1 2.6 −2.9 2.9 −3.6 2.2 −3.5 2.2 Bering Sea & Sea of Okhotsk −0.2 0.1 −0.4 0.4 −0.3 0.2 0.0 0.0 −0.1 0.0 Note: The bold numbers indicate that the trends are significant at the 95% confidence level.
下载: 导出CSV
Table 5. The mutation years and the rates before and after the mutation for the sea ice melting and freezing amount
Dimension Melting/
freezing
amountMutation
yearRate before
mutationRate after
mutationHorizontal melting 1997 −2.5 × 10⁴ km2/a −2.9 × 10⁴ km2/a freezing 2000 2.3 × 10⁴ km2/a 3.2 × 10⁴ km2/a Vertical melting 2003 −0.4 cm/a −0.7 cm/a freezing 2004 0.4 cm/a 1.0 cm/a
下载: 导出CSV
-
Al-Ghussain L. 2019. Global warming: review on driving forces and mitigation. Environmental Progress & Sustainable Energy, 38(1): 13–21, doi: 10.1002/ep.13041 Årthun M, Eldevik T, Smedsrud L H. 2019. The role of atlantic heat transport in future arctic winter sea ice loss. Journal of Climate, 32(11): 3327–3341, doi: 10.1175/jcli-d-18-0750.1 Bitz C M, Roe G H. 2004. A mechanism for the high rate of sea ice thinning in the Arctic Ocean. Journal of Climate, 17(18): 3623–3632, doi: 10.1175/1520-0442(2004)017<3623:Amfthr>2.0.Co;2 Blanchard-Wrigglesworth E, Bitz C M. 2014. Characteristics of Arctic sea-ice thickness variability in GCMs. Journal of Climate, 27(21): 8244–8258, doi: 10.1175/jcli-d-14-00345.1 Cai Qiongqiong, Wang Jia, Beletsky D, et al. 2021. Accelerated decline of summer Arctic sea ice during 1850–2017 and the amplified Arctic warming during the recent decades. Environmental Research Letters, 16(3): 034015, doi: 10.1088/1748-9326/abdb5f Carvalho K S, Wang Shuo. 2020. Sea surface temperature variability in the Arctic Ocean and its marginal seas in a changing climate: Patterns and mechanisms. Global and Planetary Change, 193: 103265, doi: 10.1016/j.gloplacha.2020.103265 Cavalieri D J, Parkinson C L. 2012. Arctic sea ice variability and trends, 1979–2010. The Cryosphere, 6(4): 881–889, doi: 10.5194/tc-6-881-2012 Chen Jinlei, Kang Shichang, Chen Changsheng, et al. 2020. Changes in sea ice and future accessibility along the Arctic Northeast Passage. Global and Planetary Change, 195: 103319, doi: 10.1016/j.gloplacha.2020.103319 Chen Jinlei, Kang Shichang, Meng Xianhong, et al. 2019. Assessments of the Arctic amplification and the changes in the Arctic sea surface. Advances in Climate Change Research, 10(4): 193–202, doi: 10.1016/j.accre.2020.03.002 Chen Ping, Zhao Jinping. 2017. Variation of sea ice extent in different regions of the Arctic Ocean. Acta Oceanologica Sinica, 36(8): 9–19, doi: 10.1007/s13131-016-0886-x Chylek P, Folland C, Klett J D, et al. 2022. Annual mean arctic amplification 1970–2020: observed and simulated by CMIP6 climate models. Geophysical Research Letters, 49(13): e2022GL099371, doi: 10.1029/2022gl099371 Collow T W, Wang Wanqiu, Kumar A, et al. 2015. Improving arctic sea ice prediction using PIOMAS initial sea ice thickness in a coupled ocean-atmosphere model. Monthly Weather Review, 143(11): 4618–4630, doi: 10.1175/mwr-d-15-0097.1 Dammann D O, Eriksson L E B, Mahoney A R, et al. 2018. Mapping arctic bottomfast sea ice using SAR interferometry. Remote Sensing, 10(5): 720, doi: 10.3390/rs10050720 Dawson G, Landy J, Tsamados M, et al. 2022. A 10-year record of Arctic summer sea ice freeboard from CryoSat-2. Remote Sensing of Environment, 268: 112744, doi: 10.1016/j.rse.2021.112744 Deser C, Teng Haiyan. 2008. Evolution of Arctic sea ice concentration trends and the role of atmospheric circulation forcing, 1979–2007. Geophysical Research Letters, 35(2): L02504, doi: 10.1029/2007GL032023 Dethleff D, Kuhlmann G. 2010. Fram Strait sea-ice sediment provinces based on silt and clay compositions identify Siberian Kara and Laptev seas as main source regions. Polar Research, 29(3): 265–282, doi: 10.1111/j.1751-8369.2010.00149.x Dong Chunming, Luo Xiaofan, Nie Hongtao, et al. 2023. Effect of compressive strength on the performance of the NEMO-LIM model in Arctic Sea ice simulation. Journal of Oceanology and Limnology, 41(1): 1–16, doi: 10.1007/s00343-022-1241-z Dörr J, Årthun M, Eldevik T, et al. 2021. Mechanisms of regional winter sea-ice variability in a warming arctic. Journal of Climate, 34(21): 8635–8653, doi: 10.1175/jcli-d-21-0149.1 Eisenman I. 2010. Geographic muting of changes in the Arctic sea ice cover. Geophysical Research Letters, 37(6): L16501, doi: 10.1029/2010gl043741 Feng Jiajun, Zhang Yuanzhi, Cheng Qiuming, et al. 2022. Pan-Arctic melt pond fraction trend, variability, and contribution to sea ice changes. Global and Planetary Change, 217: 103932, doi: 10.1016/j.gloplacha.2022.103932 Geng Mingming, Wang Kelin, Yang Nan, et al. 2021. Evaluation and variation trends analysis of water quality in response to water regime changes in a typical river-connected lake (Dongting Lake), China. Environmental Pollution, 268: 115761, doi: 10.1016/j.envpol.2020.115761 Gocic M, Trajkovic S. 2013. Analysis of changes in meteorological variables using Mann-Kendall and Sen’s slope estimator statistical tests in Serbia. Global and Planetary Change, 100: 172–182, doi: 10.1016/j.gloplacha.2012.10.014 Hamed K H, Rao A R. 1998. A modified Mann-Kendall trend test for autocorrelated data. Journal of Hydrology, 204(1–4): 182–196, doi: 10.1016/s0022-1694(97)00125-x Huang Yiyi, Dong Xiquan, Bailey D A, et al. 2019. Thicker clouds and accelerated Arctic sea ice decline: The atmosphere-sea ice interactions in spring. Geophysical Research Letters, 46(12): 6980–6989, doi: 10.1029/2019GL082791 Huang Fei, Zhou Xiao, Wang Hong. 2017. Arctic sea ice in CMIP5 climate model projections and their seasonal variability. Acta Oceanologica Sinica, 36(8): 1–8, doi: 10.1007/s13131-017- 1029-8 Johansson A M, King J A, Doulgeris A P, et al. 2017. Combined observations of Arctic sea ice with near-coincident colocated X-band, C-band, and L-band SAR satellite remote sensing and helicopter-borne measurements. Journal of Geophysical Research: Oceans, 122(1): 669–691, doi: 10.1002/2016jc012273 Kendall M G. 1975. Rank Correlation Methods. 4th ed. London: Charles Griffin Kumar A, Yadav J, Mohan R. 2020. Global warming leading to alarming recession of the Arctic sea-ice cover: Insights from remote sensing observations and model reanalysis. Heliyon, 6(7): e04355, doi: 10.1016/j.heliyon.2020.e04355 Kumar A, Yadav J, Mohan R. 2021. Spatio-temporal change and variability of Barents-Kara sea ice, in the Arctic: Ocean and atmospheric implications. Science of the Total Environment, 753: 142046, doi: 10.1016/j.scitotenv.2020.142046 Kwok R, Cunningham G F. 2015. Variability of Arctic sea ice thickness and volume from CryoSat-2. Philosophical Transactions of the Royal Society A-Mathematical, Physical and Engineering Sciences, 373(2045): 20140157, doi: 10.1098/rsta.2014.0157 Labe Z, Magnusdottir G, Stern H. 2018. Variability of arctic sea ice thickness using PIOMAS and the CESM large ensemble. Journal of Climate, 31(8): 3233–3247, doi: 10.1175/jcli-d-17-0436.1 Landy J C, Dawson G J, Tsamados M, et al. 2022. A year-round satellite sea-ice thickness record from CryoSat-2. Nature, 609(7927): 517–522, doi: 10.1038/s41586-022-05058-5 Lang A, Yang Shuting, Kaas E. 2017. Sea ice thickness and recent Arctic warming. Geophysical Research Letters, 44(1): 409–418, doi: 10.1002/2016gl071274 Laxon S W, Giles K A, Ridout A L, et al. 2013. CryoSat-2 estimates of Arctic sea ice thickness and volume. Geophysical Research Letters, 40(4): 732–737, doi: 10.1002/grl.50193 Lei Ruibo, Cheng Bin, Hoppmann M, et al. 2022. Seasonality and timing of sea ice mass balance and heat fluxes in the Arctic transpolar drift during 2019–2020. Elementa-Science of the Anthropocene, 10(1): 000089, doi: 10.1525/elementa.2021.000089 Lei Ruibo, Tian-Kunze X, Leppäranta M, et al. 2016. Changes in summer sea ice, albedo, and portioning of surface solar radiation in the Pacific sector of Arctic Ocean during 1982–2009. Journal of Geophysical Research: Oceans, 121(8): 5470–5486, doi: 10.1002/2016JC011831 Li Zixuan, Zhao Jiechen, Su Jie, et al. 2020. Spatial and temporal variations in the extent and thickness of arctic landfast ice. Remote Sensing, 12(1): 64, doi: 10.3390/rs12010064 Markus T, Stroeve J C, Miller J. 2009. Recent changes in Arctic sea ice melt onset, freezeup, and melt season length. Journal of Geophysical Research: Oceans, 114(C12): C12024, doi: 10.1029/2009jc005436 Notz D, Community S. 2020. Arctic sea ice in CMIP6. Geophysical Research Letters, 47(10): e2019GL086749, doi: 10.1029/2019gl086749 Onarheim I H, Eldevik T, Smedsrud L H, et al. 2018. Seasonal and regional manifestation of Arctic Sea Ice loss. Journal of Climate, 31(12): 4917–4932, doi: 10.1175/jcli-d-17-0427.1 Ono J, Watanabe M, Komuro Y, et al. 2022. Enhanced Arctic warming amplification revealed in a low-emission scenario. Communications Earth & Environment, 3(1): 27, doi: 10.1038/s43247-022-00354-4 Parkinson C L, Cavalieri D J. 2008. Arctic sea ice variability and trends, 1979–2006. Journal of Geophysical Research: Oceans, 113(C7): C07003, doi: 10.1029/2007JC004558 Parkinson C L, Cavalieri D J, Gloersen P, et al. 1999. Arctic sea ice extents, areas, and trends, 1978–1996. Journal of Geophysical Research: Oceans, 104(C9): 20837–20856, doi: 10.1029/1999jc900082 Parkinson C L, DiGirolamo N E. 2021. Sea ice extents continue to set new records: Arctic, Antarctic, and global results. Remote Sensing of Environment, 267: 112753, doi: 10.1016/j.rse.2021.112753 Perovich D K, Richter-Menge J A. 2009. Loss of sea ice in the Arctic. Annual Review of Marine Science, 1: 417–441, doi: 10.1146/annurev.marine.010908.163805 Polyakov I V, Mayer M, Tietsche S, et al. 2022. Climate change fosters competing effects of dynamics and thermodynamics in seasonal predictability of Arctic sea ice. Journal of Climate, 35(9): 2849–2865, doi: 10.1175/jcli-d-21-0463.1 Ricker R, Hendricks S, Kaleschke L, et al. 2017. A weekly Arctic sea-ice thickness data record from merged CryoSat-2 and SMOS satellite data. The Cryosphere, 11(4): 1607–1623, doi: 10.5194/tc-11-1607-2017 Roach L A, Eisenman I, Wagner T J W, et al. 2022. Asymmetry in the seasonal cycle of Antarctic sea ice driven by insolation. Nature Geoscience, 15(4): 277–281, doi: 10.1038/s41561-022-00913-6 Schweiger A, Lindsay R, Zhang Jinlun, et al. 2011. Uncertainty in modeled Arctic sea ice volume. Journal of Geophysical Research: Oceans, 116(C8): C00D06, doi: 10.1029/2011jc007084 Serreze M C, Holland M M, Stroeve J. 2007. Perspectives on the Arctic’s shrinking sea-ice cover. Science, 315(5818): 1533–1536, doi: 10.1126/science.1139426 Serreze M C, Meier W N. 2019. The Arctic’s sea ice cover: trends, variability, predictability, and comparisons to the Antarctic. Annals of the New York Academy of Sciences, 1436(1): 36–53, doi: 10.1111/nyas.13856 Shamshiri R, Eide E, Høyland K V. 2022. Spatio-temporal distribution of sea-ice thickness using a machine learning approach with Google Earth Engine and Sentinel-1 GRD data. Remote Sensing of Environment, 270: 112851, doi: 10.1016/j.rse.2021.112851 Shi H, Lee S M, Sohn B J, et al. 2023. Estimation of arctic winter snow depth, sea ice thickness and bulk density, and ice freeboard by combining CryoSat-2, AVHRR, and AMSR measurements. IEEE Transactions on Geoscience and Remote Sensing, 61: 4300718, doi: 10.1109/tgrs.2023.3265274 Stroeve J, Notz D. 2018. Changing state of Arctic sea ice across all seasons. Environmental Research Letters, 13(10): 103001, doi: 10.1088/1748-9326/aade56 Tilling R L, Ridout A, Shepherd A. 2018. Estimating Arctic sea ice thickness and volume using CryoSat-2 radar altimeter data. Advances in Space Research, 62(6): 1203–1225, doi: 10.1016/j.asr.2017.10.051 Von Albedyll L, Hendricks S, Grodofzig R, et al. 2022. Thermodynamic and dynamic contributions to seasonal Arctic sea ice thickness distributions from airborne observations. Elementa: Science of the Anthropocene, 10(1), doi: 10.1525/elementa.2021.00074 Wang Yunhe, Bi Haibo, Huang Haijun, et al. 2019. Satellite-observed trends in the Arctic sea ice concentration for the period 1979–2016. Journal of Oceanology and Limnology, 37(1): 18–37, doi: 10.1007/s00343-019-7284-0 Wang Xiaoli, Hou Xiyong, Wang Yuandong. 2017. Spatiotemporal variations and regional differences of extreme precipitation events in the Coastal area of China from 1961 to 2014. Atmospheric Research, 197: 94–104, doi: 10.1016/j.atmosres.2017.06.022 Wang Xuanji, Key J, Kwok R, et al. 2016. Comparison of Arctic Sea Ice thickness from satellites, aircraft, and PIOMAS data. Remote Sensing, 8(9): 713, doi: 10.3390/rs8090713 Wang Mingfeng, König M, Oppelt N. 2021. Partial shape recognition for sea ice motion retrieval in the marginal ice zone from Sentinel-1 and Sentinel-2. Remote Sensing, 13(21): 4473, doi: 10.3390/rs13214473 Wang Zongliang, Li Zhen, Zeng Jiangyuan, et al. 2020. Spatial and temporal variations of Arctic sea ice from 2002 to 2017. Earth and Space Science, 7(9): e2020EA001278, doi: 10.1029/2020ea001278 Wang Jia, Zhang Jinlun, Watanabe E, et al. 2009. Is the dipole anomaly a major driver to record lows in Arctic summer sea ice extent?. Geophysical Research Letters, 36(5): L05706, doi: 10.1029/2008GL036706 Wei Fengying. 2007. Modern Climatic Statistical Diagnosis and Prediction Technology (in Chinese). 2nd ed. Beijing: China Meteorological Press, 1–256 Wu Fengmin, He Jinhai, Qi Li, et al. 2014. The seasonal difference of Arctic warming and it’s mechanism under sea ice cover diminishing. Haiyang Xuebao (in Chinese), 36(3): 39–47, doi: 10.3969/j.issn.0253-4193.2014.03.005 Wu Hongqian, Zhang Ren, Wang Yangjun, et al. 2021. Analyzing the effects of sea ice melting and atmospheric heat transport on the warming around arctic based on comparable analysis and coupling modes. Atmospheric Research, 258: 105630, doi: 10.1016/j.atmosres.2021.105630 Xiao Cunde, Yang Jiao, Zhang Tong, et al. 2022. The predictability, irreversibility and deep uncertainty of cryospheric change. Climate Change Research (in Chinese), 18(1): 1–11, doi: 10.12006/j.issn.1673-1719.2021.247 Xiao Feng, Zhang Shengkai, Li Jiaxing, et al. 2021. Arctic sea ice thickness variations from CryoSat-2 satellite altimetry data. Science China Earth Sciences, 64(7): 1080–1089, doi: 10.1007/s11430-020-9777-9 Yadav J, Kumar A, Mohan R. 2020. Dramatic decline of Arctic sea ice linked to global warming. Natural Hazards, 103(2): 2617–2621, doi: 10.1007/s11069-020-04064-y You Qinglong, Cai Ziyi, Pepin N, et al. 2021. Warming amplification over the Arctic Pole and Third Pole: Trends, mechanisms and consequences. Earth-science Reviews, 217: 103625, doi: 10.1016/j.earscirev.2021.103625 You Jia, Xu Zhenhua, Robertson R, et al. 2022. Geographical inhomogeneity and temporal variability of mixing property and driving mechanism in the Arctic Ocean. Journal of Oceanology and Limnology, 40(3): 846–869, doi: 10.1007/s00343-021-1037-6 Zhang Peiwen, Li Qun, Xu Zhenhua, et al. 2022. Internal solitary wave generation by the tidal flows beneath ice keel in the Arctic Ocean. Journal of Oceanology and Limnology, 40(3): 831–845, doi: 10.1007/s00343-021-1052-7 Zhang Jinlun, Lindsay R, Steele M, et al. 2008. What drove the dramatic retreat of arctic sea ice during summer 2007?. Geophysical Research Letters, 35(11): L11505, doi: 10.1029/2008GL034005 Zhang Jinlun, Rothrock D A. 2003. Modeling global sea ice with a thickness and enthalpy distribution model in generalized curvilinear coordinates. Monthly Weather Review, 131(5): 845–861, doi: 10.1175/1520-0493(2003)131<0845:Mgsiwa>2.0.Co;2 Zhang Jinlun, Steele M, Schweiger A. 2010. Arctic sea ice response to atmospheric forcings with varying levels of anthropogenic warming and climate variability. Geophysical Research Letters, 37(20): L20505, doi: 10.1029/2010gl044988 -


 点击查看大图

计量
- 文章访问数: 97
- HTML全文浏览量: 47
- PDF下载量: 5
- 被引次数: 0

