

Contributions of annual and semiannual tidal constituents to chart datum in the China seas and adjacent waters
-
Abstract: Global uniform chart datum (CD) surface construction is the basic upon which to realize various vertical datums transformation, and is of great importance for geospatial data expression under the same vertical datum. Generally, the CD level is computed by developing the function between tidal constituents’ harmonic constants and time, i.e., the lowest astronomical tide is taken as the lowest predicted tide level by adopting the major constituents over a 19-a period. The CD surface prescribed in China is the theoretical lowest tide (TLT) and is calculated using 13 tidal constituents, i.e., short -period (Q1, O1, P1, K1, N2, M2, S2, K2, M4, MS4 and M6) and long-period (Sa and Ssa) tidal constituents. Although the accuracy in determining short-period tidal constituents has improved gradually, the long-period tide has not been studied thoroughly owing to nonstationary and temporal variations. Previous studies have intended to evaluate the effect of Sa and Ssa tides in the determination of the TLT level for the purpose of determining a more accurate CD surface for the China seas and adjacent waters. Here, the parameters of long-period tidal correction and long-period tidal correction rate were treated as the effect of both Sa and Ssa on the TLT, and the TOPEX/Poseidon and Jason series satellite altimetry data ranged from October 1992 to April 2022 were adopted to analyze the contribution of long-period tidal constituents. Results showed that the average long-period correction value is 10.10 cm (range from 8.57 cm to 14.98 cm), and that the average long-period tidal contribution rate is 14.56% (range from 9.09% to 23.97%) in the China seas and adjacent waters. Finally, data from 82 tide gauge station with at least a 1-a record of hourly observations were compared with satellite-derived result. We concluded that the long-period tidal contribution should not be neglected in TLT construction. Furthermore, to reduce tidal datum uncertainty, accurate extraction of long-period tidal constituents should receive closer attentions.
-
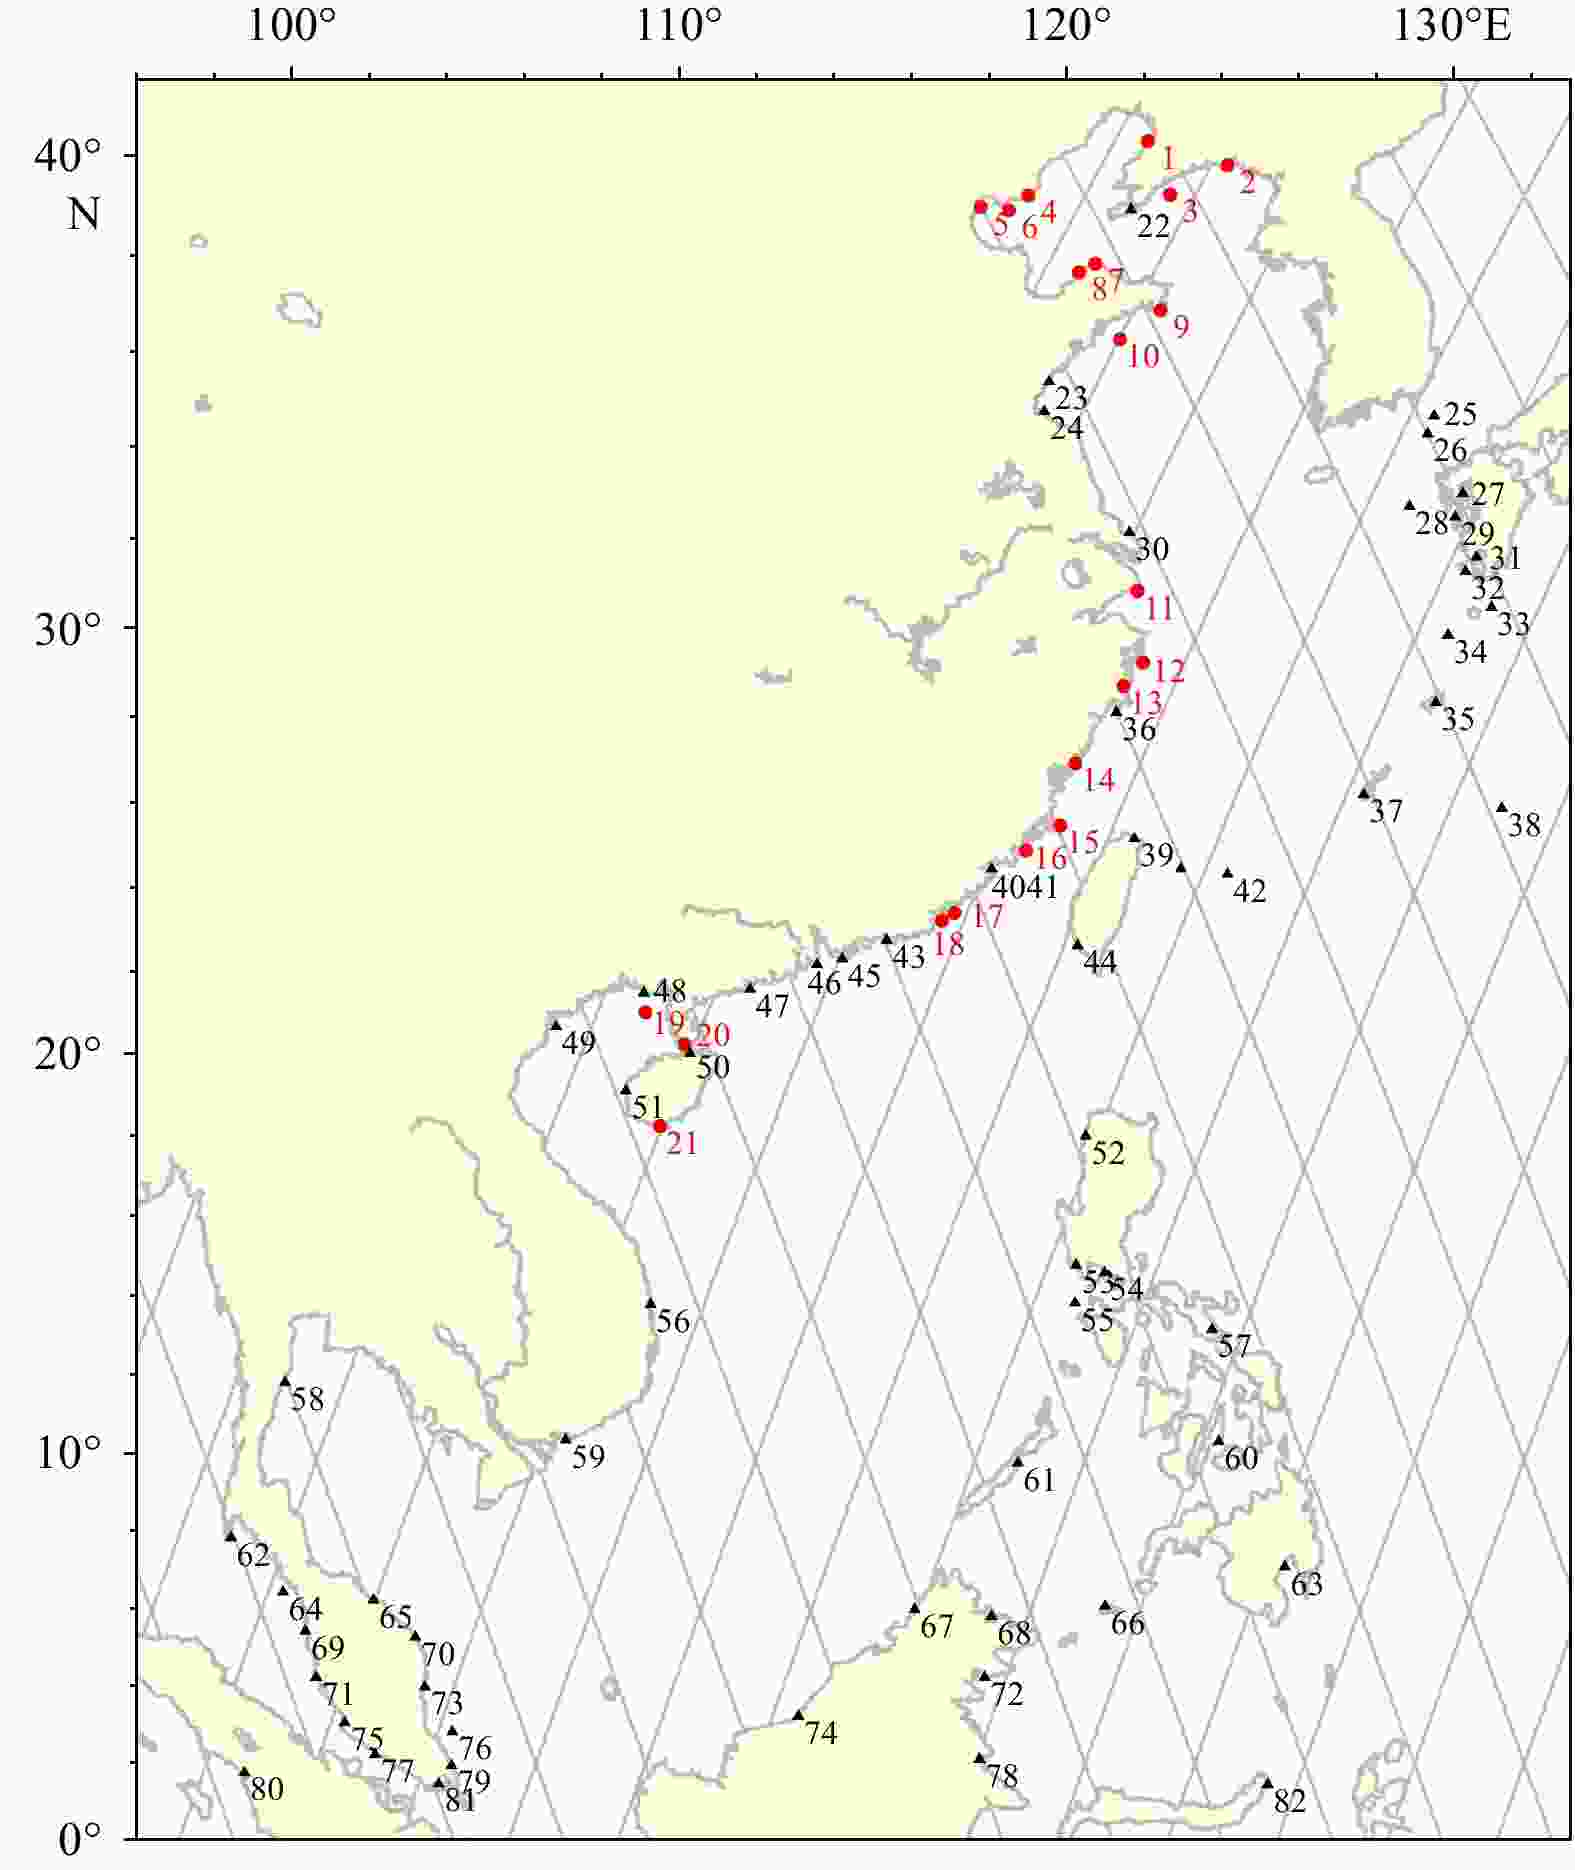
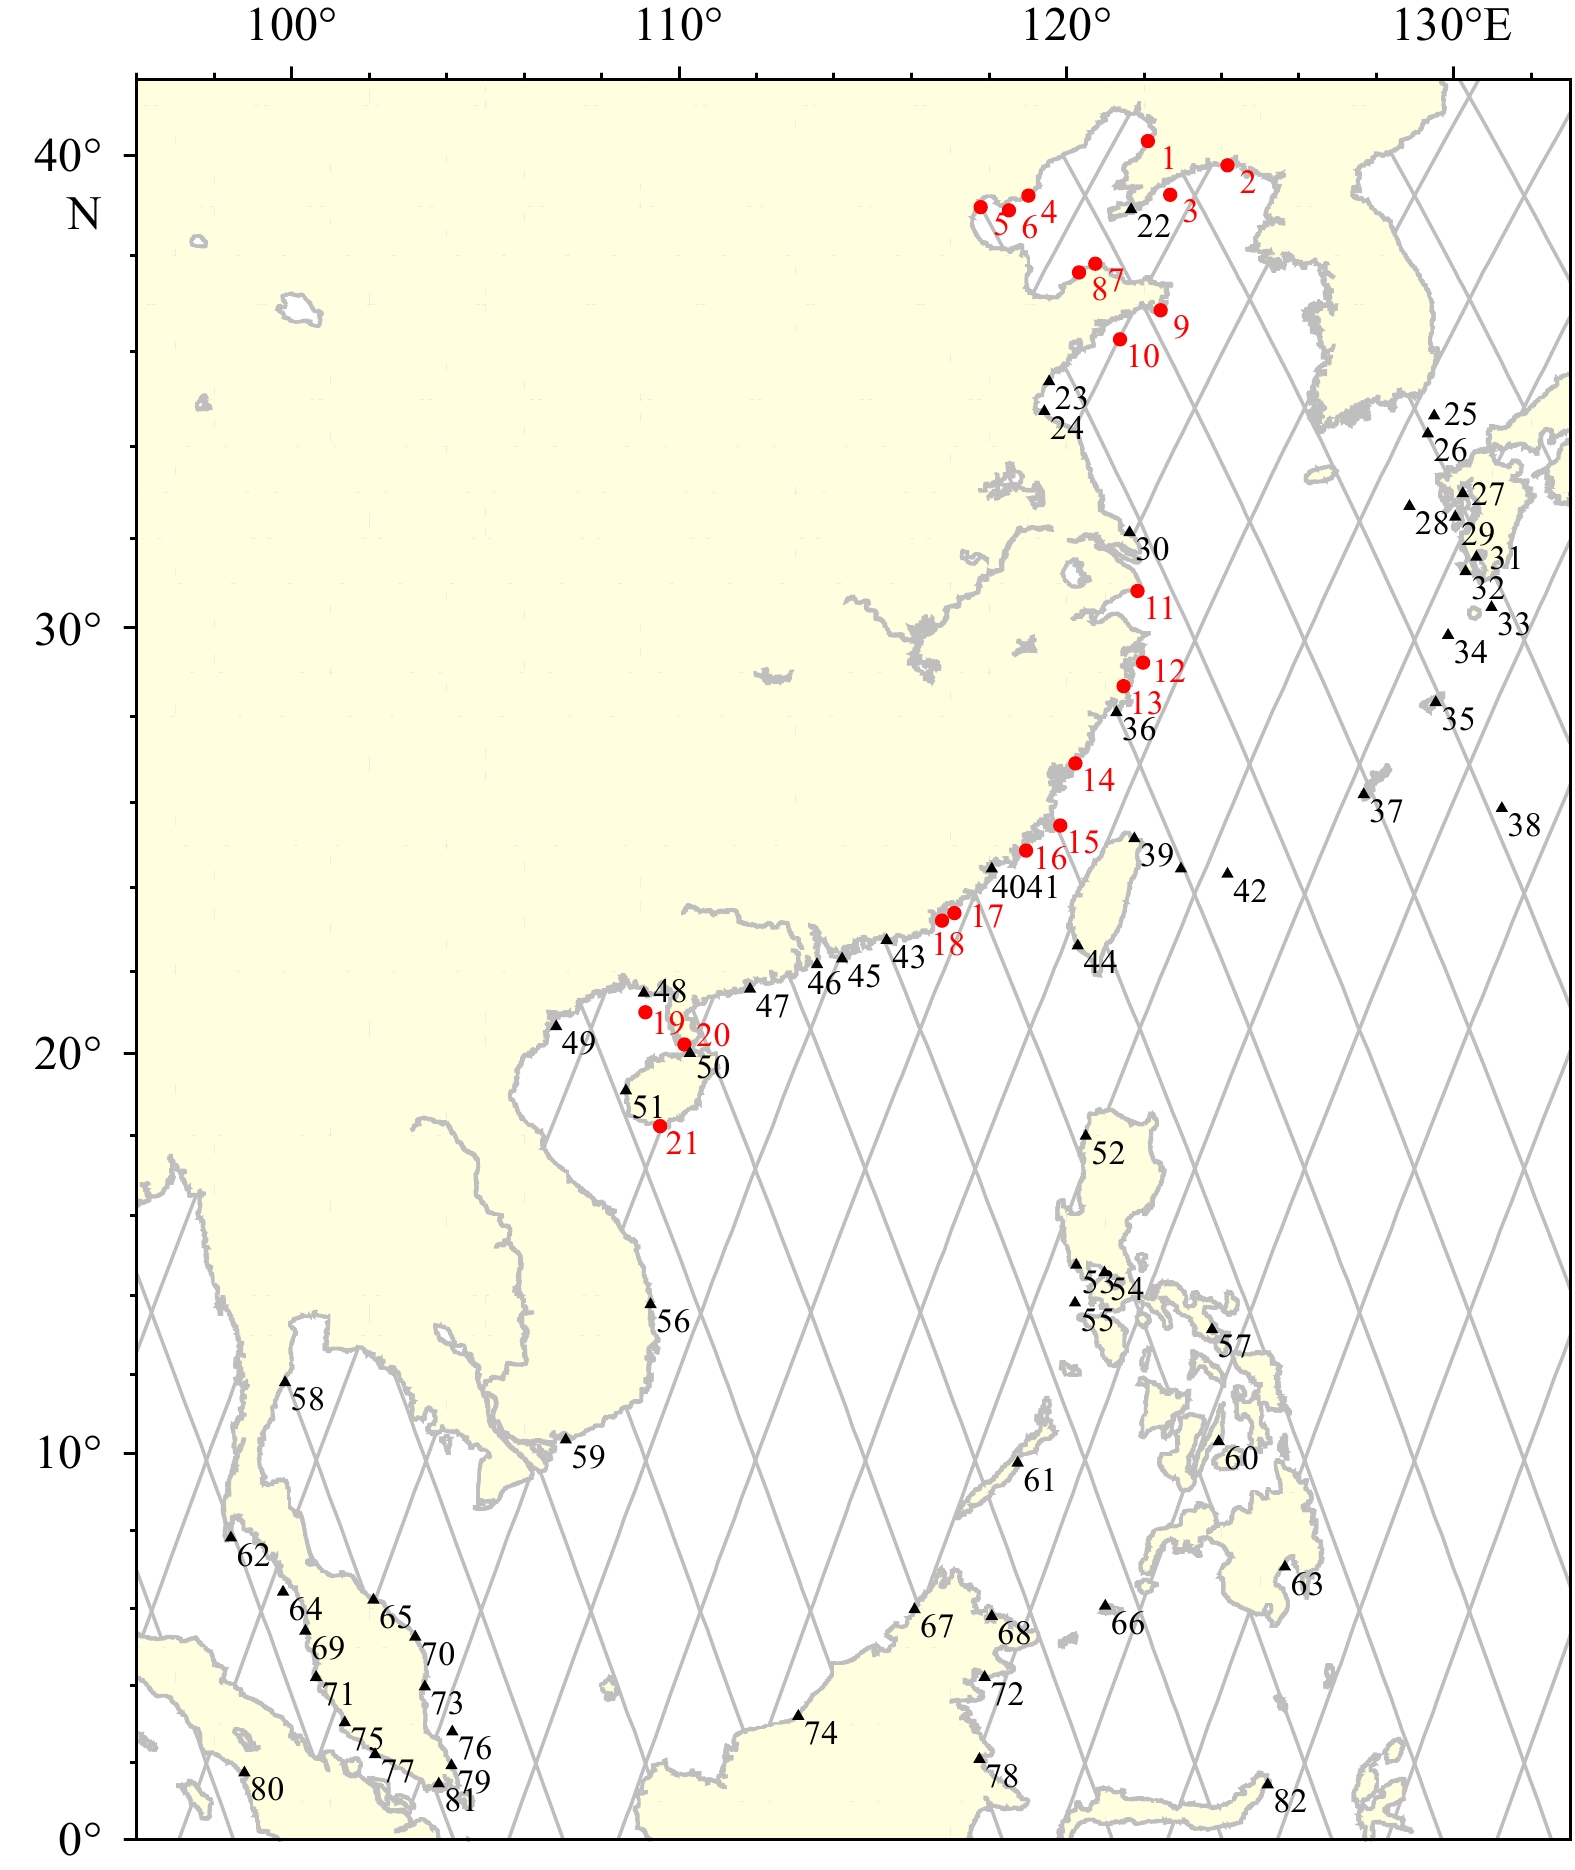
Figure 1. Tide gauge station distribution in the China seas and adjacent waters. Red dots indicate the Chinese tide gauge stations considered in this study, black triangles identity locations of the GESLA-2 stations, and solid gray lines indicate the TOPEX/Poseidon and Jason primary mission tracks.

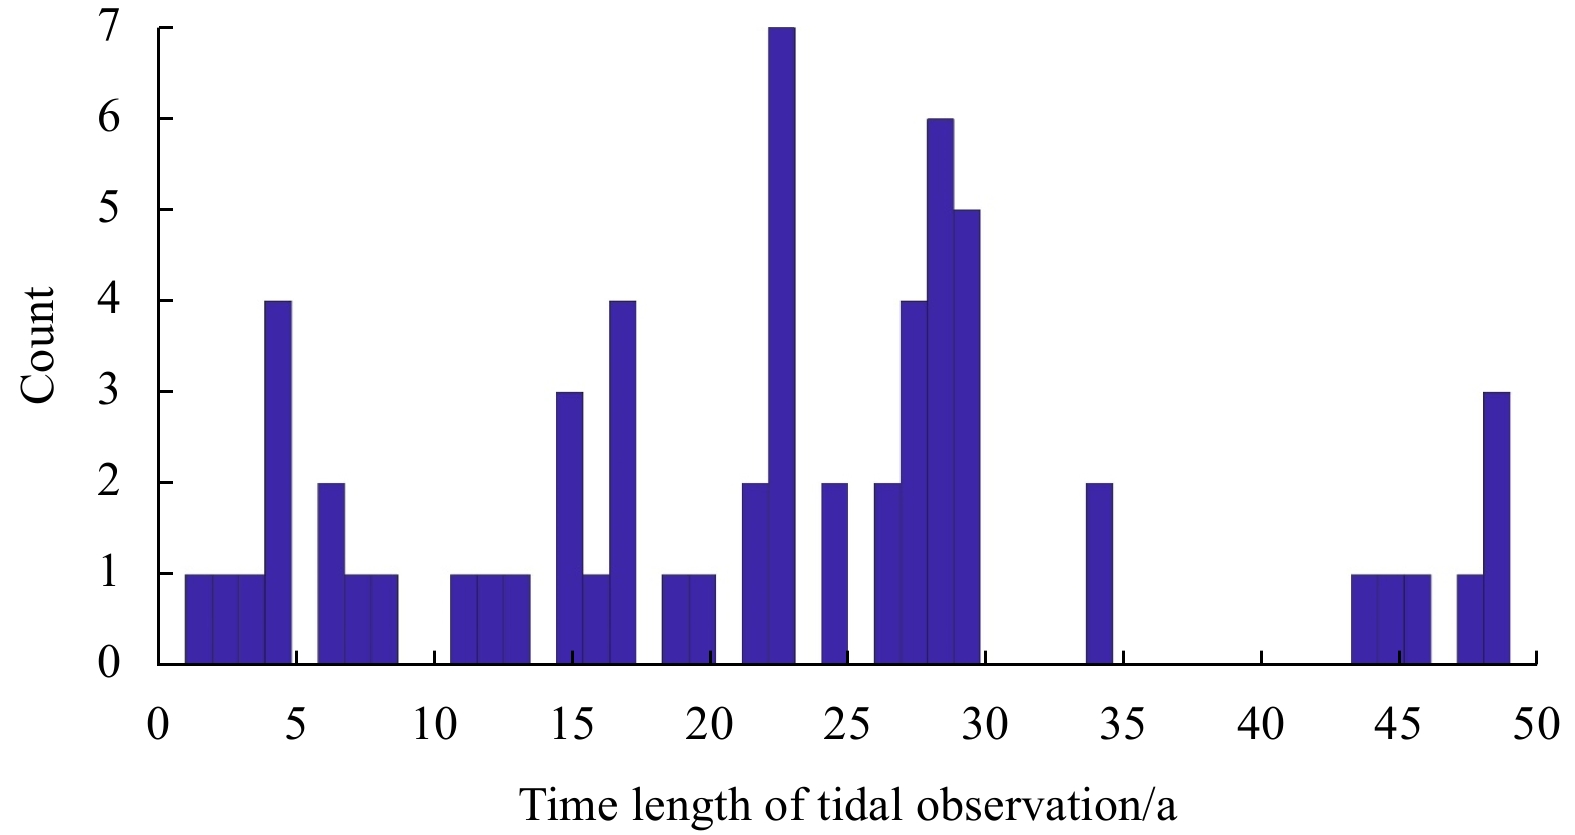
Figure 2. Histogram of the time length of tidal observations at the GESLA-2 tide gauge stations.
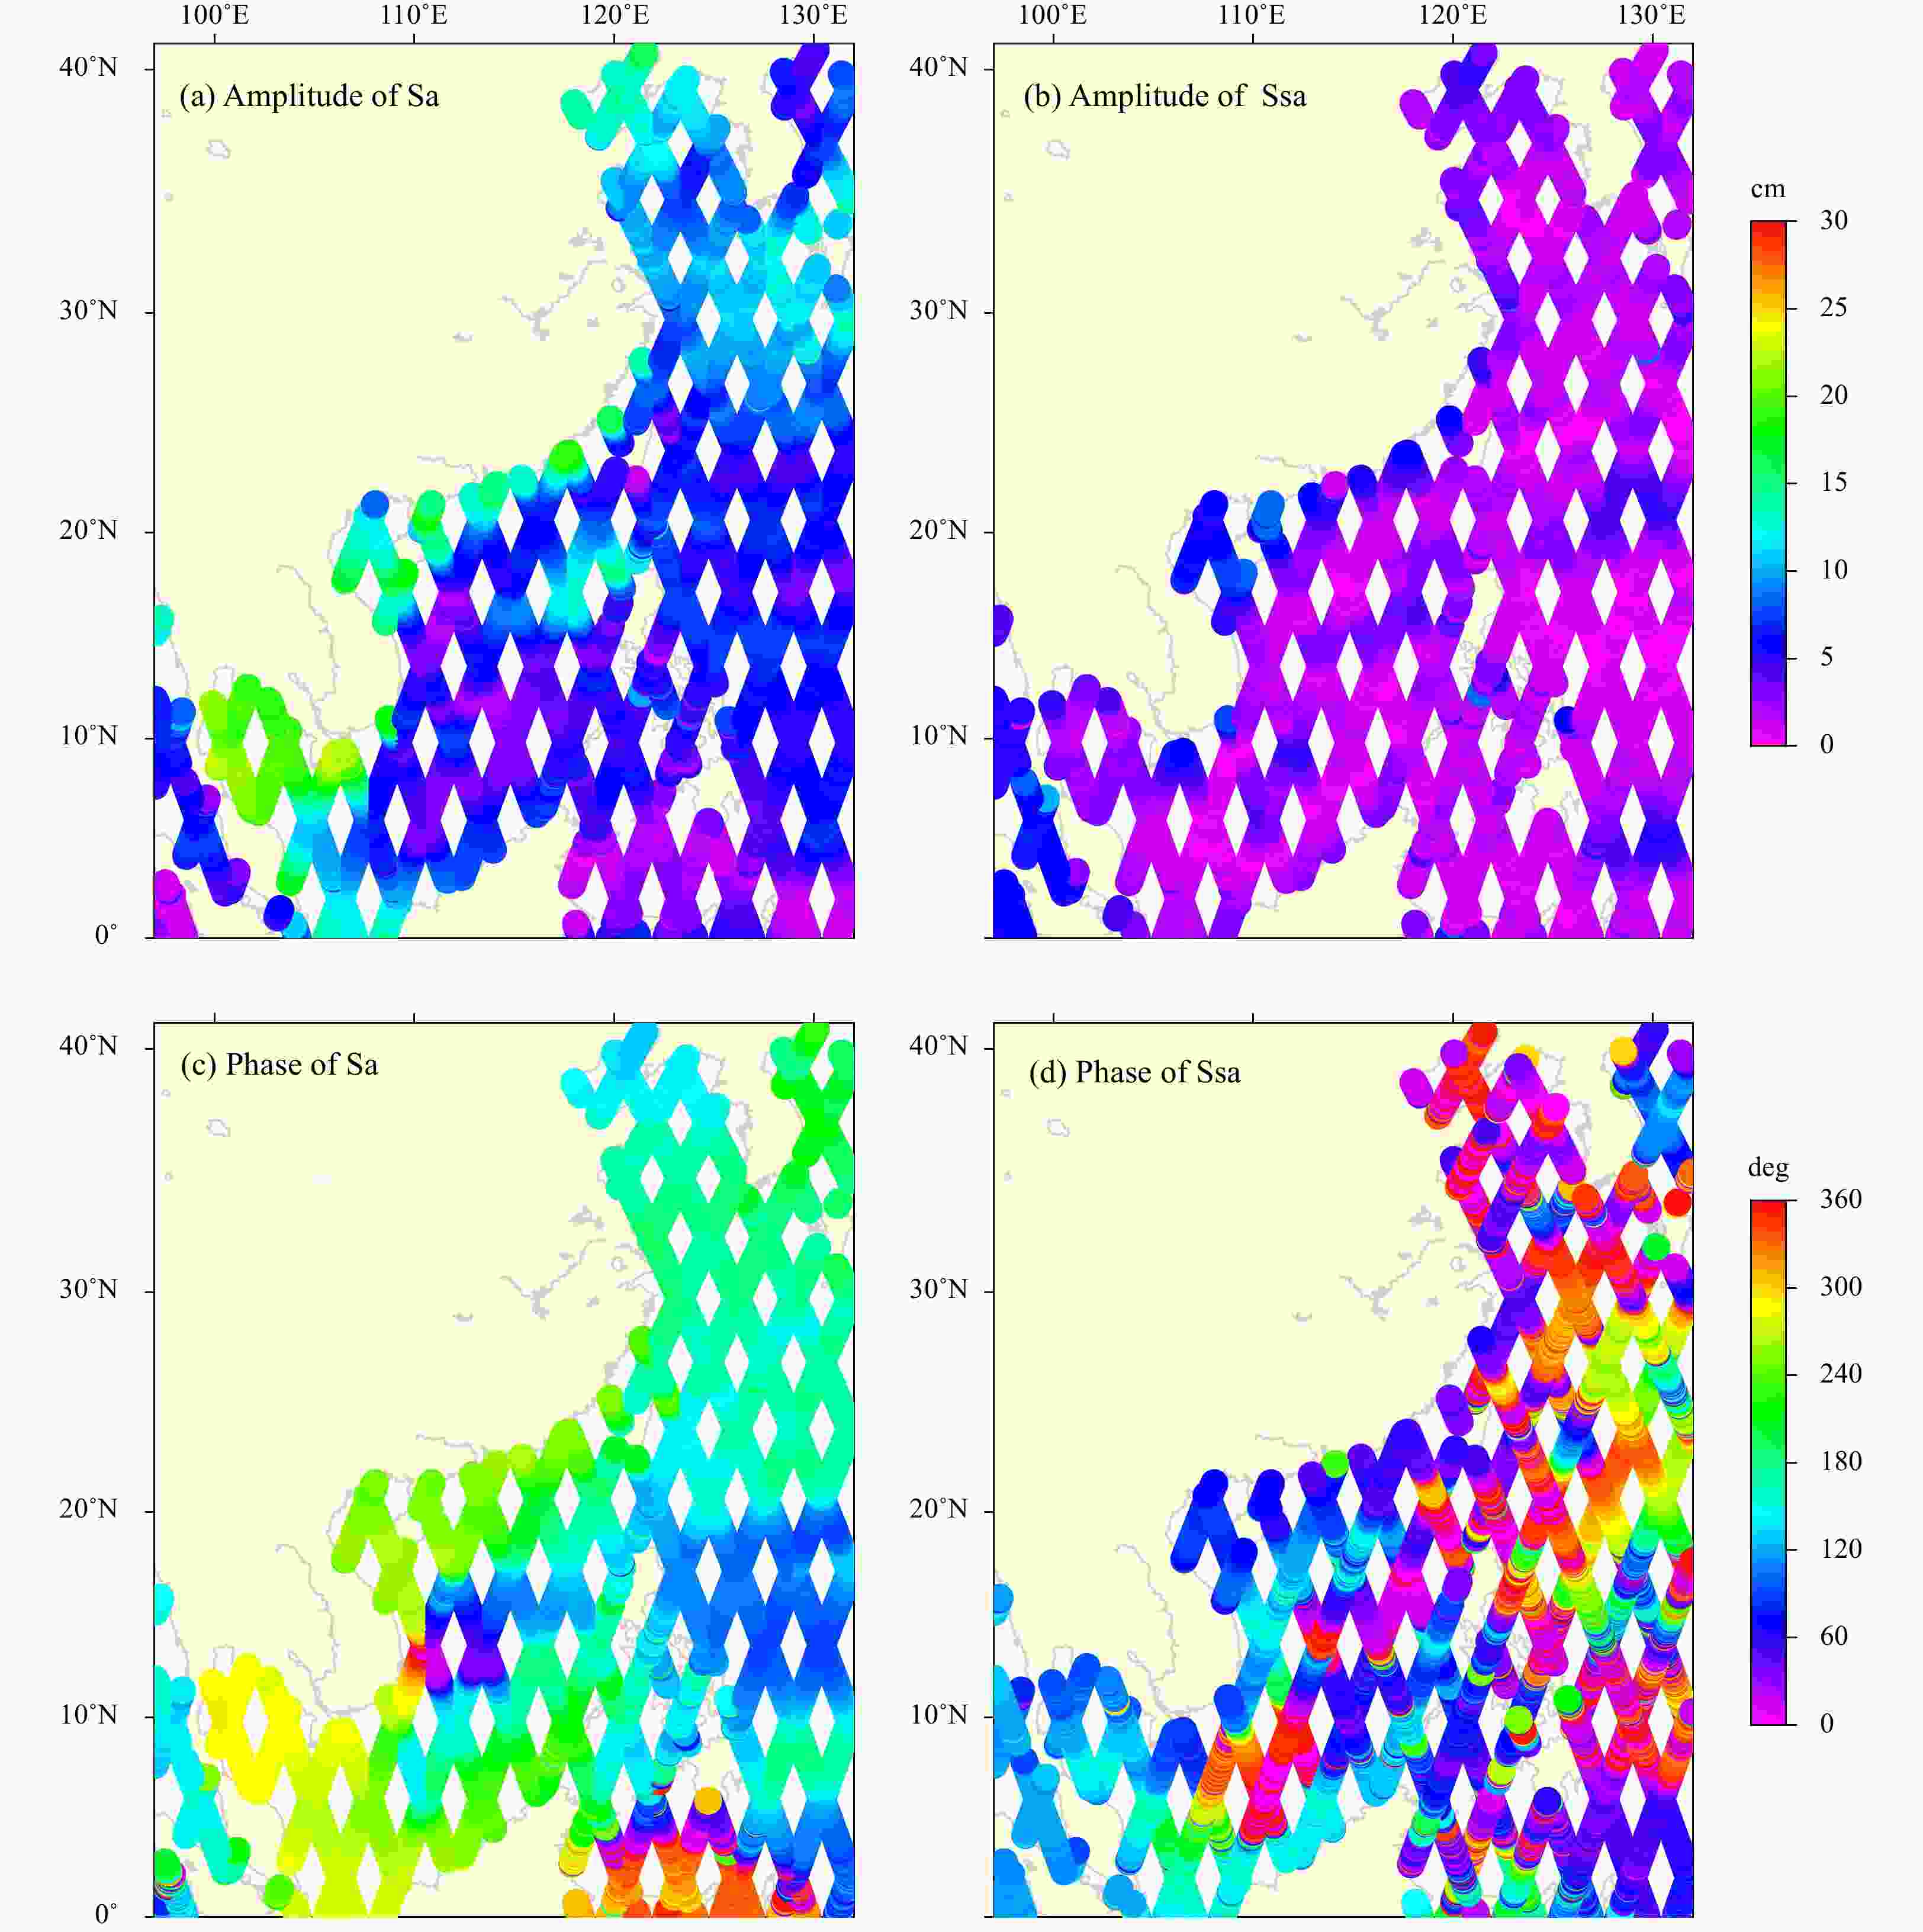
Figure 3. Satellite-derived tidal amplitudes and phase values of annual (Sa) and semiannual (Ssa) long-period tidal constituents.
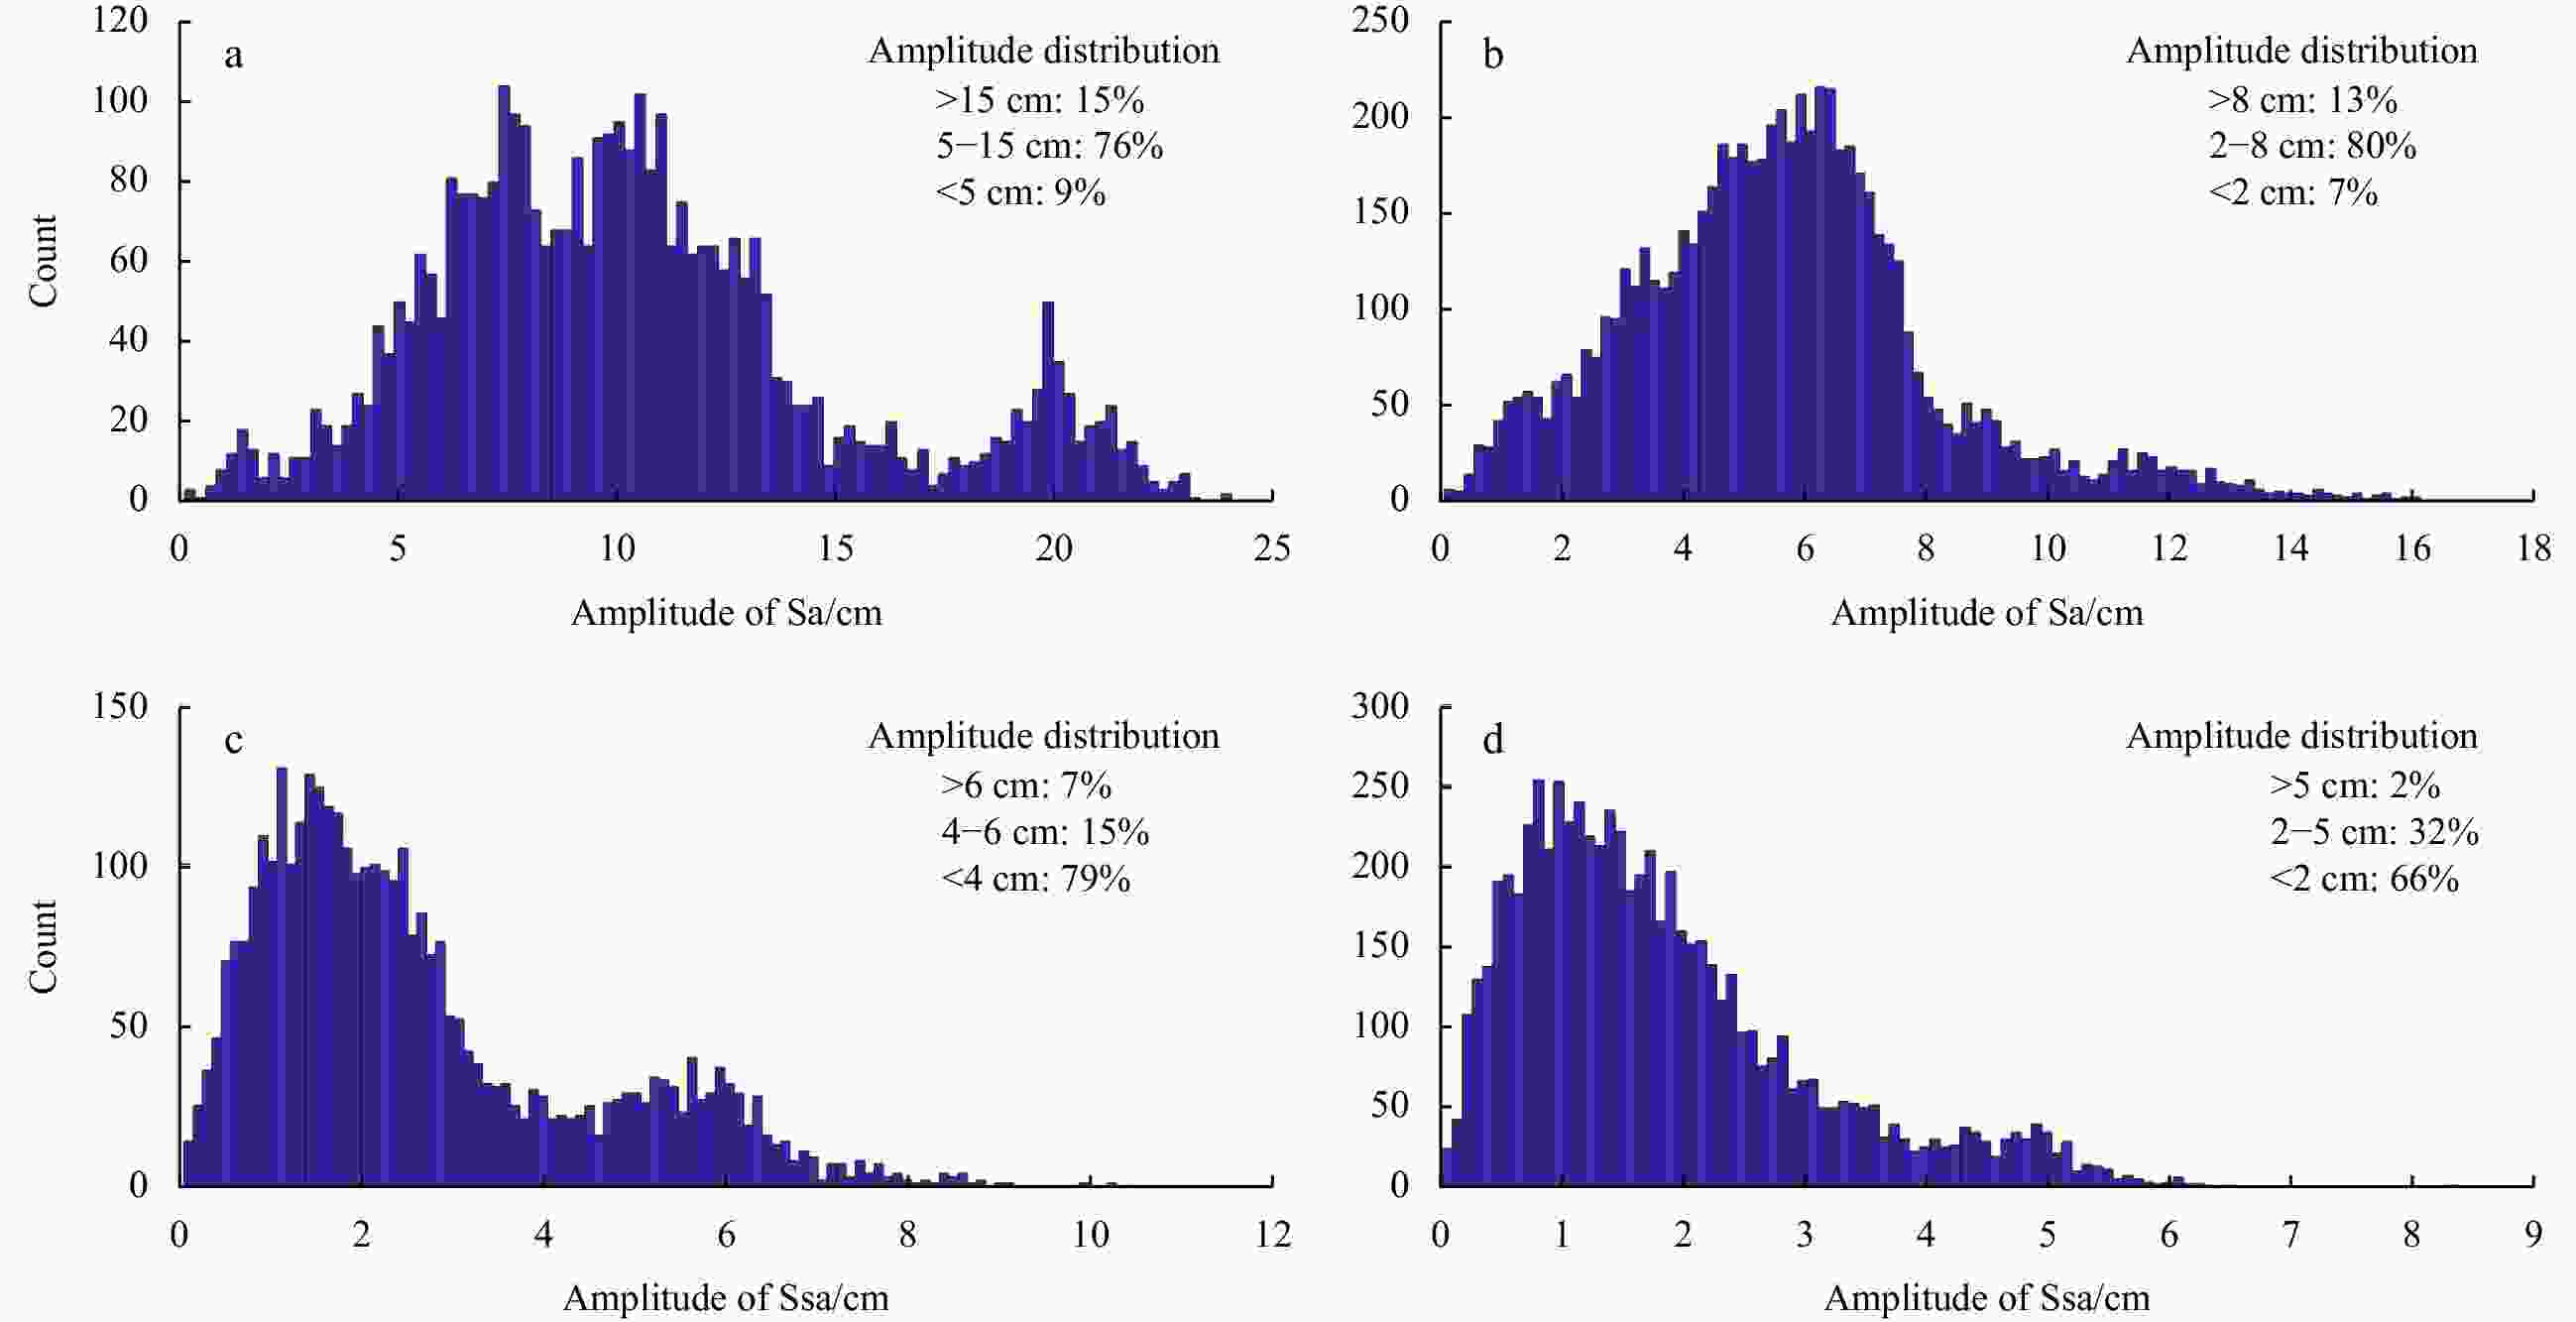
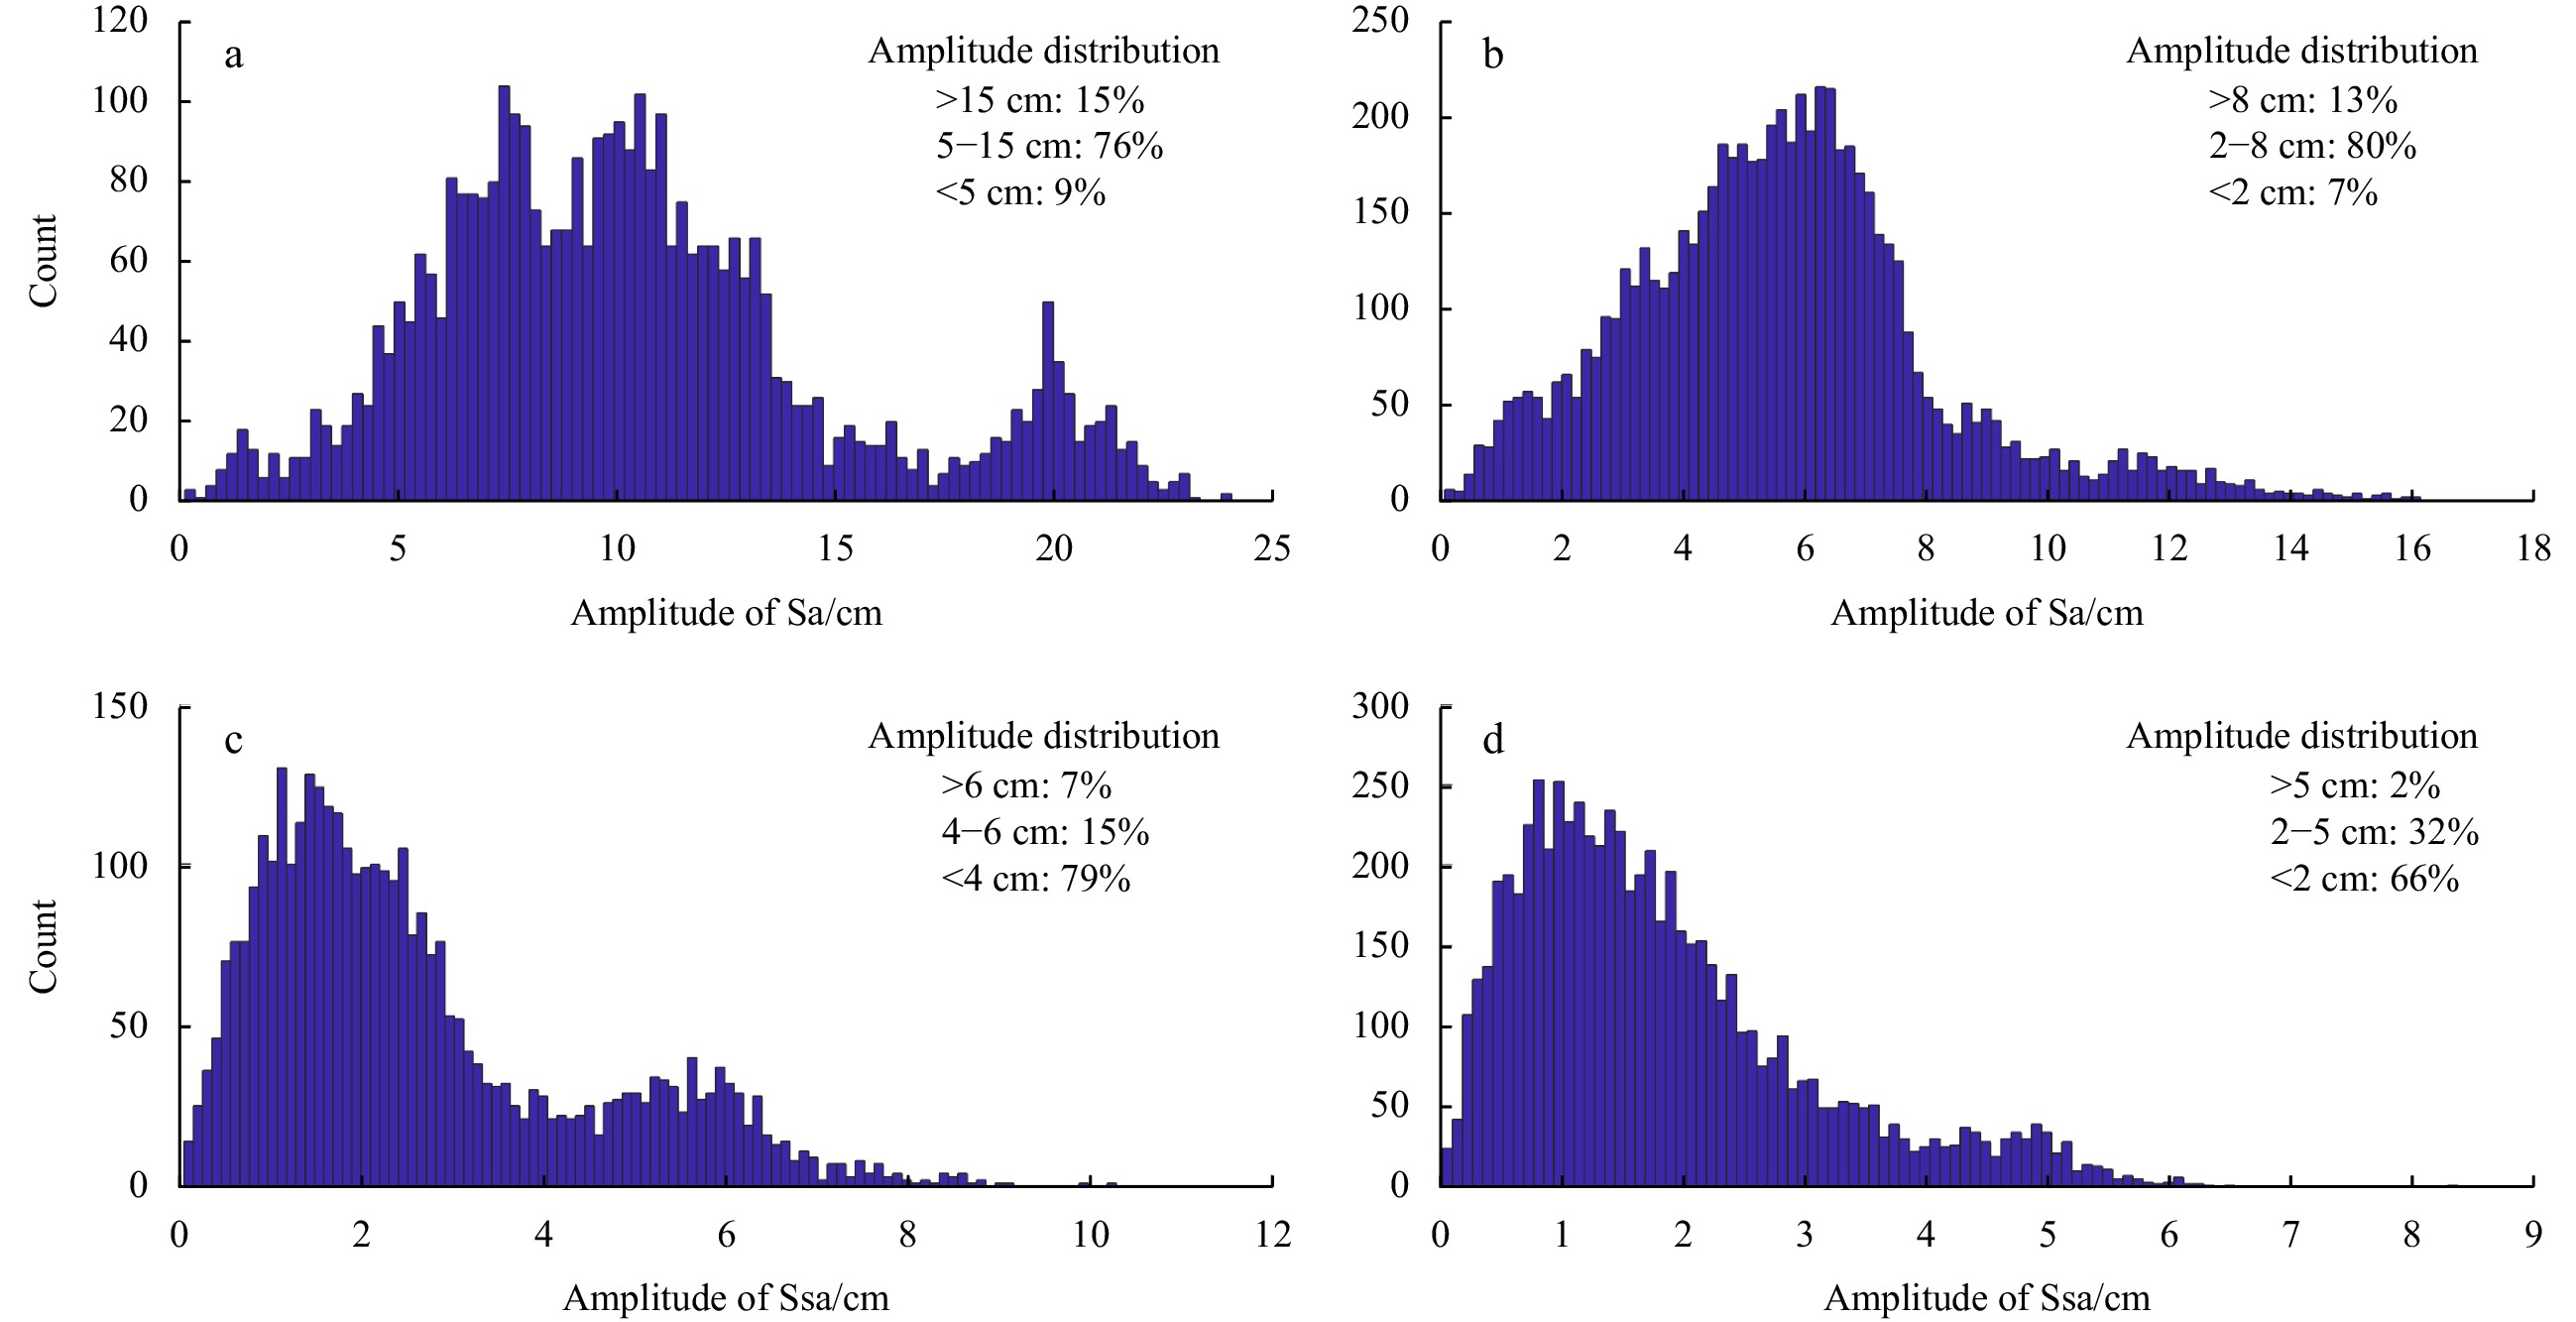
Figure 4. Statistics of amplitude values of annual (Sa) and semiannual (Ssa) in offshore (depth < 200 m, a and c) and deep-sea (depth > 200 m, b and d) area.
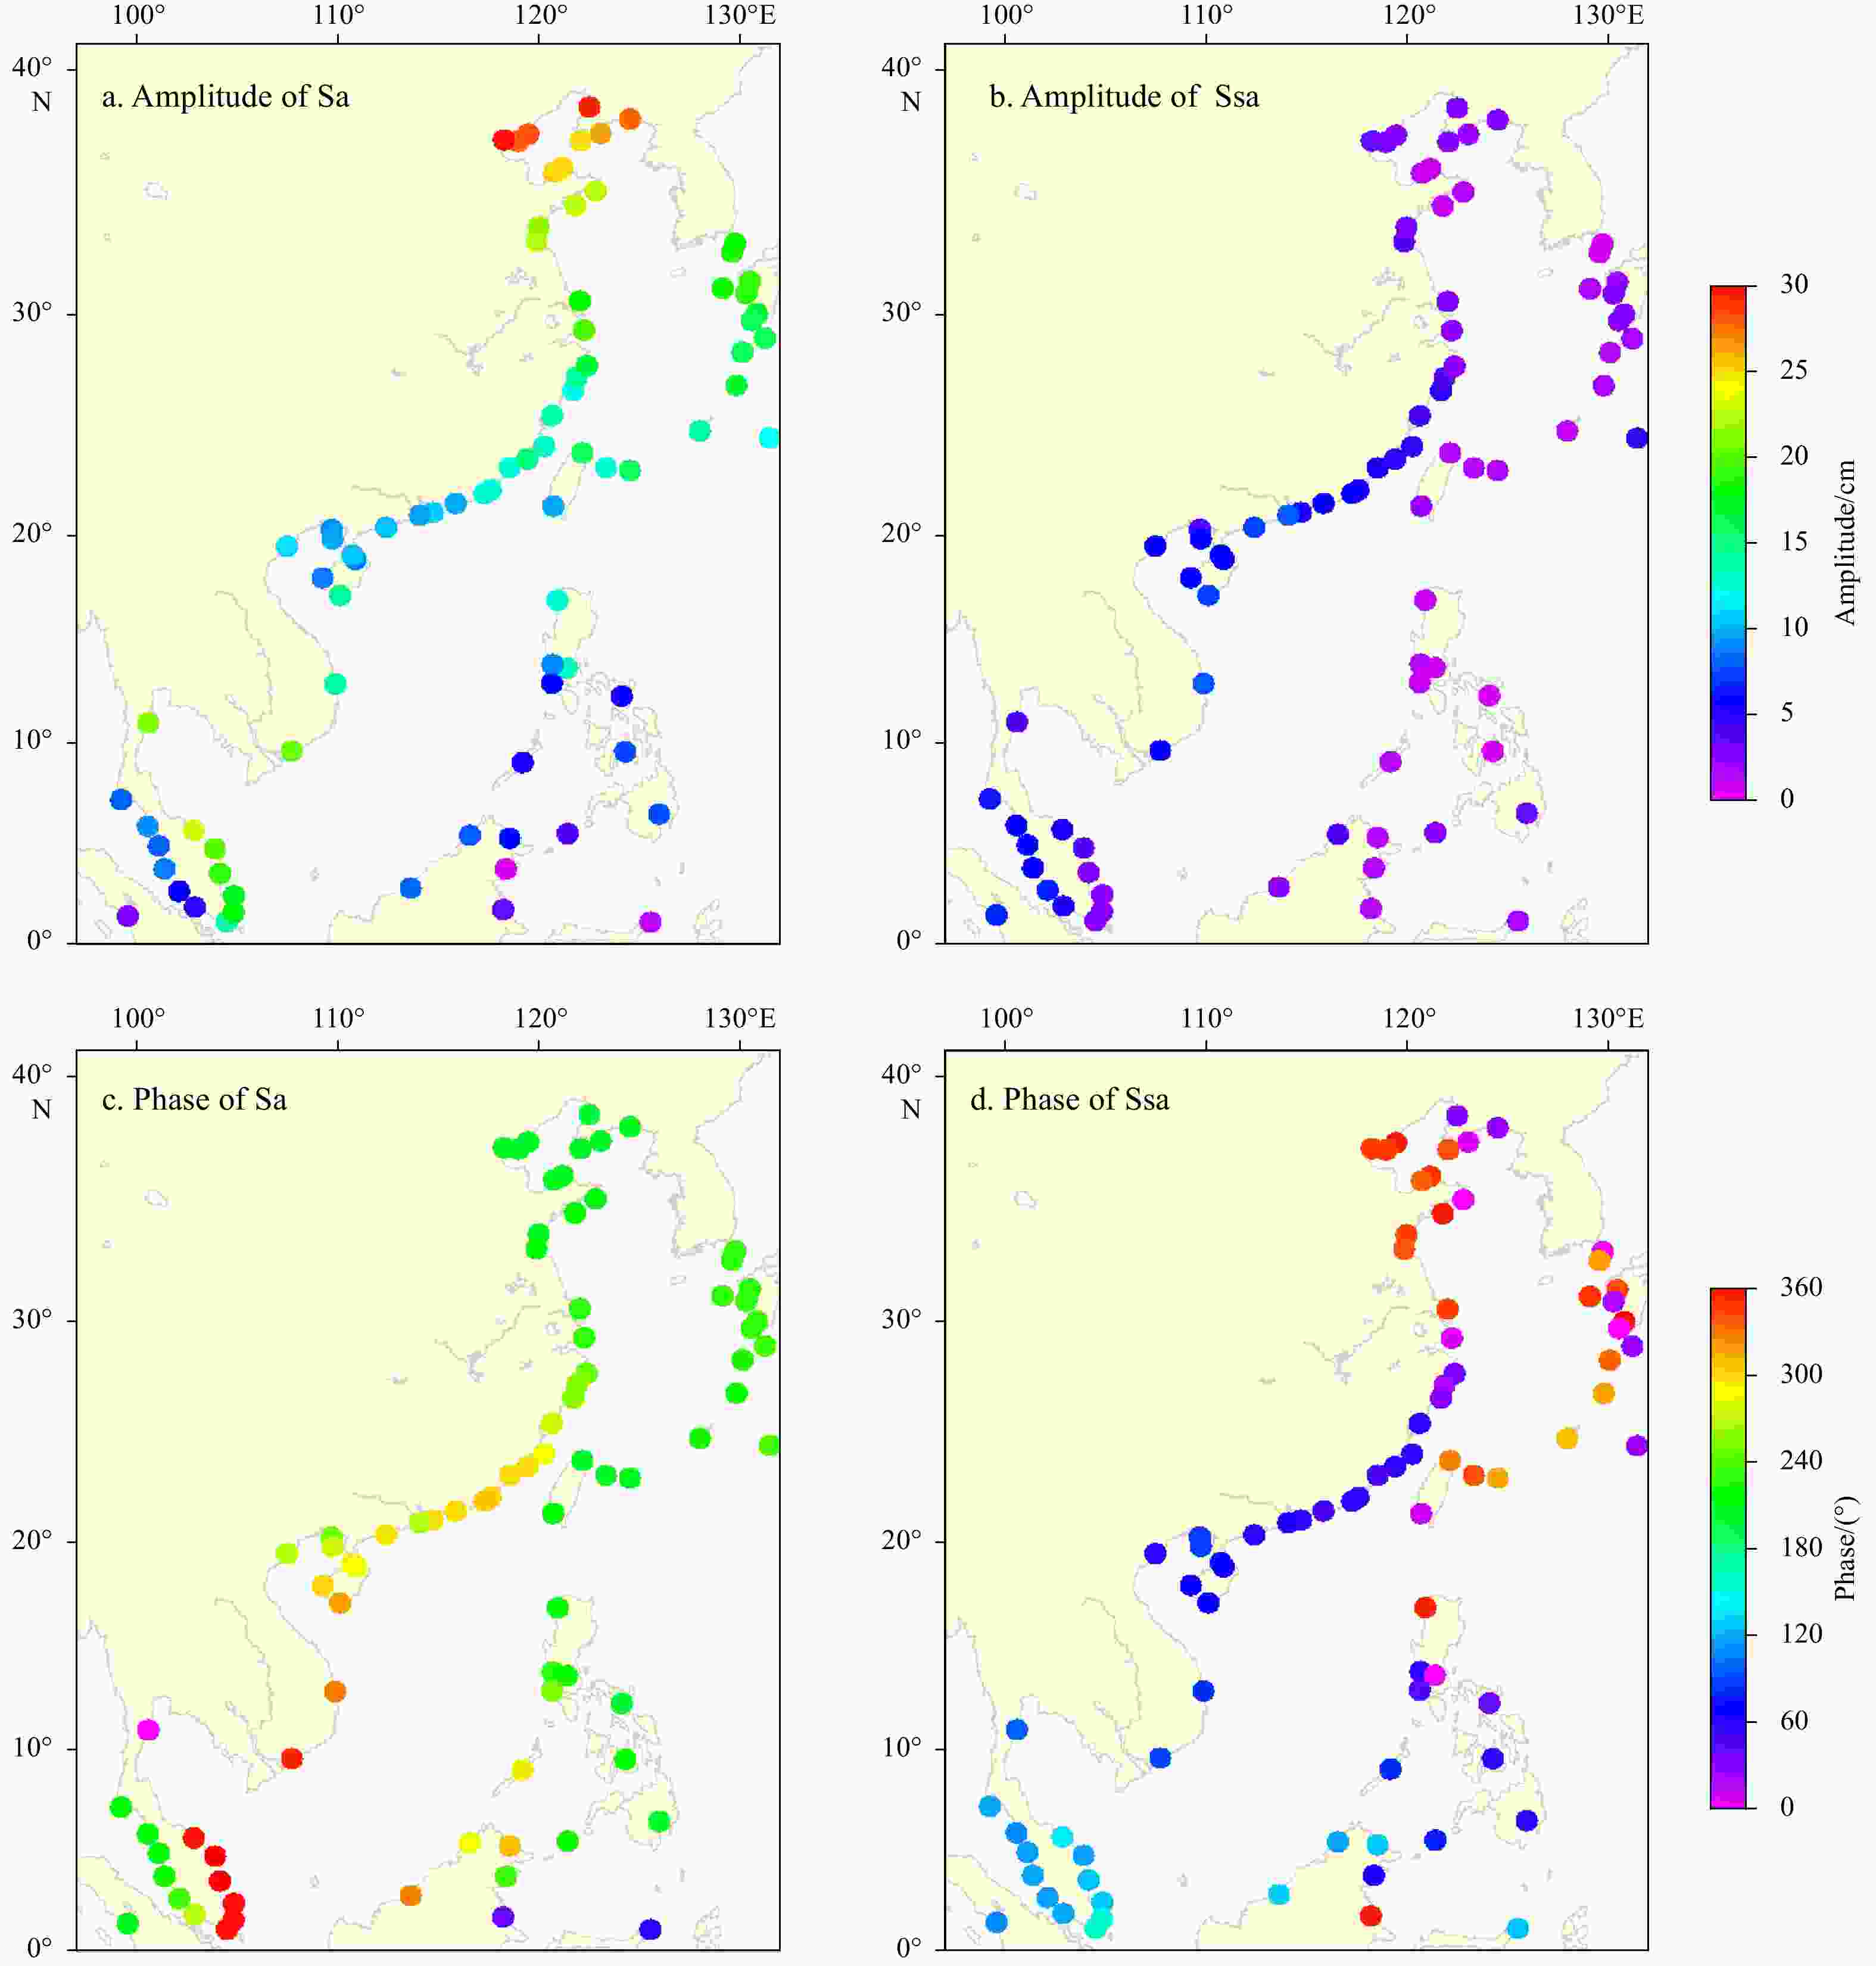
Figure 5. Long-period tidal constants of annual (Sa) and semiannual (Ssa) tidal constituents at the 82 tide gauge stations.
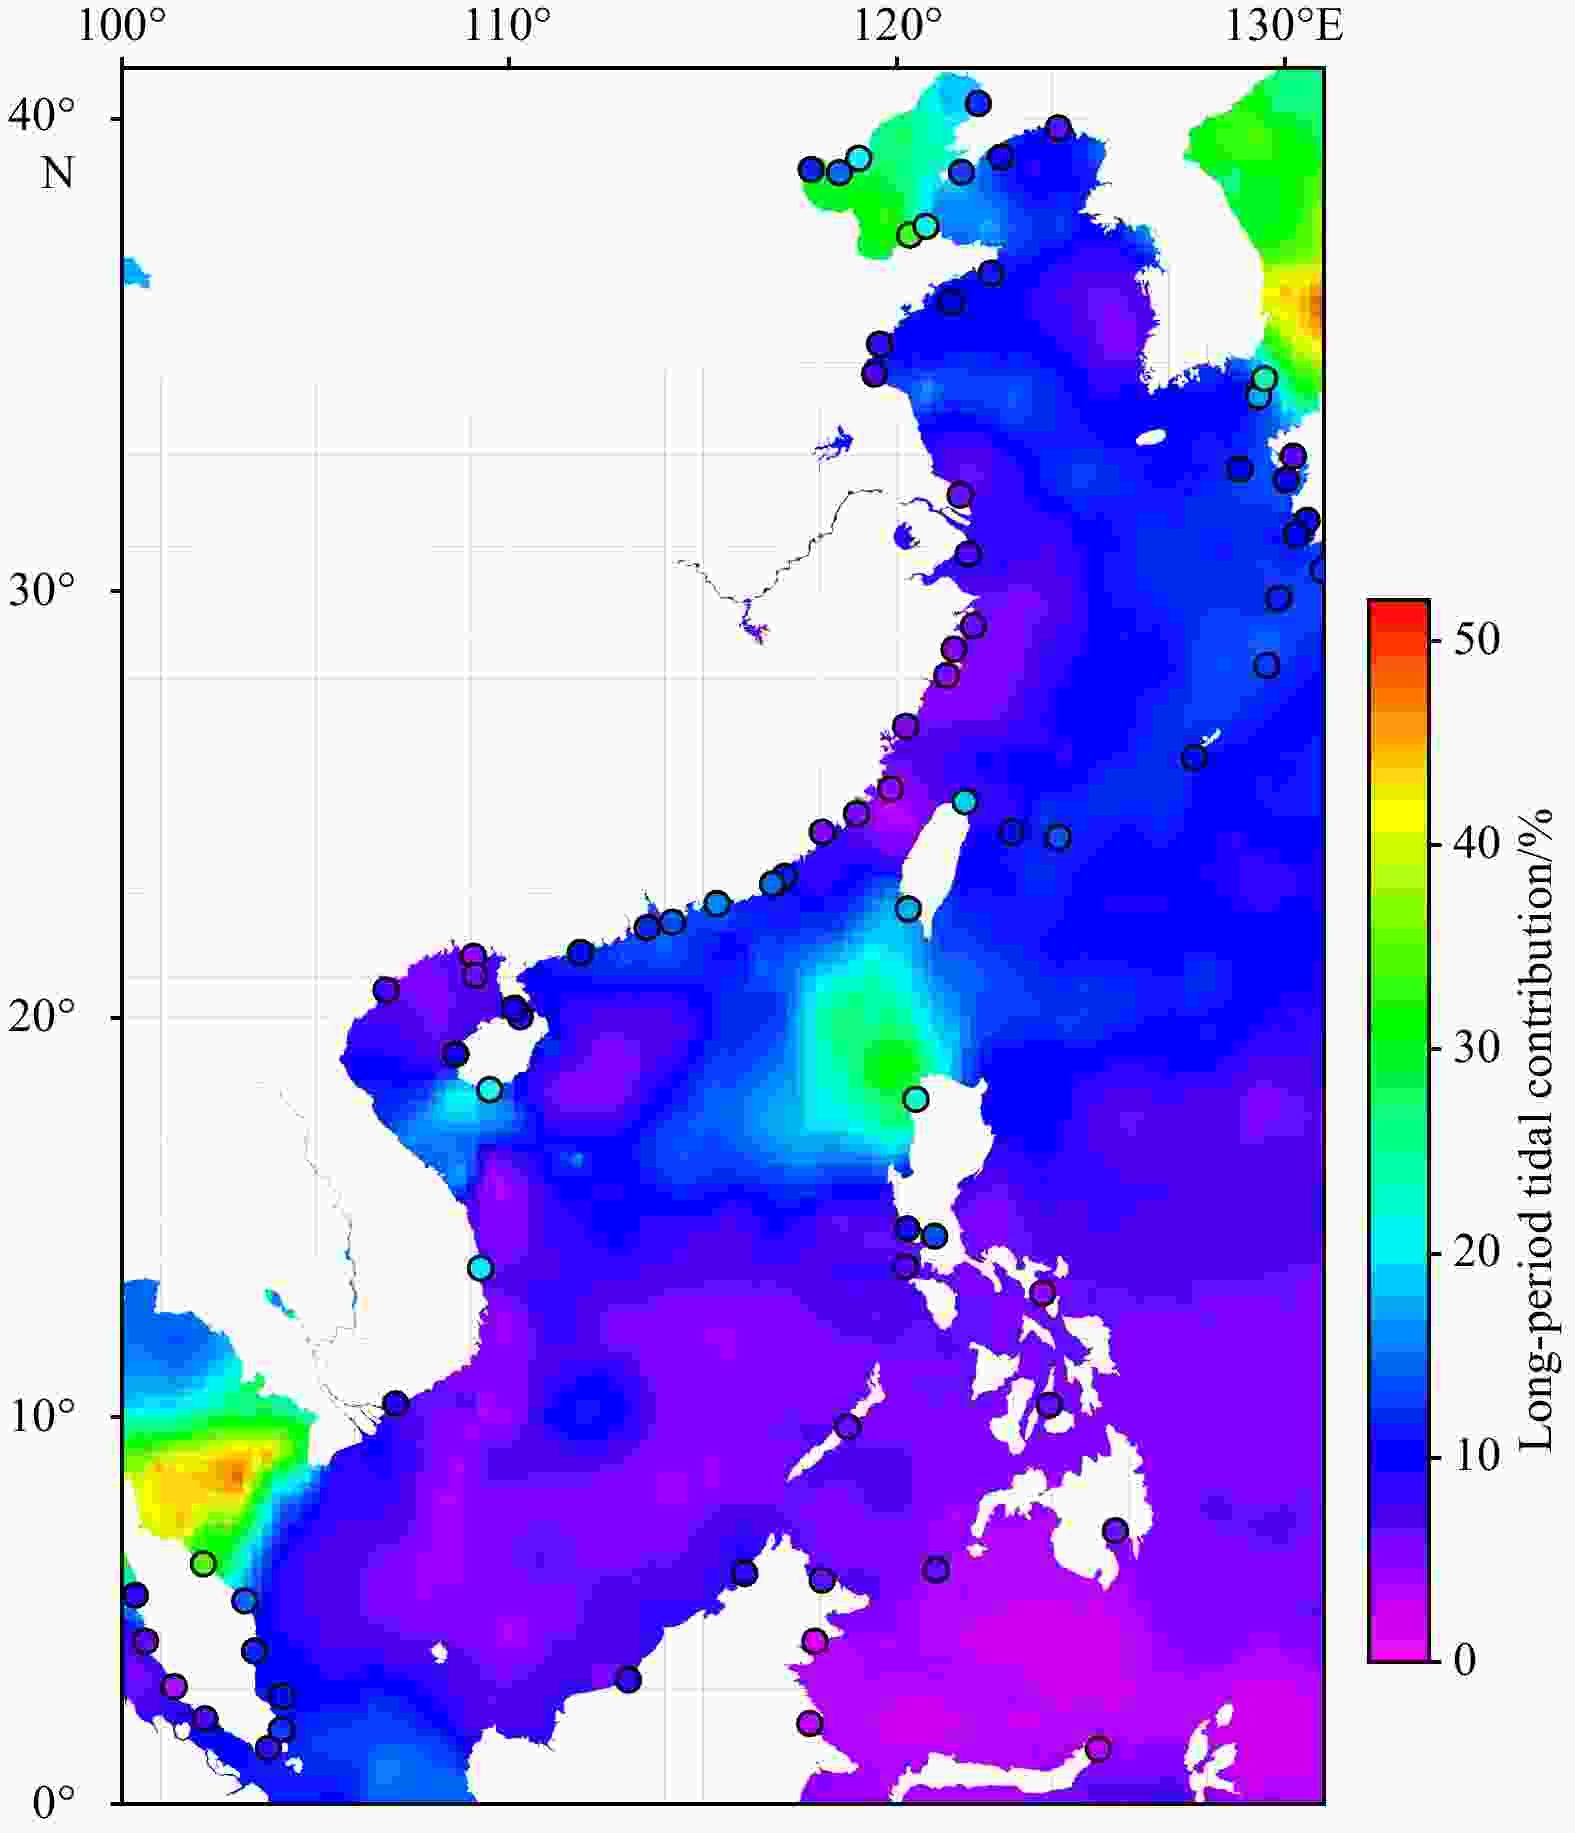
Figure 6. Spatial distribution of satellite-derived long-period tidal contributions. Colored dots depict results from the tide gauge stations.

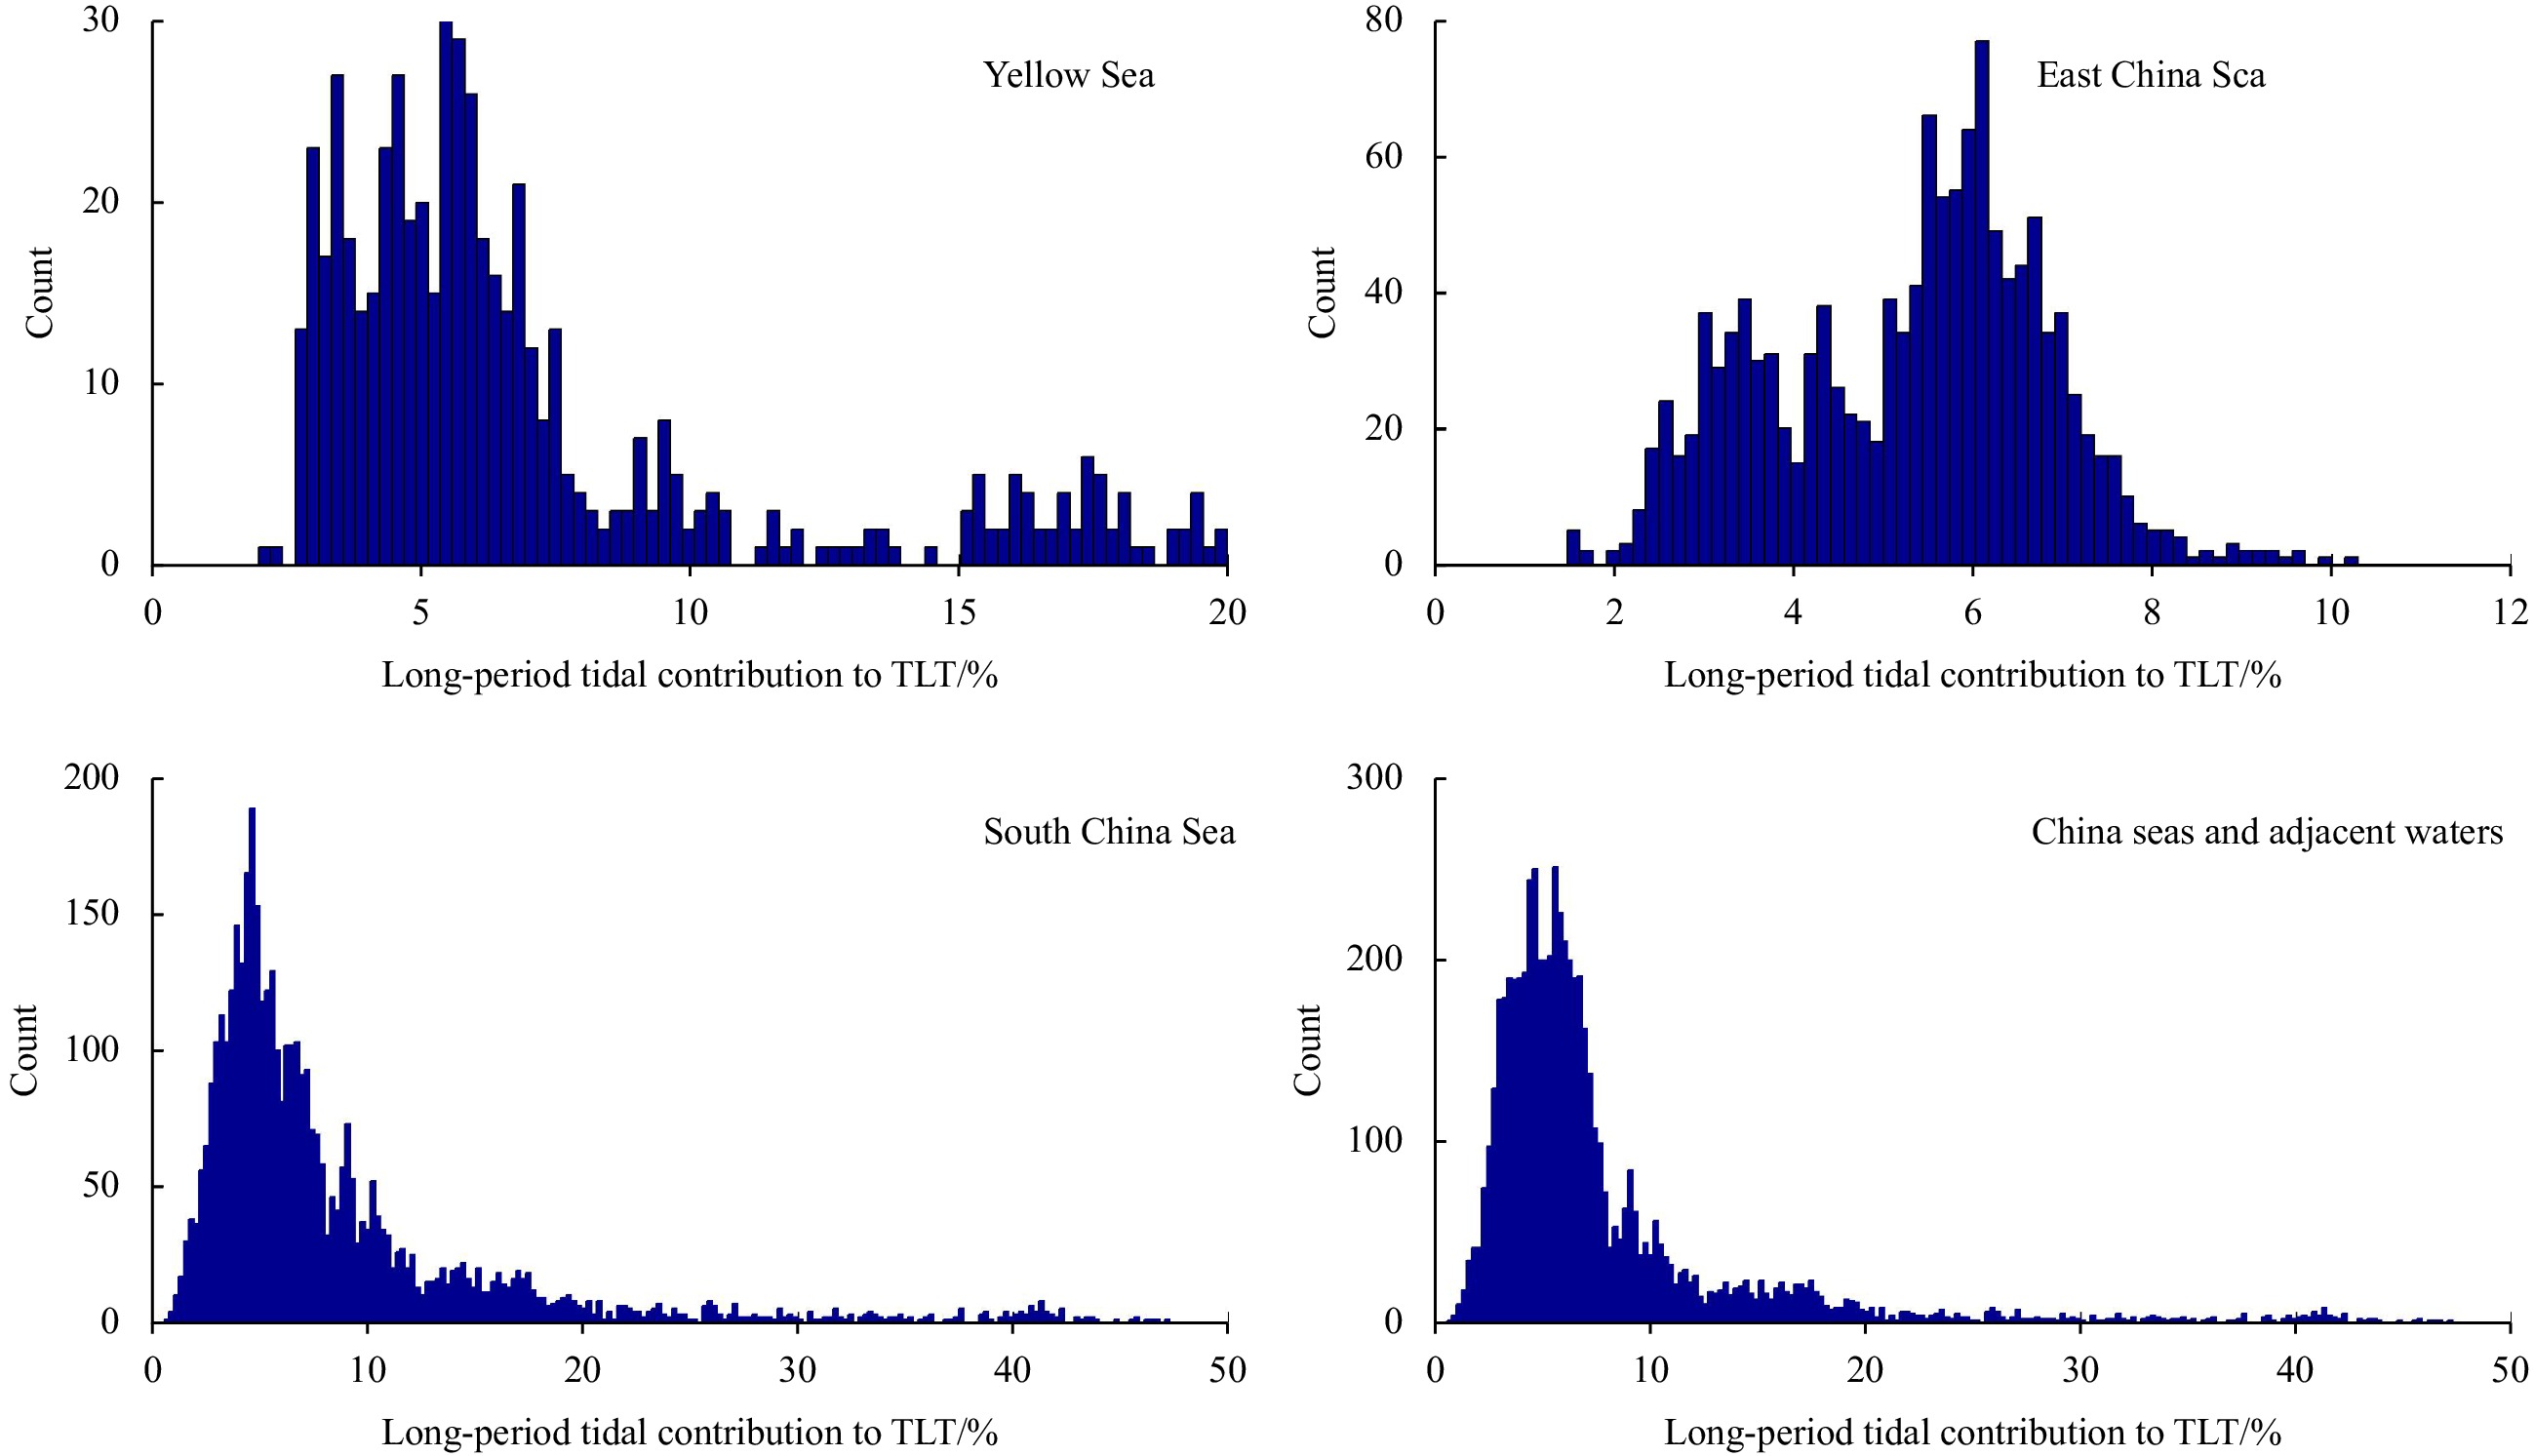
Figure 7. Distribution of the long-period tidal constituent contributions to the theoretical lowest tide (TLT).
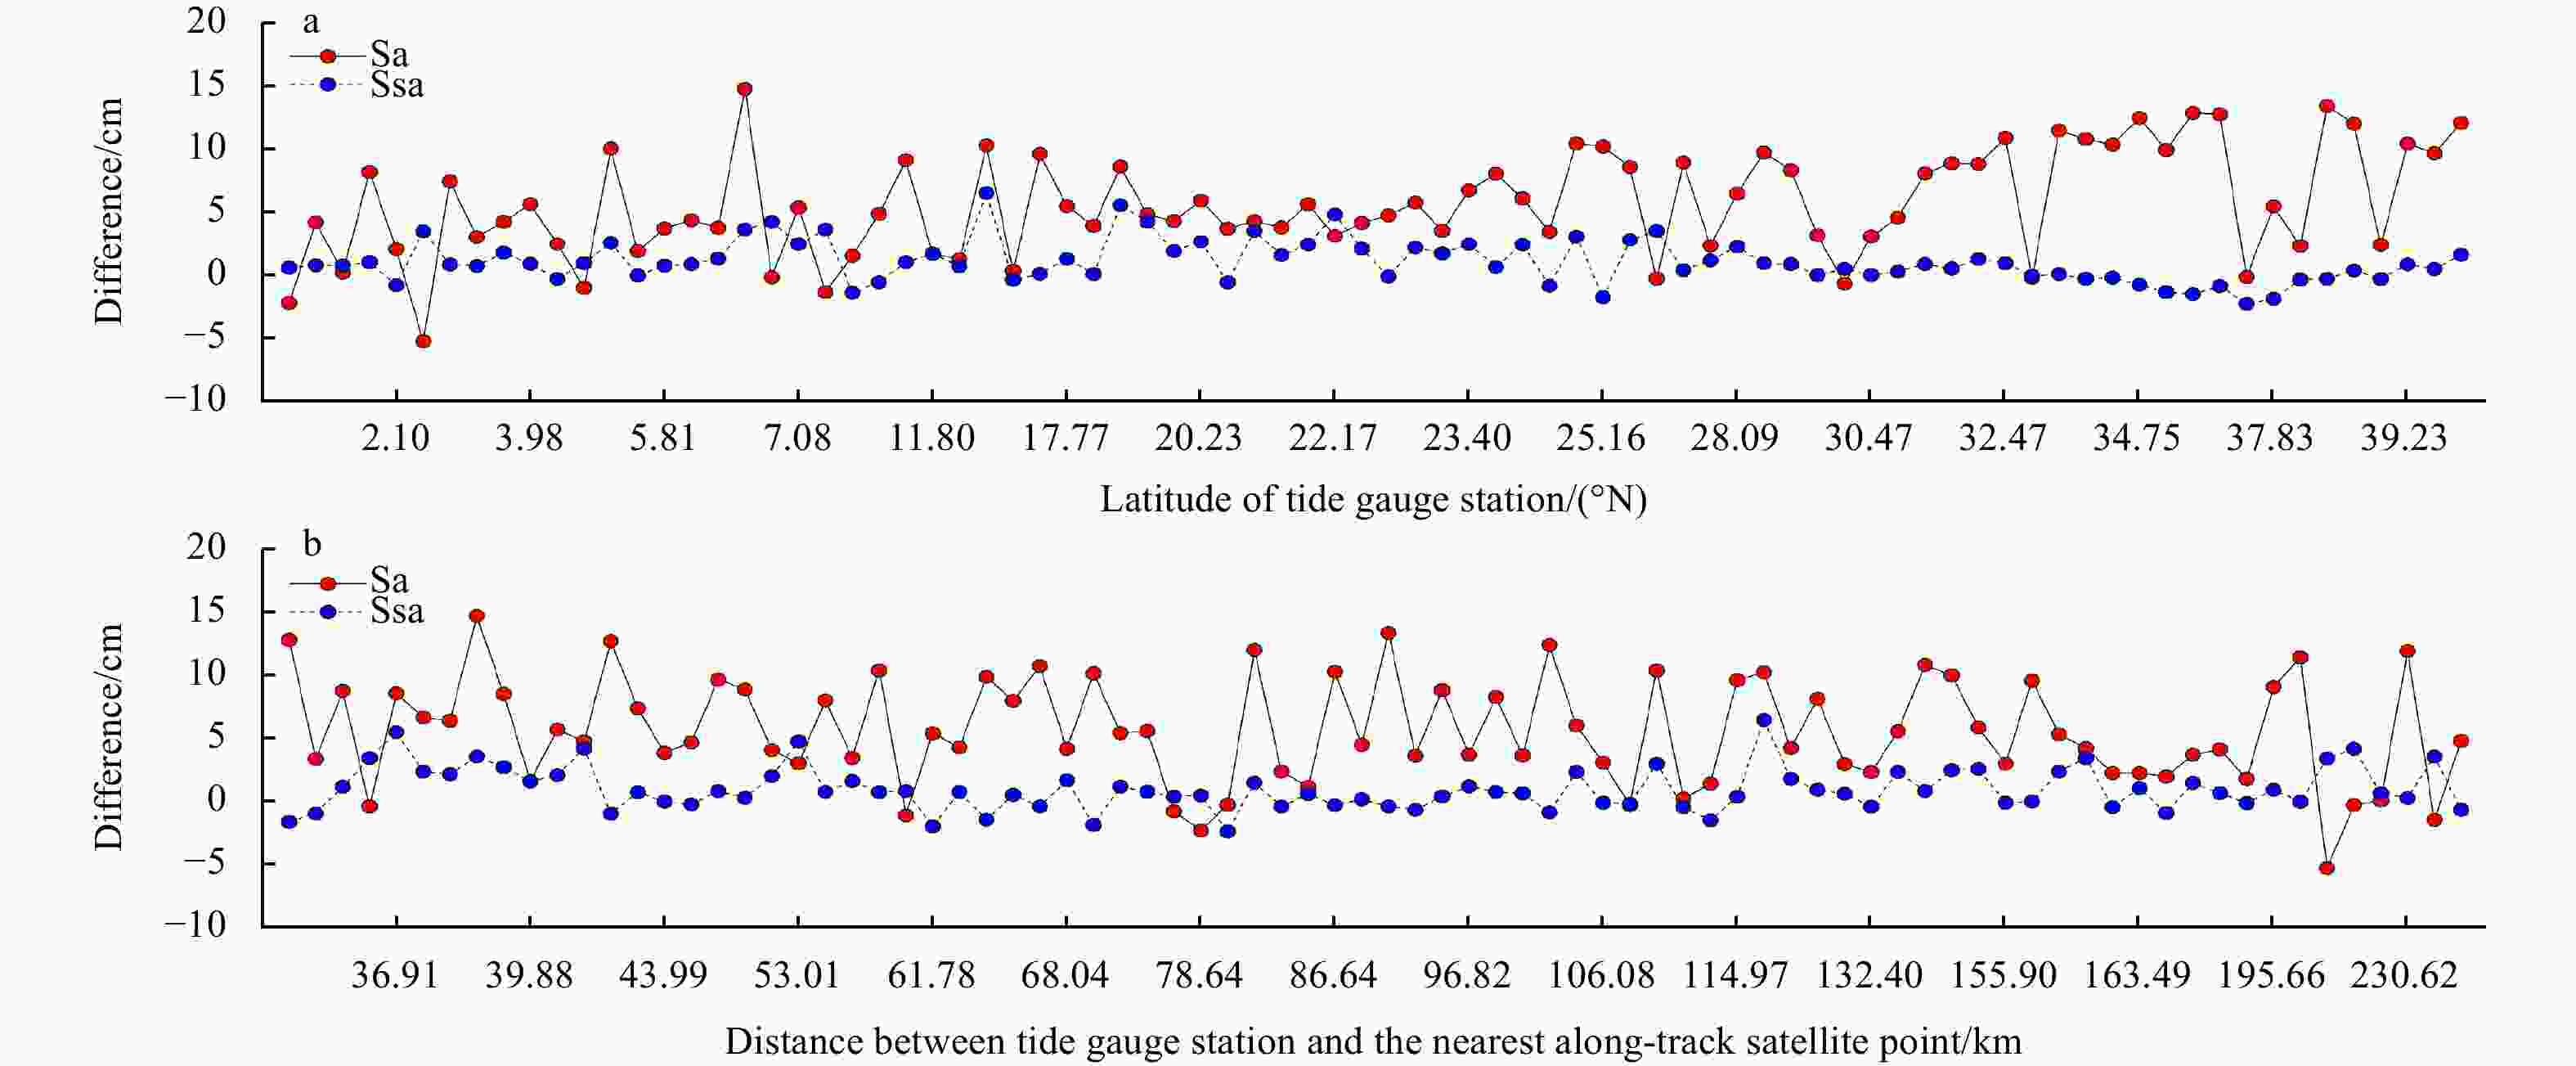
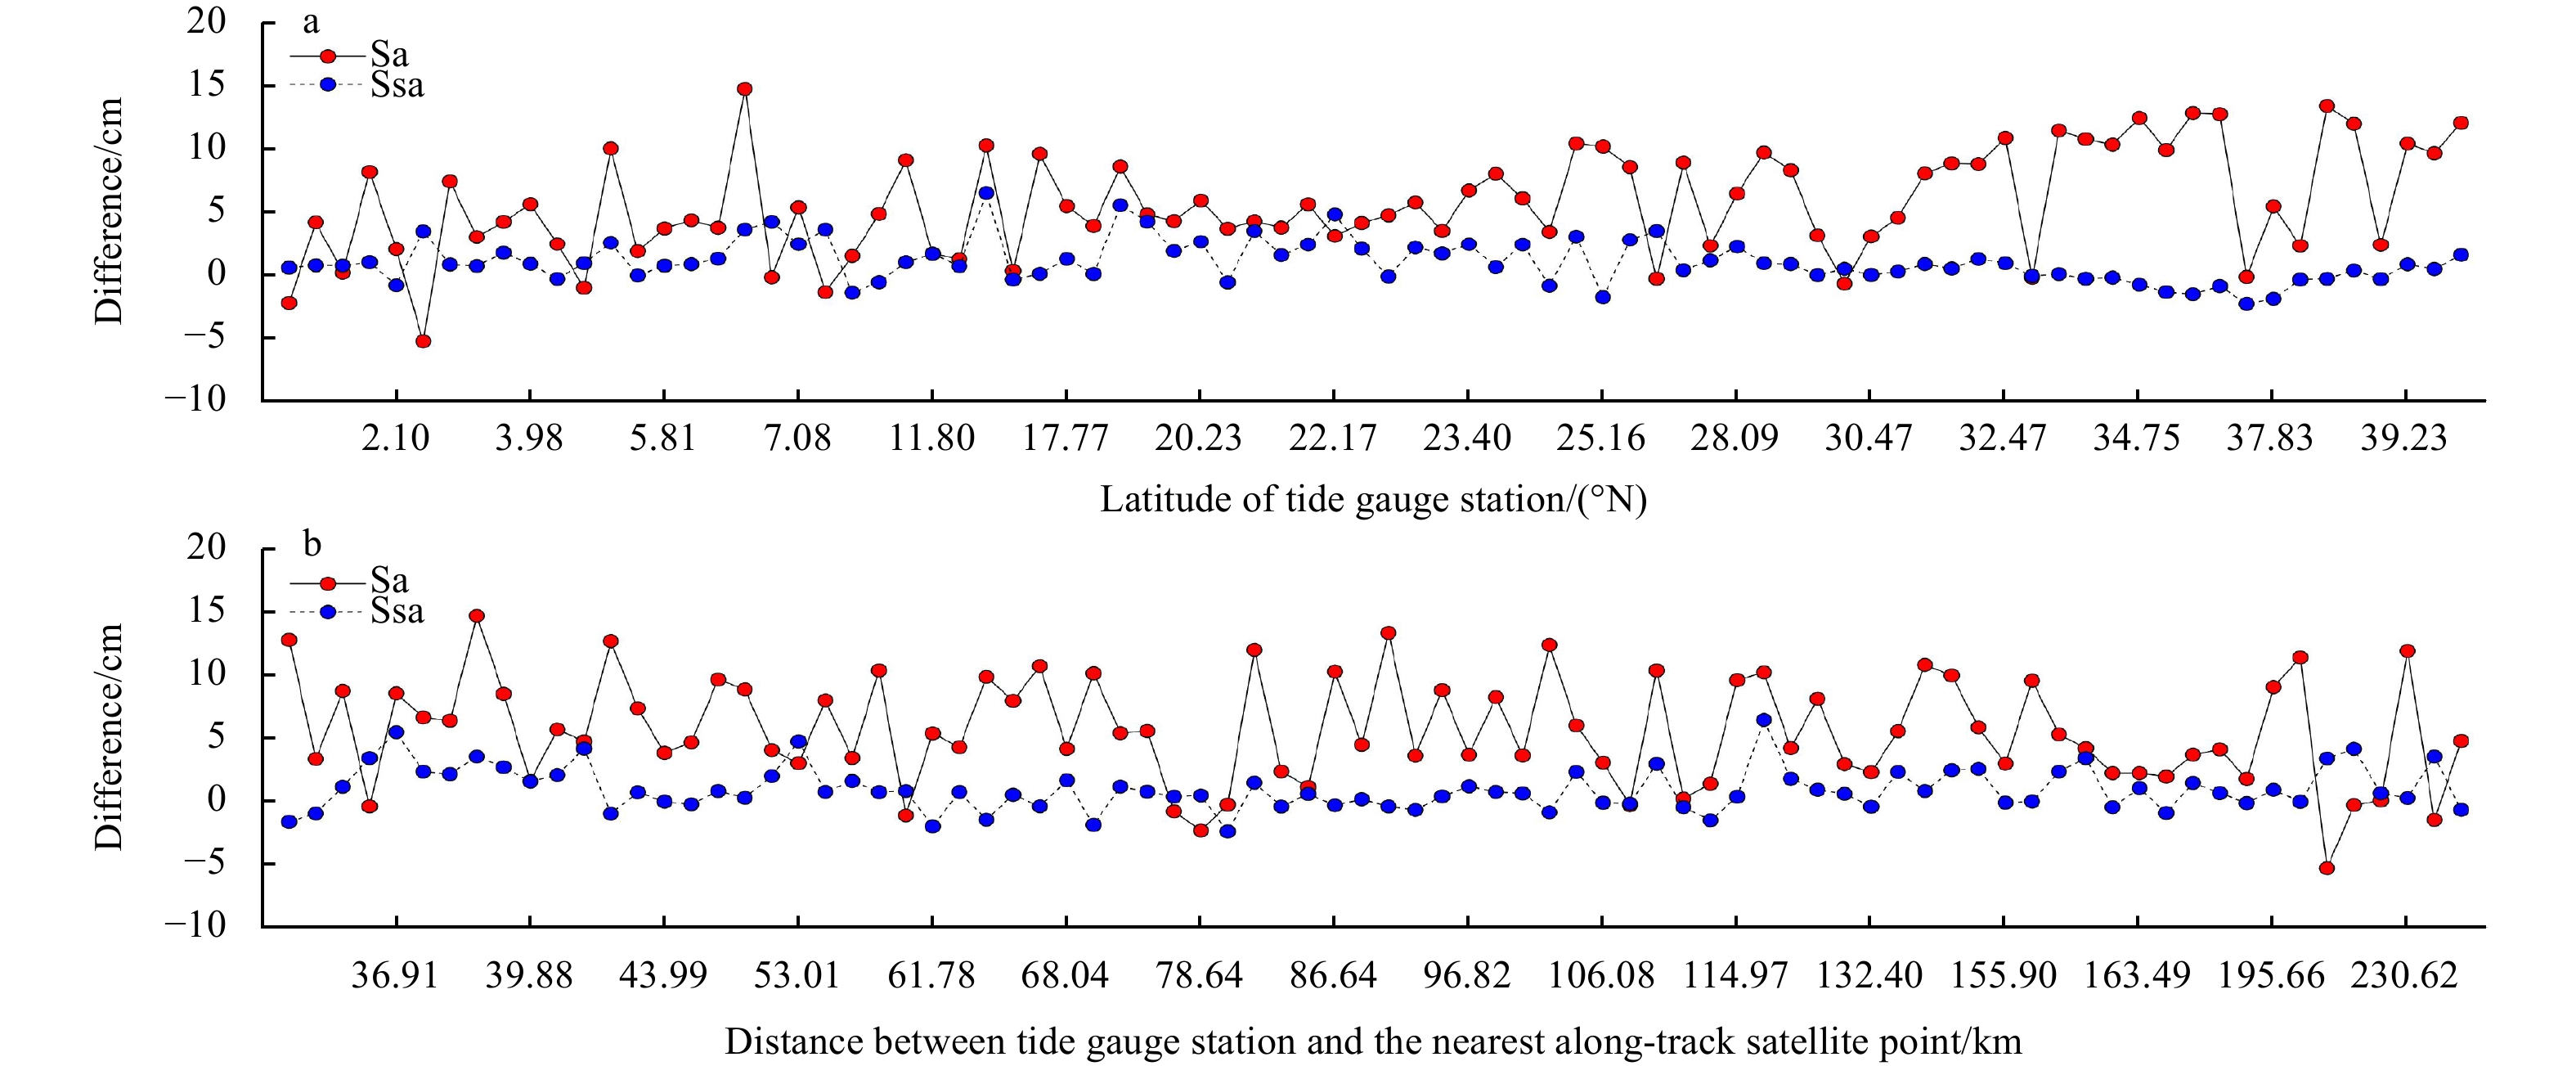
Figure 8. Annual (Sa) and semiannual (Ssa) tidal amplitude differences as a function of the latitude of the tide gauge stations (a), and the distance between the tide gauge stations and the nearest satellite along-track point (b).
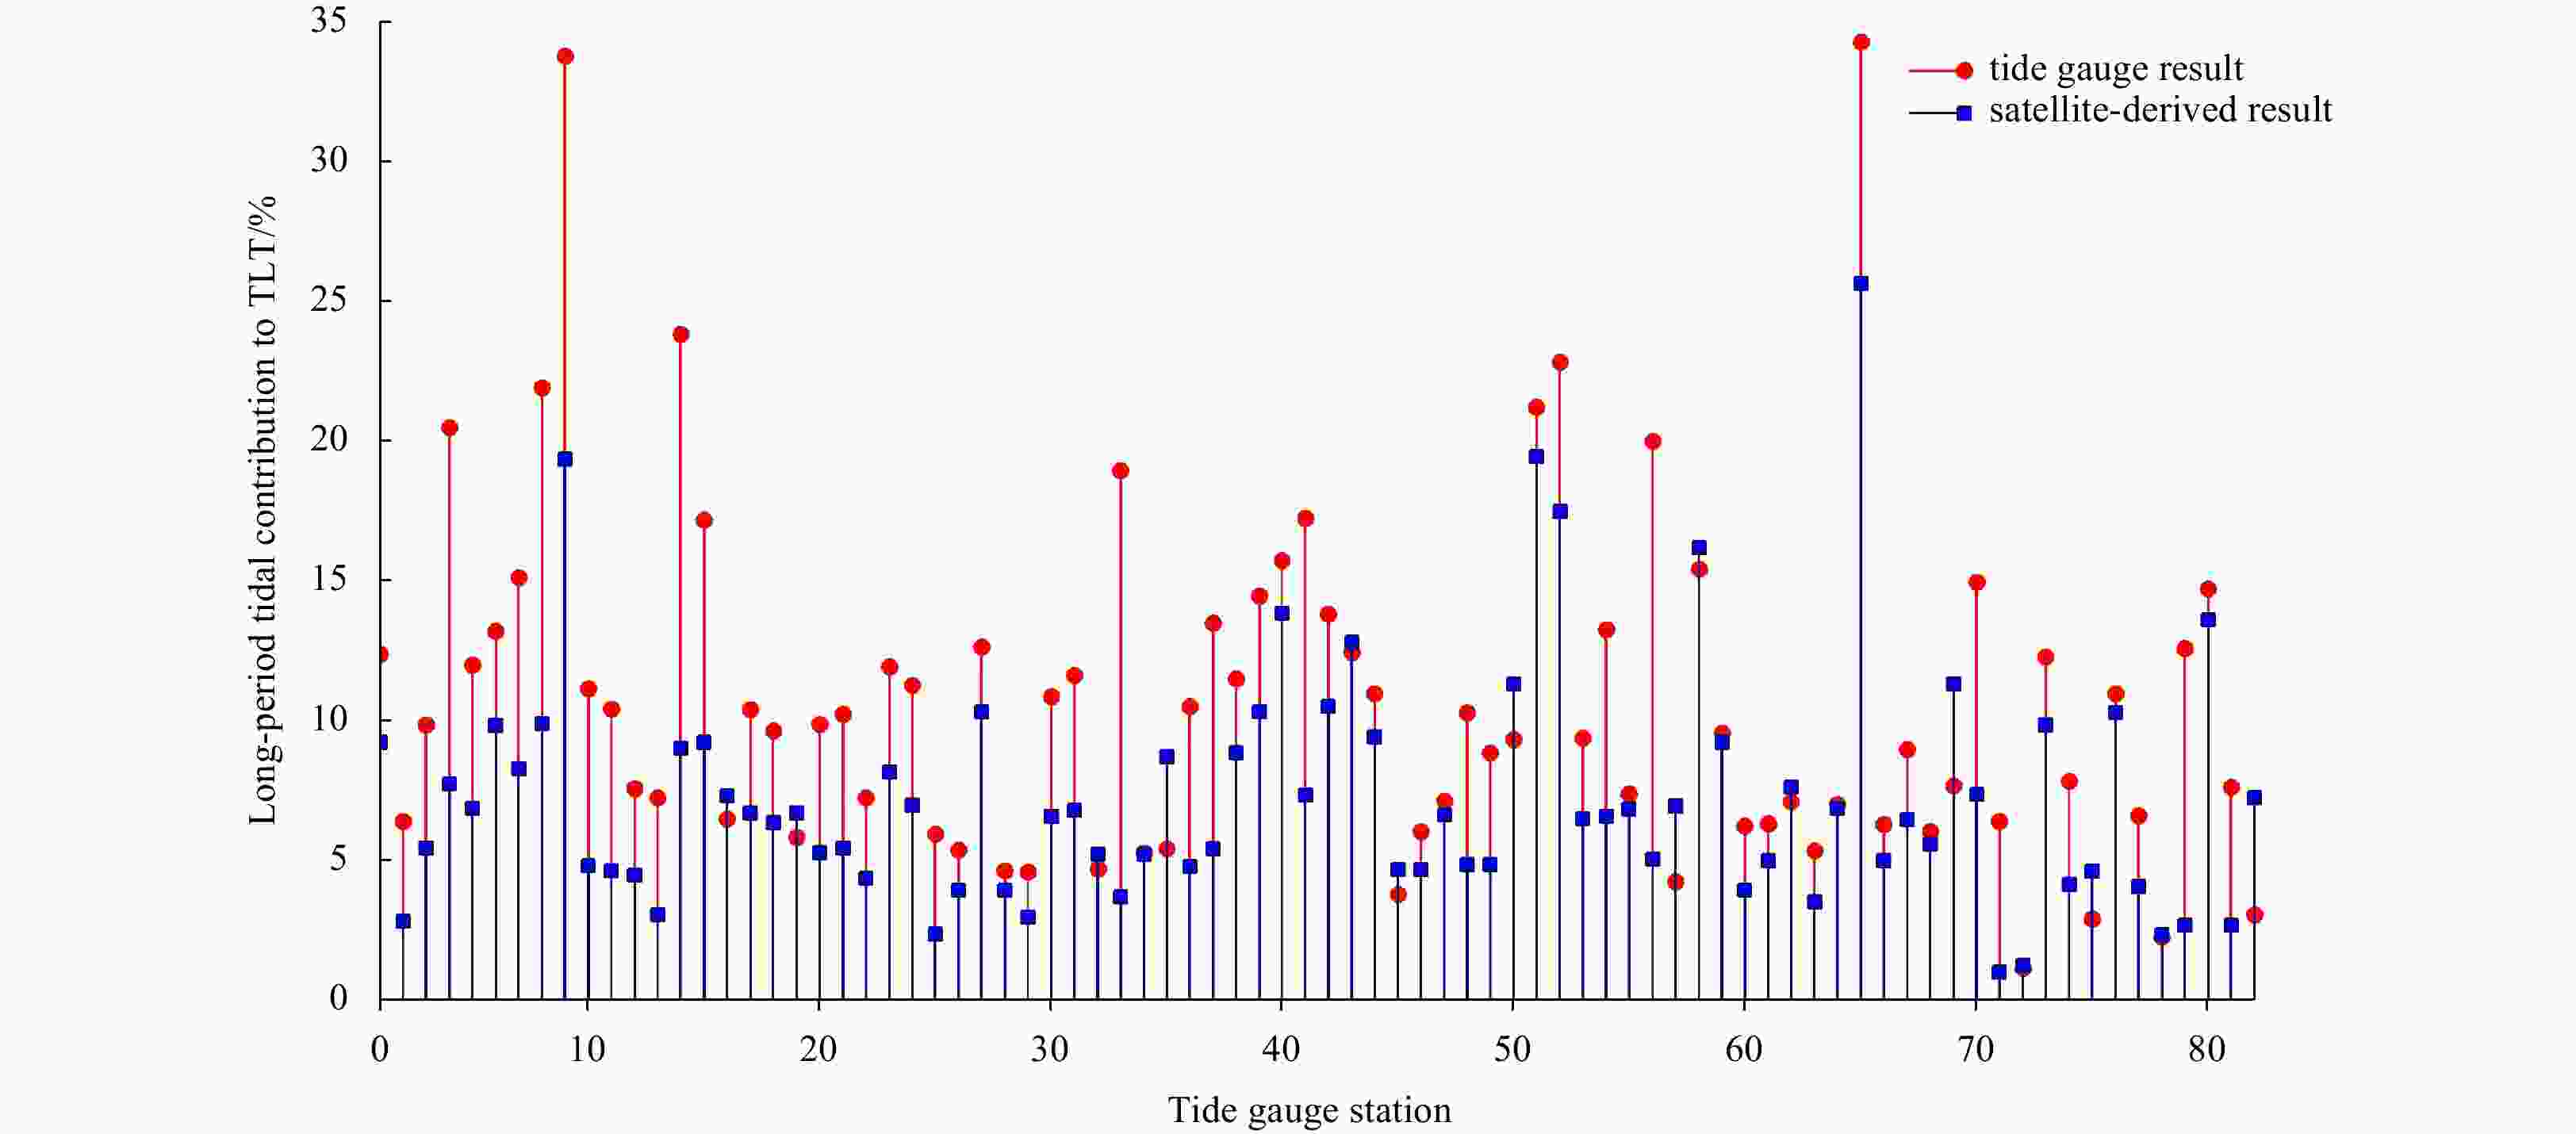
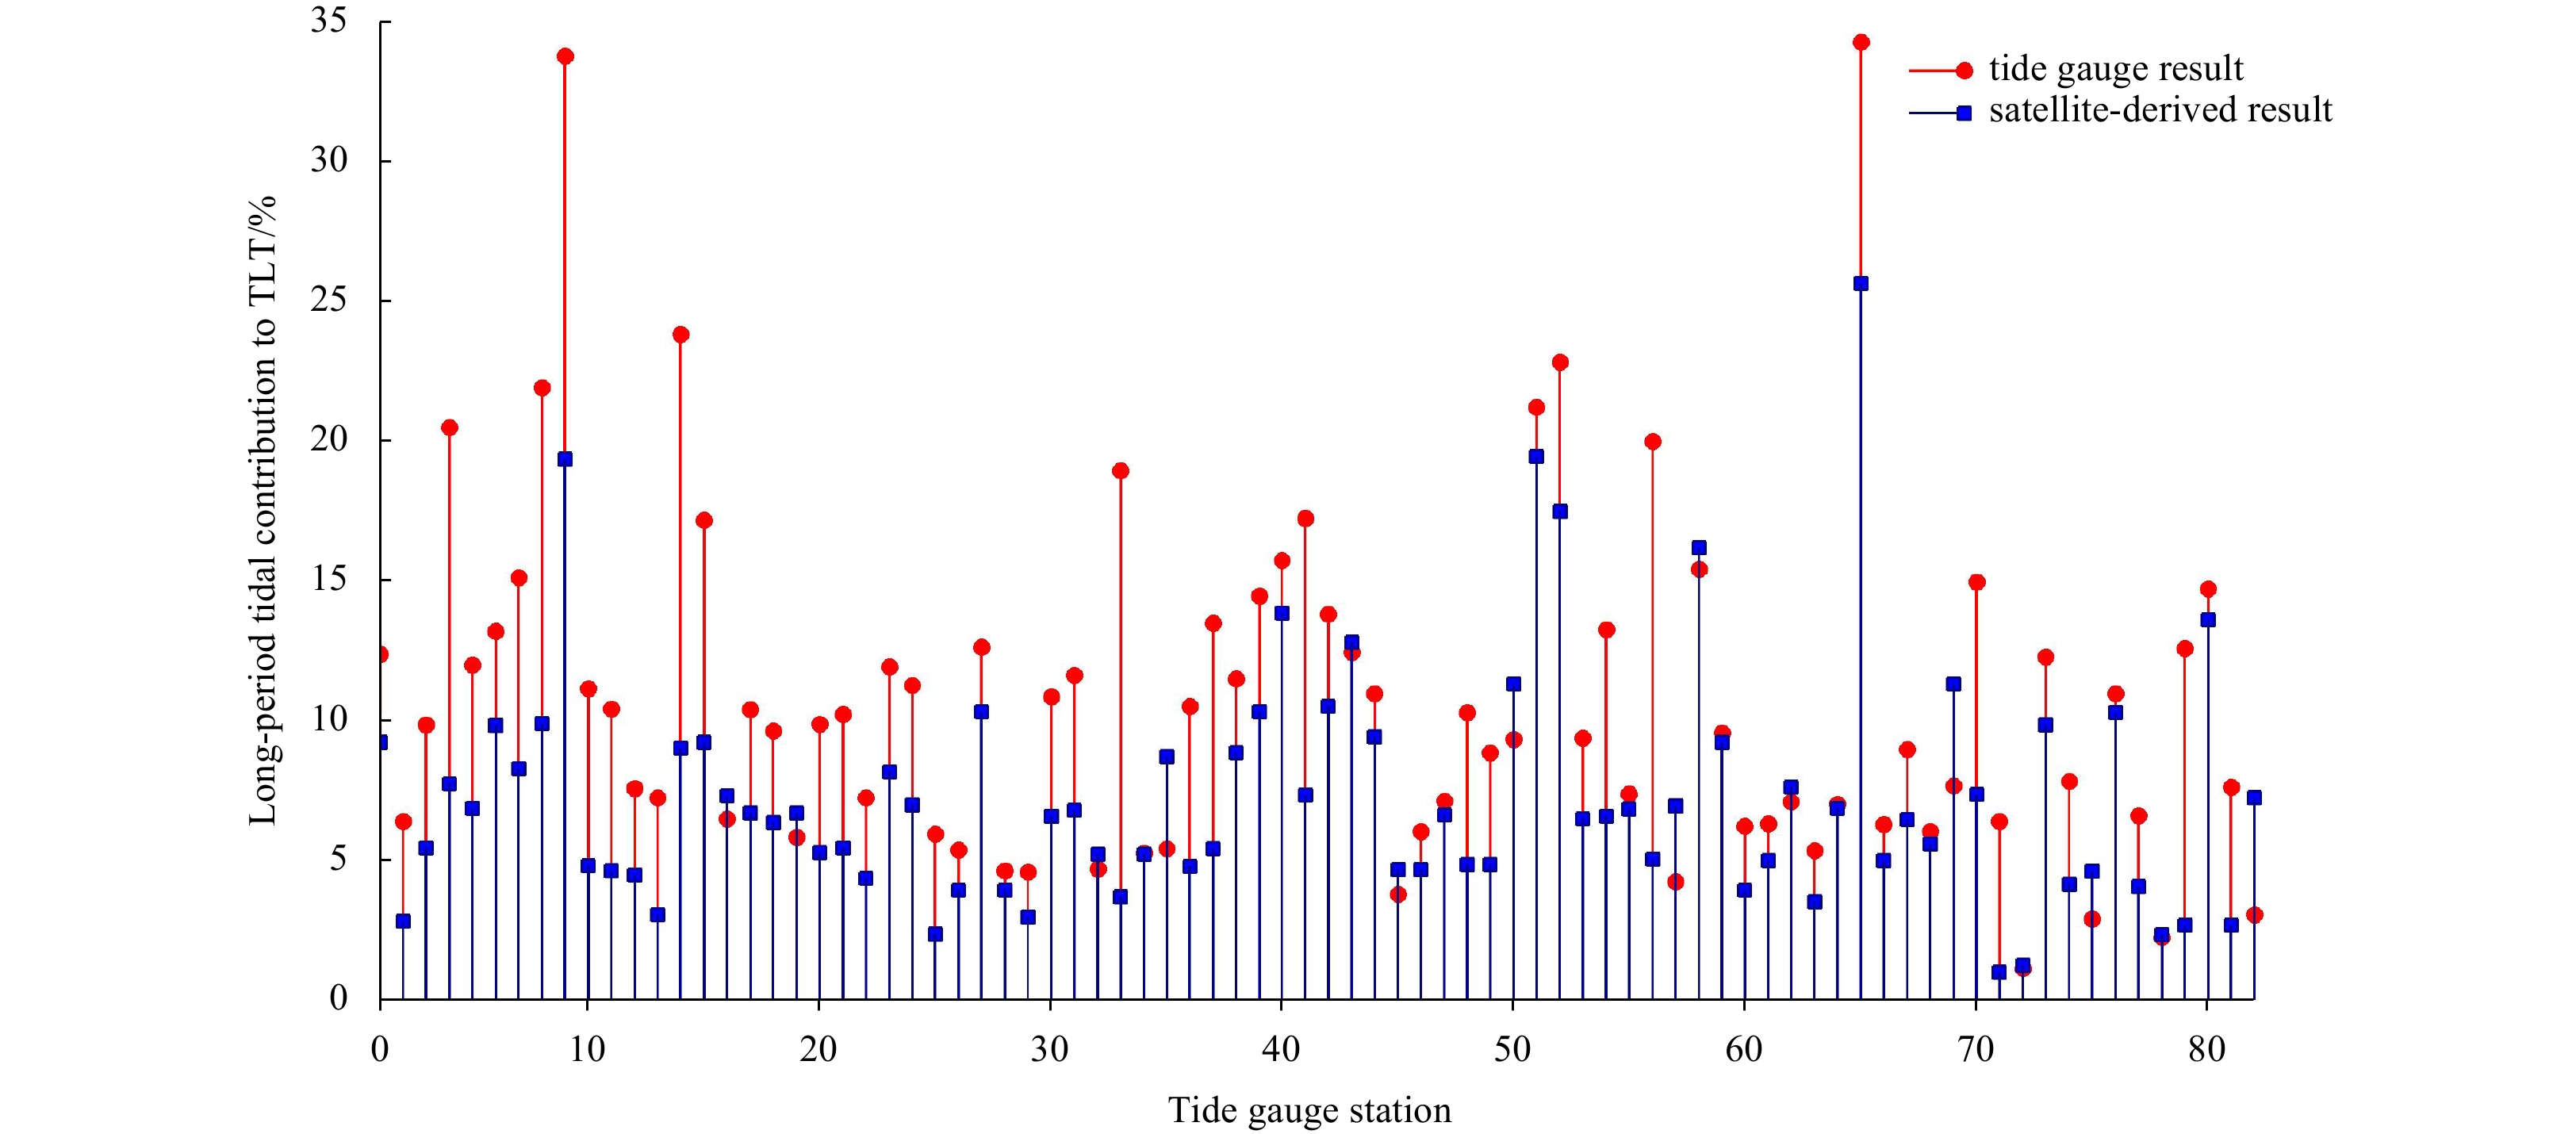
Figure 9. Comparison of long-period tidal contributions between tide gauge results and satellite-derived results.
Table 1. Geographical information and harmonic constants of annual (Sa) and semiannual (Ssa) long-period tidal constituents at the Chinese tidal gauge stations
Station No. Latitude Longitude Sa Ssa Amplitude/cm Amplitude_err/cm Phase Phase_err Amplitude/cm Amplitude_err/cm Phase Phase_err 1 40.30°N 122.10°E 29.12 2.66 201.39° 5.44° 2.89 2.38 32.40° 52.58° 2 39.82°N 124.15°E 27.55 2.72 207.66° 5.83° 3.21 2.31 28.94° 49.13° 3 39.23°N 122.67°E 26.06 2.99 208.31° 11.45° 2.22 2.88 8.46° 31.01° 4 39.21°N 119.01°E 28.27 2.28 204.85° 4.76° 2.79 3.21 352.59° 44.48° 5 38.98°N 117.78°E 29.75 2.10 203.27° 10.51° 3.51 1.80 342.81° 19.70° 6 38.92°N 118.51°E 27.52 2.27 203.63° 10.18° 3.18 2.39 344.52° 38.74° 7 37.83°N 120.74°E 24.82 2.45 210.42° 2.08° 1.39 2.48 346.74° 53.38° 8 37.65°N 120.32°E 25.12 2.15 209.95° 5.45° 1.47 2.18 331.86° 78.95° 9 36.87°N 122.42°E 22.15 2.11 215.09° 6.37° 1.72 1.91 2.79° 47.21° 10 36.27°N 121.38°E 22.38 3.01 216.26° 11.97° 1.48 2.73 351.93° 31.51° 11 30.83°N 121.83°E 19.77 2.15 227.49° 5.44° 2.52 1.97 6.50° 85.80° 12 29.22°N 121.97°E 16.55 2.98 244.01° 11.50° 2.69 2.96 38.39° 33.42° 13 28.69°N 121.47°E 14.19 2.27 253.30° 5.06° 3.76 2.01 23.76° 89.55° 14 26.92°N 120.22°E 13.61 2.78 274.62° 10.96° 4.38 2.56 57.26° 36.11° 15 25.47°N 119.83°E 13.22 2.03 283.79° 8.64° 4.61 2.26 55.42° 17.03° 16 24.88°N 118.95°E 15.07 2.91 296.64° 11.98° 4.87 2.62 60.15° 30.16° 17 23.40°N 117.10°E 13.06 1.79 301.71° 5.08° 5.27 1.71 57.36° 68.61° 18 23.22°N 116.78°E 13.00 2.27 302.15° 8.59° 5.67 2.33 59.45° 52.76° 19 21.02°N 109.12°E 10.01 3.07 273.42° 6.16° 6.03 3.25 86.63° 48.57° 20 20.23°N 110.13°E 10.54 1.42 292.42° 9.10° 6.29 1.46 76.82° 14.69° 21 18.23°N 109.50°E 14.45 2.02 315.19° 4.75° 7.50 2.16 69.13° 60.72° Note: err represents standard error.  下载: 导出CSV
Table 2. Geographical correction models used for tidal constituent analysis
Geography correction Edit criteria Description min/m max/m Dry tropospheric correction −2.40 −2.10 ECMWF dry tropospheric correction Wet tropospheric correction −0.60 0.00 radiometer wet tropospheric correction Ionospheric correction −0.04 0.04 smoothed dual-frequency ionospheric correction Solid earth tide −1.00 1.00 Elastic response to tidal potential Load tide −0.50 0.50 FES2014a load tide
下载: 导出CSV
Table 3. Length of TOPEX/Poseidon satellite-derived data required to fully separate the 13 tidal constituents (unit: a)
Constituent Ssa Q1 O1 P1 K1 N2 M2 S2 K2 M4 MS4 M6 Sa 1.00 0.23 0.14 0.32 0.90 0.16 0.21 0.19 0.31 0.09 1.51 0.06 Ssa 0.31 0.17 0.47 9.19 0.19 0.26 0.24 0.45 0.10 0.60 0.06 Q1 0.37 0.87 0.32 0.47 1.62 1.04 0.96 0.15 0.20 0.08 O1 0.26 0.17 1.63 0.47 0.57 0.27 0.27 0.13 0.10 P1 0.50 0.31 0.56 0.47 9.19 0.13 0.27 0.07 K1 0.19 0.27 0.24 0.47 0.10 0.56 0.06 N2 0.67 0.87 0.32 0.23 0.14 0.10 M2 2.94 0.60 0.17 0.18 0.09 S2 0.50 0.18 0.17 0.09 K2 0.13 0.26 0.07 M4 0.09 0.17 MS4 0.06
下载: 导出CSV
Table 4. Differences in amplitude (cm) of long-period tidal constituents and theoretical lowest tide (TLT) value obtained from time series records of different time scales
Continuous time length Sa Ssa TLT min max err min max err min max err 1 a −8.53 9.94 2.69 −5.77 5.15 1.95 −26.80 19.06 5.69 2 a −7.25 5.08 1.79 −4.56 3.67 1.37 −26.76 18.61 5.09 3 a −6.40 4.51 1.44 −2.70 3.15 1.09 −23.80 18.12 4.72 5 a −3.46 3.18 1.06 −1.99 2.54 0.89 −12.38 14.47 4.22 10 a −2.05 1.99 0.60 −1.27 1.25 0.43 −8.34 7.40 2.81 18 a −1.06 0.74 0.29 −0.57 0.76 0.19 −1.48 1.68 0.43 Note: err represents standard error.
下载: 导出CSV
Table 5. Average contribution of three types of tidal constituents to the theoretical lowest tide in the four regions of the China seas and adjacent waters
Sea area Eight major constituents contribution/% Shallow water tidal contribution/% Long-period tidal contribution/% Bohai Sea 77.08 2.18 23.97 Yellow Sea 85.78 1.96 15.06 East China Sea 91.80 0.63 10.12 South China Sea 92.87 1.28 9.09
下载: 导出CSV
-
Andersen O B, Scharroo R. 2011. Range and geophysical corrections in coastal regions: and implications for mean sea surface determination. In: Vignudelli S, Kostianoy A G, Cipollini P, et al. , eds. Coastal Altimetry. Berlin, Heidelberg: Springer-Verlag, 103–145, Cheng Yongcun, Andersen O B. 2011. Multimission empirical ocean tide modeling for shallow waters and polar seas. Journal of Geophysical Research: Oceans, 116(C11): C11001. doi: 10.1029/2011JC007172 Cheng Yongcun, Xu Qing, Zhang Yuan. 2016. Tidal estimation from TOPEX/Poseidon, Jason Primary, and interleaved missions in the Bohai, Yellow, and East China seas. Journal of Coastal Research, 32(4): 966–973. doi: 10.2112/JCOASTRES-D-14-00209.1 Cherniawsky J Y, Foreman M G G, Kang S K, et al. 2010. 18.6-year lunar nodal tides from altimeter data. Continental Shelf Research, 30(6): 575–587. doi: 10.1016/j.csr.2009.10.002 Daher V B, de Oliveira Vieira Paes R C, França G B, et al. 2015. Extraction of tide constituents by harmonic analysis using altimetry satellite data in the Brazilian coast. Journal of Atmospheric and Oceanic Technology, 32(3): 614–626. doi: 10.1175/JTECH-D-14-00091.1 Egbert G D, Erofeeva S Y. 2002. Efficient inverse modeling of barotropic ocean tides. Journal of Atmospheric and Oceanic Technology, 19(2): 183–204. doi: 10.1175/1520-0426(2002)019<0183:EIMOBO>2.0.CO;2 El-Diasty M. 2020. Optimal lowest astronomical tide estimation using maximum likelihood estimator with multiple ocean models hybridization. ISPRS International Journal of Geo-Information, 9(5): 327. doi: 10.3390/ijgi9050327 Fang Guohong, Wang Yonggang, Wei Zexun, et al. 2004. Empirical cotidal charts of the Bohai, Yellow, and East China seas from 10 years of TOPEX/Poseidon altimetry. Journal of Geophysical Research: Oceans, 109(C11): C11006. doi: 10.1029/2004JC002484 Feng Xiangbo, Tsimplis M N, Marcos M, et al. 2015. Spatial and temporal variations of the seasonal sea level cycle in the Northwest Pacific. Journal of Geophysical Research: Oceans, 120(10): 7091–7112. doi: 10.1002/2015JC011154 Fu Yanguang, Feng Yikai, Zhou Dongxu, et al. 2020a. Accuracy assessment of global ocean tide models in the South China Sea using satellite altimeter and tide gauge data. Acta Oceanologica Sinica, 39(12): 1–10. doi: 10.1007/s13131-020-1685-y Fu Yanguang, Zhou Dongxu, Zhou Xinghua, et al. 2020b. Evaluation of satellite-derived tidal constituents in the South China Sea by adopting the most suitable geophysical correction models. Journal of Oceanography, 76(3): 183–196. doi: 10.1007/s10872-019-00537-2 Gill S K, Schultz J R. 2001. Tidal Datums and their Applications. Silver Spring, MD, USA: NOAA Guo Jinyun, Hwang C, Deng Xiaoli. 2022. Editorial: Application of satellite altimetry in marine geodesy and geophysics. Frontiers in Earth Science, 10: 910562. doi: 10.3389/feart.2022.910562 Handoko E Y, Fernandes M J, Lázaro C. 2017. Assessment of altimetric range and geophysical corrections and mean sea surface models—Impacts on sea level variability around the Indonesian seas. Remote Sensing, 9(2): 102. doi: 10.3390/rs9020102 Hart-Davis M G, Piccioni G, Dettmering D, et al. 2021. EOT20: a global ocean tide model from multi-mission satellite altimetry. Earth System Science Data, 13(8): 3869–3884. doi: 10.5194/essd-13-3869-2021 Iliffe J C, Ziebart M K, Turner J F, et al. 2013. Accuracy of vertical datum surfaces in coastal and offshore zones. Survey Review, 45(331): 254–262. doi: 10.1179/1752270613Y.0000000040 Ke Hao, Li Fei, Ai Songtao, et al. 2020. Establishment of chart datum and vertical datum transformation for hydrography in the Chinese Great Wall Bay, Antarctic Peninsula. Journal of Surveying Engineering, 146(2): 05020003. doi: 10.1061/(ASCE)SU.1943-5428.0000312 Li Jie, Fu Yanguang, Tang Qiuhua, et al. 2020. Accuracy assessment of a seamless depth datum model established on the basis of the global ocean tide model. Journal of Coastal Research, 99(S1): 74–78. doi: 10.2112/SI99-011.1 Lyard F H, Allain D J, Cancet M, et al. 2021. FES2014 global ocean tide atlas: design and performance. Ocean Science, 17(3): 615–649. doi: 10.5194/os-17-615-2021 Matsumoto K, Takanezawa T, Ooe M. 2000. Ocean tide models developed by assimilating TOPEX/POSEIDON altimeter data into hydrodynamical model: a global model and a regional model around Japan. Journal of Oceanography, 56(5): 567–581. doi: 10.1023/A:1011157212596 Pan Haidong, Lv Xianqing, Wang Yingying, et al. 2018. Exploration of tidal-fluvial interaction in the Columbia River estuary using S_TIDE. Journal of Geophysical Research: Oceans, 123(9): 6598–6619. doi: 10.1029/2018JC014146 Parker B, Milbert D, Hess K, et al. 2003. National VDatum—the implementation of a national vertical datum transformation database. Sea Technology, 44(9): 10–15 Pascual A, Boone C, Larnicol G, et al. 2009. On the quality of real-time altimeter gridded fields: comparison with in situ data. Journal of Atmospheric and Oceanic Technology, 26(3): 556–569. doi: 10.1175/2008JTECHO556.1 Piccioni G, Dettmering D, Bosch W, et al. 2019. TICON: Tidal Constants based on GESLA sea-level records from globally located tide gauges. Geoscience Data Journal, 6(2): 97–104. doi: 10.1002/gdj3.72 Ruiz-Etcheverry L A, Saraceno M, Piola A R, et al. 2015. A comparison of the annual cycle of sea level in coastal areas from gridded satellite altimetry and tide gauges. Continental Shelf Research, 92: 87–97. doi: 10.1016/j.csr.2014.10.006 Scharroo R, Leuliette E, Lillibridge J, et al. 2013. RADS: Consistent multi-mission products. In: Symposium on 20 Years of Progress in Radar Altimetry. Venice, Italy: ESA Schlax M G, Chelton D B. 1994. Aliased tidal errors in TOPEX/POSEIDON sea surface height data. Journal of Geophysical Research: Oceans, 99(C12): 24761–24775. doi: 10.1029/94JC01925 Shum C K, Woodworth P L, Andersen O B, et al. 1997. Accuracy assessment of recent ocean tide models. Journal of Geophysical Research: Oceans, 102(C11): 25173–25194. doi: 10.1029/97JC00445 Slobbe D C, Sumihar J, Frederikse T, et al. 2018. A Kalman filter approach to realize the lowest astronomical tide surface. Marine Geodesy, 41(1): 44–67. doi: 10.1080/01490419.2017.1391900 Stammer D, Ray R D, Andersen O B, et al. 2014. Accuracy assessment of global barotropic ocean tide models. Reviews of Geophysics, 52(3): 243–282. doi: 10.1002/2014RG000450 State Administration for Market Regulation, Standardization Administration of the People’s Republic of China. 2022. GB12327-2022 Specifications for hydrographic survey (in Chinese). Beijing: Standards Press of China Wei Zexun, Pan Haidong, Xu Tengfei, et al. 2022. Development history of the numerical simulation of tides in the East Asian marginal seas: An overview. Journal of Marine Science and Engineering, 10(7): 984. doi: 10.3390/jmse10070984 Woodworth P L, Hunter J R, Marcos M, et al. 2016. Towards a global higher-frequency sea level dataset. Geoscience Data Journal, 3(2): 50–59. doi: 10.1002/gdj3.42 Wu Wei, Myers E, Shi Lei, et al. 2019. Modeling tidal datums and spatially varying uncertainty in the Texas and western Louisiana coastal waters. Journal of Marine Science and Engineering, 7(2): 44. doi: 10.3390/jmse7020044 Wunsch C. 1967. The long-period tides. Reviews of Geophysics, 5(4): 447–475. doi: 10.1029/RG005i004p00447 Yang Zizang, Myers E P, White S A. 2010. VDatum for eastern Louisiana and Mississippi coastal waters: tidal datums, marine grids, and sea surface topography. In: NOAA Technical Memorandum NOS CS 19. Silver Spring, Maryland, USA: National Oceanic and Atmospheric Administration Yuan Jiajia, Guo Jinyun, Zhu Chengcheng, et al. 2023. SDUST2020 MSS: a global 1′ × 1′ mean sea surface model determined from multi-satellite altimetry data. Earth System Science Data, 15(1): 155–169. doi: 10.5194/essd-15-155-2023 Yusof N H M, Mahmud M R, Abdullah M H. 2017. Effect of long term tidal constituents on mean sea level trend during El-Niño and La-Niña phenomena. The International Archives of the Photogrammetry, Remote Sensing and Spatial Information Sciences, XLII-4/W5: 225–234 -


 点击查看大图
计量
- 文章访问数: 174
- HTML全文浏览量: 79
- PDF下载量: 9
- 被引次数: 0

