Responses of the Southern Ocean mixed layer depth to the eastern and central Pacific El Niño events during austral winter
-
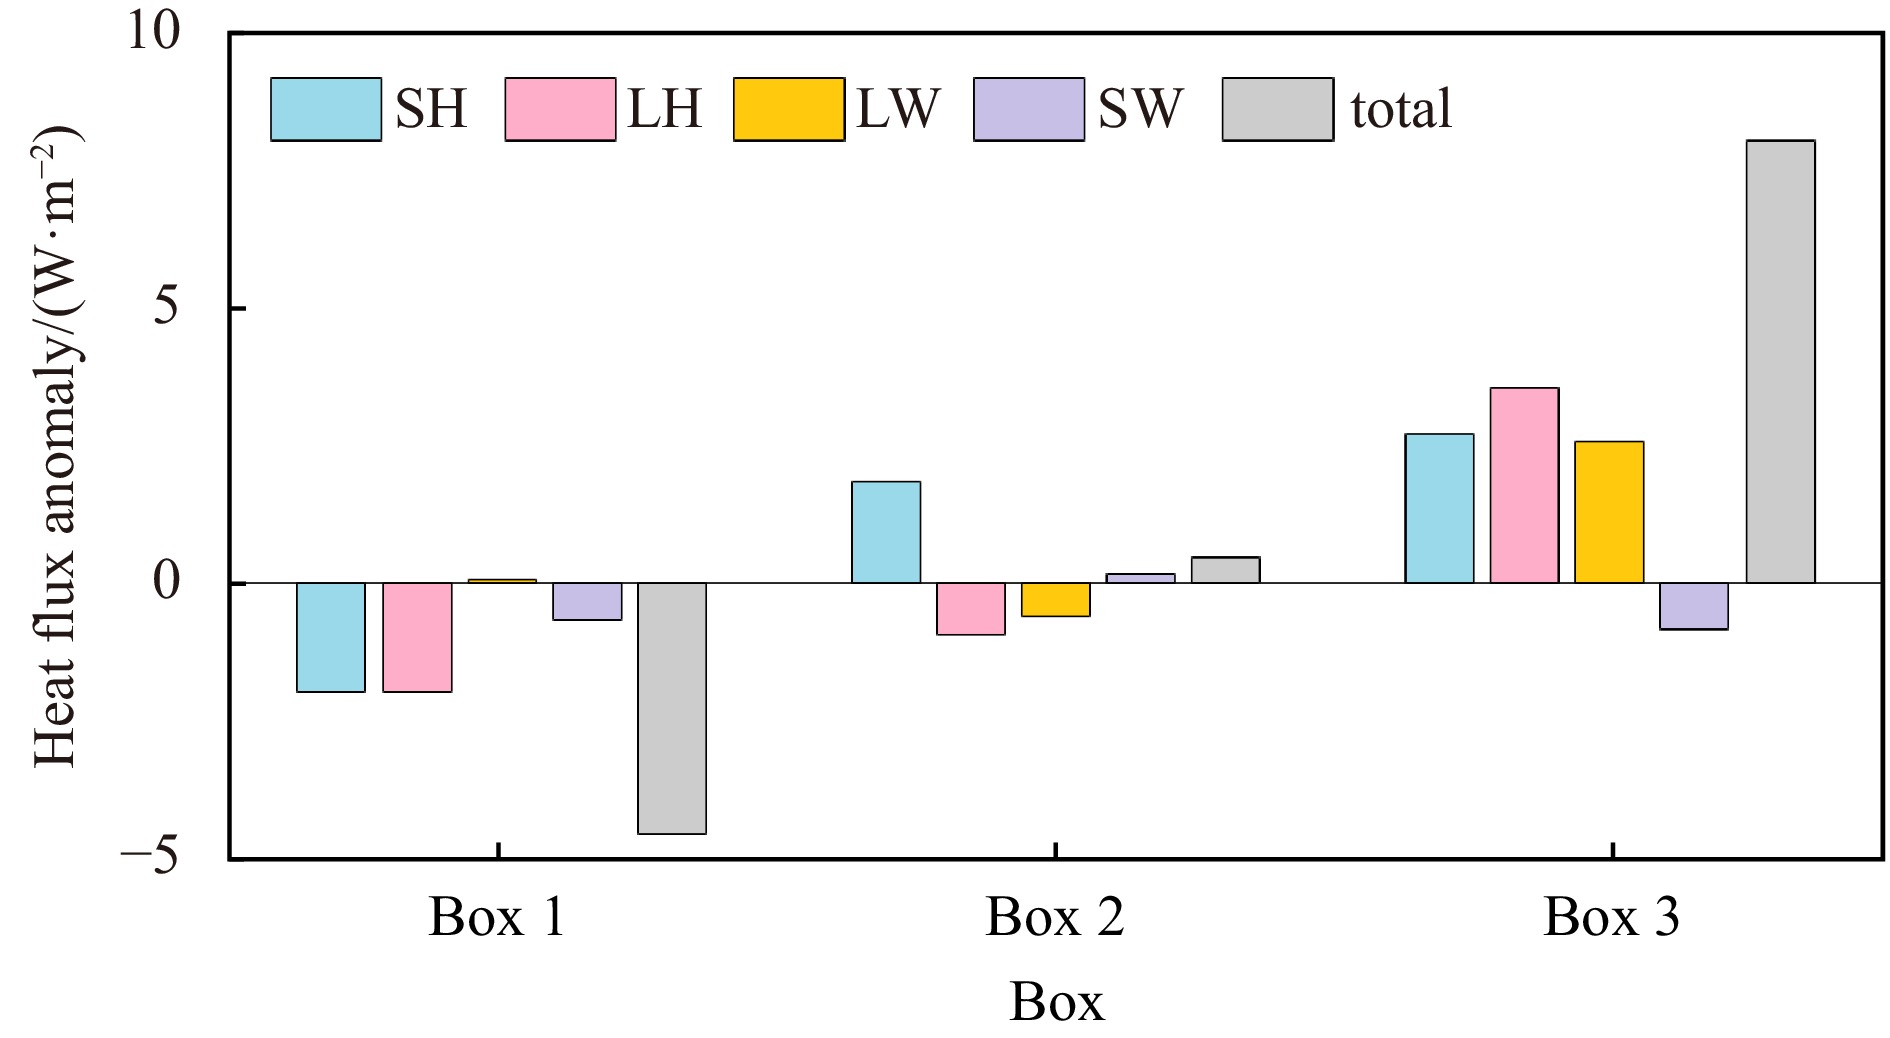
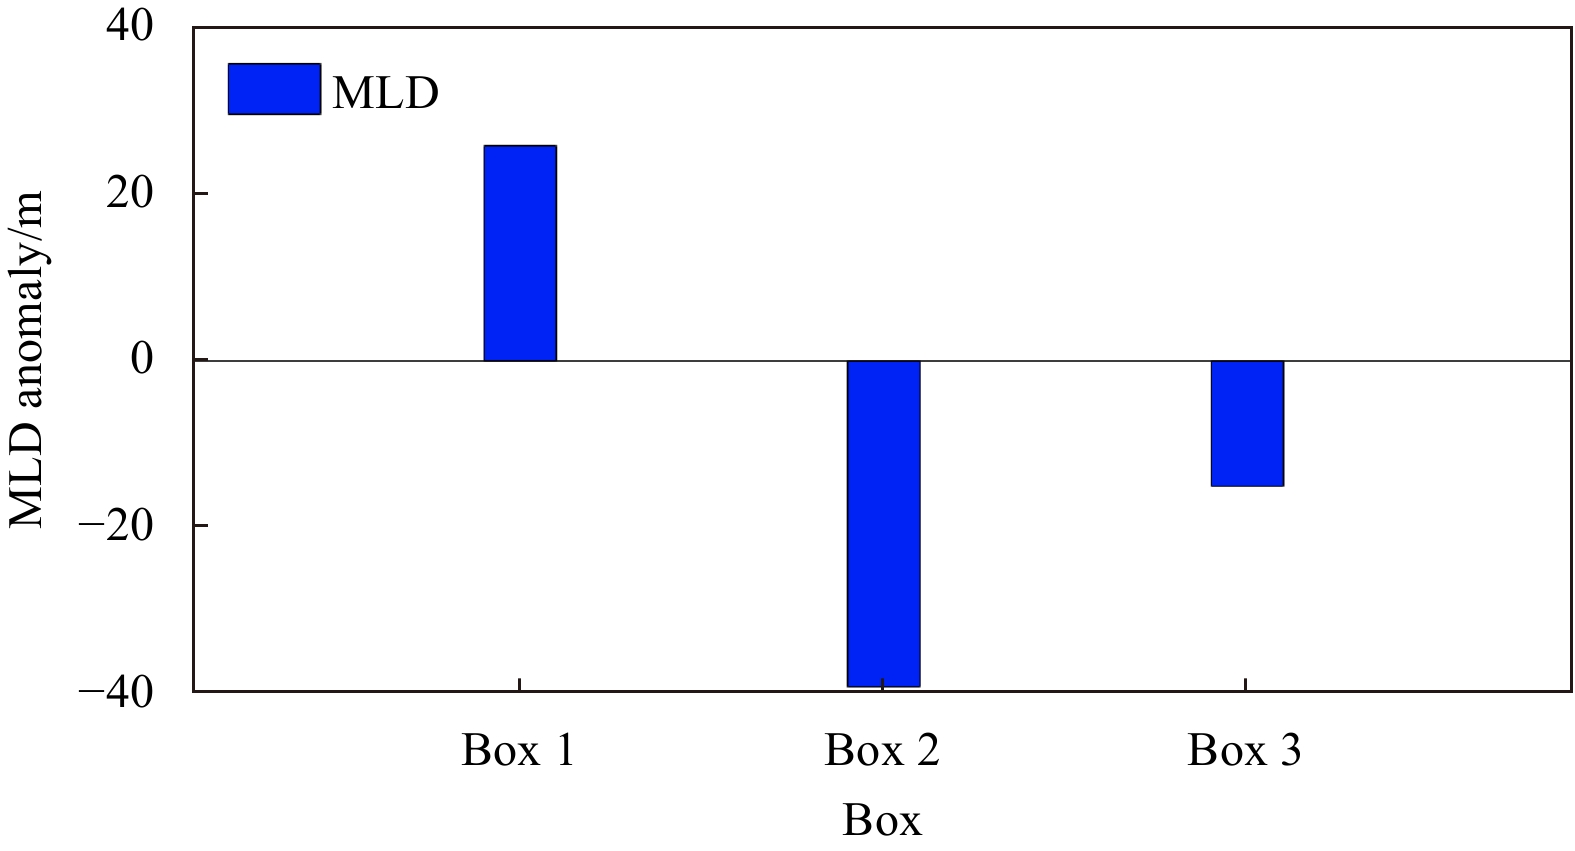
Abstract: Based on the Ocean Reanalysis System version 5 (ORAS5) and the fifth-generation reanalysis datasets derived from European Centre for Medium-Range Weather Forecasts (ERA5), we investigate the different impacts of the central Pacific (CP) El Niño and the eastern Pacific (EP) El Niño on the Southern Ocean (SO) mixed layer depth (MLD) during austral winter. The MLD response to the EP El Niño shows a dipole pattern in the South Pacific, namely the MLD dipole, which is the leading El Niño-induced MLD variability in the SO. The tropical Pacific warm sea surface temperature anomaly (SSTA) signal associated with the EP El Niño excites a Rossby wave train propagating southeastward and then enhances the Amundsen Sea low (ASL). This results in an anomalous cyclone over the Amundsen Sea. As a result, the anomalous southerly wind to the west of this anomalous cyclone advects colder and drier air into the southeast of New Zealand, leading to surface cooling through less total surface heat flux, especially surface sensible heat (SH) flux and latent heat (LH) flux, and thus contributing to the mix layer (ML) deepening. The east of the anomalous cyclone brings warmer and wetter air to the southwest of Chile, but the total heat flux anomaly shows no significant change. The warm air promotes the sea ice melting and maintains fresh water, which strengthens stratification. This results in a shallower MLD. During the CP El Niño, the response of MLD shows a separate negative MLD anomaly center in the central South Pacific. The Rossby wave train triggered by the warm SSTA in the central Pacific Ocean spreads to the Amundsen Sea, which weakens the ASL. Therefore, the anomalous anticyclone dominates the Amundsen Sea. Consequently, the anomalous northerly wind to the west of anomalous anticyclone advects warmer and wetter air into the central and southern Pacific, causing surface warming through increased SH, LH, and longwave radiation flux, and thus contributing to the ML shoaling. However, to the east of the anomalous anticyclone, there is no statistically significant impact on the MLD.
-
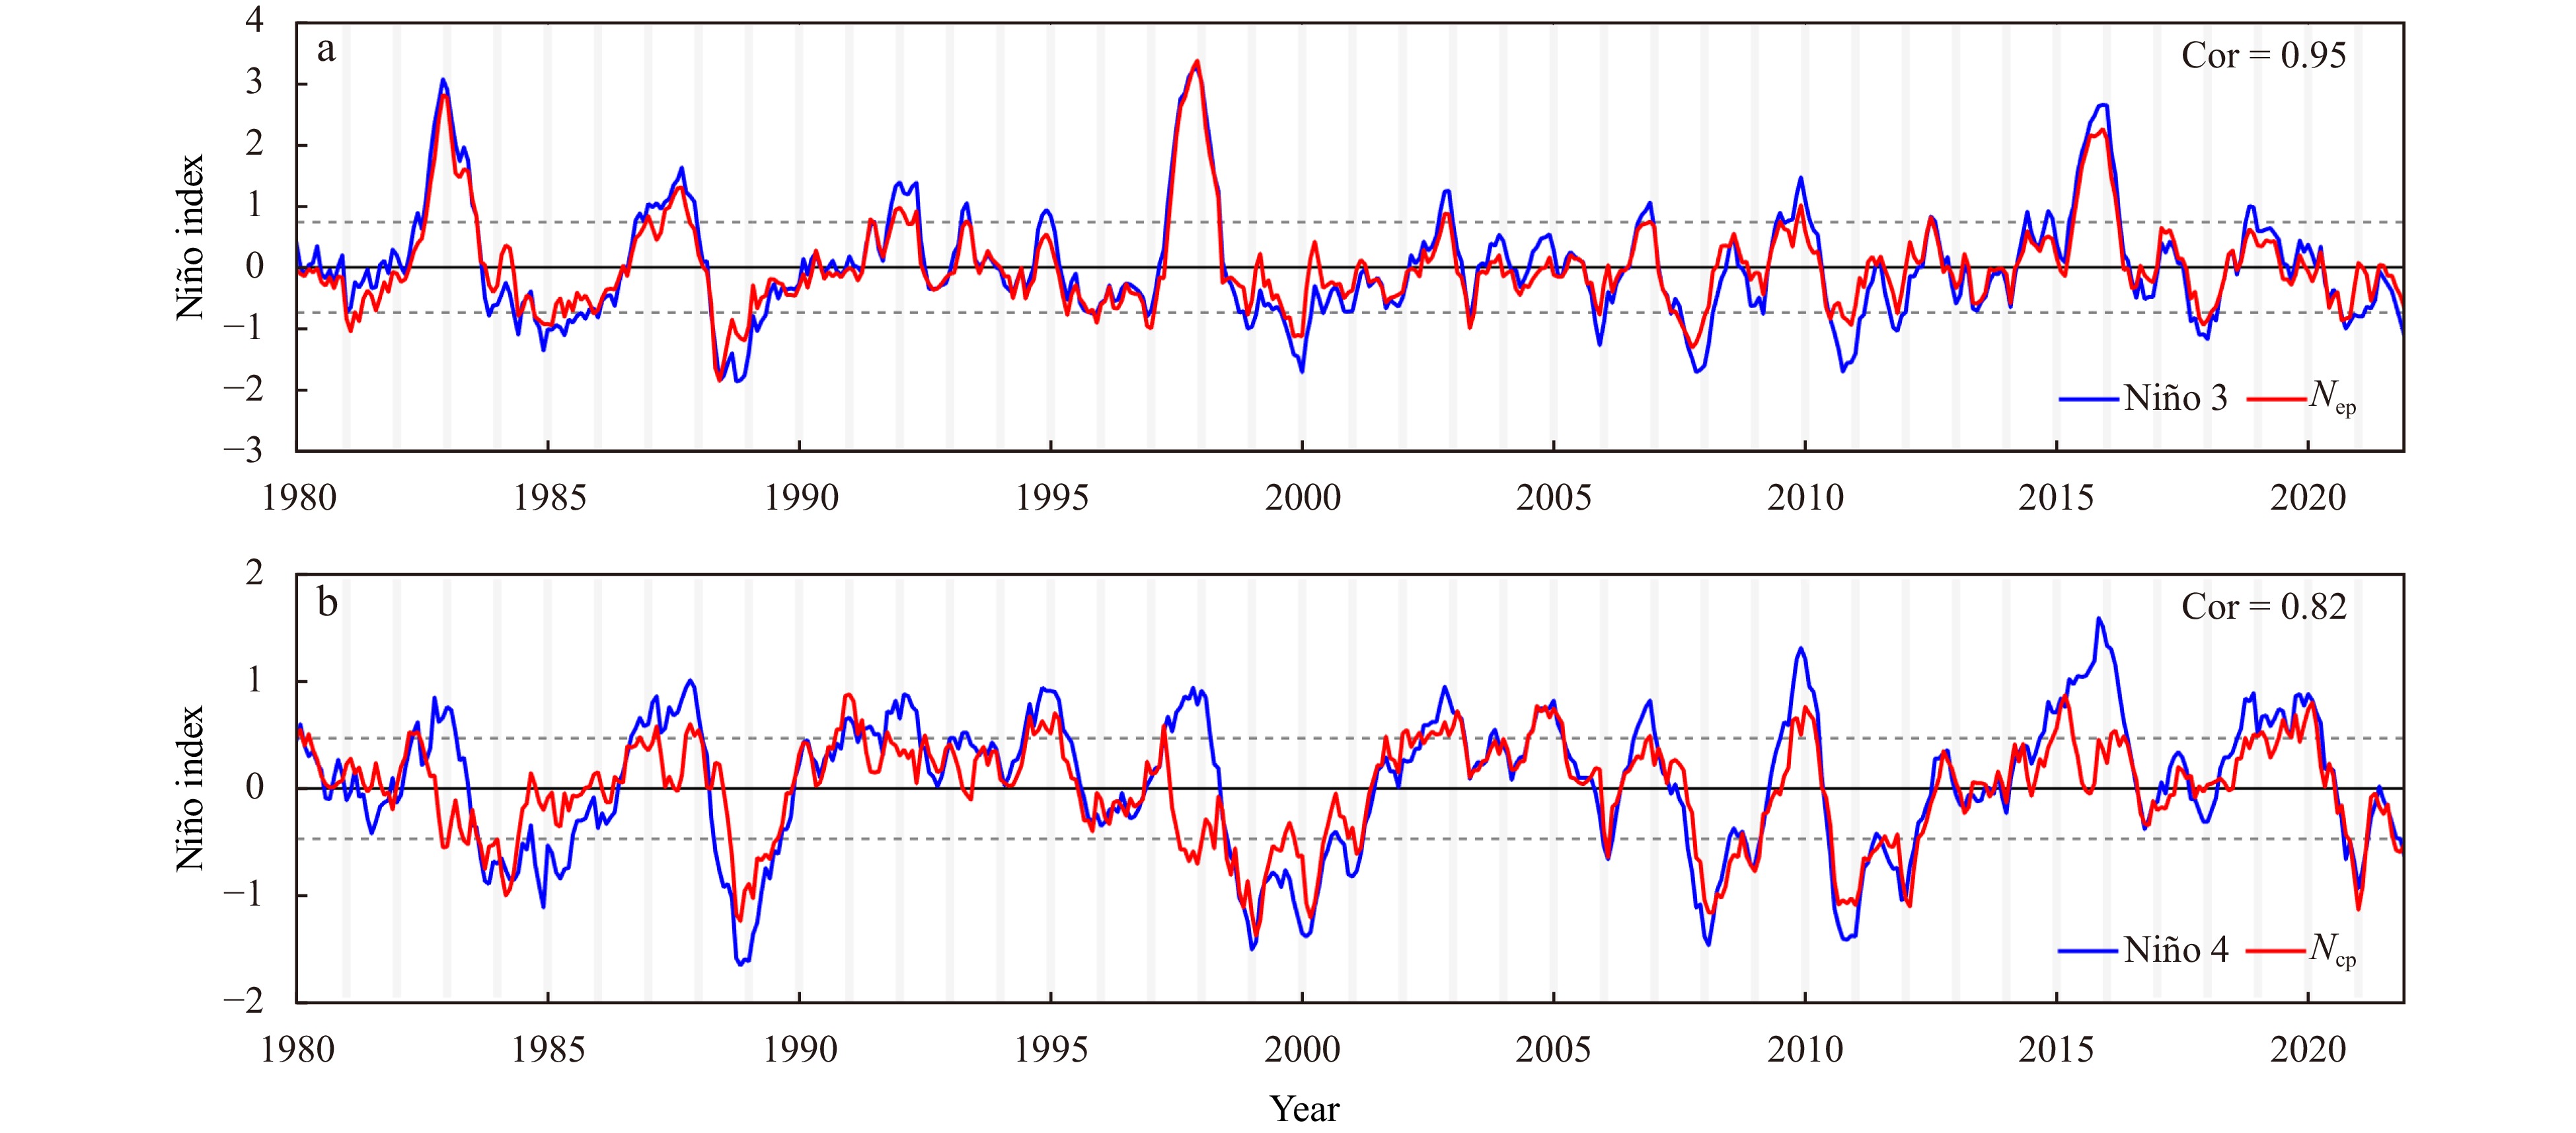
Figure 1. Time series of Niño 3 index (blue line) from NOAA and Nep index (red line) based on Eq. (5) (a), and Niño 4 index (blue line) from NOAA and Ncp index (red line) based on Eq. (5) (b). Grey dashed lines denote one standard deviation of Nep and Ncp indices. Cor indicates correlations between two curves in each panel.
Figure 2. Composite images of MLD anomaly derived from the ORAS5 in austral, spring (SON) (a, e), summer (DJF) (b, f), autumn (MAM) (c, g), and winter (JJA) (d, h) for EP El Niño (a–d) and CP El Niño (e–h) events. The black stippled areas represent that the results are statistically significant at the 95% confidence level. Box 1 (red; 40°–60°S, 160°E–180°–145°W) and Box 2 (blue; 45°–65°S, 140°–70°W) in d and the Box 3 (blue; 42°–62°S, 165°–100°W) in h indicate the focus areas. SON: September, October, and November; DJF: December, January, and February; MAM: March, April, and May; JJA: June, July, and August.
Figure 3. Composite images of SSTA observed from the ERA5 for EP (a) and CP (b) El Niño events in austral winter (JJA, June, July, and August). The black stippled areas represent that the results are statistically significant at the 95% confidence level. Box 1 (red; 40°–60°S, 160°E–180°–145°W) and Box 2 (blue; 45°–65°S, 140°–70°W) in a and Box 3 (blue; 42°–62°S, 165°–100°W) in b indicate the focus areas, same as Boxes 1, 2, and 3 in Figs 2d and h.
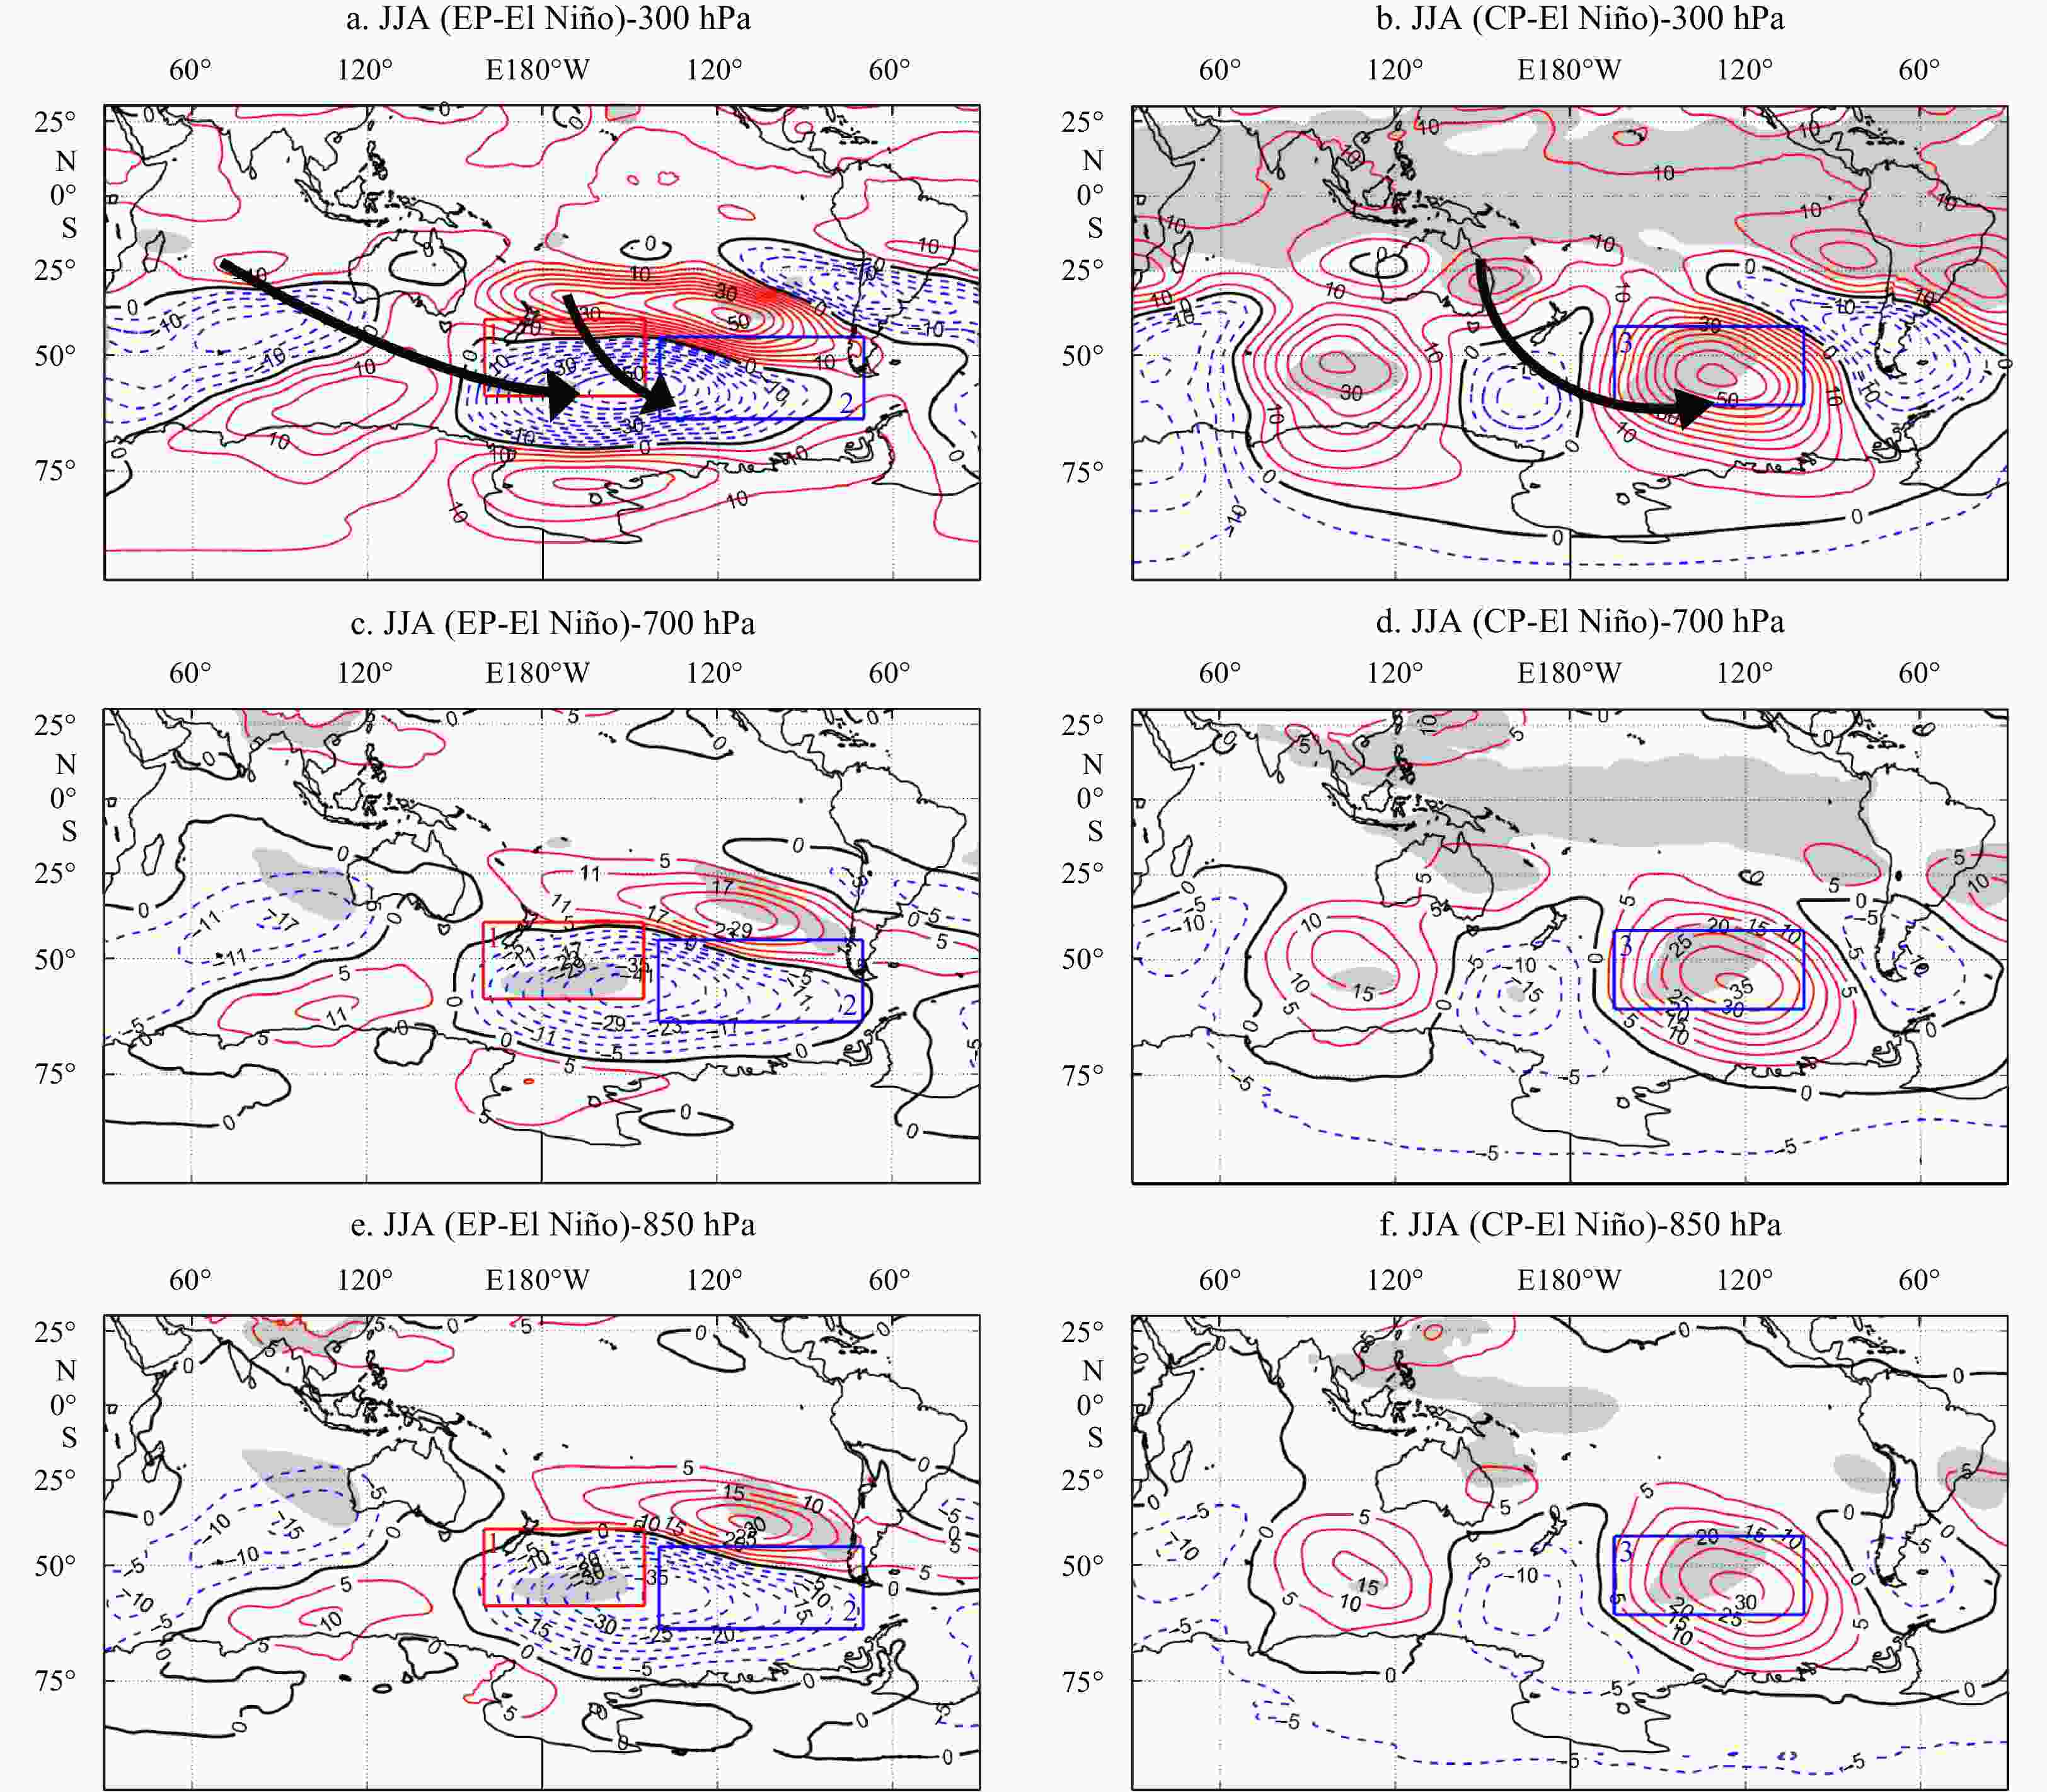
Figure 4. Composite images of 300 hPa (a and b), 700 hPa (c and d), and 850 hPa (e and f) geopotential height anomaly (unit: m) in austral winter (JJA) derived from the ERA5 for EP El Niño (a, c, and e) and CP El Niño (b, d, and f) events. The gray shadings represent the results statistically significant at the 95% confidence level. Red solid, black solid, and blue dashed lines for geopotential height anomaly indicate the positive, zero, and negative anomalies, respectively. Black arrow indicates the path of Rossby wave propagation. Box 1 (red; 40°–60°S, 160°E–180°–145°W) and Box 2 (blue; 45°–65°S, 140°–70°W) and Box 3 (blue; 42°–62°S, 165°–100°W) in b, d, and f indicate the focus areas, same as Boxes 1, 2, and 3 in Figs 2 d and h.
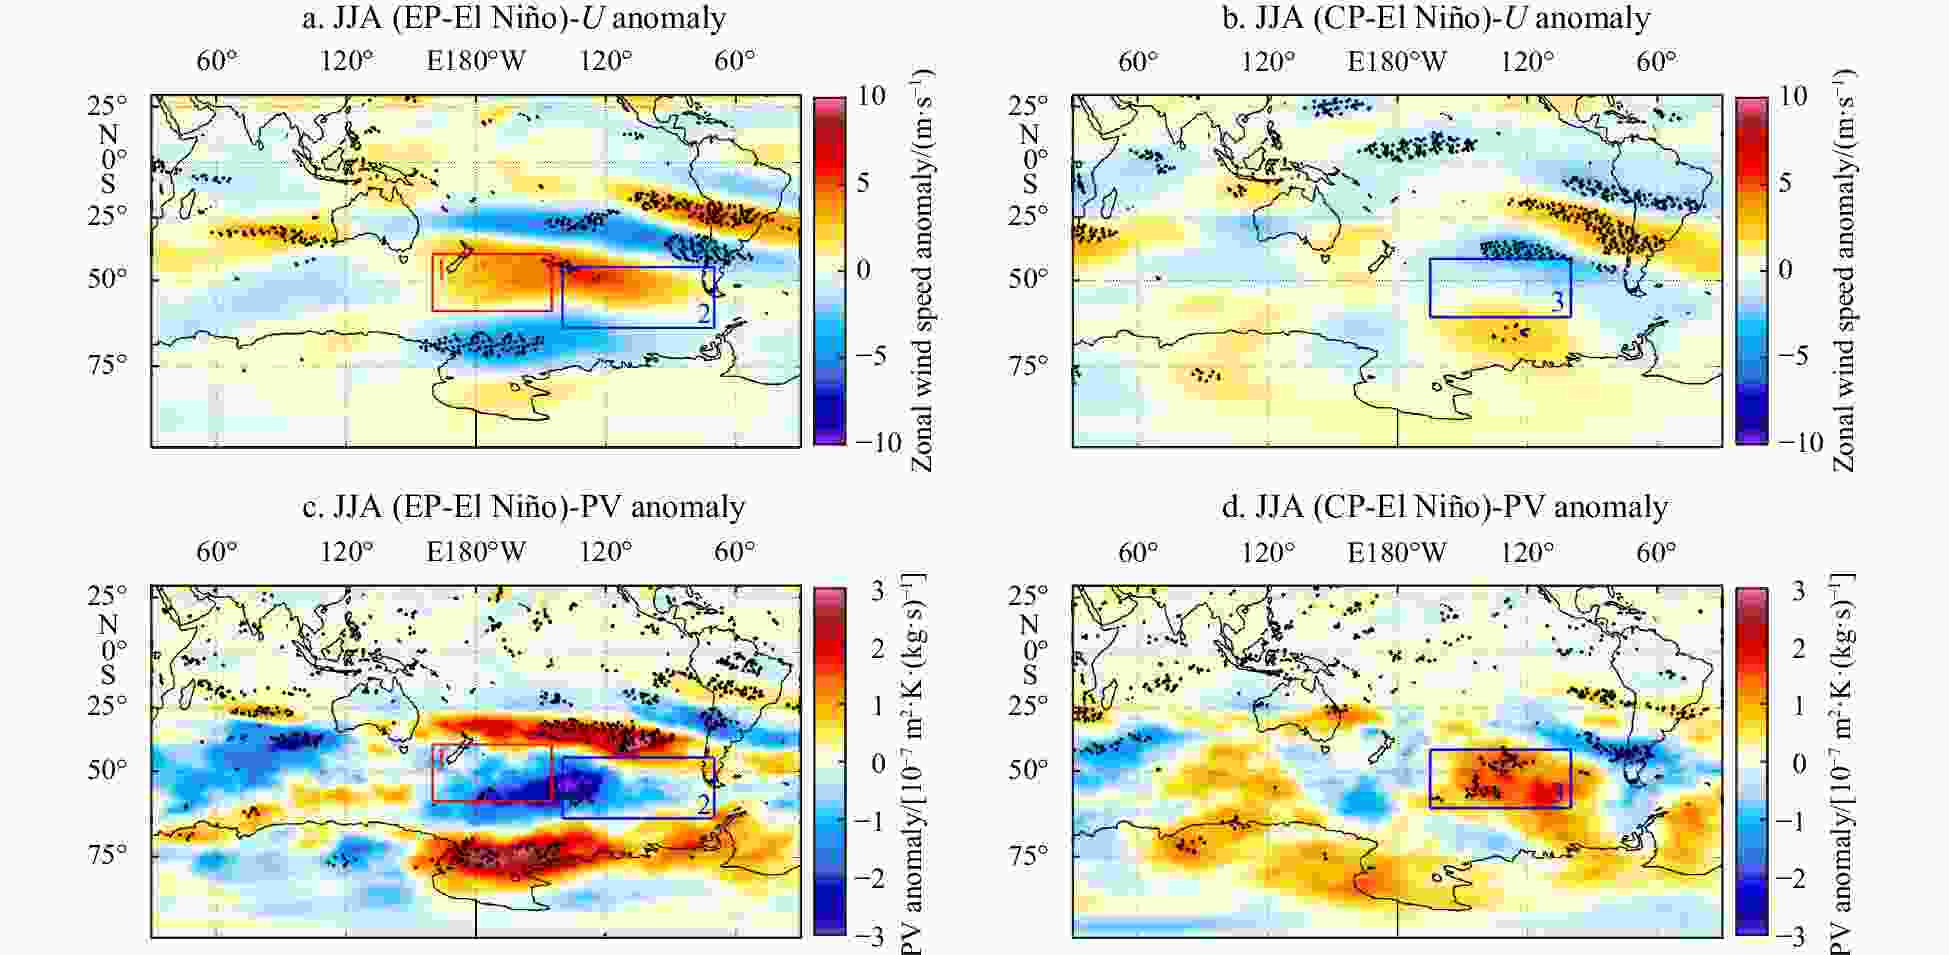
Figure 5. Composite images of austral winter (JJA, June, July, and August) 300 hPa zonal wind speed anomaly derived from the ERA5 for EP El Niño (a) and CP El Niño (b) events and potential vorticity (PV) anomaly derived from the ERA5 for EP El Niño (c) and CP El Niño (d) events. The black stippled areas represent the results statistically significant at the 95% confidence level. Box 1 (red; 40°–60°S, 160°E–180°–145°W) and Box 2 (blue; 45°–65°S, 140°–70°W) and Box 3 (blue; 42°–62°S, 165°–100°W) indicate the focus areas, same as Boxes 1, 2, and 3 in Figs 2d and h.
Figure 6. Composite images of SLP anomaly (a and b, unit: hPa) (contours), and anomalous 10 m wind (c and d) (vectors) as well as wind speed (color) anomaly (unit: m/s) derived from the ERA5 for EP El Niño (a and c) and CP El Niño (b and d) events. Red solid, black solid, and blue dashed lines for SLP anomaly indicate the positive, zero, and negative anomalies, respectively. The gray shadings and black stippled areas represent the results statistically significant at the 95% confidence level. The red letters H and A represent the High-pressure anomaly center and anticyclone, respectively. The blue letters L and C represent the Low-pressure anomaly center and cyclone, respectively. Box 1 (red; 40°–60°S, 160°E–180°–145°W) and Box 2 (blue; 45°–65°S, 140°–70°W) in a and c and Box 3 (blue; 42°–62°S, 165°–100°W) in b and d indicate the focus areas, same as Boxes 1, 2, and 3 in Figs 2d and h.
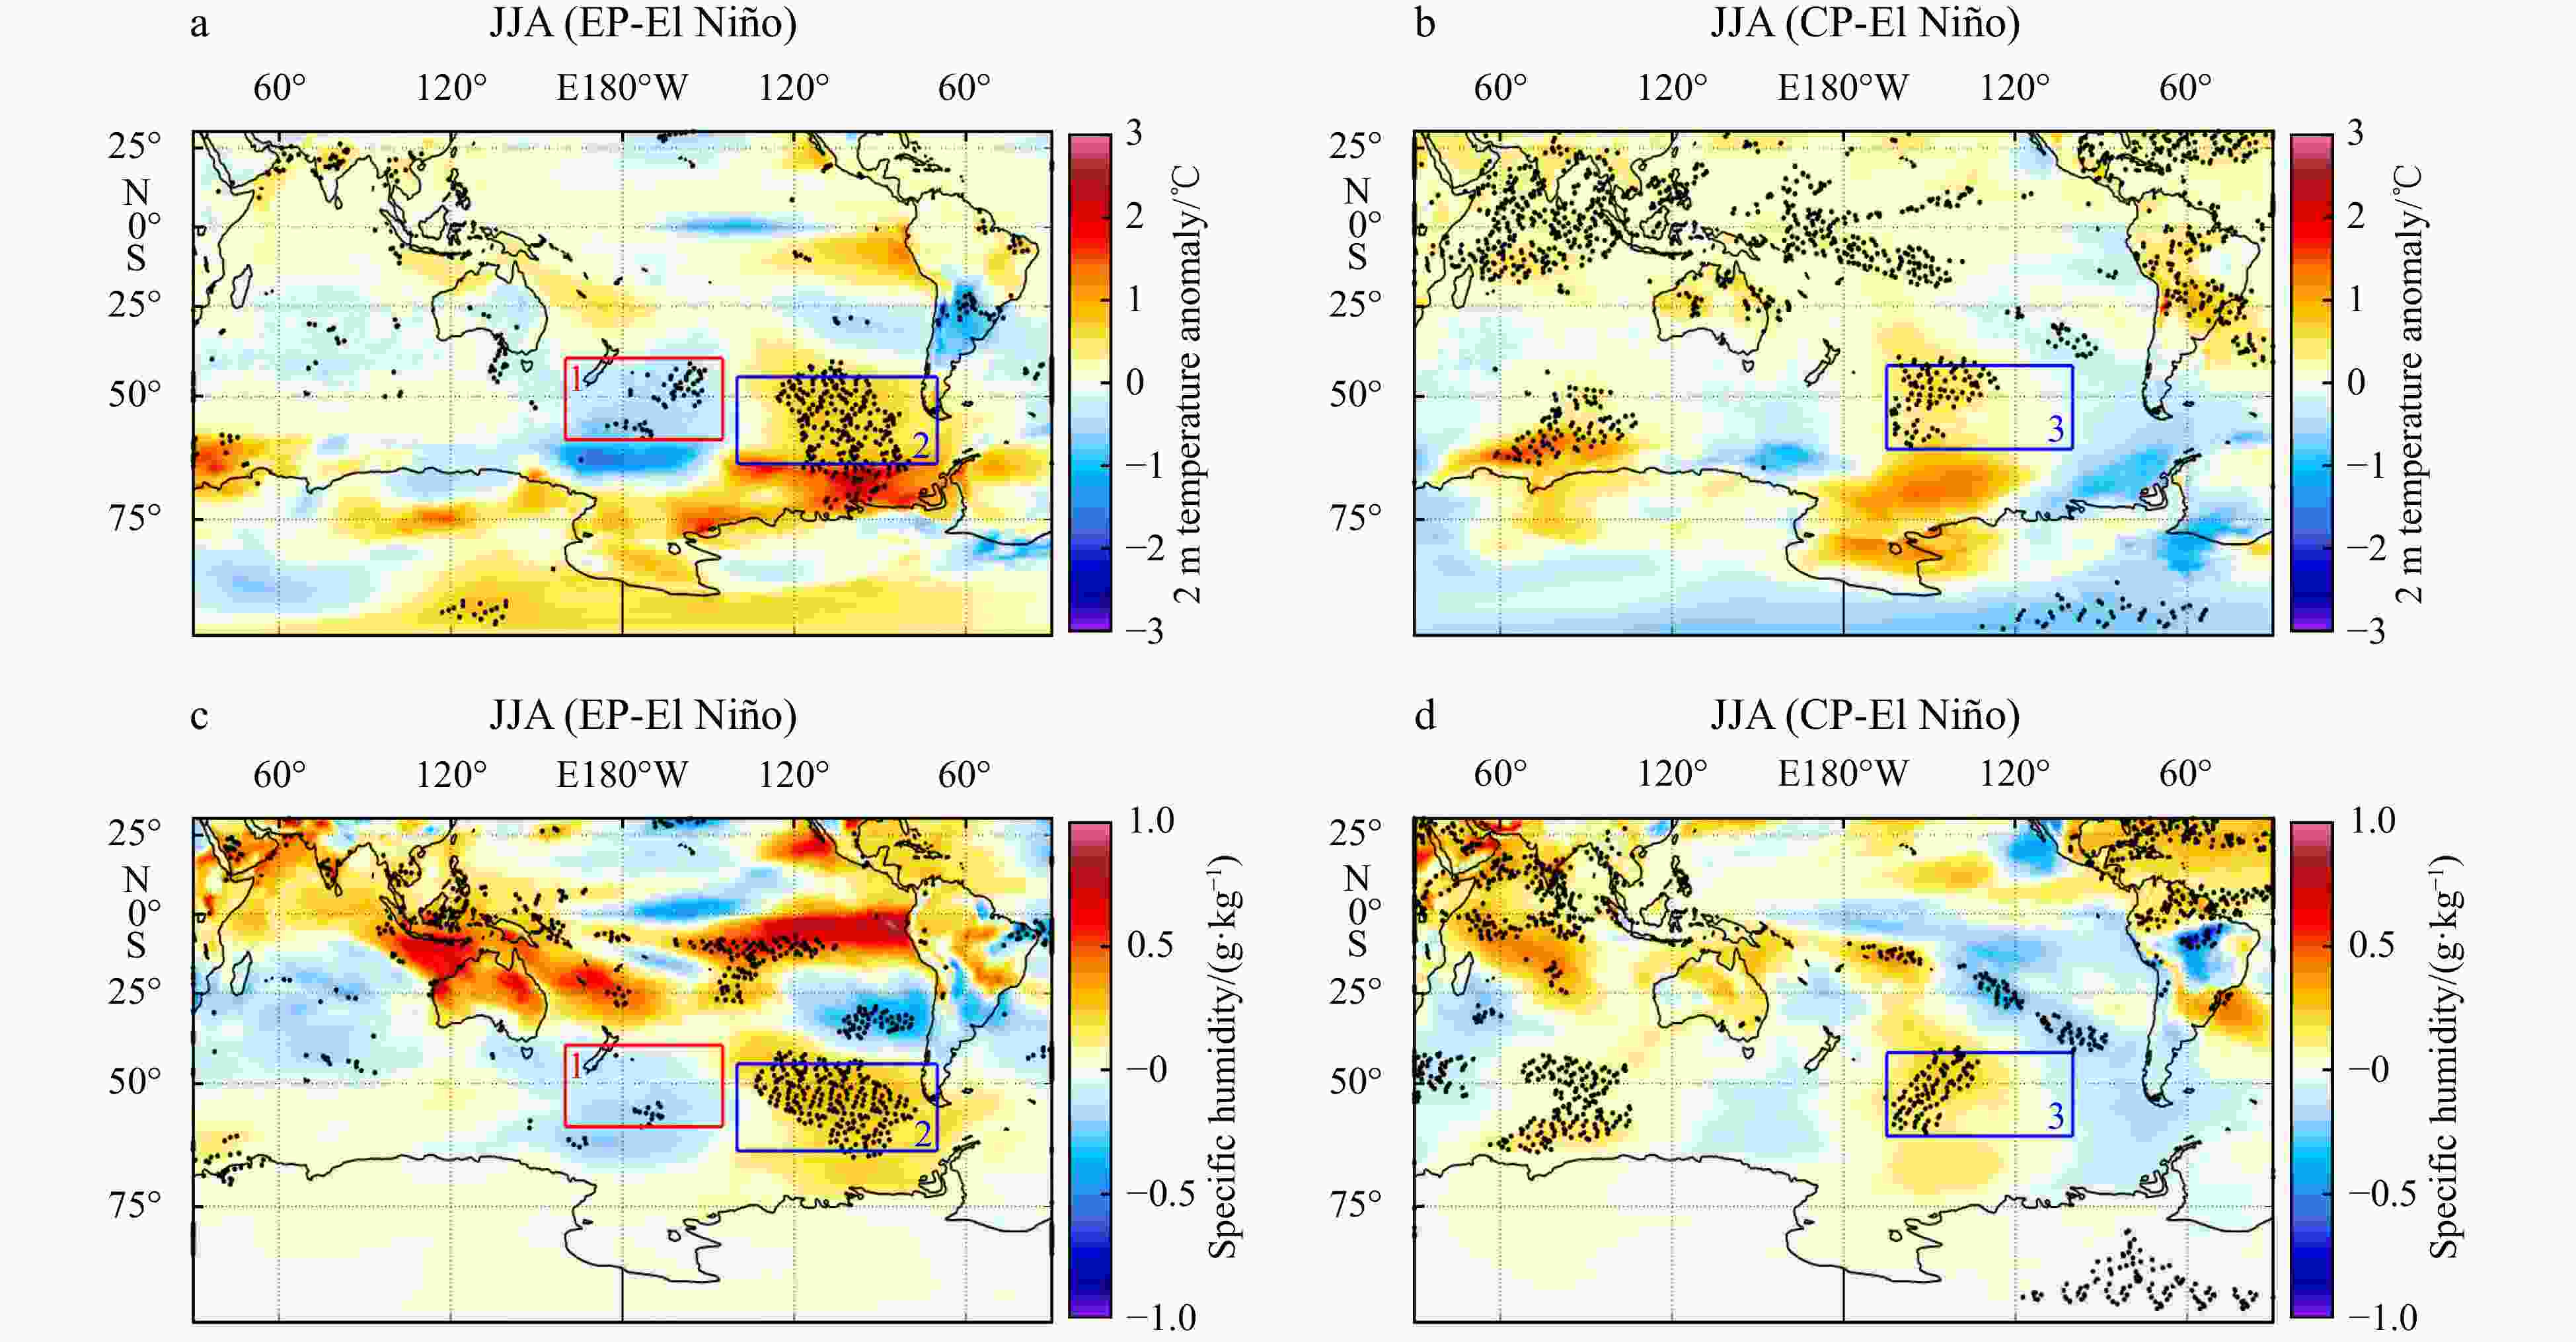
Figure 7. Composite images of air temperature anomaly at 2 m (a and b), and
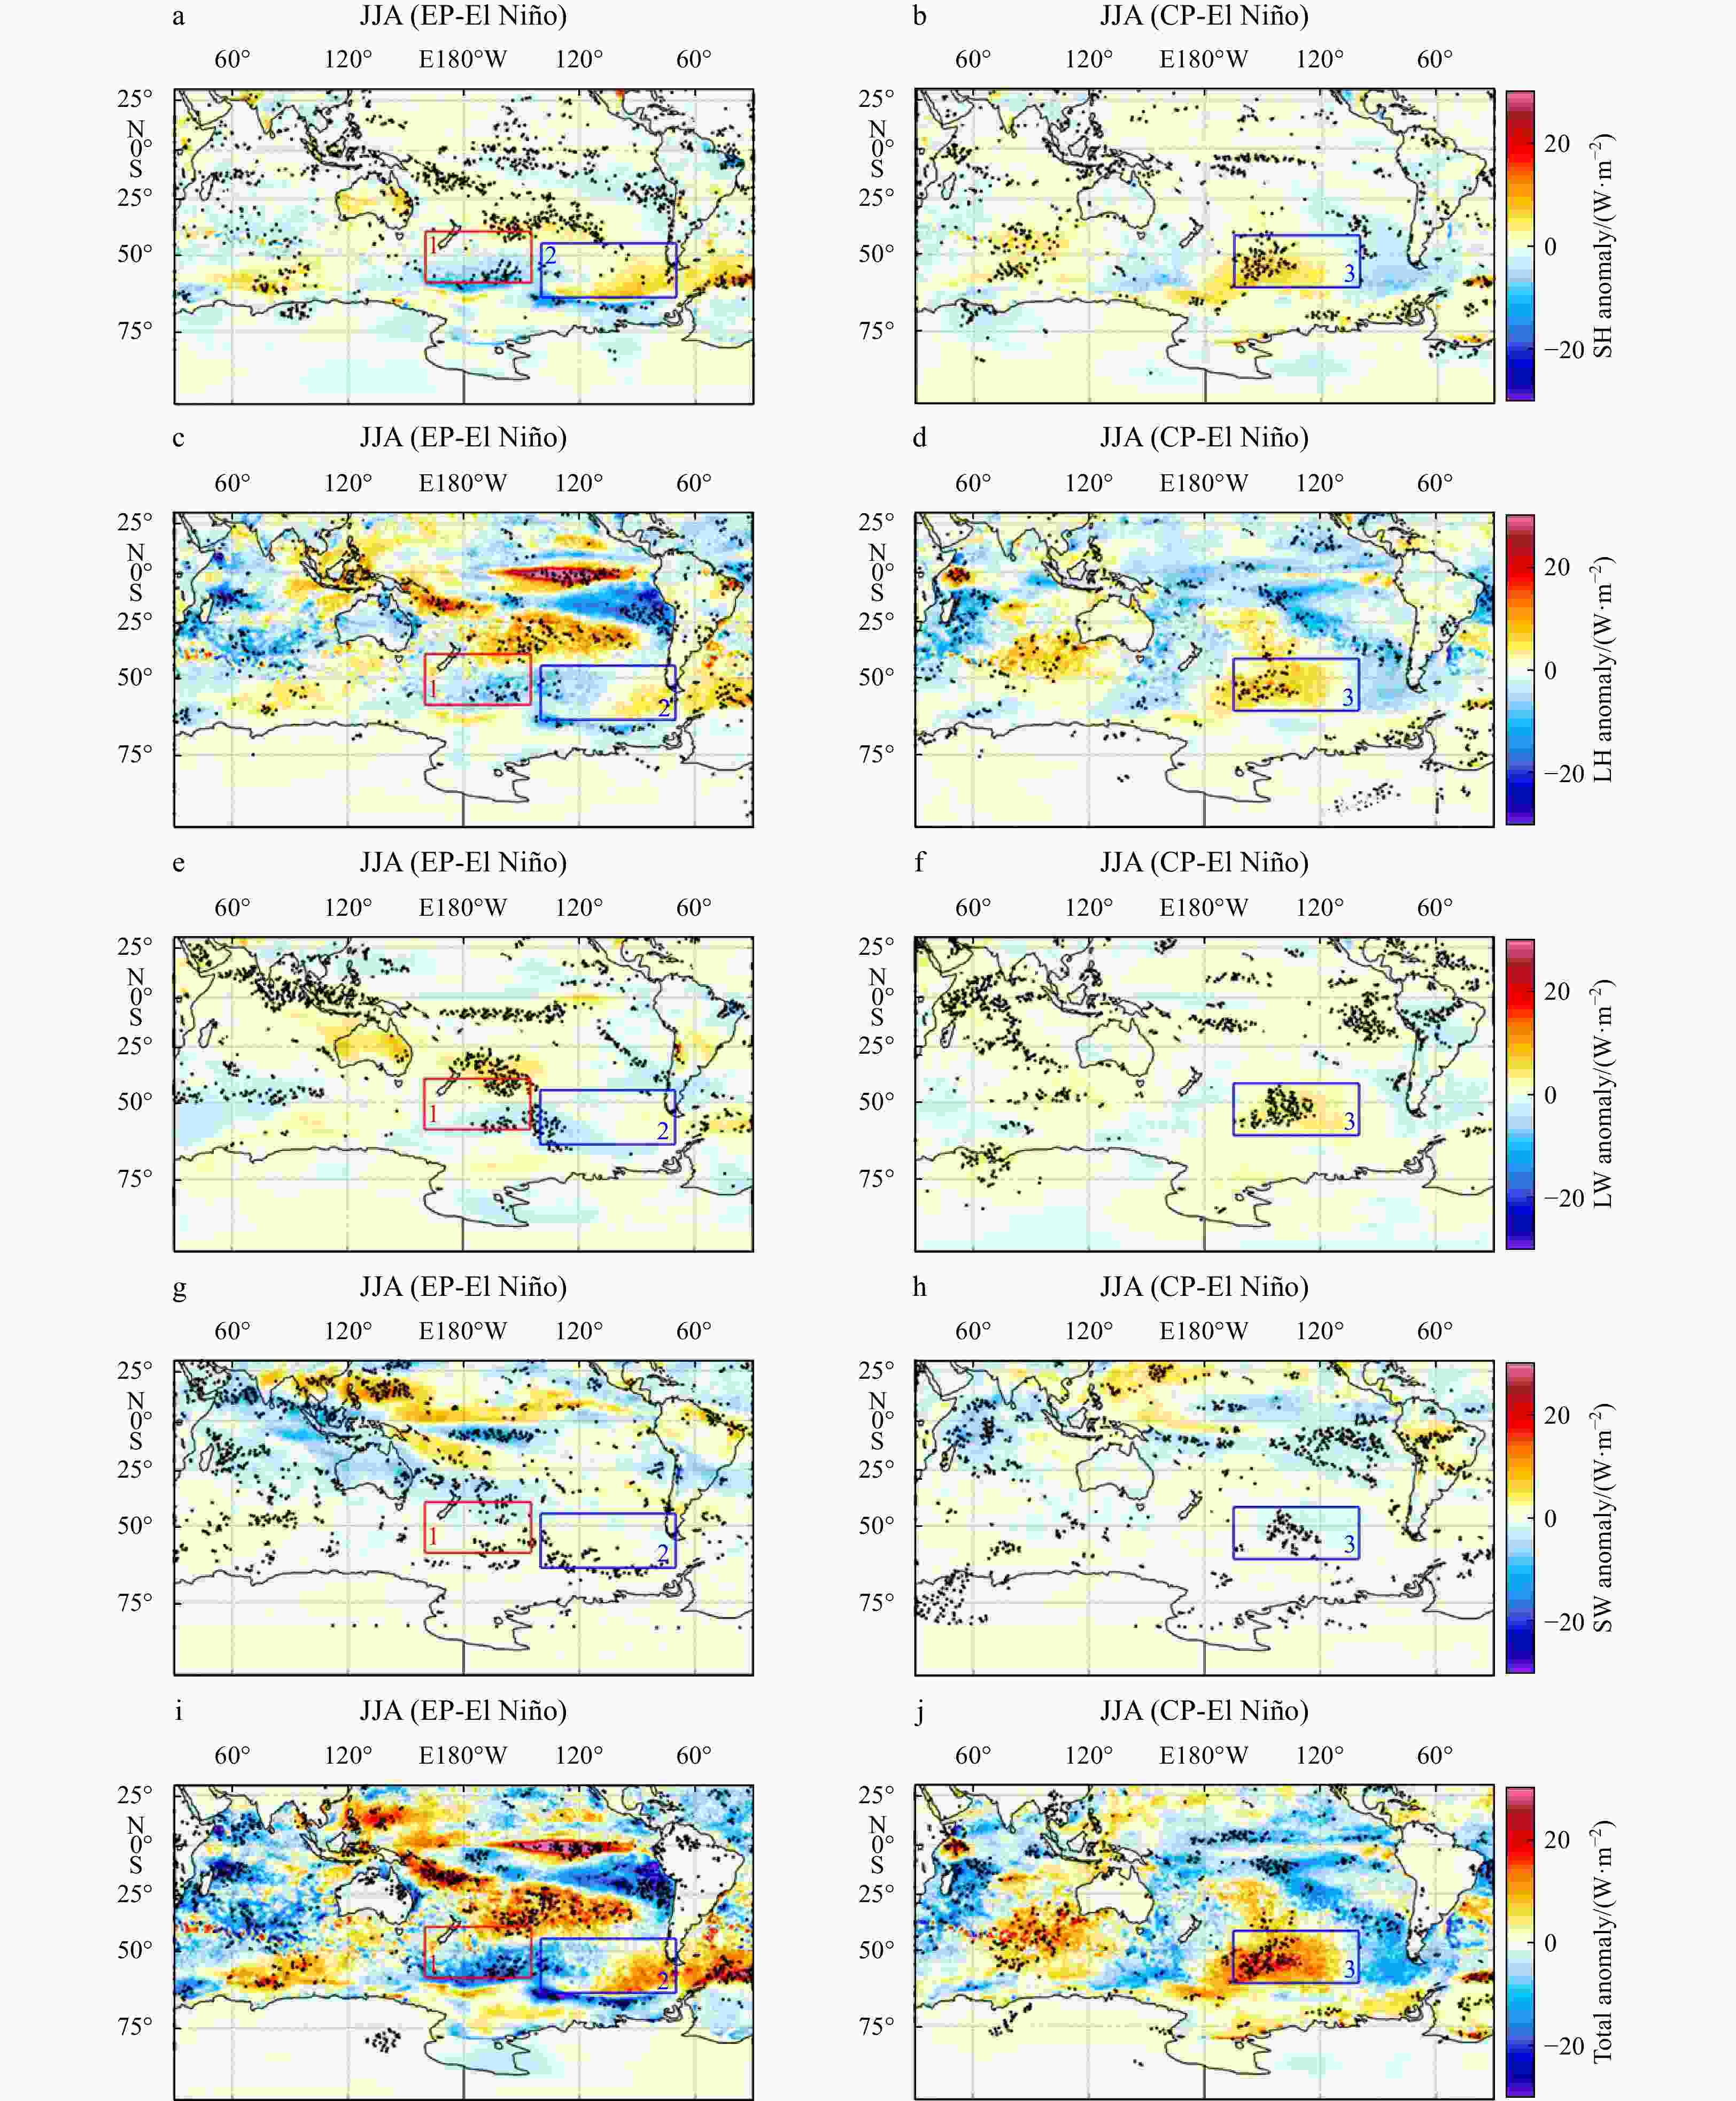
1000 hPa specific humidity anomaly (c and d) derived from the ERA5 for EP El Niño (a and c) and CP El Niño (b and d) events. The black stippled areas represent the results statistically significant at the 95% confidence level. Box 1 (red; 40°–60°S, 160°E–180°–145°W) and Box 2 (blue; 45°–65°S, 140°–70°W) in a and c and Box 3 (blue; 42°–62°S, 165°–100°W) in b and d indicate the focus areas, same as Boxes 1, 2, and 3 in Figs 2d and h.Figure 8. Composite images of surface sensible heat flux (SH) anomaly (a and b), latent heat flux (LH) anomaly (c and d), net longwave radiation flux (LW) anomaly (e and f), net shortwave radiation flux (SW) anomaly (g and h), and total surface heat flux anomaly (i and j) derived from the ERA5 for EP El Niño (a, c, e, g, and i) and CP El Niño (b, d, f, h, and j) events. The positive anomaly represents downward. The black stippled areas represent the results statistically significant at the 95% confidence level. Box 1 (red; 40°–60°S, 160°E–180°–145°W) and Box 2 (blue; 45°–65°S, 140°–70°W) in a, c, e, g, and i and Box 3 (blue; 42°–62°S, 165°–100°W) in b, d, f, h, and j indicate the focus areas, same as Boxes 1, 2, and 3 in Figs 2d and h.
Figure 11. Composite pictures of SIC anomaly derived from the ORAS5 during EP El Niño events (a) and CP El Niño events (b). The black stippled areas represent the results statistically significant at the 95% confidence level. Box 1 (red; 40°–60°S, 160°E–180°–145°W) and Box 2 (blue; 45°–65°S, 140°–70°W) in a and Box 3 (blue; 42°–62°S, 165°–100°W) in b indicate the focus areas, same as Boxes 1, 2, and 3 in Figs 2d and h.
Figure 12. Schematic diagram illustrating the differences of critical elements during EP and CP El Niño events. Red box (40°–60°S, 160°E–180°–145°W) and blue box (45°–65°S, 140°–70°W) in a and blue box (42°–62°S, 165°–100°W) in b indicate the focus areas, same as Boxes 1, 2, and 3 in Figs 2d and h. Black arrow: Rossby wave train path; pink upward arrow: upward motion; pink and blue curved arrows: wind; H: high-pressure anomaly center; L: low-pressure anomaly center; Q: total surface heat flux; +: increase; −: decrease.
Table 1. Category of EP El Niño and CP El Niño events from 1980 to 2021 determined by Nep and Ncp indices
Category Year EP El Niño 1982/1983, 1991/1992, 1997/1998, 2006/2007, 2015/2016 CP El Niño 1990/1991, 1994/1995, 2002/2003, 2004/2005, 2009/2010, 2014/2015, 2018/2019, 2019/2020 -
Arrigo K R, van Dijken G, Long M. 2008. Coastal Southern Ocean: A strong anthropogenic CO2 sink. Geophysical Research Letters, 35(21): L21602, doi: 10.1029/2008gl035624 Bell B, Hersbach H, Simmons A, et al. 2021. The ERA5 global reanalysis: preliminary extension to 1950. Quarterly Journal of the Royal Meteorological Society, 147(741): 4186–4227, doi: 10.1002/qj.4174 Bosc C, Delcroix T, Maes C. 2009. Barrier layer variability in the western Pacific warm pool from 2000 to 2007. Journal of Geophysical Research, 114(C6): C06023, doi: 10.1029/2008jc005187 Cai Wenju, Santoso A, Wang Guojian, et al. 2014. Increased frequency of extreme Indian Ocean Dipole events due to greenhouse warming. Nature, 510(7504): 254–258, doi: 10.1038/nature13327 Cai Wenju, van Rensch P, Cowan T, et al. 2011. Teleconnection pathways of ENSO and the IOD and the mechanisms for impacts on Australian rainfall. Journal of Climate, 24(15): 3910–3923, doi: 10.1175/2011jcli4129.1 Cai Wenju, Wu Lixin, Lengaigne M, et al. 2019. Pantropical climate interactions. Science, 363(6430): eaav4236, doi: 10.1126/science.aav4236 Carton J A, Grodsky S A, Liu Hailong. 2008. Variability of the oceanic mixed layer, 1960–2004. Journal of Climate, 21(5): 1029–1047, doi: 10.1175/2007jcli1798.1 Chen Mingcheng, Li T, Wang Xiaohui. 2019. Asymmetry of atmospheric responses to two-type El Niño and La Niña over northwest Pacific. Journal of Meteorological Research, 33(5): 826–836, doi: 10.1007/s13351-019-9022-0 Ciasto L M, England M H. 2011. Observed ENSO teleconnections to Southern Ocean SST anomalies diagnosed from a surface mixed layer heat budget. Geophysical Research Letters, 38(9): L09701, doi: 10.1029/2011gl046895 Clem K R, Fogt R L. 2015. South Pacific circulation changes and their connection to the tropics and regional Antarctic warming in austral spring, 1979–2012. Journal of Geophysical Research: Atmospheres, 120(7): 2773–2792, doi: 10.1002/2014jd022940 de Boyer Montégut C, Madec G, Fischer A S, et al. 2004. Mixed layer depth over the global ocean: an examination of profile data and a profile-based climatology. Journal of Geophysical Research: Oceans, 109(C12): C12003, doi: 10.1029/2004jc002378 de Boyer Montégut C, Mignot J, Lazar A, et al. 2007. Control of salinity on the mixed layer depth in the world ocean: 1. General description. Journal of Geophysical Research: Oceans, 112(C6): C06010, doi: 10.1029/2006jc003953 Ding Qinghua, Steig E J, Battisti D S, et al. 2011. Winter warming in West Antarctica caused by central tropical Pacific warming. Nature Geoscience, 4(6): 398–403, doi: 10.1038/ngeo1129 Dong Shenfu, Gille S T, Sprintall J. 2007. An assessment of the Southern Ocean mixed layer heat budget. Journal of Climate, 20(17): 4425–4442, doi: 10.1175/jcli4259.1 Dong Shenfu, Sprintall J, Gille S T, et al. 2008. Southern Ocean mixed-layer depth from Argo float profiles. Journal of Geophysical Research: Oceans, 113(C6): C06013, doi: 10.1029/2006jc004051 Duan Rui, Yang Kunde, Ma Yuanliang, et al. 2012. A study of the mixed layer of the South China Sea based on the multiple linear regression. Acta Oceanologica Sinica, 31(6): 19–31, doi: 10.1007/s13131-012-0250-8 Fogt R L, Bromwich D H, Hines K M. 2011. Understanding the SAM influence on the South Pacific ENSO teleconnection. Climate Dynamics, 36(7/8): 1555–1576, doi: 10.1007/s00382-010-0905-0 Foltz G R, McPhaden M J. 2009. Impact of barrier layer thickness on SST in the central tropical North Atlantic. Journal of Climate, 22(2): 285–299, doi: 10.1175/2008jcli2308.1 Gupta A S, England M H. 2006. Coupled ocean-atmosphere-ice response to variations in the southern annular mode. Journal of Climate, 19(18): 4457–4486, doi: 10.1175/JCLI3843.1 Helber R W, Kara A B, Richman J G, et al. 2012. Temperature versus salinity gradients below the ocean mixed layer. Journal of Geophysical Research: Oceans, 117(C5): C05006, doi: 10.1029/2011jc007382 Hersbach H, Bell B, Berrisford P, et al. 2020. The ERA5 global reanalysis. Quarterly Journal of the Royal Meteorological Society, 146(730): 1999–2049, doi: 10.1002/qj.3803 Holte J, Talley L. 2009. A new algorithm for finding mixed layer depths with applications to Argo Data and Subantarctic Mode Water Formation. Journal of Atmospheric and Oceanic Technology, 26(9): 1920–1939, doi: 10.1175/2009jtecho543.1 Hoskins B J, Karoly D J. 1981. The steady linear response of a spherical atmosphere to thermal and orographic forcing. Journal of the Atmospheric Sciences, 38(6): 1179–1196, doi: 10.1175/1520-0469(1981)038<1179:TSLROA>2.0.CO;2 Kao H Y, Yu Jinyi. 2009. Contrasting eastern-Pacific and central-Pacific types of ENSO. Journal of Climate, 22(3): 615–632, doi: 10.1175/2008jcli2309.1 Kara A B, Rochford P A, Hurlburt H E. 2003. Mixed layer depth variability over the global ocean. Journal of Geophysical Research: Oceans, 108(C3): 3079, doi: 10.1029/2000jc000736 Karoly D J, Hoskins B J. 1983. The steady, linear response of the stratosphere to tropospheric forcing. Quarterly Journal of the Royal Meteorological Society, 109(461): 455–478, doi: 10.1002/qj.49710946103 Kidson J W. 1999. Principal modes of Southern Hemisphere low-frequency variability obtained from NCEP-NCAR reanalyses. Journal of Climate, 12(2): 2808–2830, doi: 10.1175/1520-0442(1999)012<2808:PMOSHL>2.0.CO;2 Kug J S, Jin Feifei, An S I. 2009. Two types of El Niño events: cold tongue El Niño and warm pool El Niño. Journal of Climate, 22(6): 1499–1515, doi: 10.1175/2008jcli2624.1 Kuhlbrodt T, Griesel A, Montoya M, et al. 2007. On the driving processes of the Atlantic meridional overturning circulation. Reviews of Geophysics, 45(2): RG2001, doi: 10.1029/2004rg000166 L’Heureux M L, Thompson D W J. 2006. Observed relationships between the El Niño-Southern Oscillation and the extratropical zonal-mean circulation. Journal of Climate, 19(2): 276–287, doi: 10.1175/JCLI3617.1 Li Xichen, Cai Wenju, Meehl G A, et al. 2021. Tropical teleconnection impacts on Antarctic climate changes. Nature Reviews Earth & Environment, 2(10): 680–698, doi: 10.1038/s43017-021-00204-5 Li Qian, England M H. 2020. Tropical Indo-Pacific teleconnections to Southern Ocean mixed layer variability. Geophysical Research Letters, 47(15): e2020GL088466, doi: 10.1029/2020g l088466 Li Xichen, Gerber E P, Holland D M, et al. 2015a. A Rossby wave bridge from the tropical atlantic to west Antarctica. Journal of Climate, 28(6): 2256–2273, doi: 10.1175/jcli-d-14-00450.1 Li Xichen, Holland D M, Gerber E P, et al. 2014a. Impacts of the north and tropical Atlantic Ocean on the Antarctic Peninsula and sea ice. Nature, 505(7484): 538–542, doi: 10.1038/nature12945 Li Xichen, Holland D M, Gerber E P, et al. 2015b. Rossby waves mediate impacts of tropical oceans on west Antarctic Atmospheric Circulation in austral winter. Journal of Climate, 28(20): 8151–8164, doi: 10.1175/jcli-d-15-0113.1 Li Qian, Lee S, England M H, et al. 2019. Seasonal-to-interannual response of Southern Ocean mixed layer depth to the Southern Annular Mode from a global 1/10° ocean model. Journal of Climate, 32(18): 6177–6195, doi: 10.1175/jcli-d-19-0159.1 Li Gang, Li Chongyin, Tan Yanke, et al. 2014b. Observed relationship of boreal winter South Pacific Tripole SSTA with Eastern China rainfall during the following boreal spring. Journal of Climate, 27(21): 8094–8106, doi: 10.1175/jcli-d-14-00074.1 Liu Hailong, Grodsky S A, Carton J A. 2009. Observed subseasonal variability of oceanic barrier and compensated layers. Journal of Climate, 22(22): 6104–6119, doi: 10.1175/2009jcli2974.1 Luo Jingjia, Zhang Ruochao, Behera S K, et al. 2010. Interaction between El Niño and extreme Indian Ocean Dipole. Journal of Climate, 23(3): 726–742, doi: 10.1175/2009jcli3104.1 Meehl G A, Arblaster J M, Bitz C M, et al. 2016. Antarctic sea-ice expansion between 2000 and 2014 driven by tropical Pacific decadal climate variability. Nature Geoscience, 9(8): 590–595, doi: 10.1038/ngeo2751 Mitchell B G, Brody E A, Holm-Hansen O, et al. 1991. Light limitation of phytoplankton biomass and macronutrient utilization in the Southern Ocean. Limnology and Oceanography, 36(8): 1662–1677, doi: 10.4319/lo.1991.36.8.1662 Mo K C, Ghil M. 1987. Statistics and dynamics of persistent anomalies. Journal of the Atmospheric Sciences, 44(5): 877–902, doi: 10.1175/1520-0469(1987)044<0877:SADOPA>2.0.CO;2 Mo K C, Higgins R W. 1998. The Pacific-South American modes and tropical convection during the Southern Hemisphere winter. Monthly Weather Review, 126(6): 1581–1596, doi: 10.1175/1520-0493(1998)126<1581:TPSAMA>2.0.CO;2 Nardelli B B, Guinehut S, Verbrugge N, et al. 2017. Southern Ocean mixed-layer seasonal and interannual variations from combined satellite and in situ data. Journal of Geophysical Research: Oceans, 122(12): 10042–10060, doi: 10.1002/2017jc 013314 Nuncio M, Yuan Xiaojun. 2015. The influence of the Indian Ocean Dipole on Antarctic sea ice. Journal of Climate, 28(7): 2682–2690, doi: 10.1175/jcli-d-14-00390.1 Park J, Oh I S, Kim H C, et al. 2010. Variability of SeaWiFs chlorophyll-a in the southwest Atlantic sector of the Southern Ocean: strong topographic effects and weak seasonality. Deep-Sea Research Part I: Oceanographic Research Papers, 57(4): 604–620, doi: 10.1016/j.dsr.2010.01.004 Rayner N A, Parker D E, Horton E B, et al. 2003. Global analyses of sea surface temperature, sea ice, and night marine air temperature since the late nineteenth century. Journal of Geophysical Research: Atmospheres, 108(D14): 4407, doi: 10.1029/2002jd 002670 Ren Hongli, Jin Feifei. 2011. Niño indices for two types of ENSO. Geophysical Research Letters, 38(4): L04704, doi: 10.1029/2010gl 046031 Rondanelli R, Hatchett B, Rutllant J, et al. 2019. Strongest MJO on record triggers extreme Atacama rainfall and warmth in Antarctica. Geophysical Research Letters, 46(6): 3482–3491, doi: 10.1029/2018gl081475 Saji N H, Ambrizzi T, Ferraz S E T. 2005. Indian Ocean Dipole mode events and austral surface air temperature anomalies. Dynamics of Atmospheres and Oceans, 39(1/2): 87–101, doi: 10.1016/j.dynatmoce.2004.10.015 Sallée J B, Speer K G, Rintoul S R. 2010. Zonally asymmetric response of the Southern Ocean mixed-layer depth to the Southern Annular Mode. Nature Geoscience, 3(4): 273–279, doi: 10.1038/ngeo812 Sarmiento J L, Hughes T M C, Stouffer R J, et al. 1998. Simulated response of the ocean carbon cycle to anthropogenic climate warming. Nature, 393(6682): 245–249, doi: 10.1038/30455 Schneider D P, Okumura Y, Deser C. 2012. Observed antarctic interannual climate variability and tropical linkages. Journal of Climate, 25(12): 4048–4066, doi: 10.1175/jcli-d-11-00273.1 Turner J. 2004. The El Niño-southern oscillation and Antarctica. International Journal of Climatology, 24(1): 1–31, doi: 10.1002/joc.965 Vivier F, Iudicone D, Busdraghi F, et al. 2010. Dynamics of sea-surface temperature anomalies in the Southern Ocean diagnosed from a 2D mixed-layer model. Climate Dynamics, 34(2/3): 153–184, doi: 10.1007/s00382-009-0724-3 Wang Lu, Li T, Chen Lin, et al. 2018a. Modulation of the MJO intensity over the equatorial western Pacific by two types of El Niño. Climate Dynamics, 51(1/2): 687–700, doi: 10.1007/s00382-017-3949-6 Wang Ziqi, Zhang Wenjun, Geng Xin. 2017. Different influences of two types of ENSO on winter temperature and cold extremes in northern China. Acta Meteorologica Sinica (in Chinese), 75(4): 564–580, doi: 10.11676/qxxb2017.038 Wang Zhongpeng, Zhang Zhaoru, Zhou Meng, et al. 2020. Seasonal linkage of the Southern Hemisphere extratropical climate variability to two types of ENSO. Acta Oceanologica Sinica, 39(1): 63–73, doi: 10.1007/s13131-019-1528-x Xiao Xianjun, Wang Dongxiao, Zhou Wen, et al. 2013. Impacts of a wind stress and a buoyancy flux on the seasonal variation of mixing layer depth in the South China Sea. Acta Oceanologica Sinica, 32(9): 30–37, doi: 10.1007/s13131-013-0349-6 Yeh S W, Kug J S, Dewitte B, et al. 2009. El Niño in a changing climate. Nature, 461(7263): 511–514, doi: 10.1038/nature08316 Ying Meijia, Liu Hailong, Wang Fuchang, et al. 2019. Spatio-temporal variations of mixed layer depth in Southern Ocean. Oceanologia et Limnologia Sinica (in Chinese), 50(6): 1223–1232, doi: 10.11693/hyhz20190800153 Yu Jinyi, Kao H Y. 2007. Decadal changes of ENSO persistence barrier in SST and ocean heat content indices: 1958–2001. Journal of Geophysical Research: Atmospheres, 112(D13): D13106, doi: 10.1029/2006jd007654 Zhang Wenjun, Jin Feifei, Li Jianping, et al. 2011. Contrasting impacts of two-type El Niño over the western North Pacific during boreal autumn. Journal of the Meteorological Society of Japan. Ser. II, 89(5): 563–569, doi: 10.2151/jmsj.2011-510 Zhang Chao, Li T, Li Shuanglin. 2021. Impacts of CP and EP El Niño events on the Antarctic sea ice in austral spring. Journal of Climate, 34(23): 9327–9348, doi: 10.1175/jcli-d-21-0002.1 Zhang Wenjun, Mei Xuebin, Geng Xin, et al. 2019. A nonstationary ENSO-NAO relationship due to AMO modulation. Journal of Climate, 32(1): 33–43, doi: 10.1175/jcli-d-18-0365.1 Zhang Zhaoru, Uotila P, Stössel A, et al. 2018. Seasonal southern hemisphere multi-variable reflection of the southern annular mode in atmosphere and ocean reanalyses. Climate Dynamics, 50(3/4): 1451–1470, doi: 10.1007/s00382-017-3698-6 Zuo Hao, Balmaseda M A, Tietsche S, et al. 2019. The ECMWF operational ensemble reanalysis-analysis system for ocean and sea ice: a description of the system and assessment. Ocean Science, 15(3): 779–808, doi: 10.5194/os-15-779-2019 -


 下载:
下载:


