

-
Abstract: The spaceborne platform has unprecedently provided the global eddy-permitting (typically ~0.25°) products of Sea Surface Salinity (SSS), however the existing SSS products can hardly resolve mesoscale motions due to the heavy noises therein and the over-smoothing in denoising processes. By means of the Multi-fractal Fusion (MFF), the high-resolution SSS product is synthesized with the template of Sea Surface Temperature (SST). Two low-resolution SSS products and four SST products are considered as the source data and the templates respectively to determine the best combination. The fused products are validated by the in situ observations and intercompared via SSS maps, Singularity Exponent maps and wavenumber spectra. The results demonstrate that the MFF can perform a good work in mitigating the noises and improving the resolution. The Climate Change Initiative (CCI) SSS + the REMote Sensing System (REMSS) SST can produce the 0.1° denoised product whose global mean STandard Derivation (STD) against Argo is 0.21 psu and the feature resolution can reach 30-40 km.
-
Key words:
- sea surface salinity /
- multi-fractal fusion /
- high resolution
-

Figure 1. The meridional wavenumber spectra for the four SST products. From (a) to (d): Southern Indian Ocean (SIO), Gulf Stream (GS), Kuroshio Current (KC) and Tropical Pacific (TP).

Figure 2. The differences between the different salinity products and Argo (located at the pixels). BEC: BEC-based products; CCI: CCI-based products; ori: original product; Gauss: Gaussian-filtered product; OISST: multi-fractal fusion product with OISST template; REMSS: multi-fractal fusion product with REMSS template.

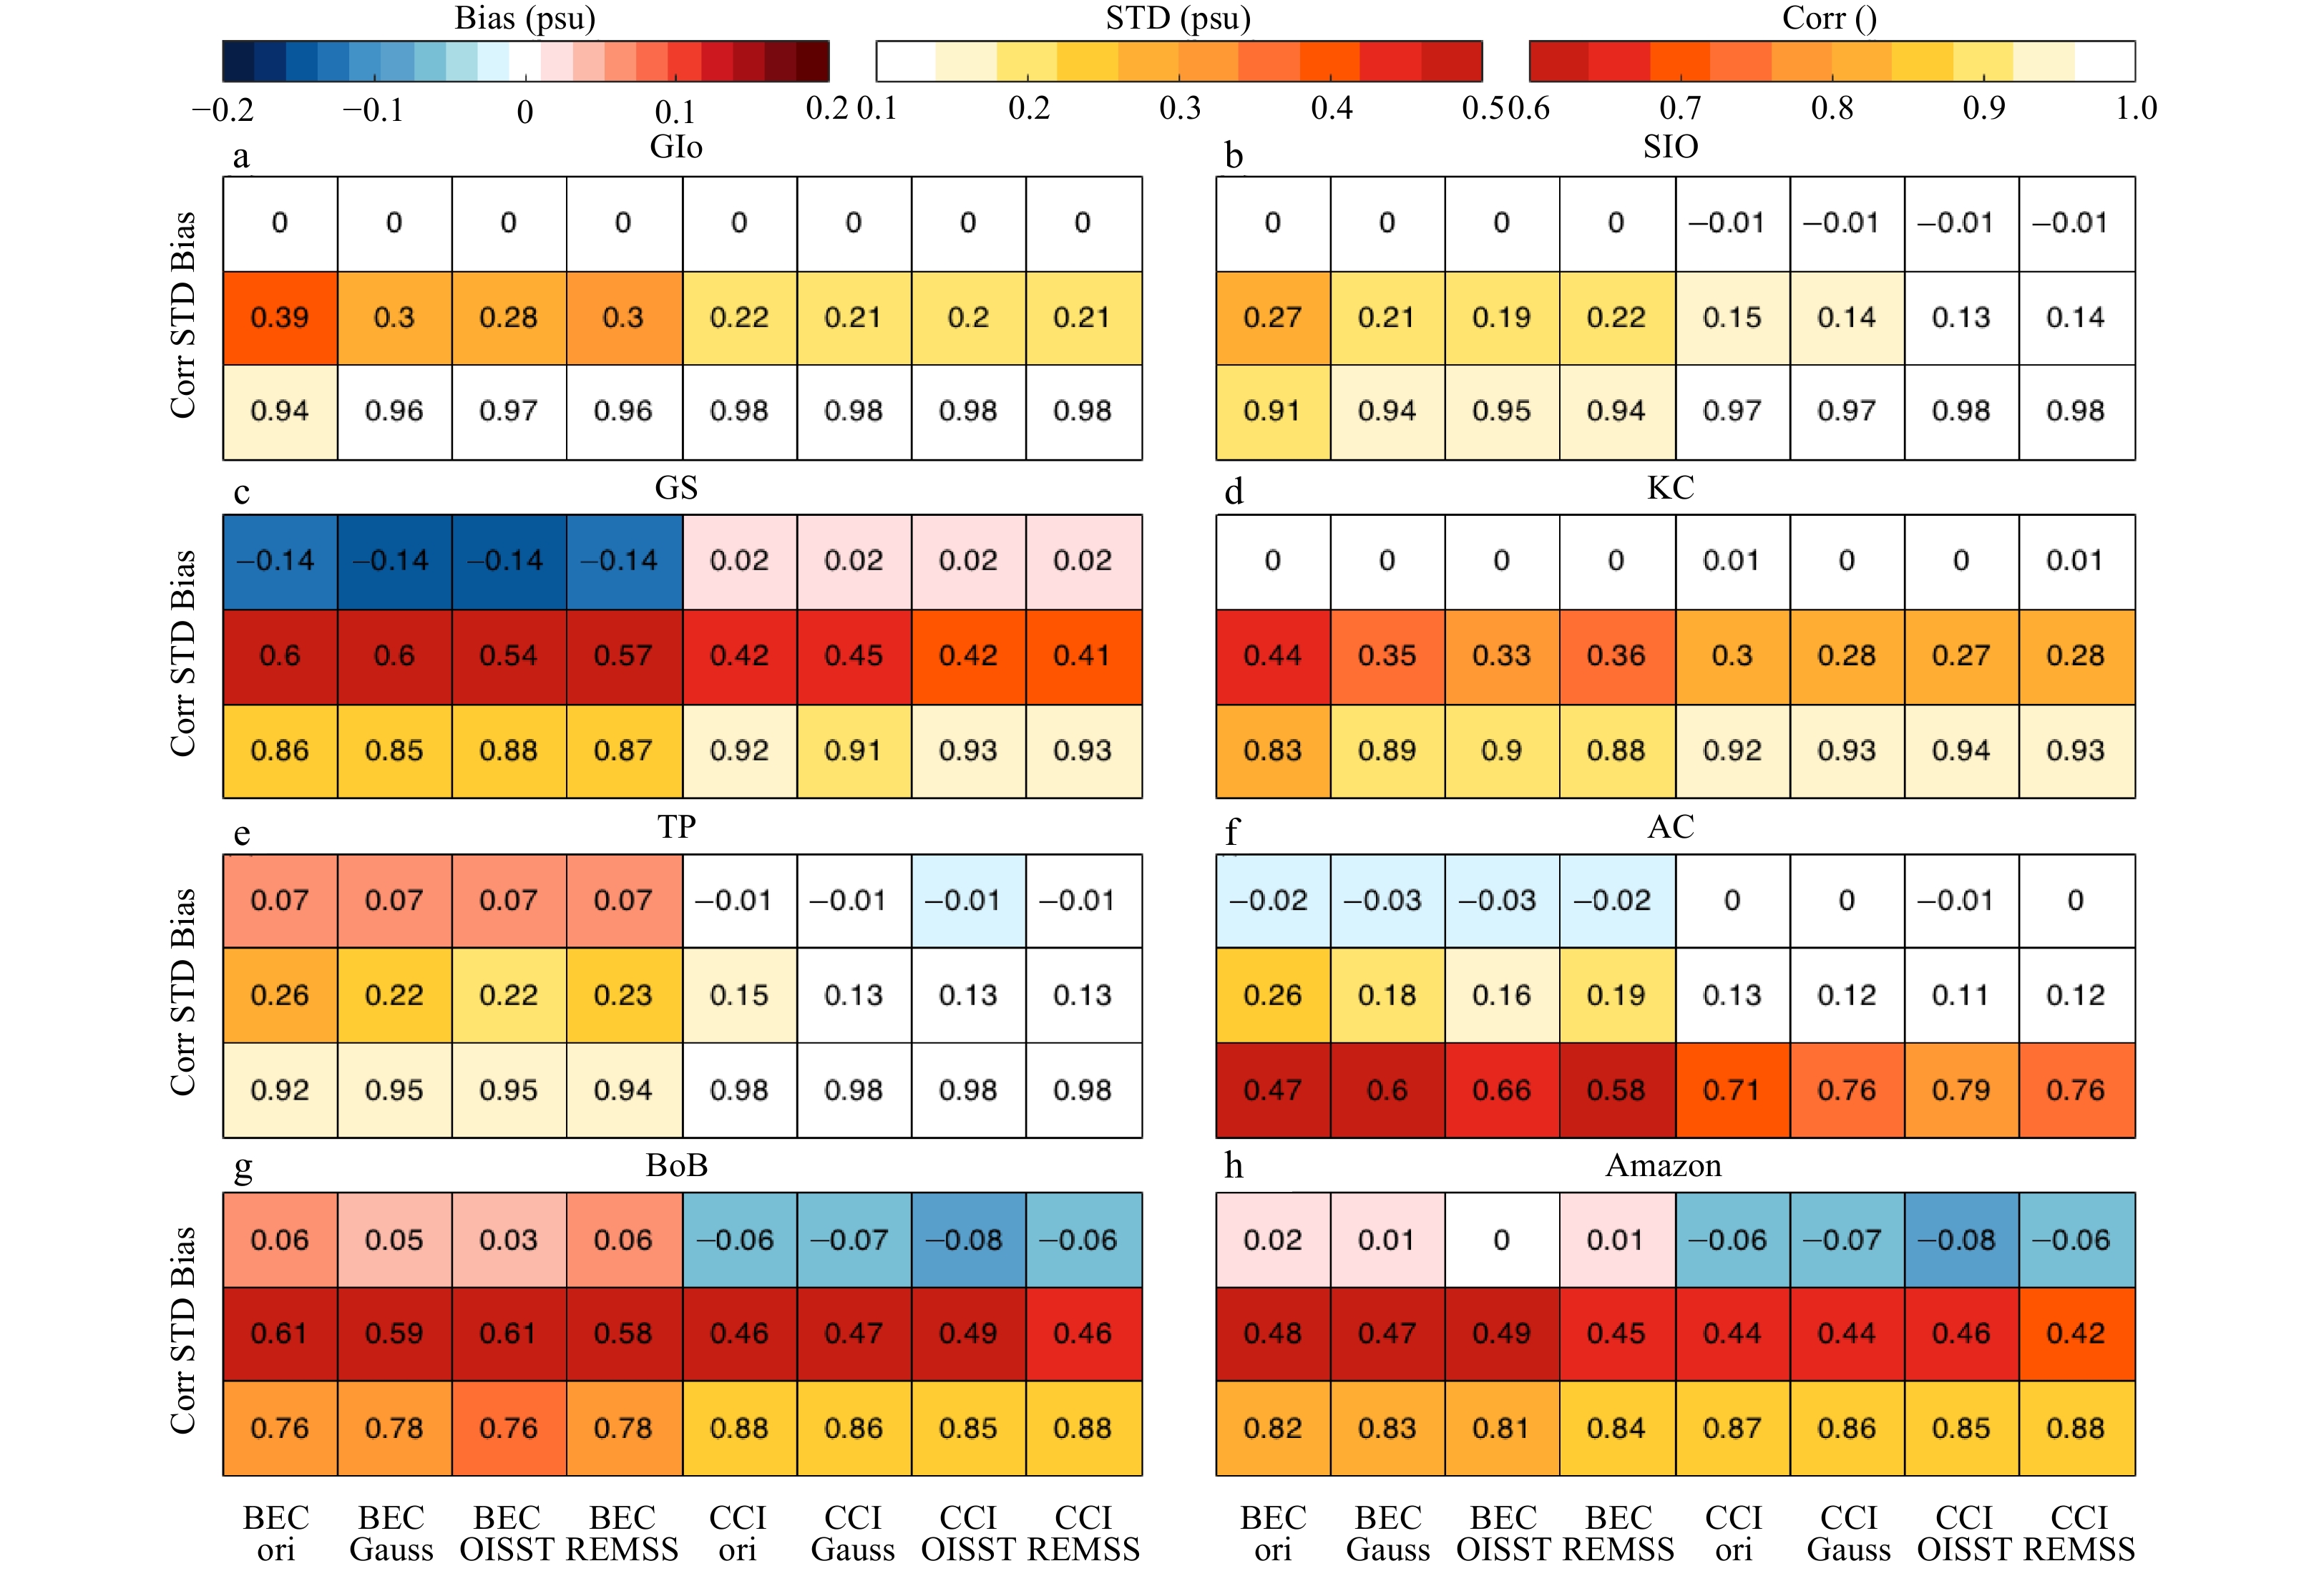
Figure 3. The statistics for the different SSS products with respect to Argo. Eight regions were examined. For each panel, the bias, the STD, and the correlation coefficient are plotted from top to bottom, respectively. From (a) to (h): Global ocean between 60oS and 60oN (Glo); South Indian Ocean (SIO); Gulf Stream (GS); Kuroshio Current (KC); Tropical Pacific (TP); Agulhas Current (AC); Bay of Bengal (BoB); Amazon plume (Amazon). BEC: BEC-based products; CCI: CCI-based products; ori: original product; Gauss: Gaussian-filtered product; OISST: multi-fractal fusion product with OISST template; REMSS: multi-fractal fusion product with REMSS template.

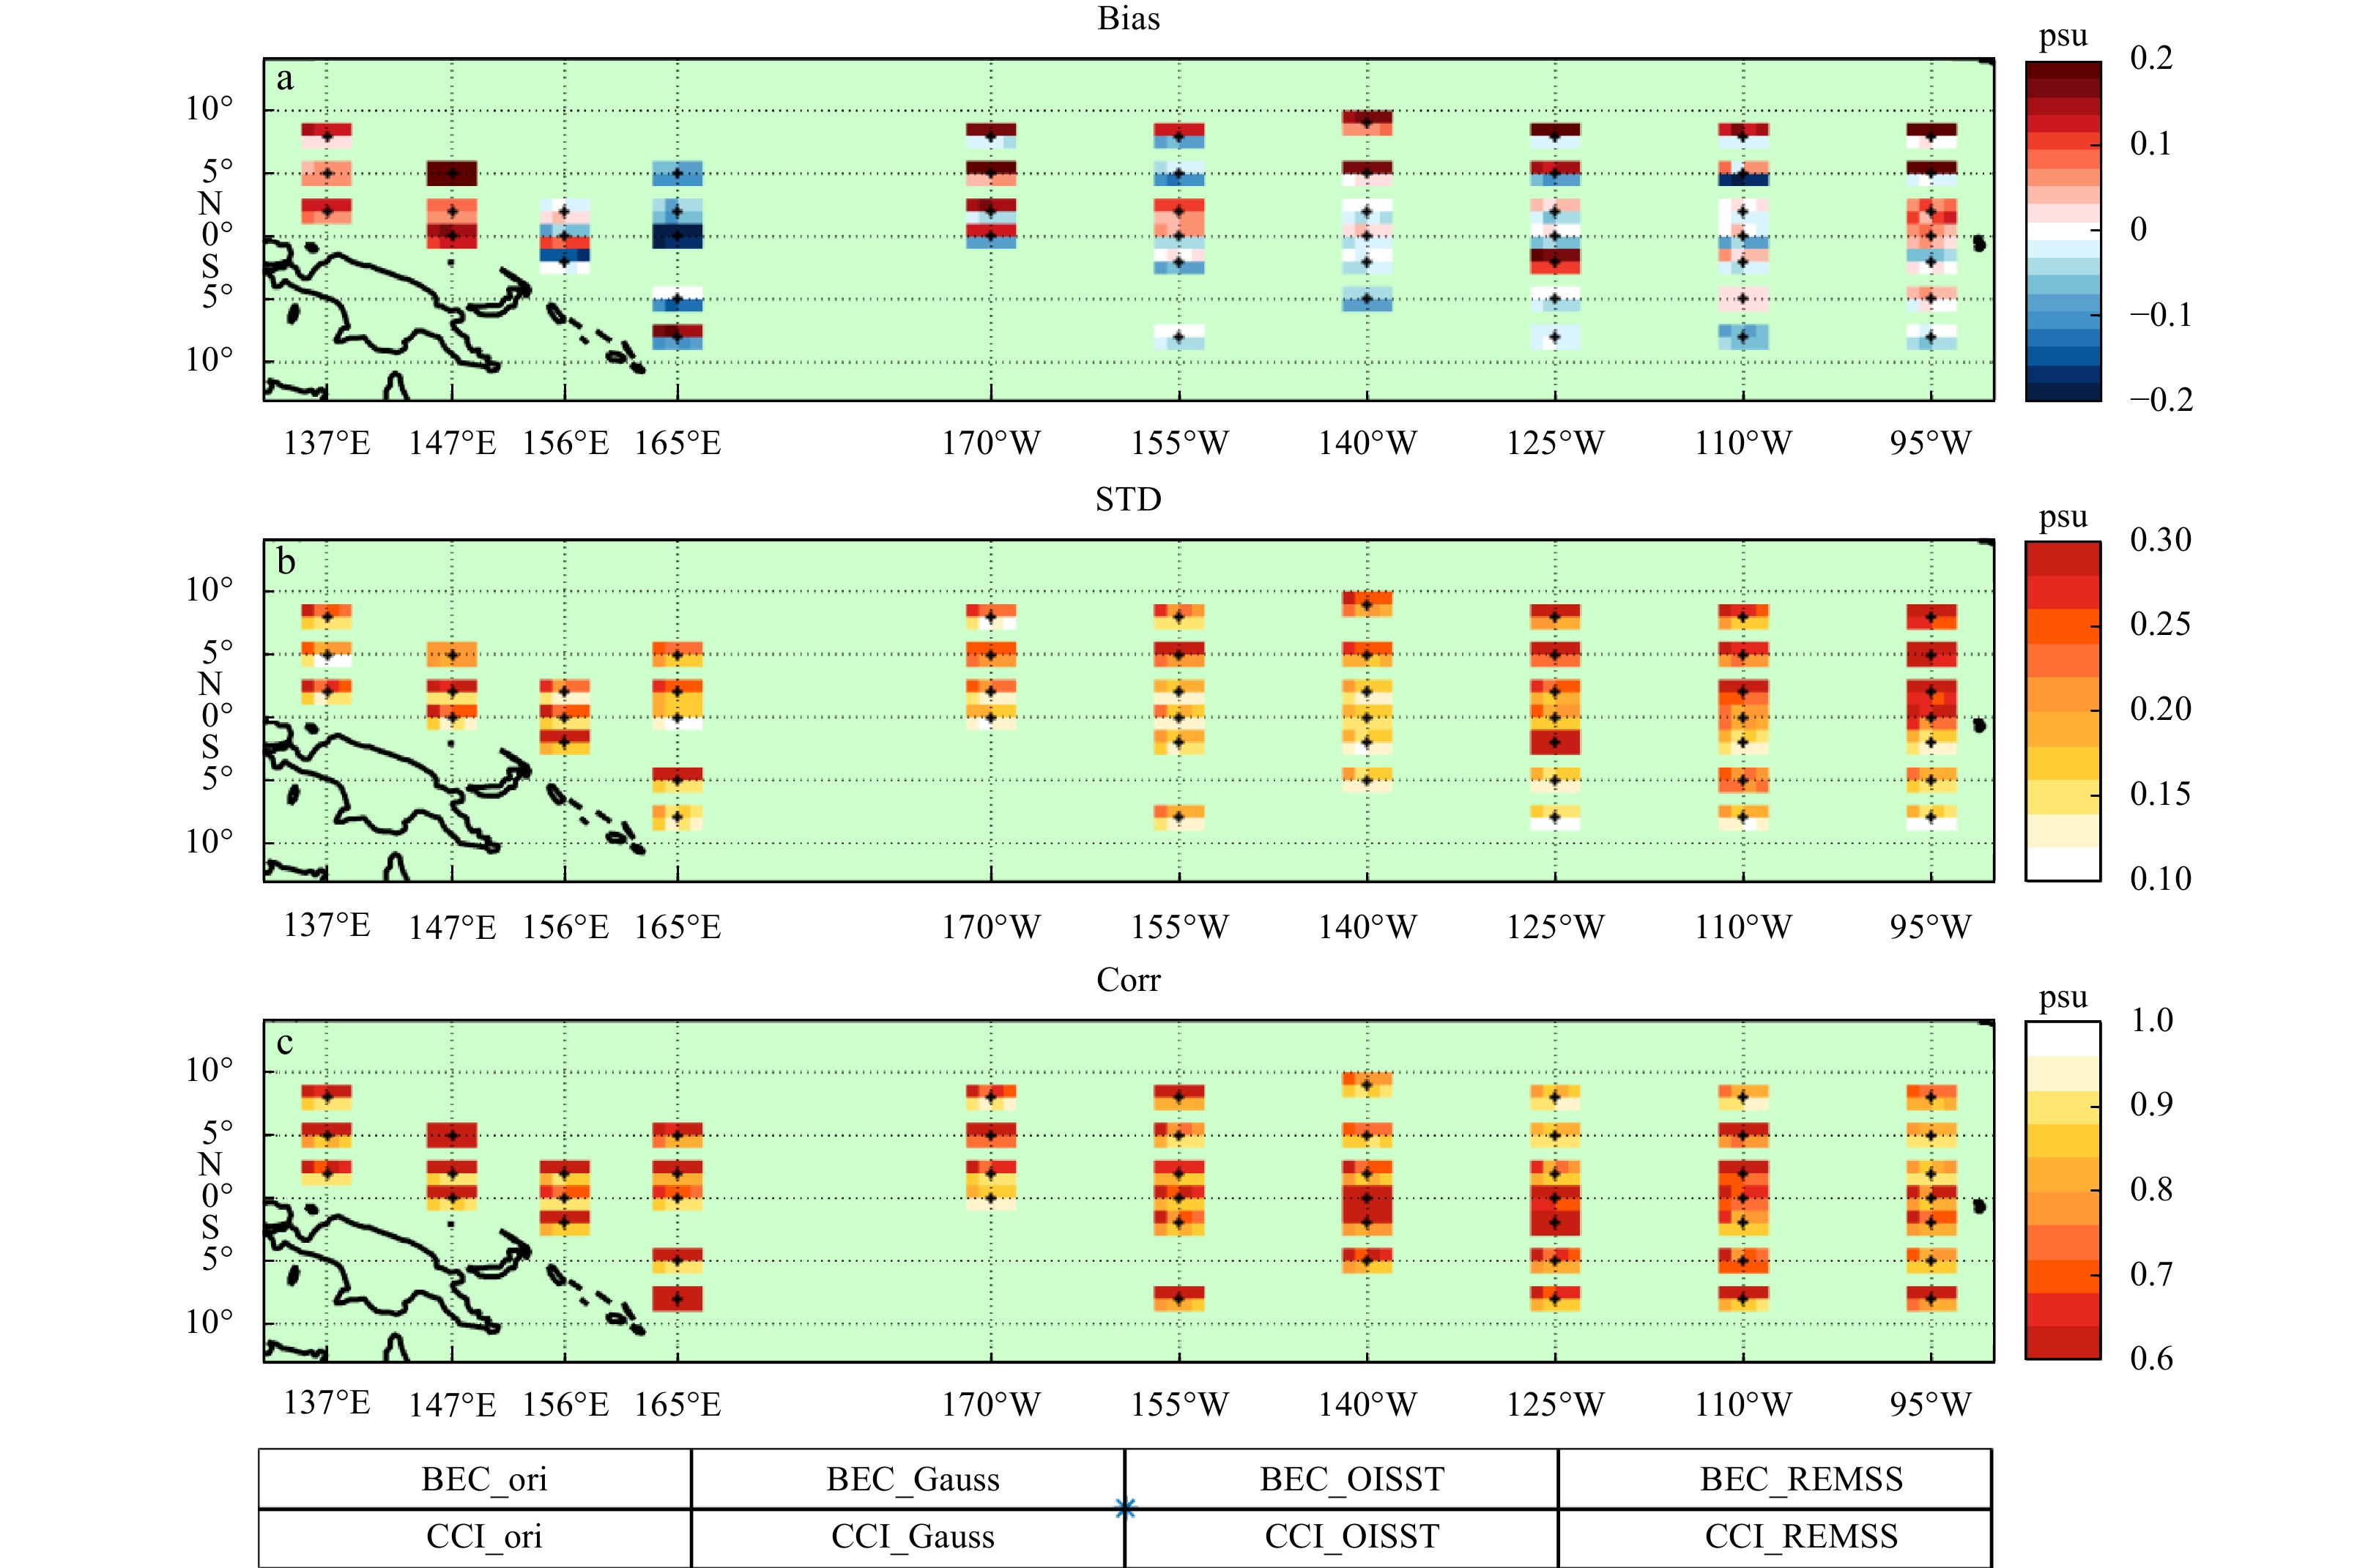
Figure 4. The bias (panel (a)), the STD (panel (b)) and correlation coefficient (panel (c)) for the different SSS products with respect to the series of TAO. Each star point labels the position of the mooring buoy, encompassed by the distribution of 2 × 4 pixels. As shown in the diagram at the bottom, the upper four pixels represent the BEC-based products while the lower four pixel represent the CCI-based products. BEC: BEC-based products; CCI: CCI-based products; ori: original product; Gauss: Gaussian-filtered product; OISST: multi-fractal fusion product with OISST template; REMSS: multi-fractal fusion product with REMSS template.

Figure 5. Maps of the different SSS products in the region of the Kuroshio Current on March 15th 2016. The same contours are plotted in each panel ranging from 32 psu to 35.5 psu at the interval of 0.1 psu. BEC: BEC-based products; CCI: CCI-based products; ori: original product; Gauss: Gaussian-filtered product; OISST: multi-fractal fusion product with OISST template; REMSS: multi-fractal fusion product with REMSS template.

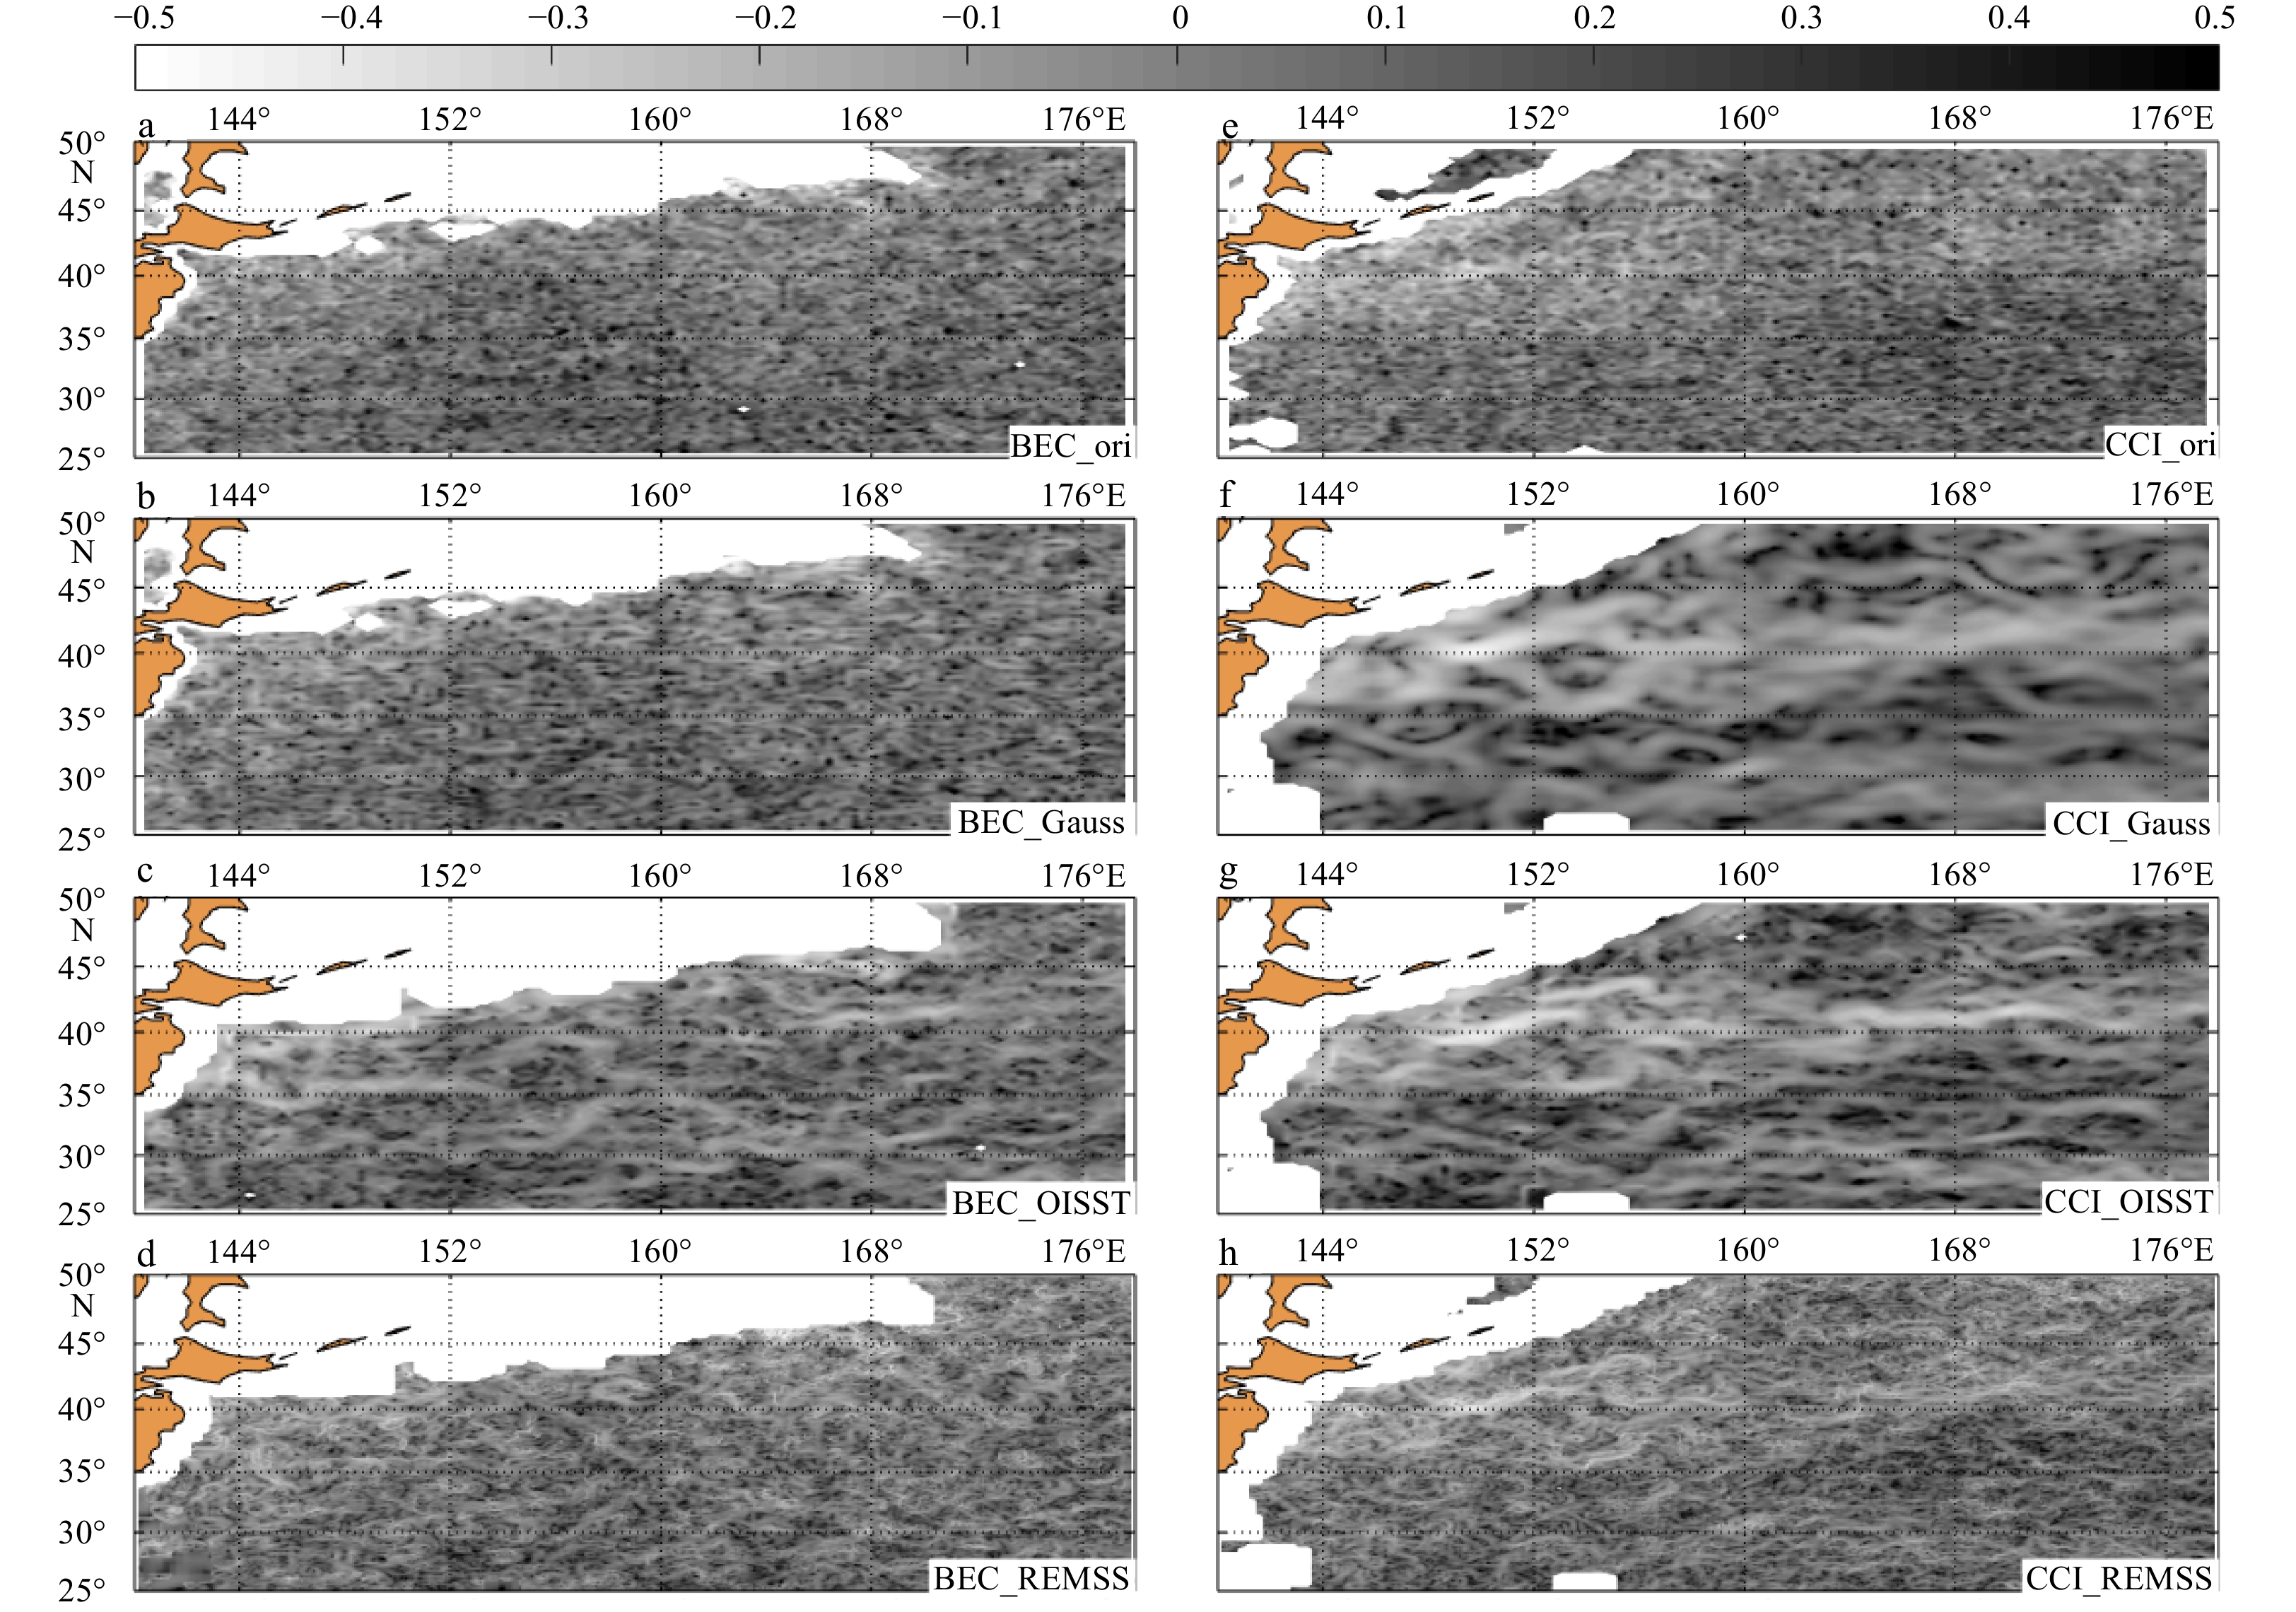
Figure 6. Maps of the singularity exponents for the different SSS products in the region of the Kuroshio Current. The same contours are plotted in each panel ranging from -0.5 to 0.5 at the interval of 0.01. BEC: BEC-based products; CCI: CCI-based products; ori: original product; Gauss: Gaussian-filtered product; OISST: multi-fractal fusion product with OISST template; REMSS: multi-fractal fusion product with REMSS template.

Figure 7. The meridional wavenumber spectra for the SSS products. From (a) to (d): Southern Indian Ocean (SIO), Gulf Stream (GS), Kuroshio Current (KC) and Tropical Pacific (TP). BEC: BEC-based products; CCI: CCI-based products; ori: original product; Gauss: Gaussian-filtered product; OISST: multi-fractal fusion product with OISST template; REMSS: multi-fractal fusion product with REMSS template.
Table 1. The statistics of TAO 137e5e corresponding to Figure 4.
ori Gauss MFF_OISST MFF_REMSS bias BEC 0.05 0.06 0.05 0.06 CCI 0.05 0.07 0.06 0.06 STD BEC 0.25 0.19 0.21 0.20 CCI 0.14 0.11 0.12 0.11 Corr BEC 0.43 0.54 0.50 0.52 CCI 0.79 0.85 0.84 0.85  下载: 导出CSV
-
Bao Senliang, Wang Huizan, Zhang Ren, et al. 2019. Comparison of satellite-derived sea surface salinity products from SMOS, Aquarius, and SMAP. Journal of Geophysical Research: Oceans, 124(3): 1932–1944. doi: 10.1029/2019JC014937 Boutin J, Chao Y, Asher W E, et al. 2016. Satellite and in situ salinity: understanding near-surface stratification and subfootprint variability. Bulletin of the American Meteorological Society, 97(8): 1391–1407. doi: 10.1175/BAMS-D-15-00032.1 Boutin J, Martin N, Yin Xiaobin, et al. 2012. First assessment of SMOS data over open ocean: Part II-sea surface salinity. IEEE Transactions on Geoscience and Remote Sensing, 50(5): 1662–1675. doi: 10.1109/TGRS.2012.2184546 Boutin J, Reul N, Koehler J, et al. 2020. Overview of the CCI+SSS project. In: Proceedings of the 22nd EGU General Assembly. EGU. Boutin J, Vergely J L, Marchand S, et al. 2018. New SMOS Sea Surface Salinity with reduced systematic errors and improved variability. Remote Sensing of Environment, 214: 115–134. doi: 10.1016/j.rse.2018.05.022 Buongiorno Nardelli B. 2012. A novel approach for the high-resolution interpolation of in situ sea surface salinity. Journal of Atmospheric and Oceanic Technology, 29(6): 867–879. doi: 10.1175/JTECH-D-11-00099.1 Buongiorno Nardelli B, Droghei R, Santoleri R. 2016. Multi-dimensional interpolation of SMOS sea surface salinity with surface temperature and in situ salinity data. Remote Sensing of Environment, 180: 392–402. doi: 10.1016/j.rse.2015.12.052 Callies J, Ferrari R. 2013. Interpreting energy and tracer spectra of upper-ocean turbulence in the submesoscale range (1–200 km). Journal of Physical Oceanography, 43(11): 2456–2474. doi: 10.1175/JPO-D-13-063.1 Chin T M, Vazquez-Cuervo J, Armstrong E M. 2017. A multi-scale high-resolution analysis of global sea surface temperature. Remote Sensing of Environment, 200: 154–169. doi: 10.1016/j.rse.2017.07.029 Ciani D, Rio M H, Nardelli B B, et al. 2020. Improving the altimeter-derived surface currents using Sea Surface Temperature (SST) data: A sensitivity study to SST products. Remote Sensing, 12(10): 1601. doi: 10.3390/rs12101601 Donlon CJ, Martin M, Stark J, et al. 2012. The Operational Sea Surface Temperature and Sea Ice Analysis (OSTIA) system. Remote Sensing of Environment, 116: 140–158. doi: 10.1016/j.rse.2010.10.017 Droghei R, Buongiorno Nardelli B, Santoleri R. 2016. Combining in situ and satellite observations to retrieve salinity and density at the ocean surface. Journal of Atmospheric and Oceanic Technology, 33(6): 1211–1223. doi: 10.1175/JTECH-D-15-0194.1 Droghei R, Buongiorno Nardelli B, Santoleri R. 2018. A new global sea surface salinity and density dataset from multivariate observations (1993–2016). Frontiers in Marine Science, 5: 84. doi: 10.3389/fmars.2018.00084 Entekhabi D, Njoku E G, O’Neill P E, et al. 2010. The soil moisture active passive (SMAP) mission. Proceedings of the IEEE, 98(5): 704–716. doi: 10.1109/JPROC.2010.2043918 Font J, Camps A, Borges A, et al. 2010. SMOS: The challenging sea surface salinity measurement from space. Proceedings of the IEEE, 98(5): 649–665. doi: 10.1109/JPROC.2009.2033096 Hasson A, Puy M, Boutin J, et al. 2018. Northward pathway across the tropical North Pacific Ocean revealed by surface salinity: how do El Niño Anomalies Reach Hawaii?. Journal of Geophysical Research: Oceans, 123(4): 2697–2715. doi: 10.1002/2017JC013423 Hoareau N, Turiel A, Portabella M, et al. 2018. Singularity power spectra: a method to assess geophysical consistency of gridded products-application to sea-surface salinity remote sensing maps. IEEE Transactions on Geoscience and Remote Sensing, 56(9): 5525–5536. doi: 10.1109/TGRS.2018.2819240 Isern-Fontanet J, Olmedo E, Turiel A, et al. 2016. Retrieval of eddy dynamics from SMOS sea surface salinity measurements in the Algerian Basin (Mediterranean Sea). Geophysical Research Letters, 43(12): 6427–6434. doi: 10.1002/2016GL069595 Isern-Fontanet J, Turiel A, García-Ladona E, et al. 2007. Microcanonical multifractal formalism: Application to the estimation of ocean surface velocities. Journal of Geophysical Research: Oceans, 112(C5): C05024. doi: 10.1029/2006JC003878 Kao H Y, Lagerloef G S E. 2015. Salinity fronts in the tropical Pacific Ocean. Journal of Geophysical Research: Oceans, 120(2): 1096–1106. doi: 10.1002/2014JC010114 Le Vine D M, Lagerloef G S E, Torrusio S E. 2010. Aquarius and remote sensing of sea surface salinity from space. Proceedings of the IEEE, 98(5): 688–703. doi: 10.1109/JPROC.2010.2040550 Li Z, Liu Z, Xing X. 2019. User Manual for Global Argo Observational data set (V3. 0) (1997–2018). China Argo Real-time Data Center, Hangzhou 33pp Maes C, Reul N, Behringer D, et al. 2014. The salinity signature of the equatorial Pacific cold tongue as revealed by the satellite SMOS mission. Geoscience Letters, 1(1): 17. doi: 10.1186/s40562-014-0017-5 Martín-Neira M, Oliva R, Corbella I, et al. 2016. SMOS instrument performance and calibration after 6 years in orbit. In: International Geoscience and Remote Sensing Symposium (IGARSS). Beijing: IEEE. Meissner T, Wentz F J, Le Vine D M. 2018. The salinity retrieval algorithms for the NASA Aquarius version 5 and SMAP version 3 releases. Remote Sensing, 10(7): 1121. doi: 10.3390/rs10071121 Melnichenko O, Amores A, Maximenko N, et al. 2017. Signature of mesoscale eddies in satellite sea surface salinity data. Journal of Geophysical Research: Oceans, 122(2): 1416–1424. doi: 10.1002/2016JC012264.Received Mu Ziyao, Zhang Weimin, Wang Pingqiang, et al. 2019. Assimilation of SMOS sea surface salinity in the regional ocean model for South China Sea. Remote Sensing, 11(8): 919. doi: 10.3390/rs11080964 Nieves V, Llebot C, Turiel A, et al. 2007. Common turbulent signature in sea surface temperature and chlorophyll maps. Geophysical Research Letters, 34(23): L23602. doi: 10.1029/2007GL030823 Olmedo E, González-Haro C, Hoareau N, et al. 2021. Nine years of SMOS sea surface salinity global maps at the Barcelona Expert Center. Earth System Science Data, 13(2): 857–888. doi: 10.5194/essd-13-857-2021 Olmedo E, Martínez J, Turiel A, et al. 2017. Debiased non-Bayesian retrieval: A novel approach to SMOS Sea Surface Salinity. Remote Sensing of Environment, 193: 103–126. doi: 10.1016/j.rse.2017.02.023 Olmedo E, Martínez J, Umbert M, et al. 2016. Improving time and space resolution of SMOS salinity maps using multifractal fusion. Remote Sensing of Environment, 180: 246–263. doi: 10.1016/j.rse.2016.02.038 Pont O, Turiel A, Pérez-Vicente C J. 2009. Empirical evidences of a common multifractal signature in economic, biological and physical systems. Physica A: Statistical Mechanics and its Applications, 388(10): 2025–2035. doi: 10.1016/j.physa.2009.01.041 Qu Tangdong, Yu Jinyi. 2014. ENSO indices from sea surface salinity observed by Aquarius and Argo. Journal of Oceanography, 70(4): 367–375. doi: 10.1007/s10872-014-0238-4 Reul N, Grodsky S A, Arias M, et al. 2020. Sea surface salinity estimates from spaceborne L-band radiometers: An overview of the first decade of observation (2010–2019). Remote Sensing of Environment, 242: 111769. doi: 10.1016/j.rse.2020.111769 Reul N, Tenerelli J, Boutin J, et al. 2012. Overview of the first SMOS sea surface salinity products. Part I: Quality assessment for the second half of 2010. IEEE Transactions on Geoscience and Remote Sensing, 50(5): 1636–1647. doi: 10.1109/TGRS.2012.2188408 Reynolds R W, Chelton D B. 2010. Comparisons of daily Sea surface temperature analyses for 2007–08. Journal of Climate, 23(13): 3545–3562. doi: 10.1175/2010JCLI3294.1 Tang Wenqing, Fore A, Yueh S, et al. 2017. Validating SMAP SSS with in situ measurements. Remote Sensing of Environment, 200: 326–340. doi: 10.1016/j.rse.2017.08.021 Turiel A, Isern-Fontanet J, Garcia-Ladona E, et al. 2005. Multifractal method for the instantaneous evaluation of the stream function in geophysical flows. Physical Review Letters, 95(10): 104502. doi: 10.1103/PhysRevLett.95.104502 Turiel A, Isern-Fontanet J, Umbert M. 2014. Sensibility to noise of new multifractal fusion methods for ocean variables. Nonlinear Processes in Geophysics, 21(1): 291–301. doi: 10.5194/npg-21-291-2014 Turiel A, Yahia H, Pérez-Vicente C J. 2008. Microcanonical multifractal formalism - A geometrical approach to multifractal systems: Part I. Singularity analysis. Journal of Physics A:Mathematical and Theoretical, 41(1): 015501. doi: 10.1088/1751-8113/41/1/015501 Umbert M, Guimbard S, Lagerloef G, et al. 2015. Detecting the surface salinity signature of Gulf Stream cold-core rings in Aquarius synergistic products. Journal of Geophysical Research: Oceans, 120(2): 859–874. doi: 10.1002/2014JC010466 Umbert M, Hoareau N, Turiel A, et al. 2014. New blending algorithm to synergize ocean variables: The case of SMOS sea surface salinity maps. Remote Sensing of Environment, 146: 172–187. doi: 10.1016/j.rse.2013.09.018 Vergara O, Morrow R, Pujol I, et al. 2019. Revised global wave number spectra from recent altimeter observations. Journal of Geophysical Research: Oceans, 124(6): 3523–3537. doi: 10.1029/2018JC014844 Vernieres G, Kovach R, Keppenne C, et al. 2014. The impact of the assimilation of Aquarius sea surface salinity data in the GEOS ocean data assimilation system. Journal of Geophysical Research: Oceans, 119(10): 6974–6987. doi: 10.1002/2014JC010006 Vinogradova N, Lee T, Boutin J, et al. 2019. Satellite salinity observing system: Recent discoveries and the way forward. Frontiers in Marine Science, 6: 243. doi: 10.3389/fmars.2019.00243 Xu Yongsheng, Fu L L. 2011. Global variability of the wavenumber spectrum of oceanic mesoscale turbulence. Journal of Physical Oceanography, 41(4): 802–809. doi: 10.1175/2010JPO4558.1 Xu Yongsheng, Fu L L. 2012. The effects of altimeter instrument noise on the estimation of the wavenumber spectrum of sea surface height. Journal of Physical Oceanography, 42(12): 2229–2233. doi: 10.1175/jpo-d-12-0106.1 Yan Hengqian, Wang Huizan, Zhang Ren, et al. 2021. The inconsistent pairs between in situ observations of near surface salinity and multiple remotely sensed salinity data. Earth and Space Science, 8(5): e2020EA001355. doi: 10.1029/2020EA001355 -


 点击查看大图
计量
- 文章访问数: 86
- HTML全文浏览量: 41
- 被引次数: 0

