

-
Abstract: During the 10th Chinese Arctic scientific expedition carried out in the summer of 2019, the surface current in the high-latitude areas of the Arctic Ocean was observed using a self-developed surface drifting buoy, which was initially deployed in the Chukchi Sea. The buoy traversed the Chukchi Sea, Chukchi Abyssal Plain, Mendeleev Ridge, Makarov Basin, and Canada Basin over a period of 632 d. After returning to the Mendeleev Ridge, it continued to drift toward the pole. Overall, the track of the buoy reflected the characteristics of the transpolar drift and Chukchi Slope Current, as well as the inertial flow, cross-ridge surface flow, and even the surface disorganized flow for some time intervals. The results showed that: (1) the transpolar drift mainly occurs in the Chukchi Abyssal Plain, Mendeleev Ridge, and western Canada Basin to the east of the ridge where sea ice concentration is high, and the average northward flow velocity in the region between 79.41°N and 86.32°N was 5.1 cm/s; (2) the average surface velocity of the Chukchi Slope Current was 13.5 cm/s, and while this current moves westward along the continental slope, it also extends northwestward across the continental slope and flows to the deep sea; and (3) when sea ice concentration was less than 50%, the inertial flow was more significant (the maximum observed inertial flow was 26 cm/s, and the radius of the inertia circle was 3.6 km).
-
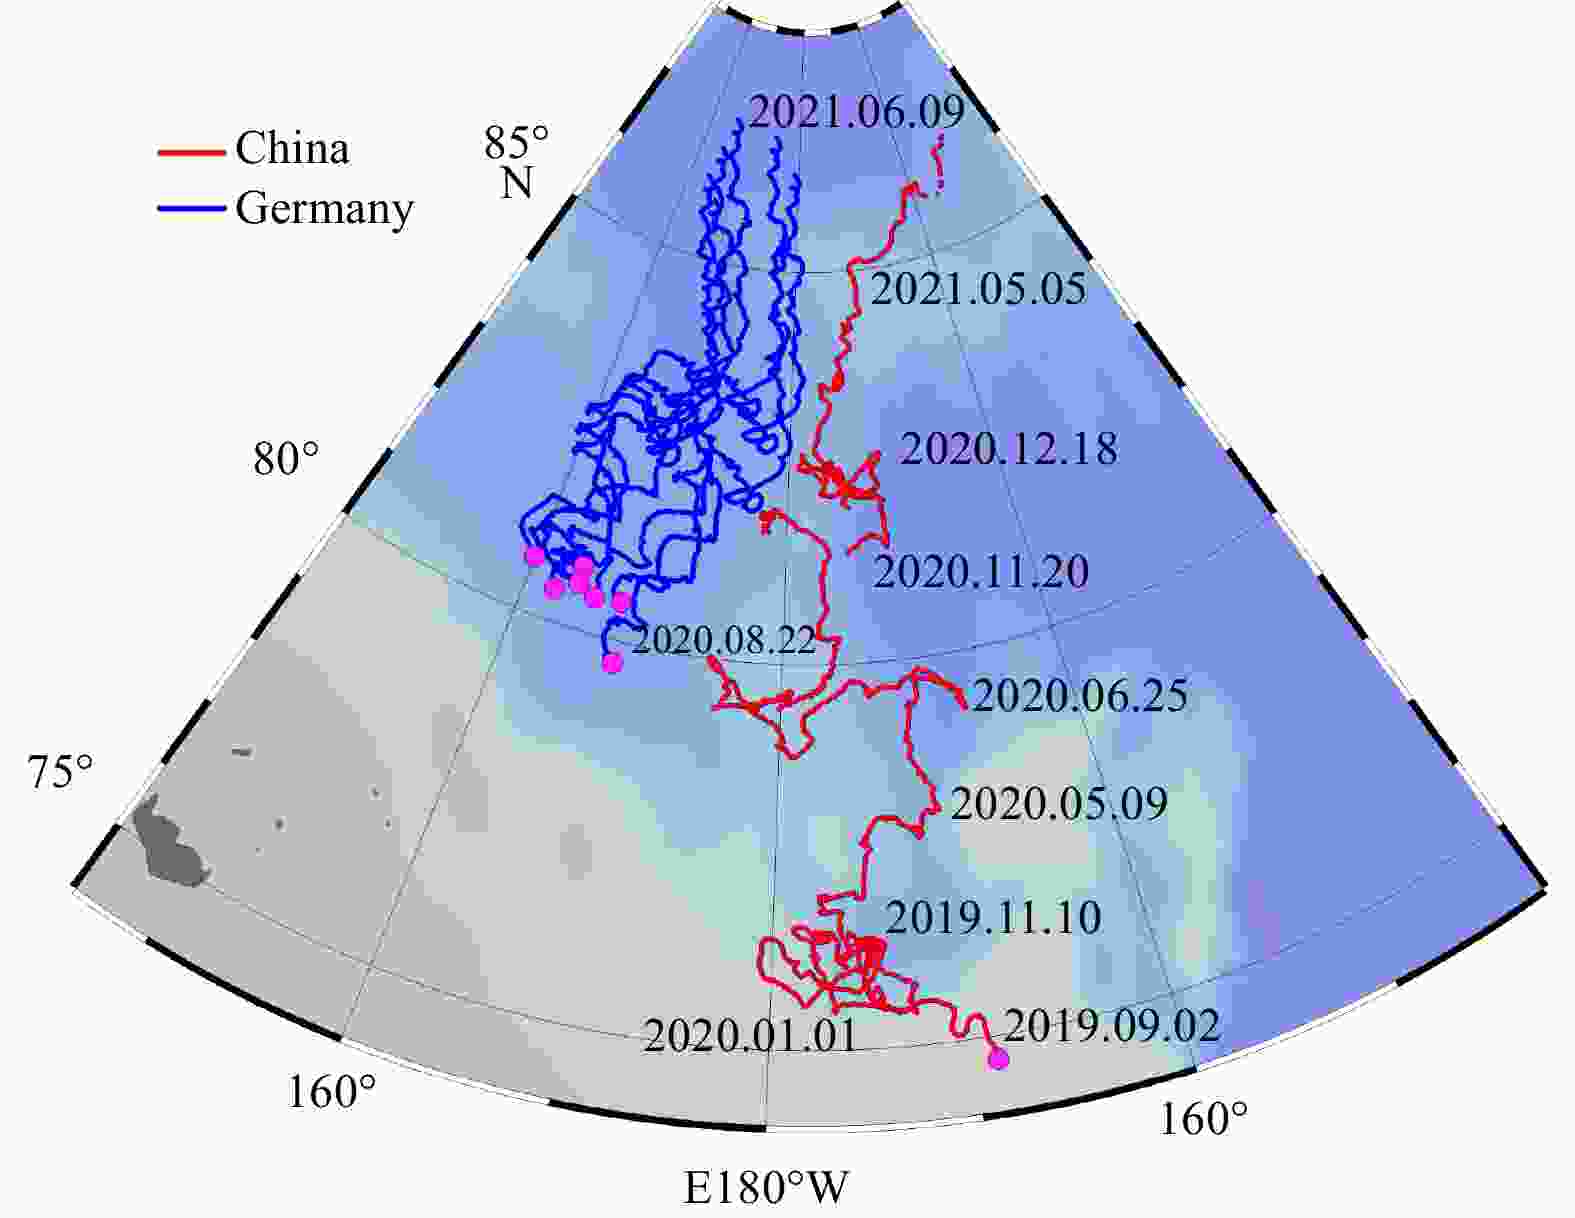
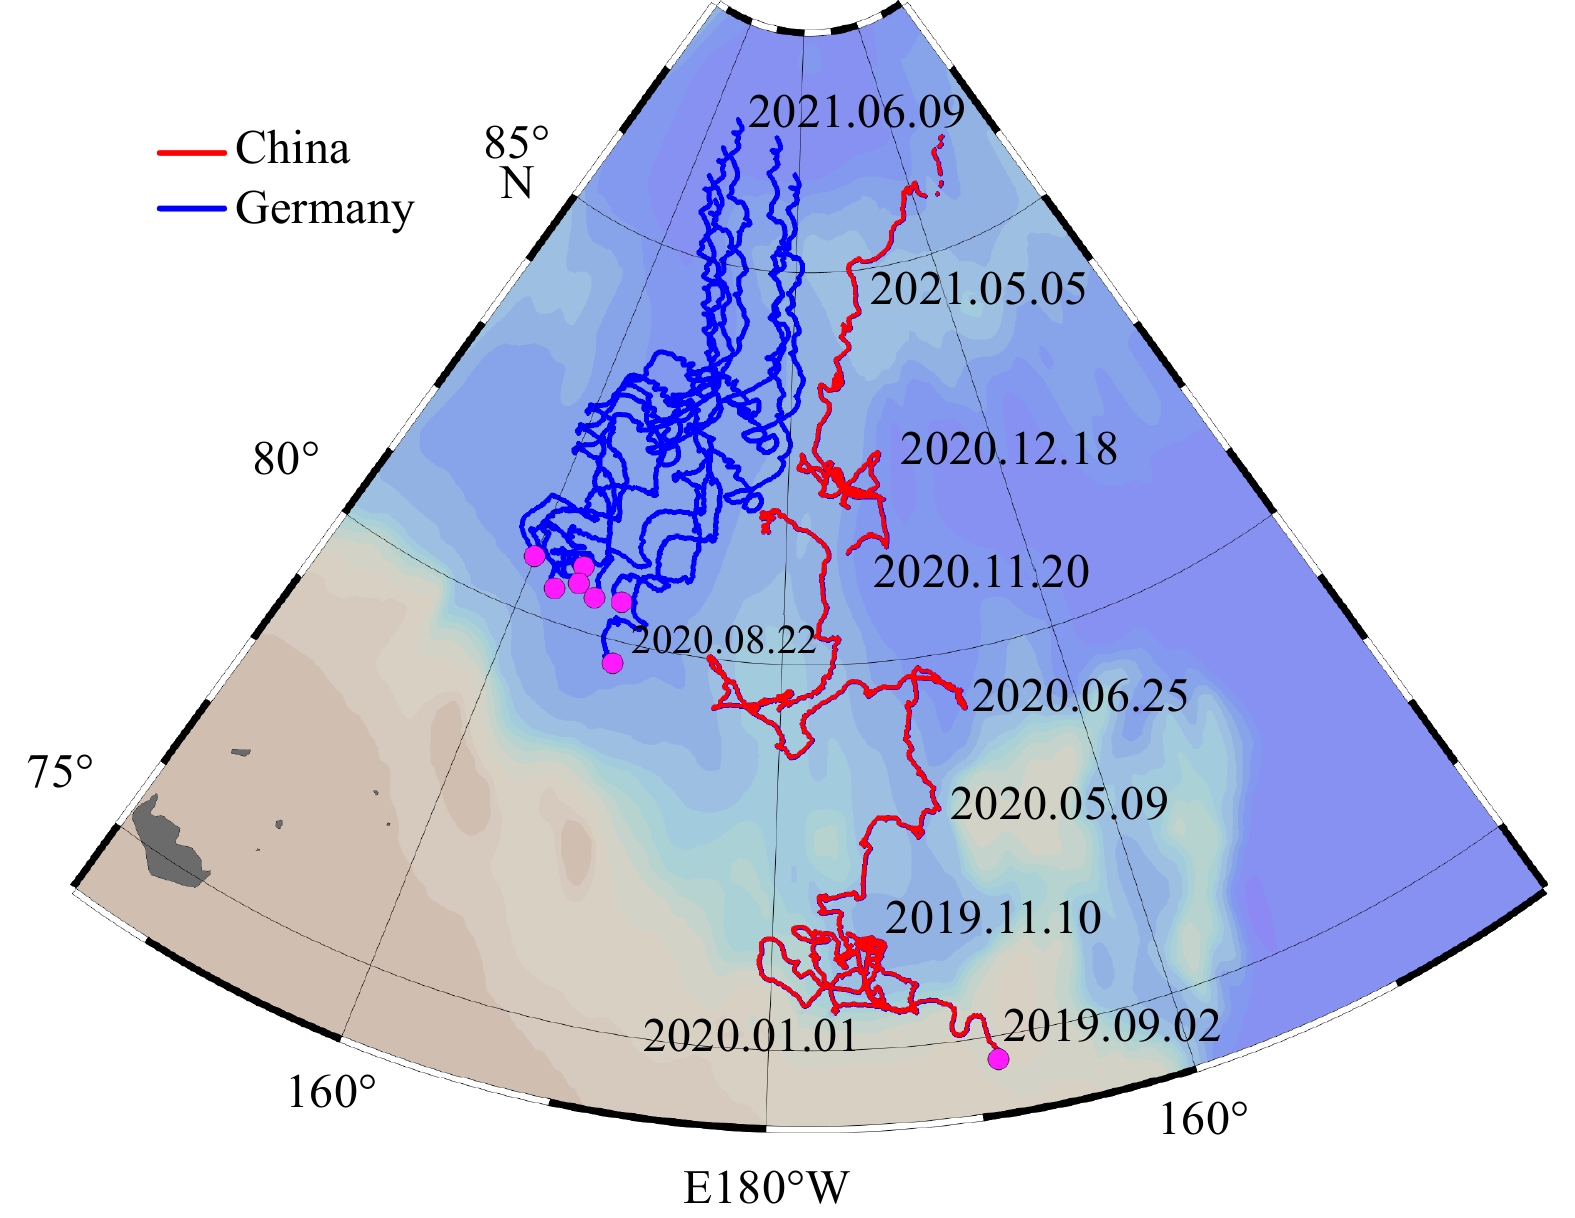
Figure 1. Drift trajectories of buoys. The red line is the trajectories of drifting buoys deployed by CHINARE, and the blue lines are the trajectories of 7 ice buoys deployed by the Alfred Wegener Institute, Germany. The rose dots represent the starting points of the buoys’ trajectories.
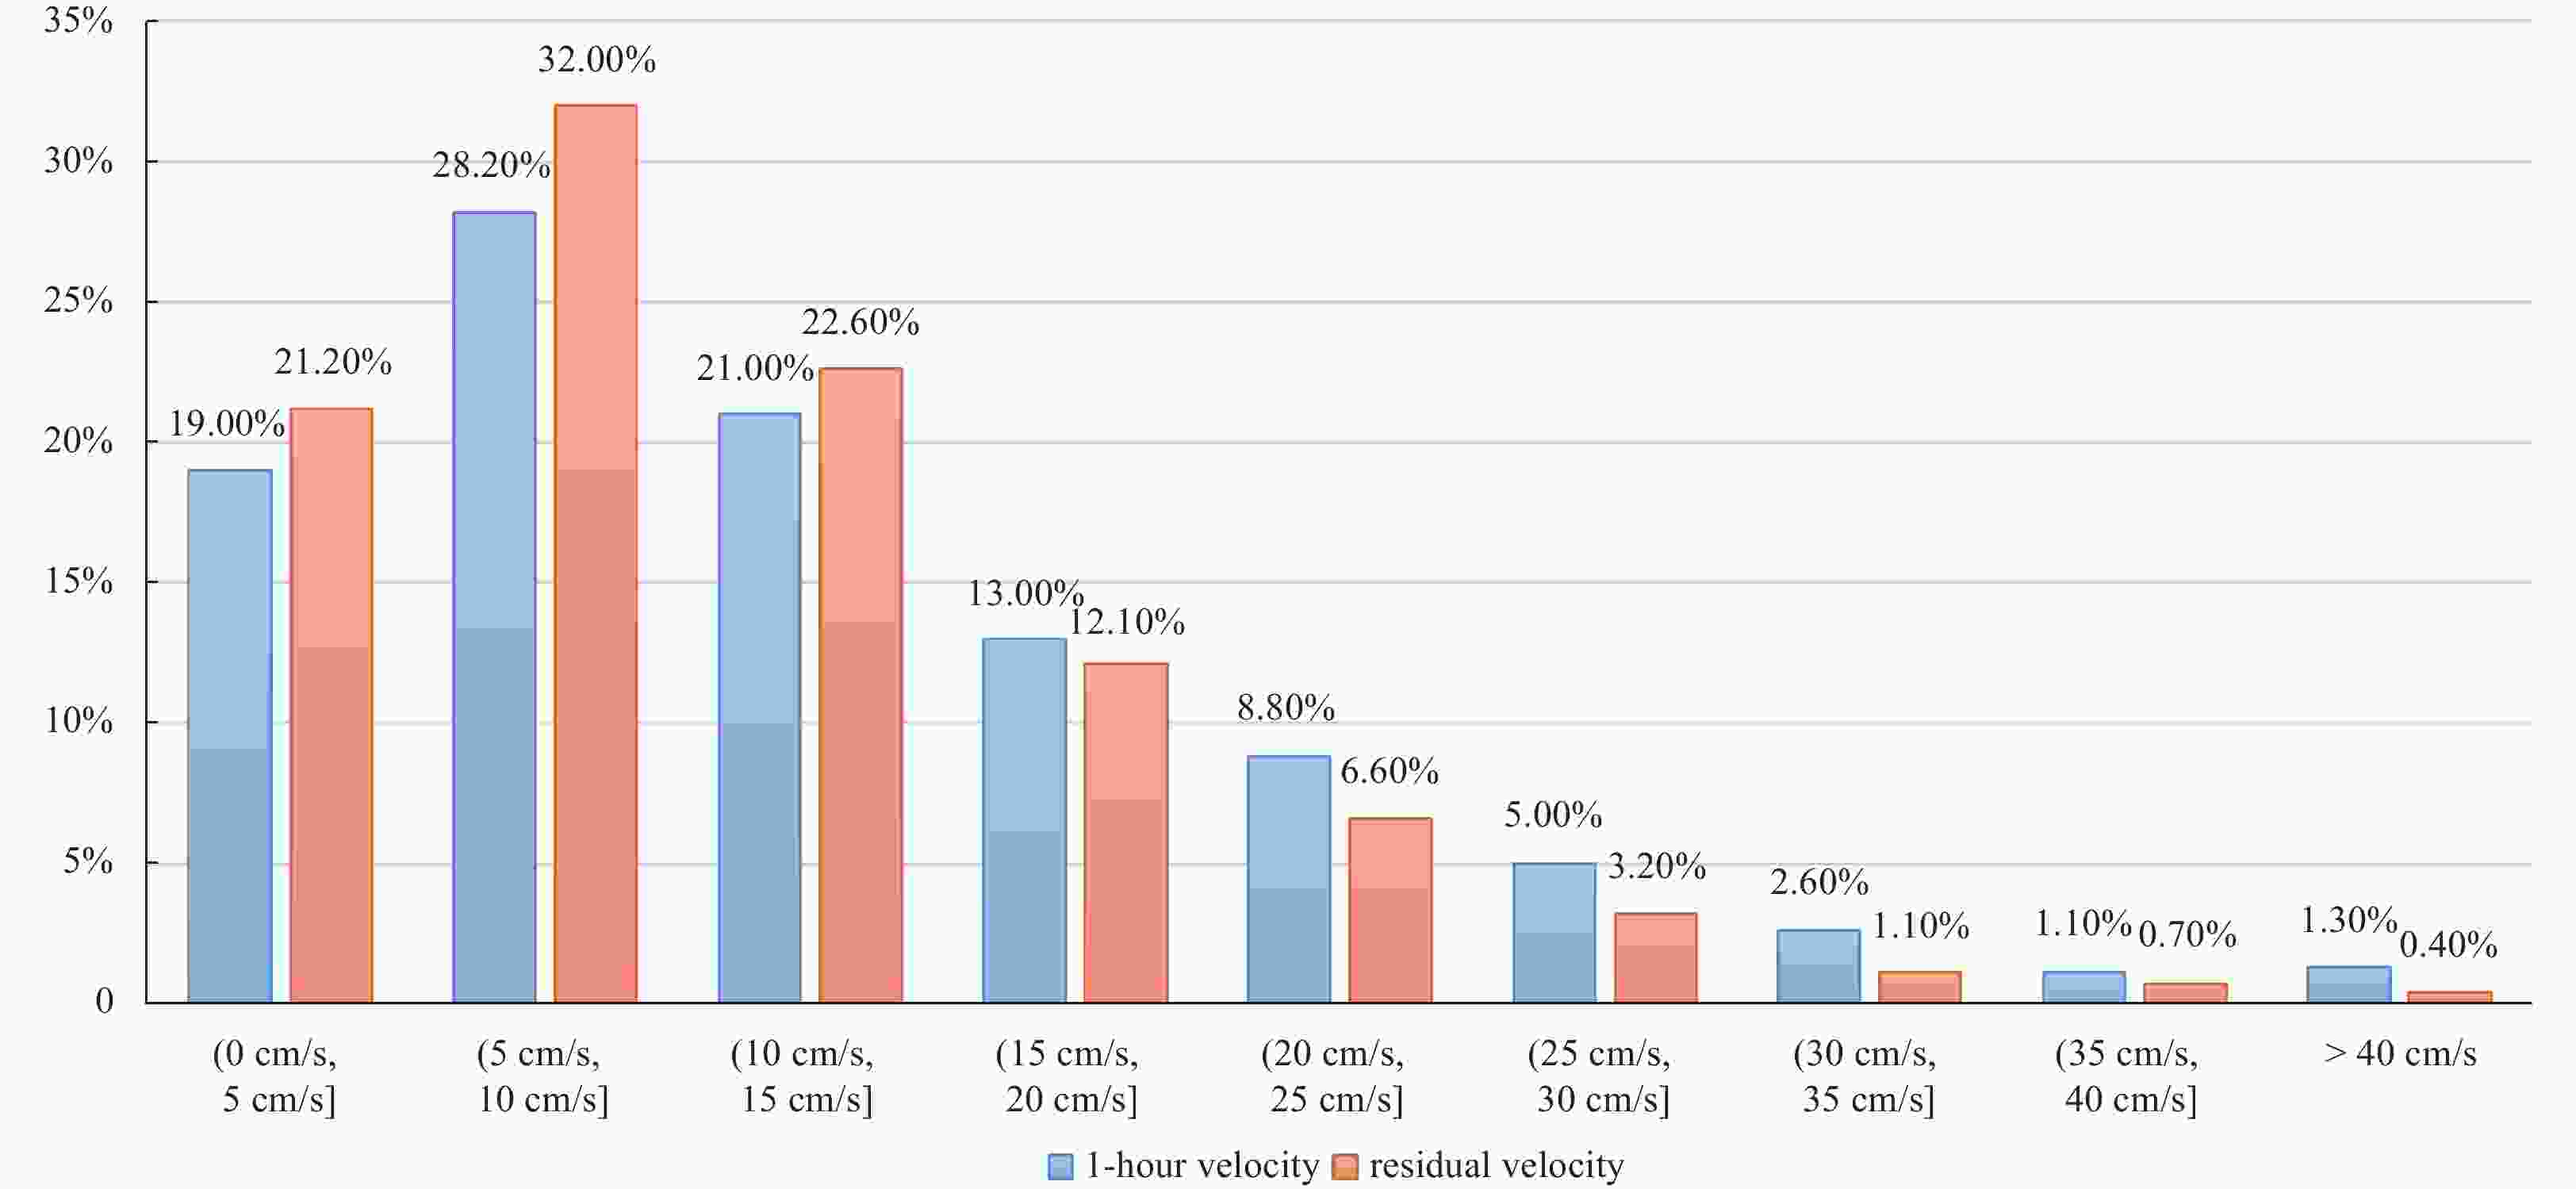
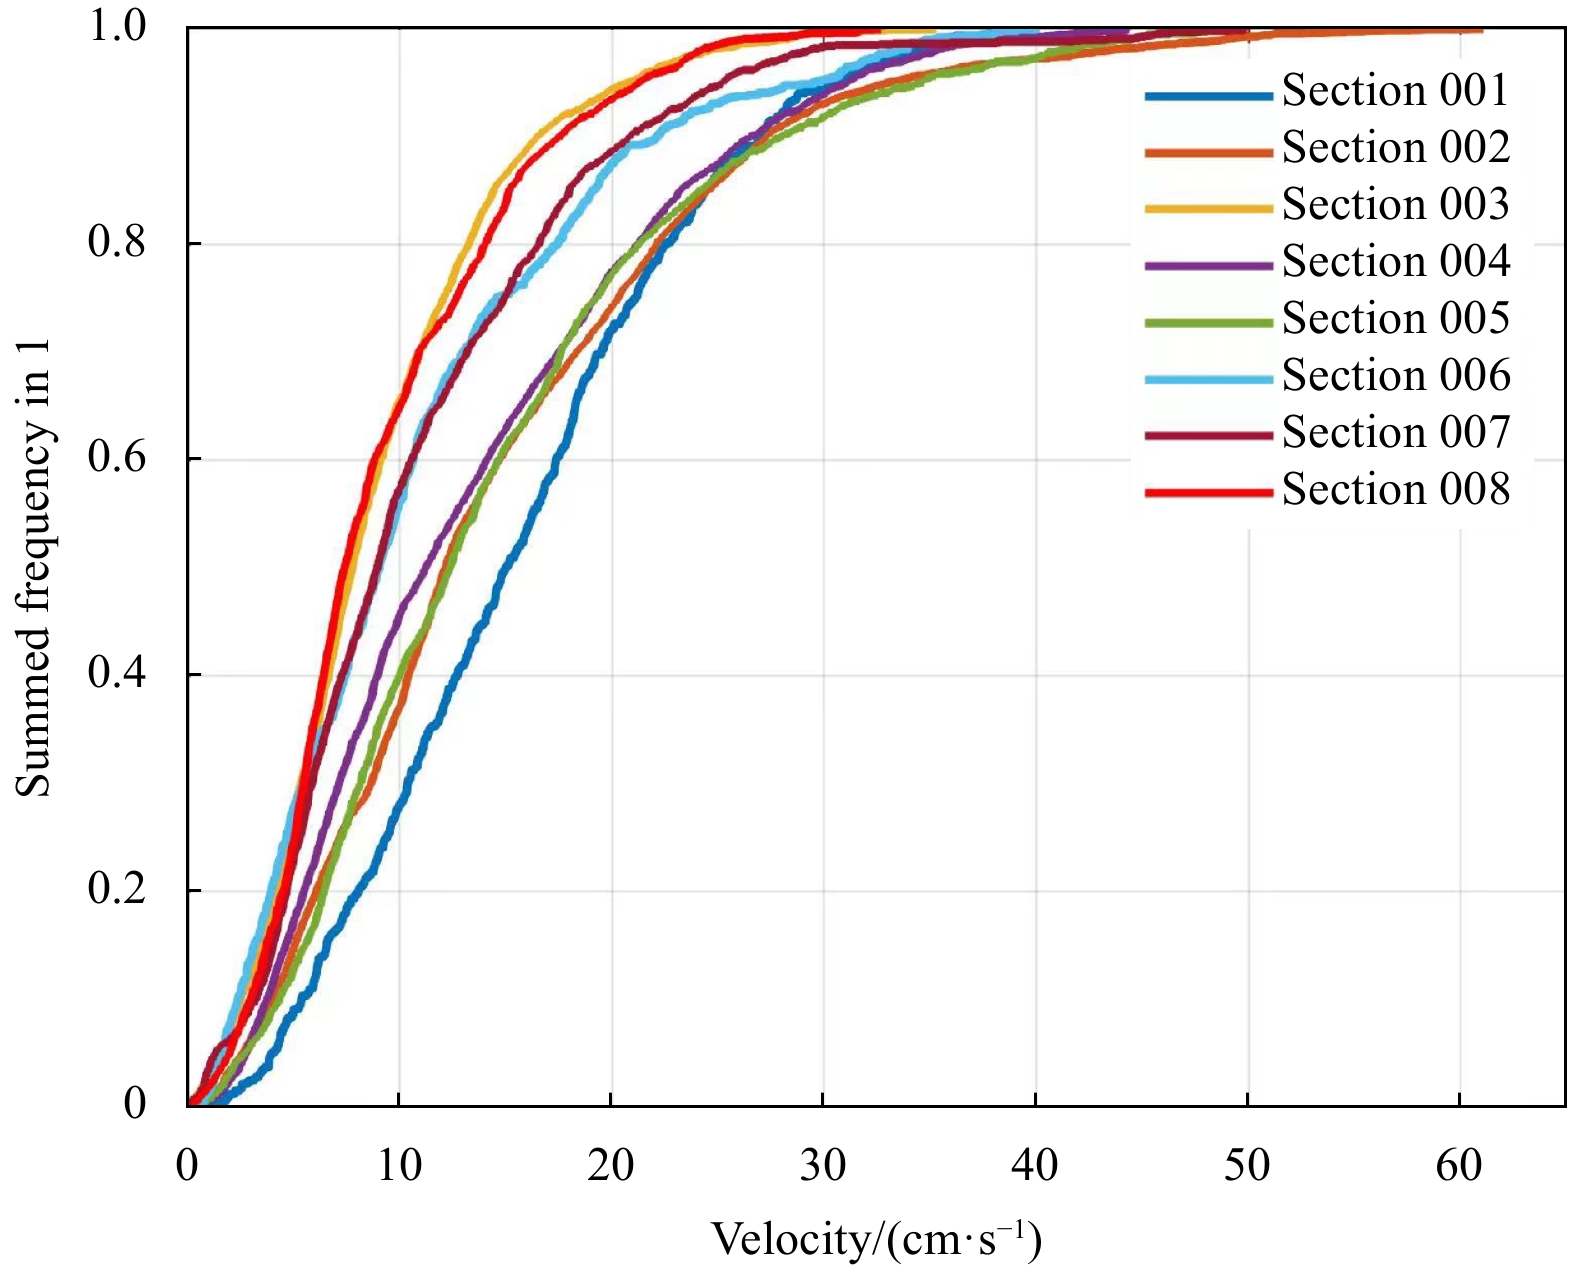
Figure 2. Percentage statistics of 1-hour velocity and residual velocity in cm/s with an interval of 5 cm/s.

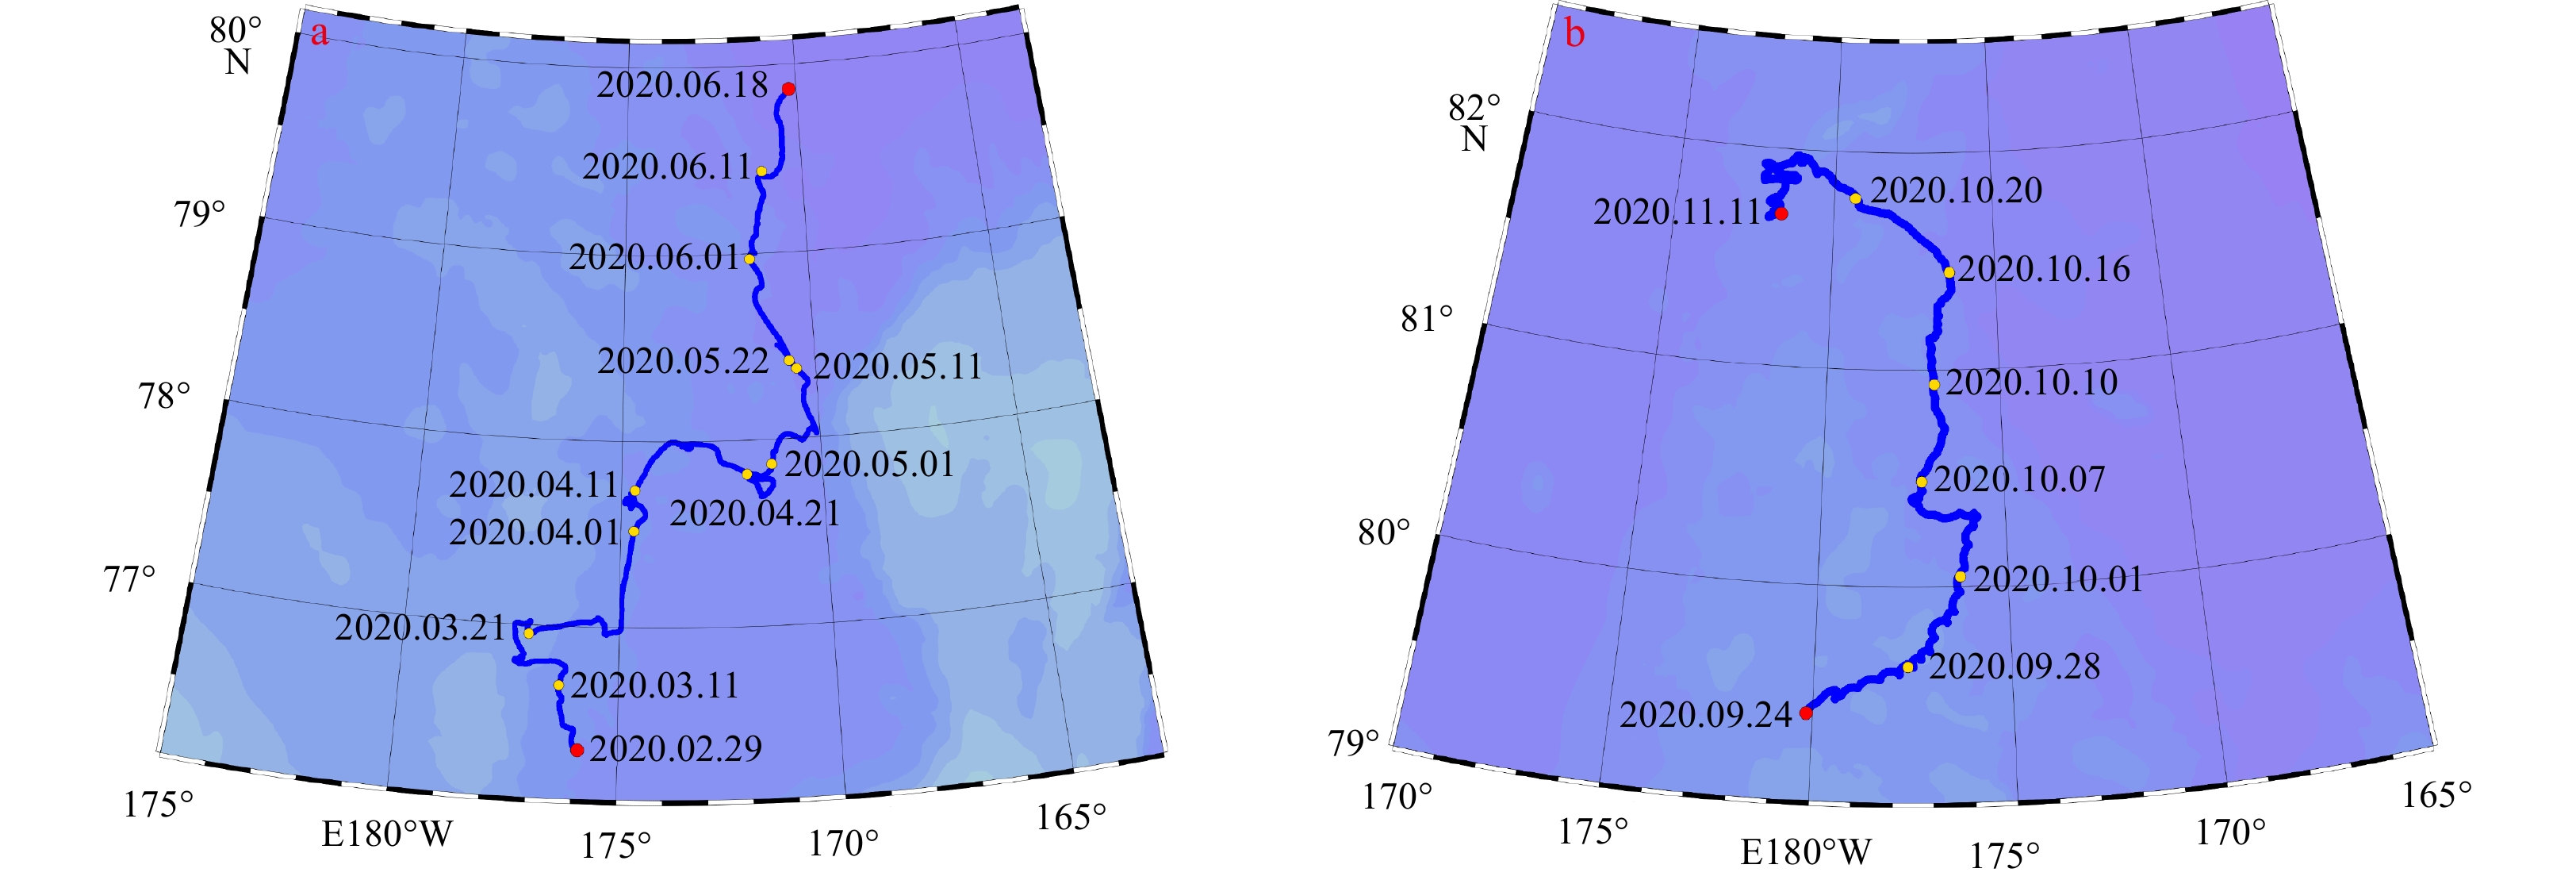
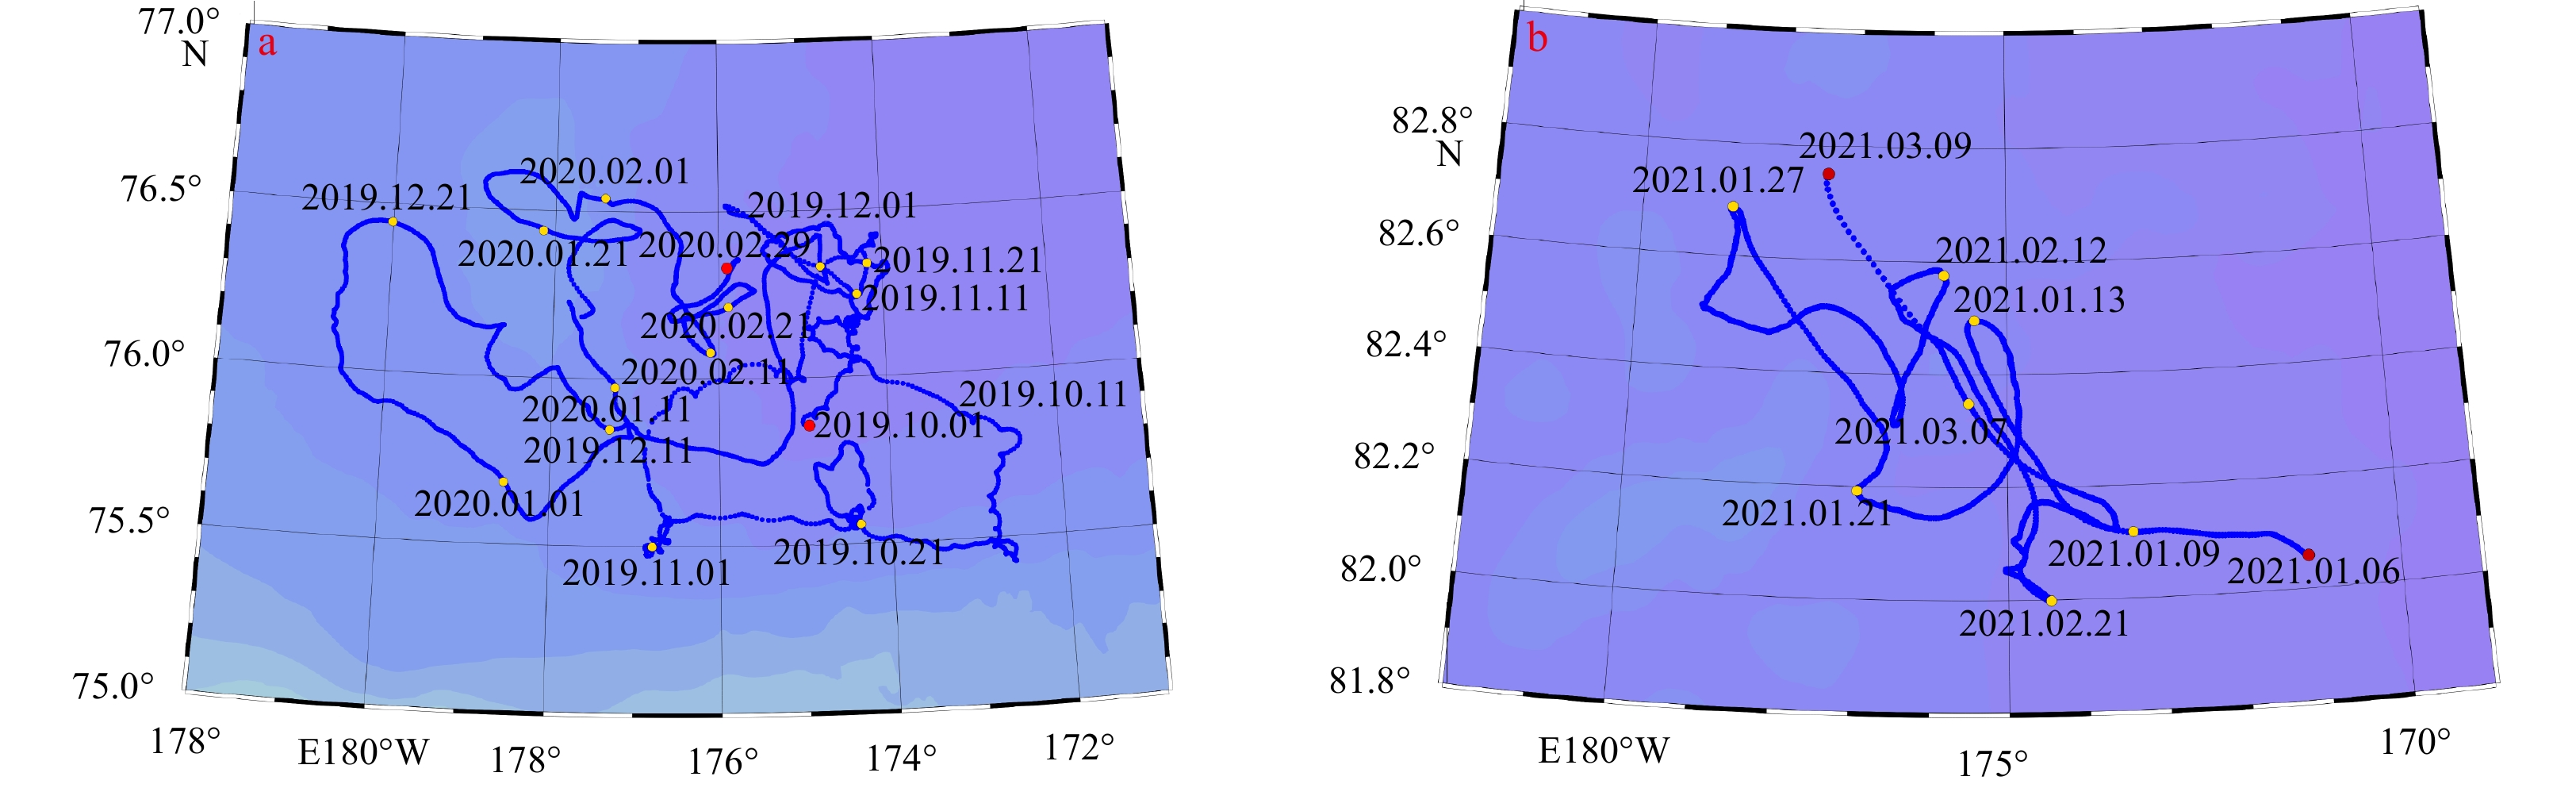
Figure 3. Drift buoy trajectory in the third section (a) and the fifth section (b). The red dots represent the starting and ending points of the buoys’ trajectories, respectively.
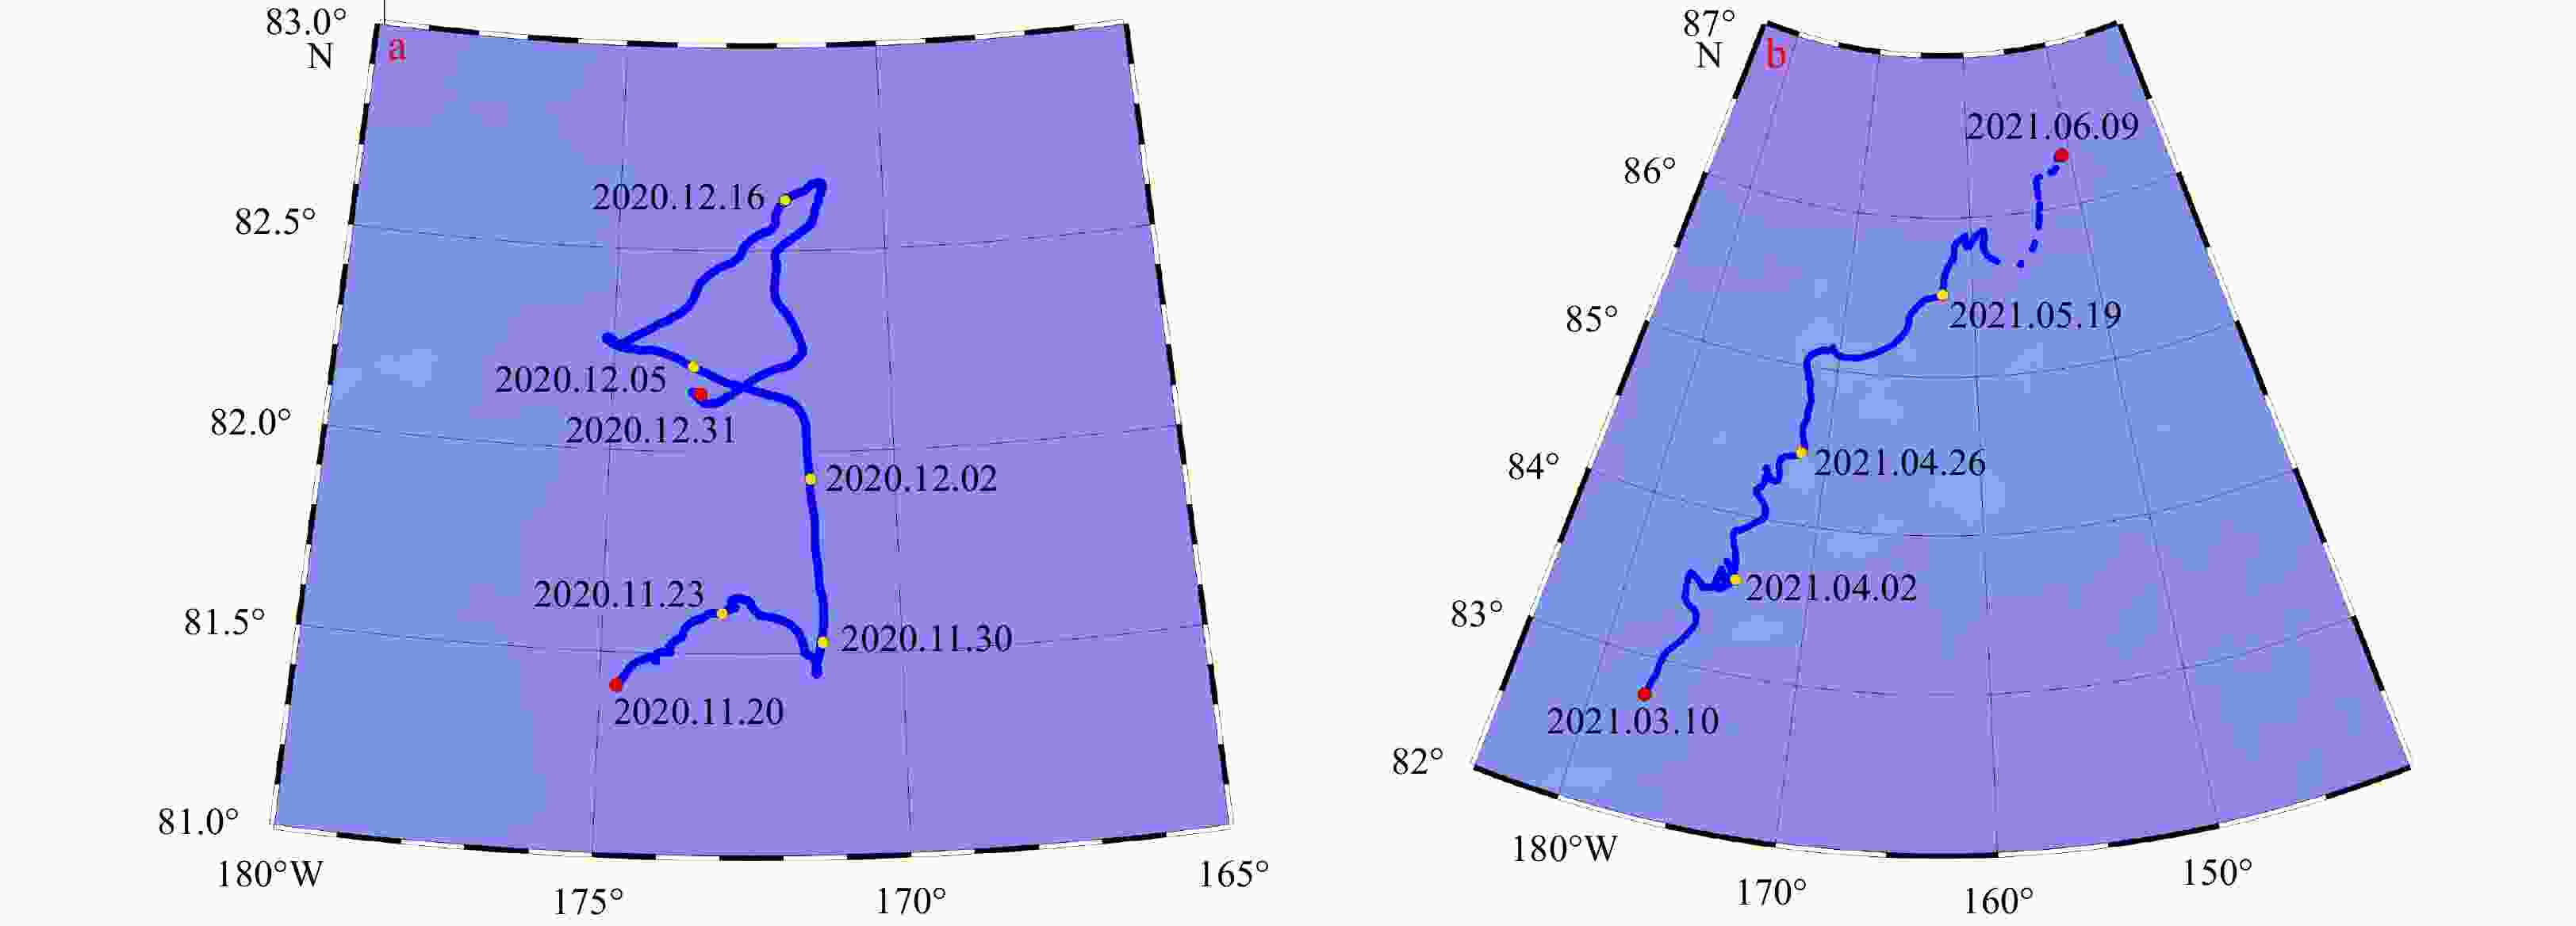
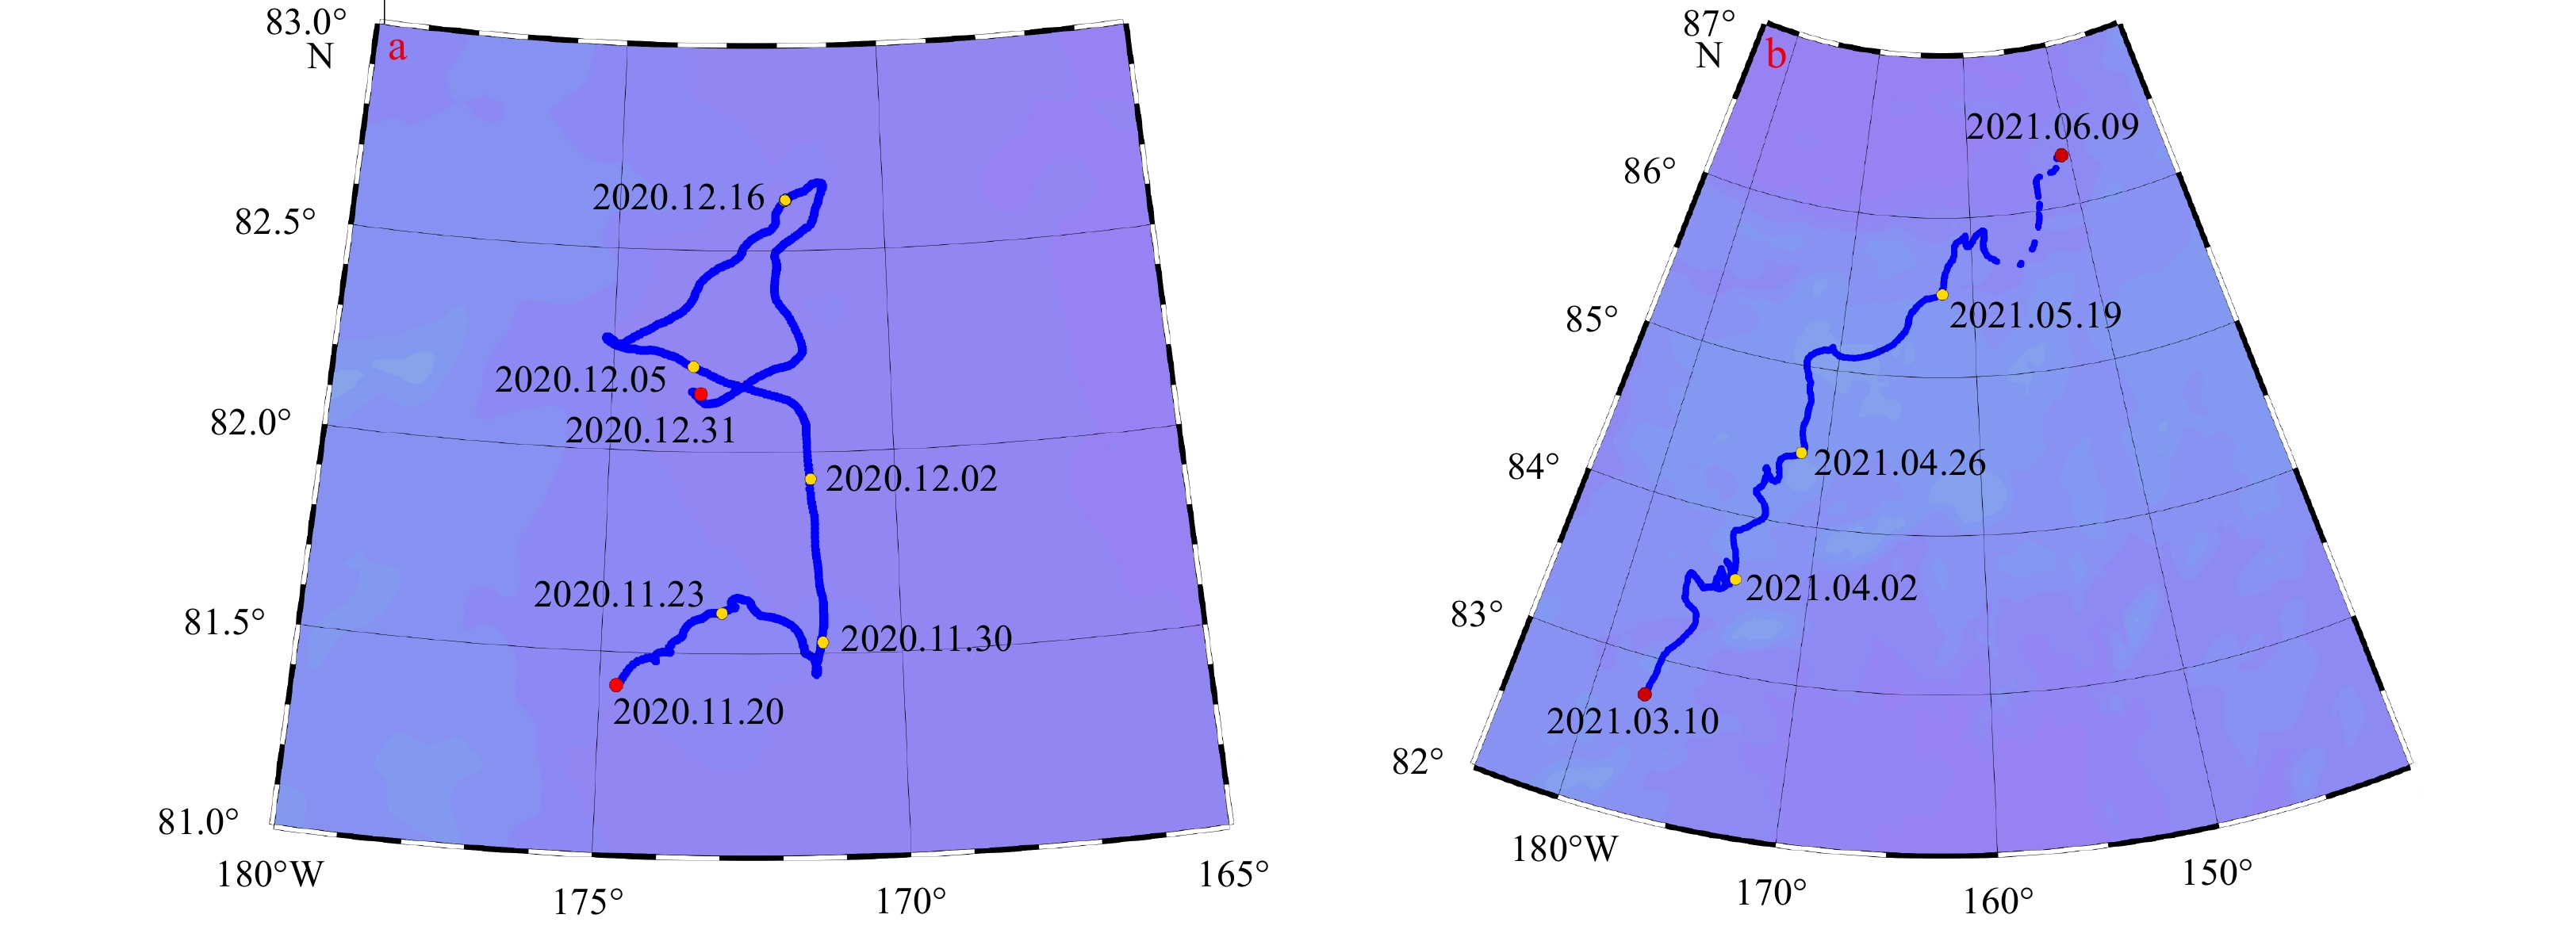
Figure 4. Drift buoy trajectory in the sixth section (a) and the eighth section (b). The red dots represent the starting and ending points of the buoys’ trajectories, respectively.
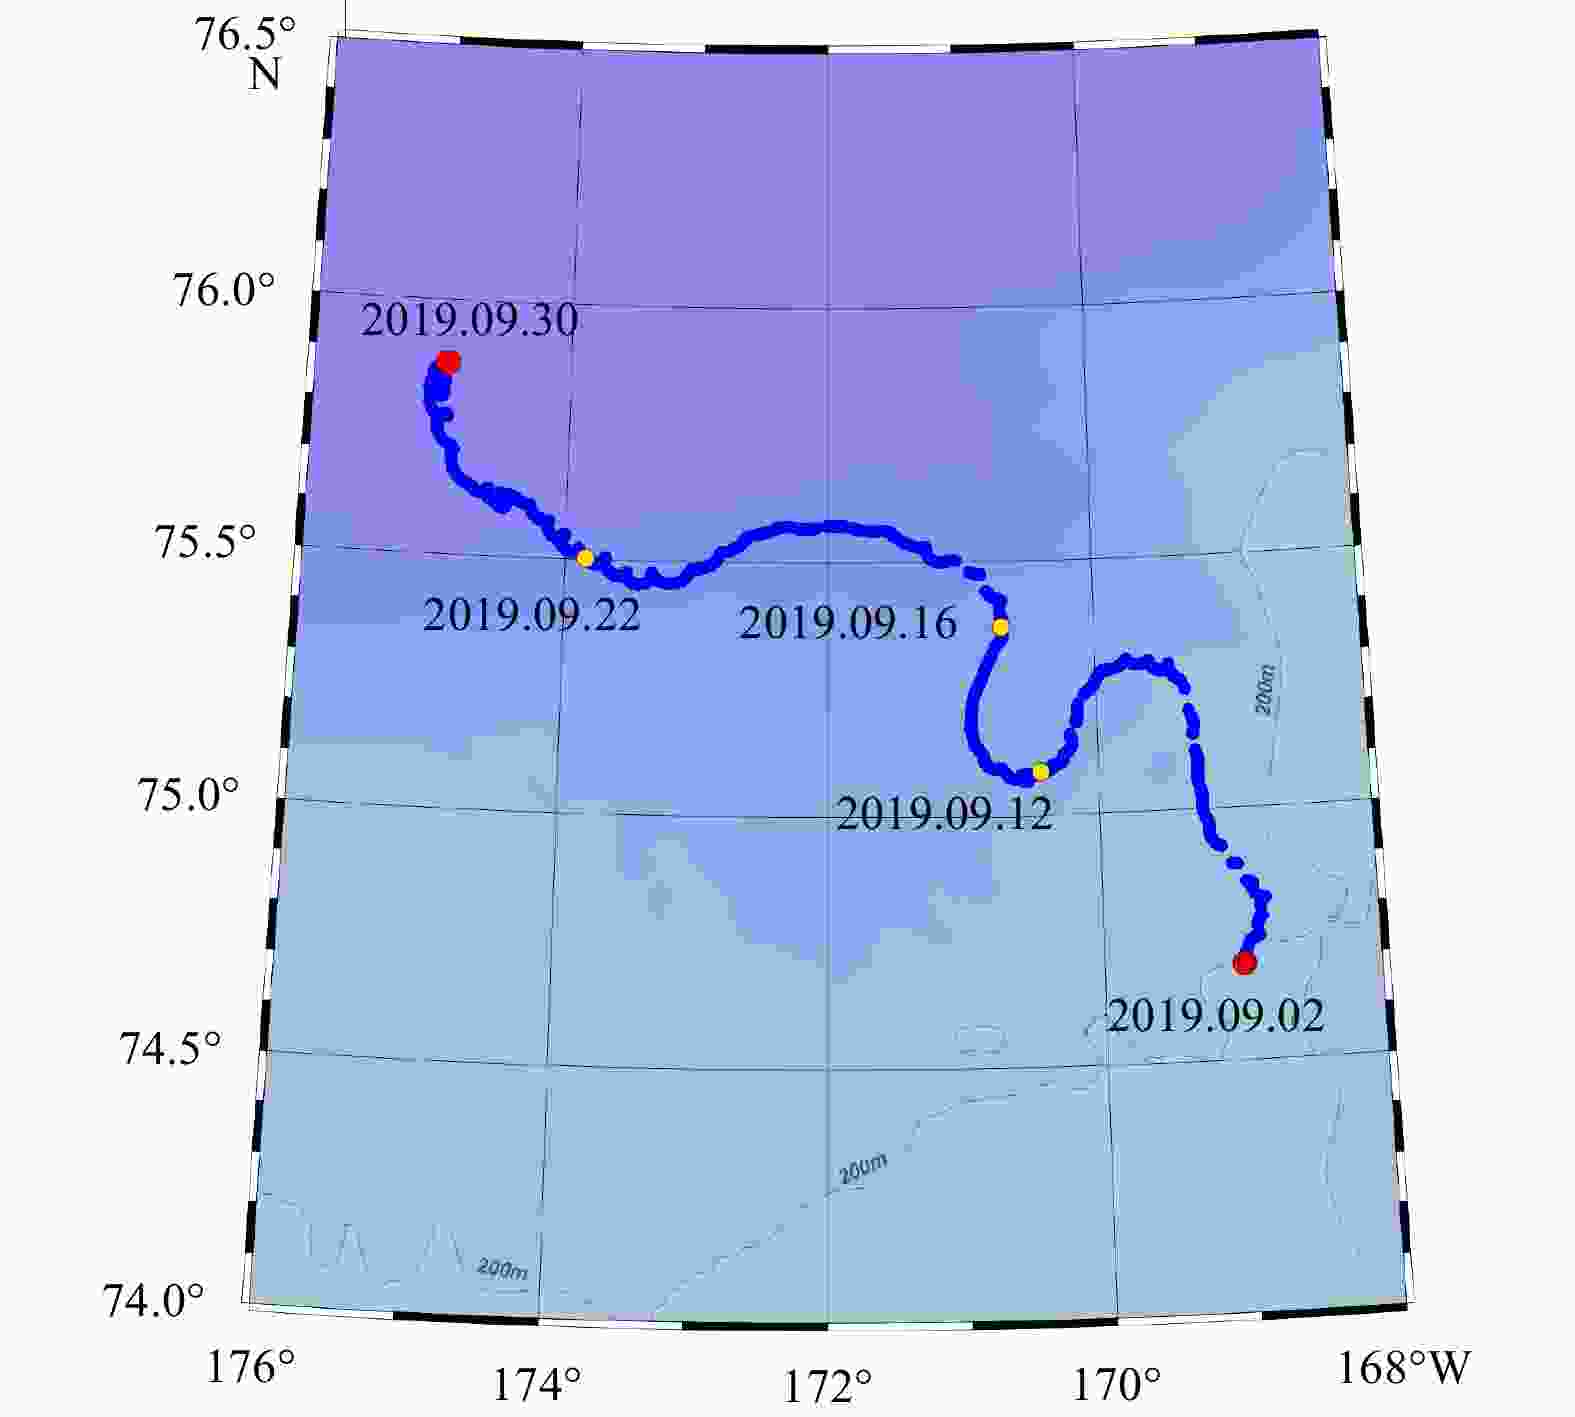
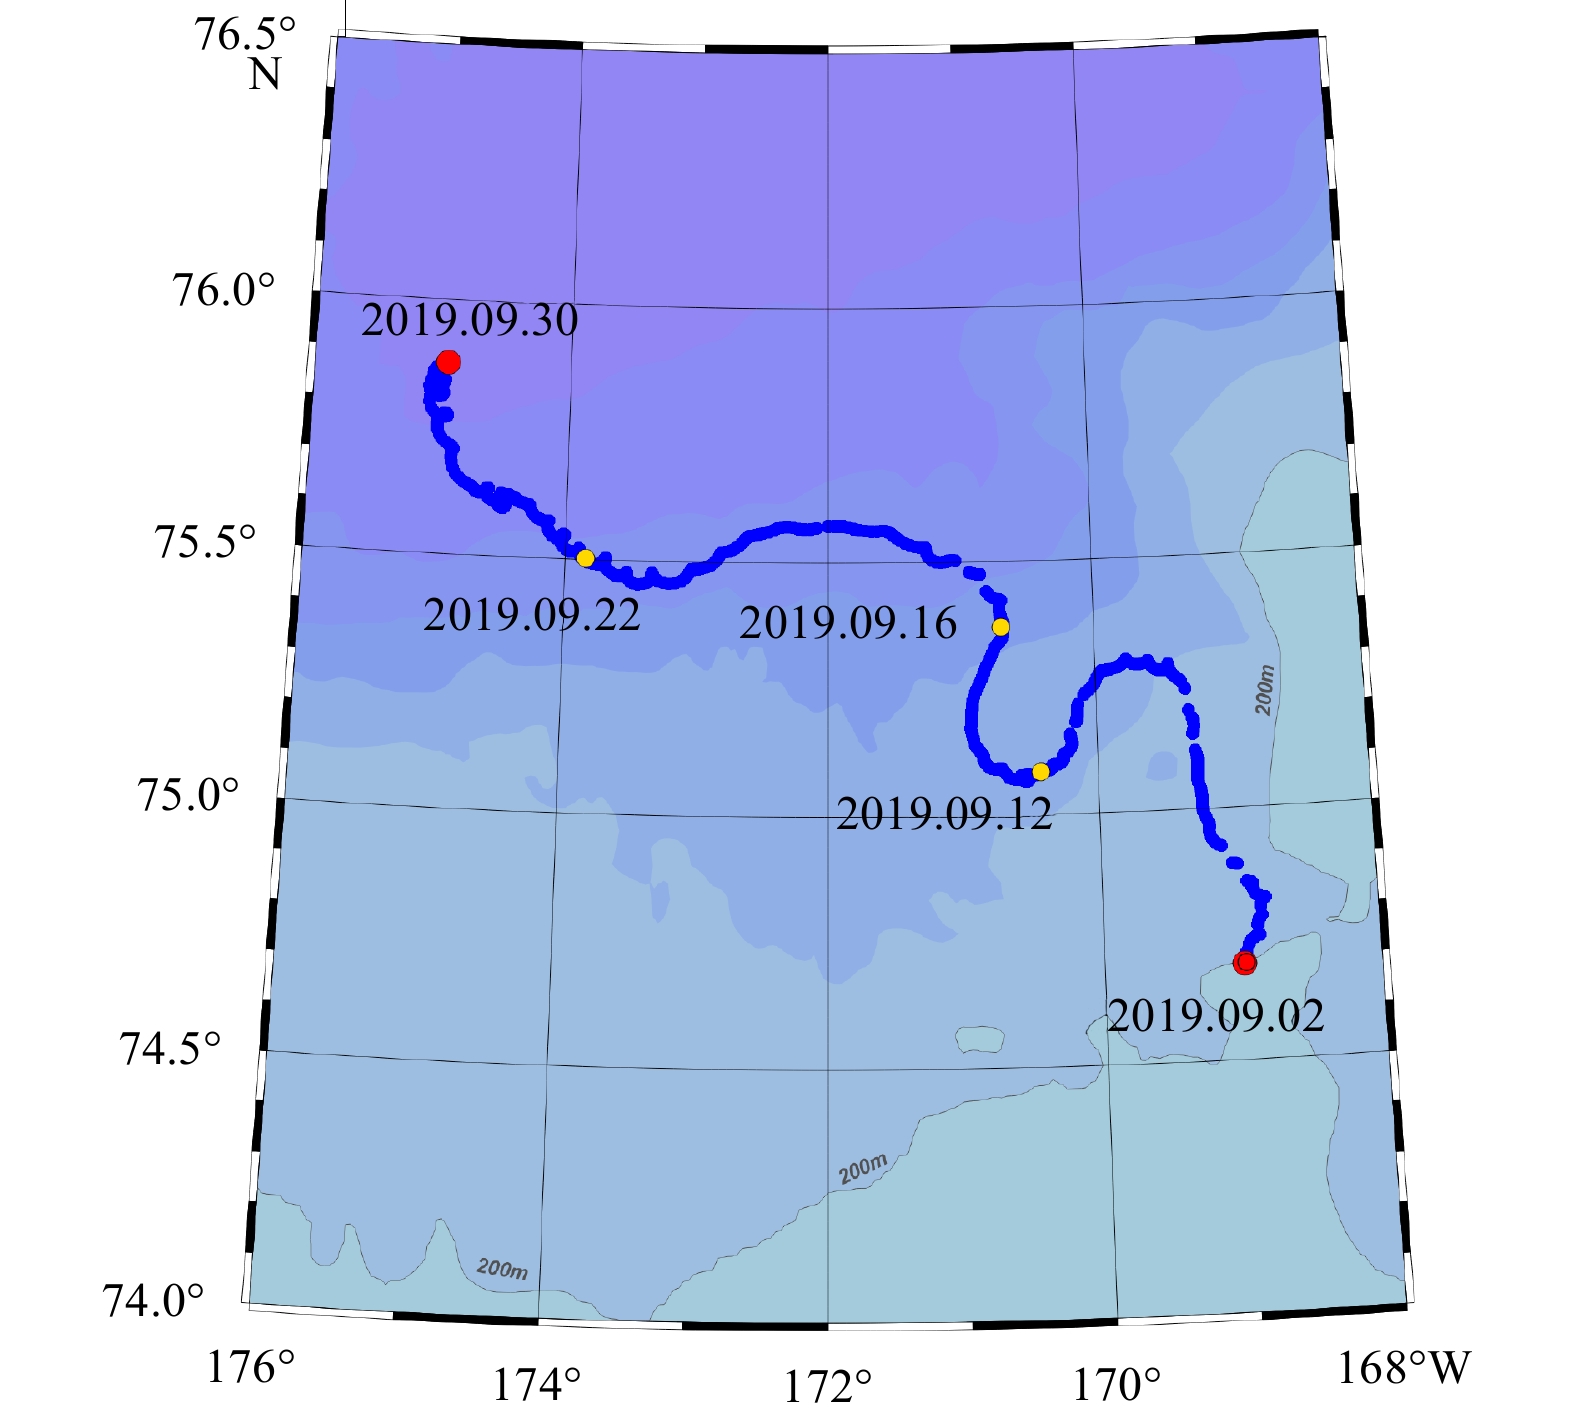
Figure 5. Drift buoy trajectory in the first section. The red dots represent the starting and ending points of the buoy’s trajectory, respectively.
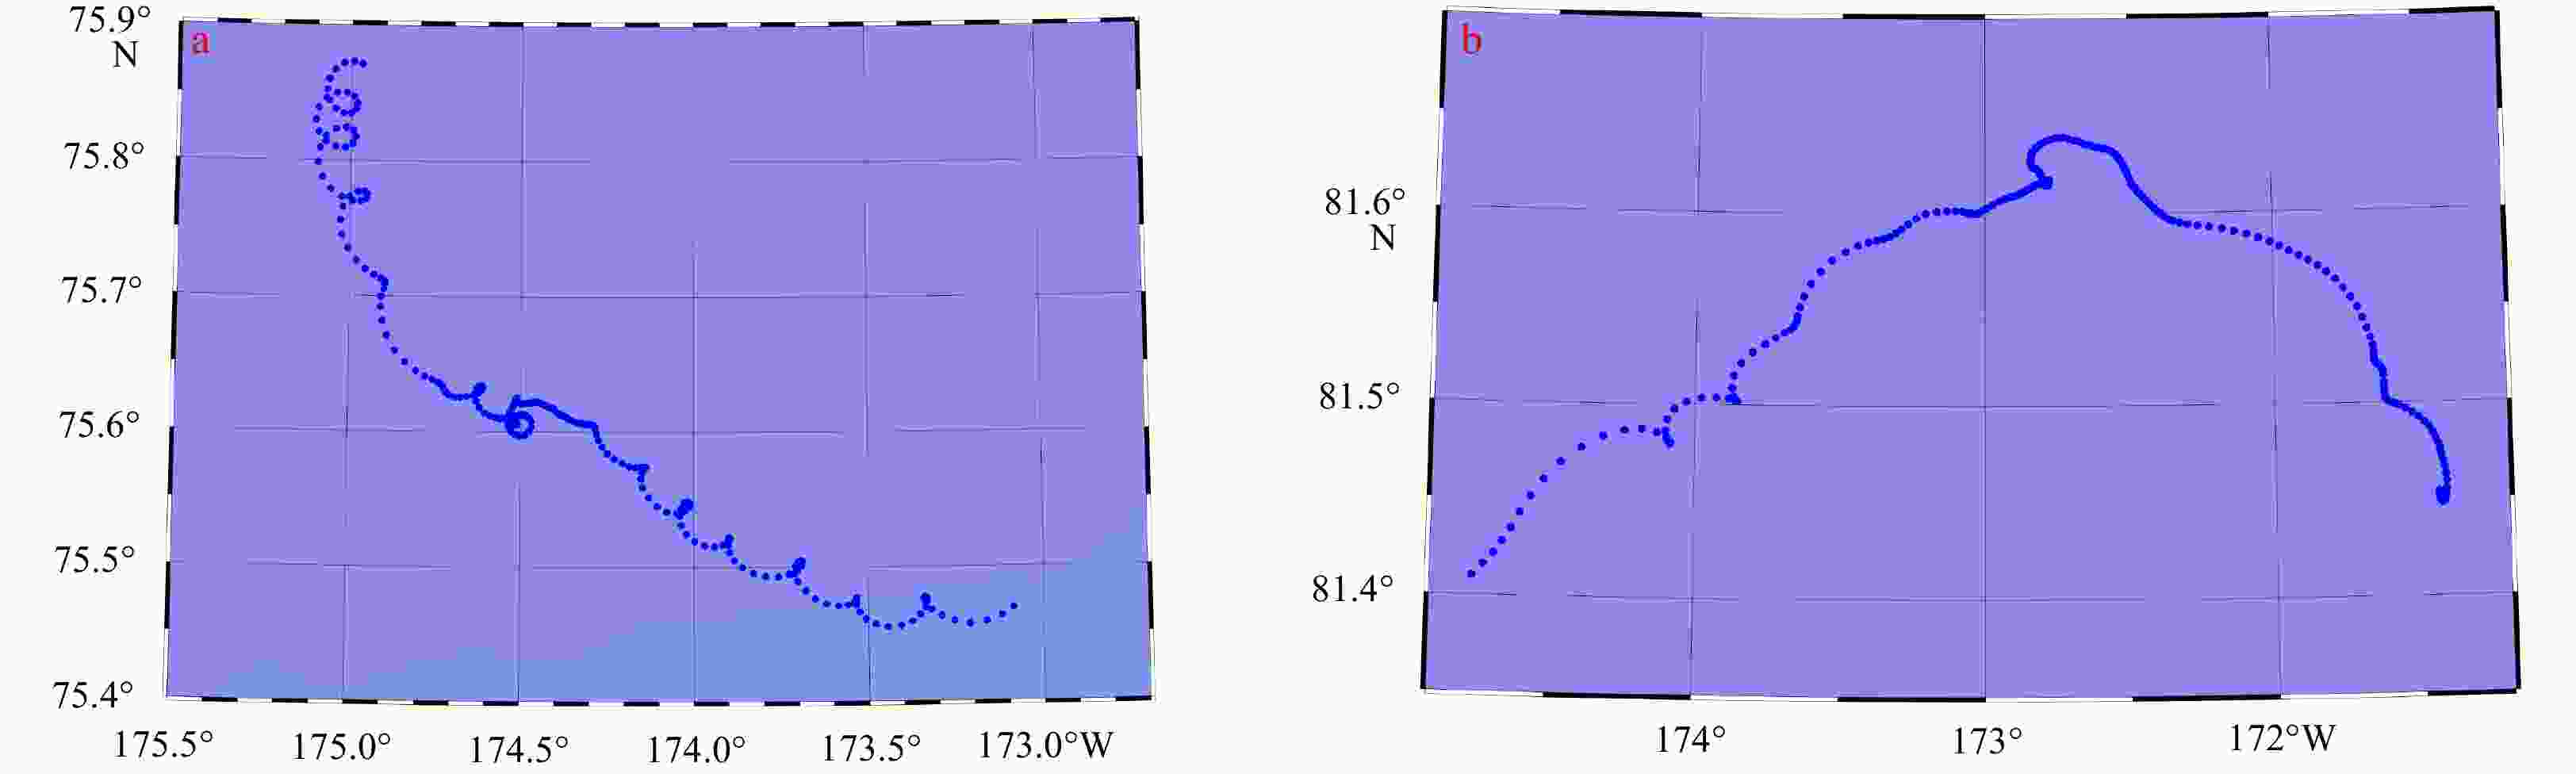
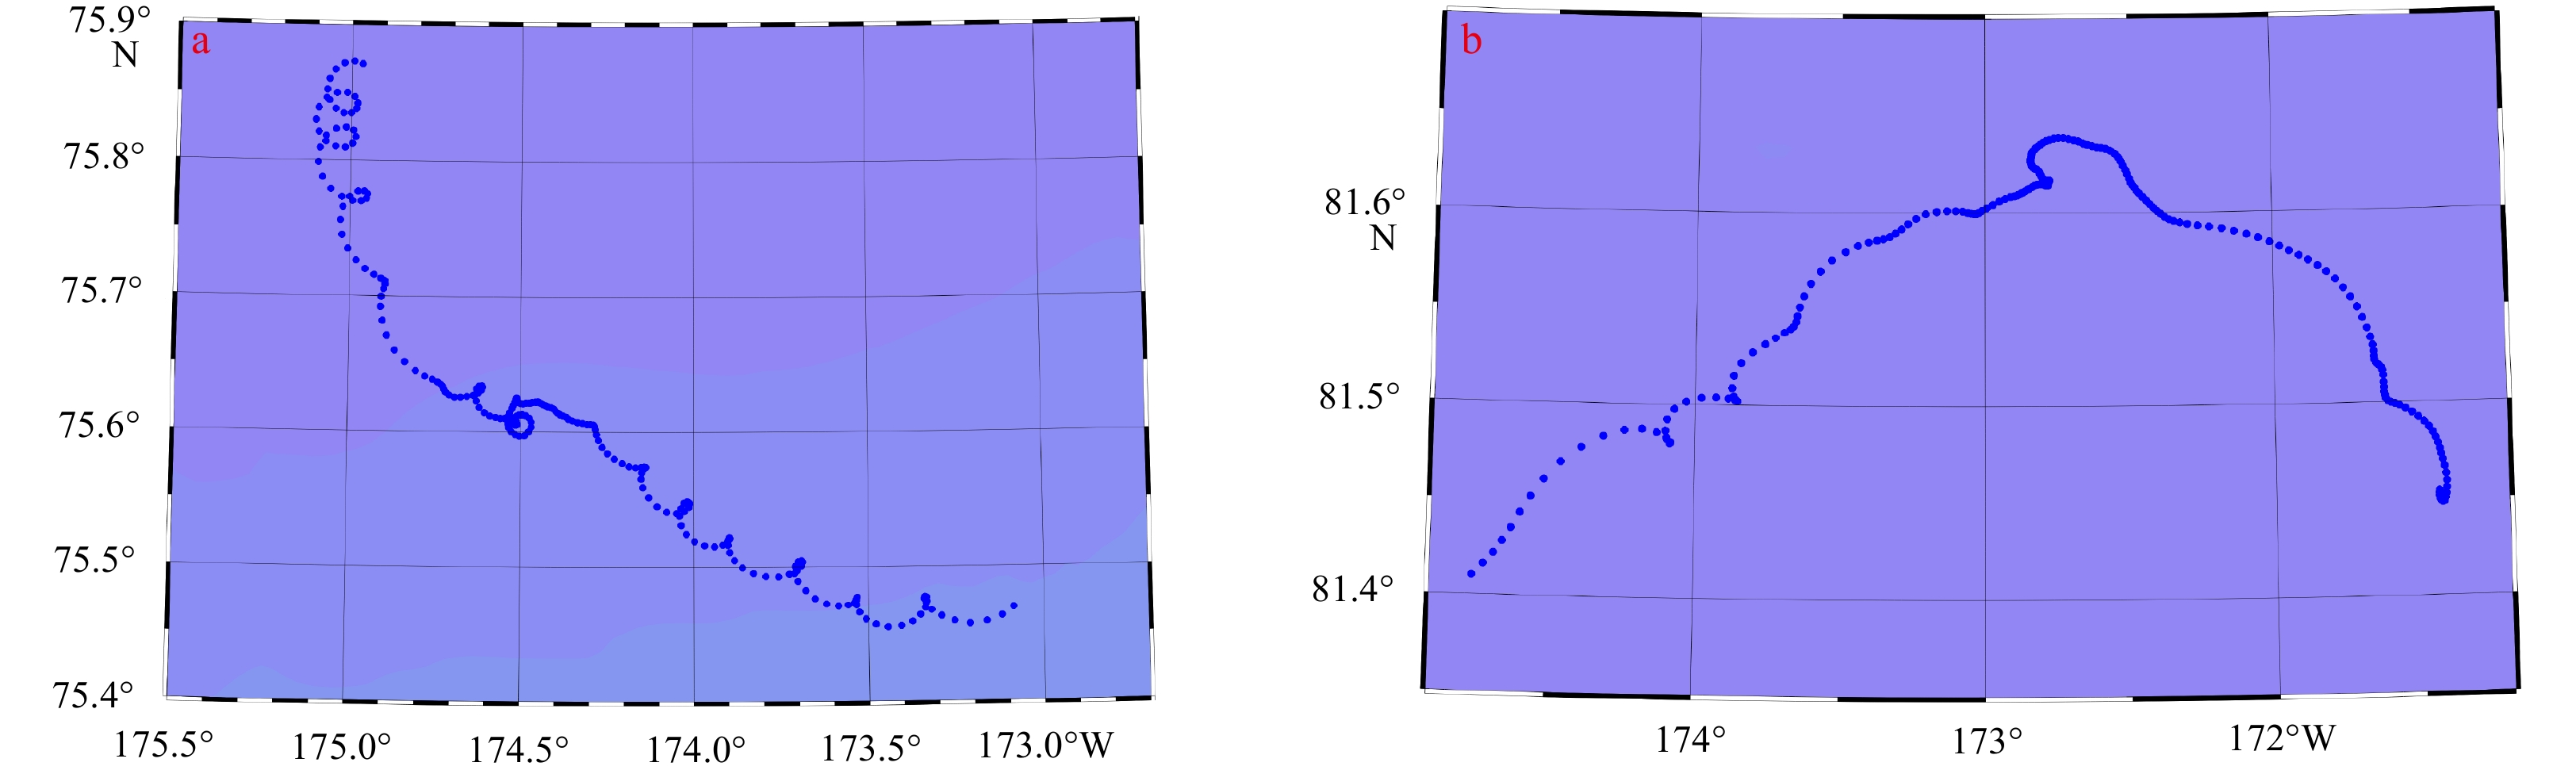
Figure 6. Drift buoy trajectory in two ten-day periods: 2019.09.21–2019.09.30 (a) and 2020.11.20–2020.11.29 (b).
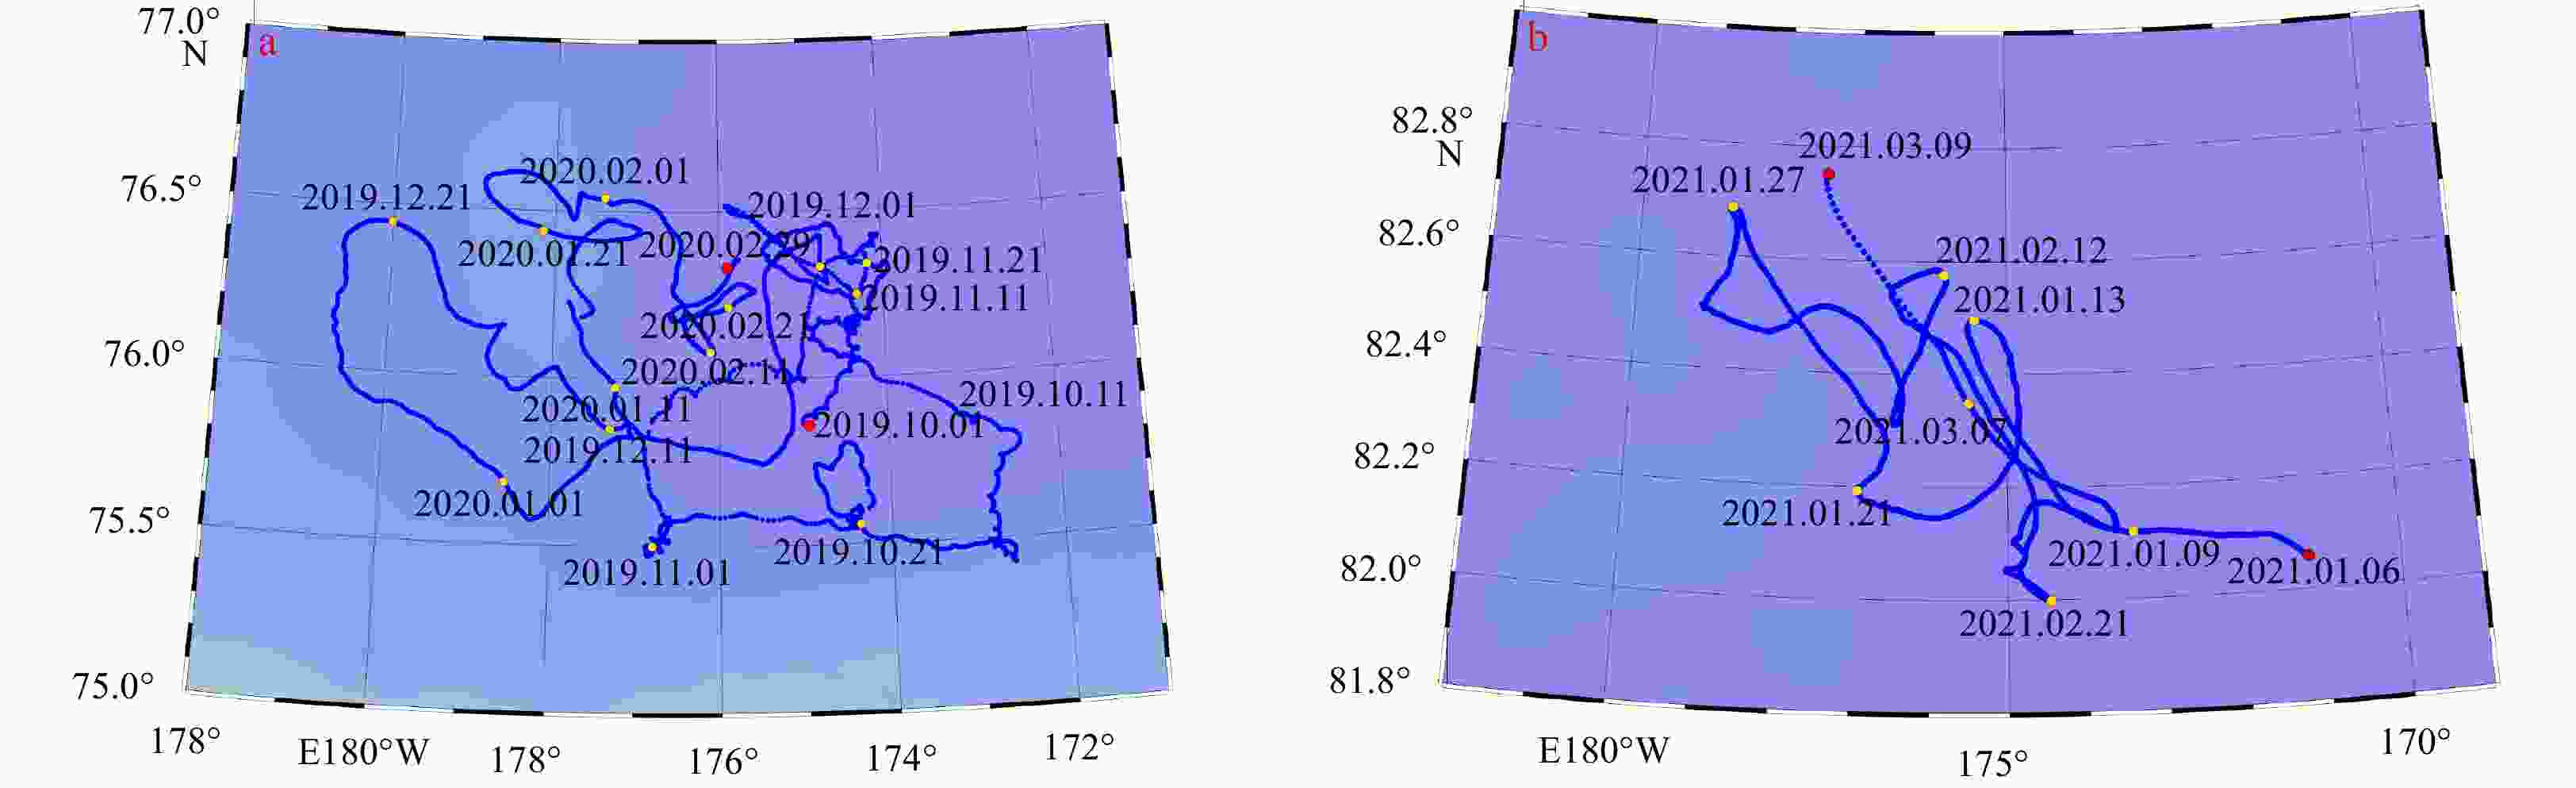
Figure 7. Drift buoy trajectory in the second section (a) and the seventh section (b). The red dots represent the starting and ending points of the buoys’ trajectories, respectively.

Figure 9. Diagram of ER5 wind speed and direction at point (75.50°N, 174.74°W) (up), velocity and flow direction in the second period (down).
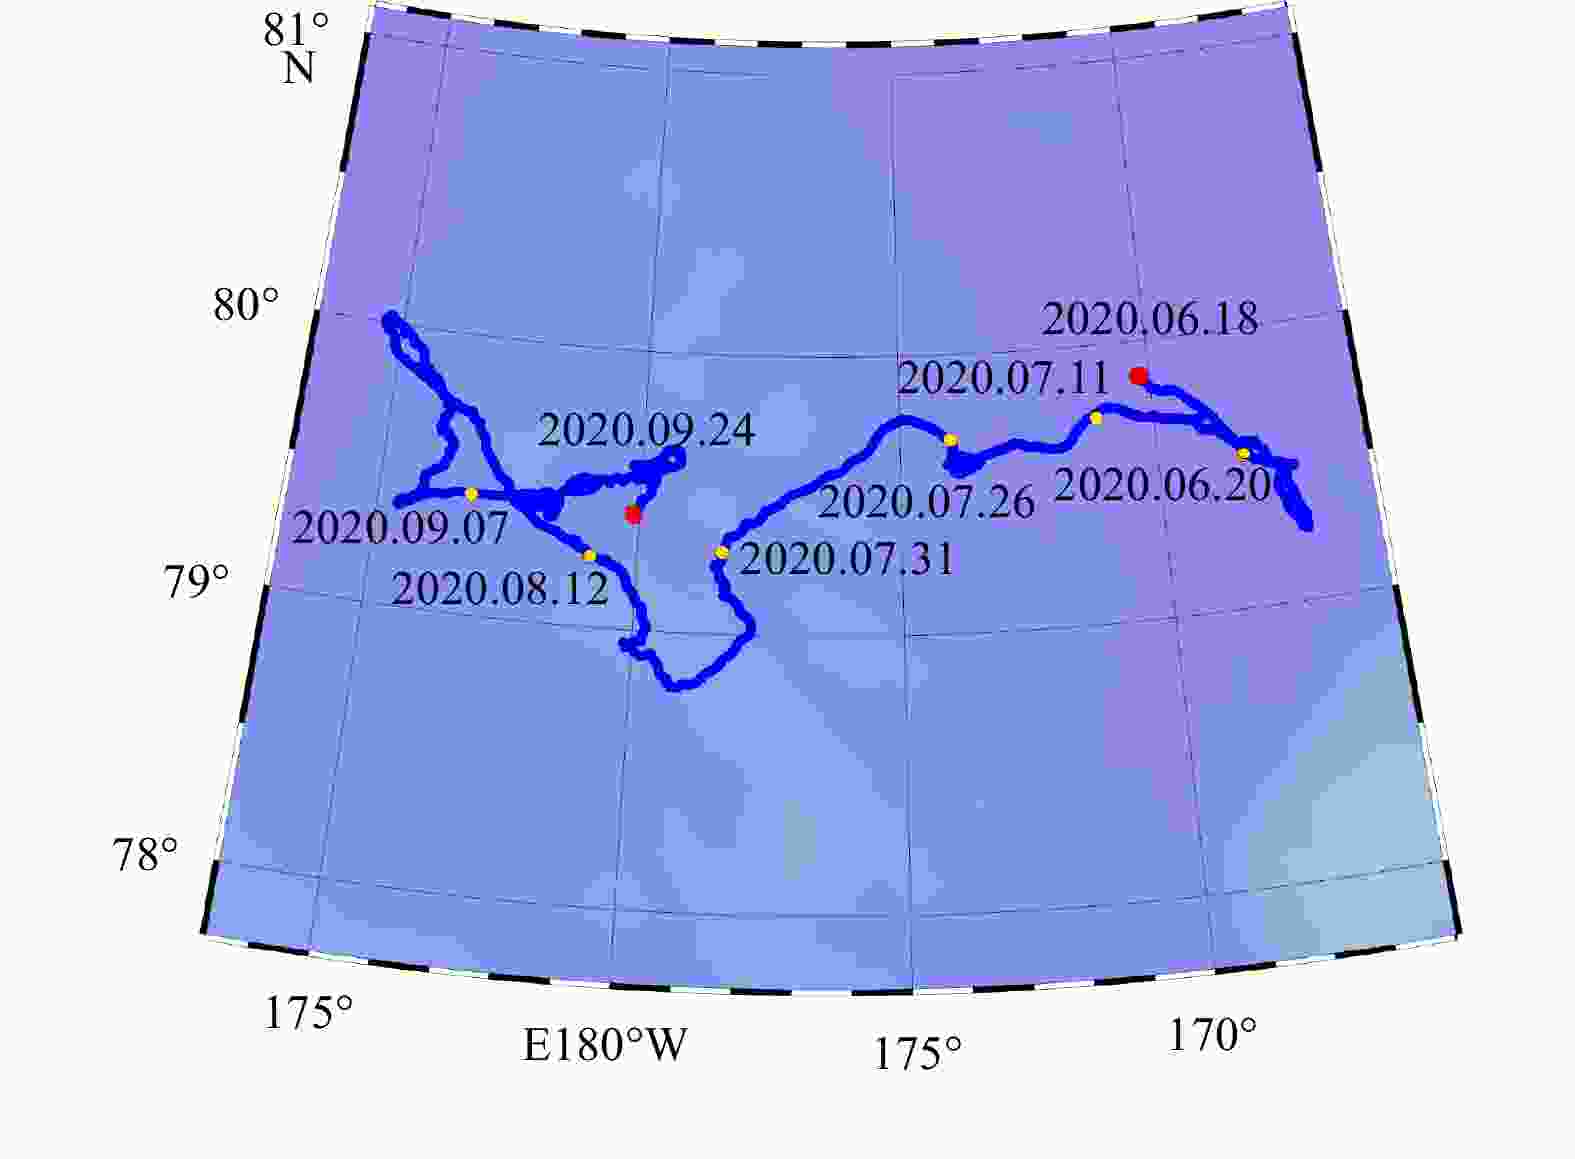
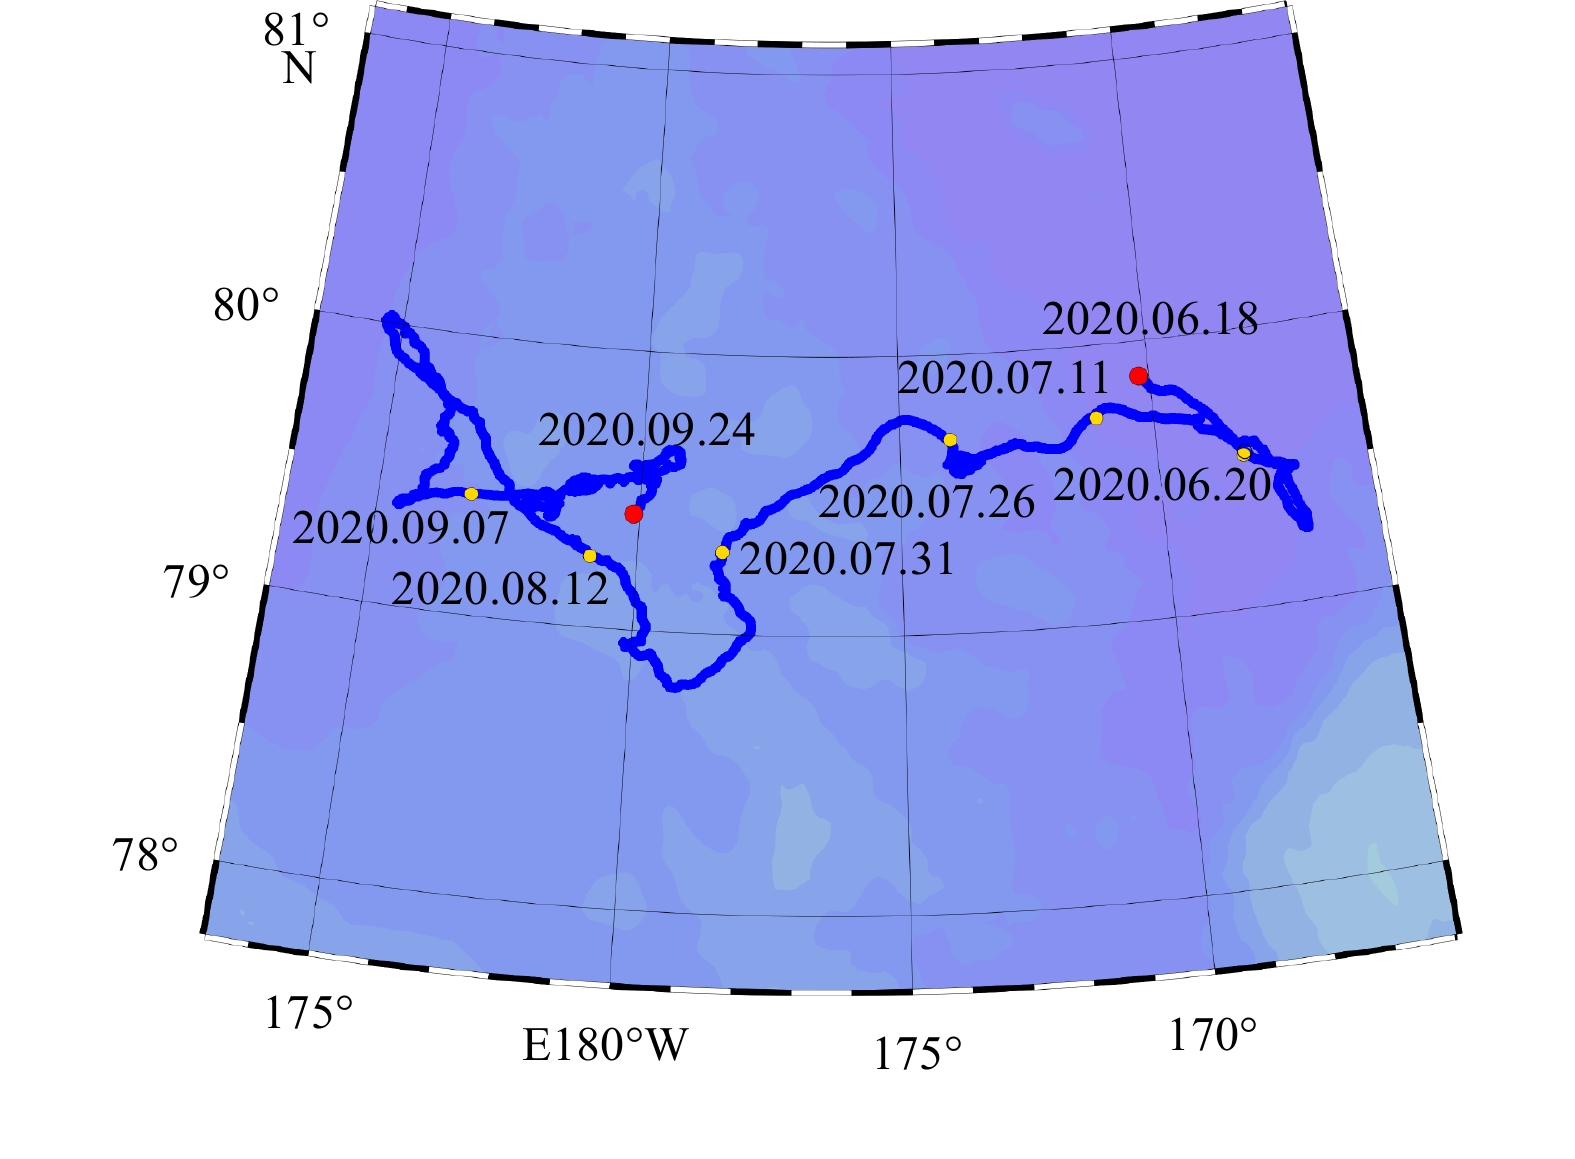
Figure 10. Partial track of the drifting buoy (June 18, 2020–September 24, 2020). The red dots represent the starting and ending points of the buoy’s trajectory, respectively.
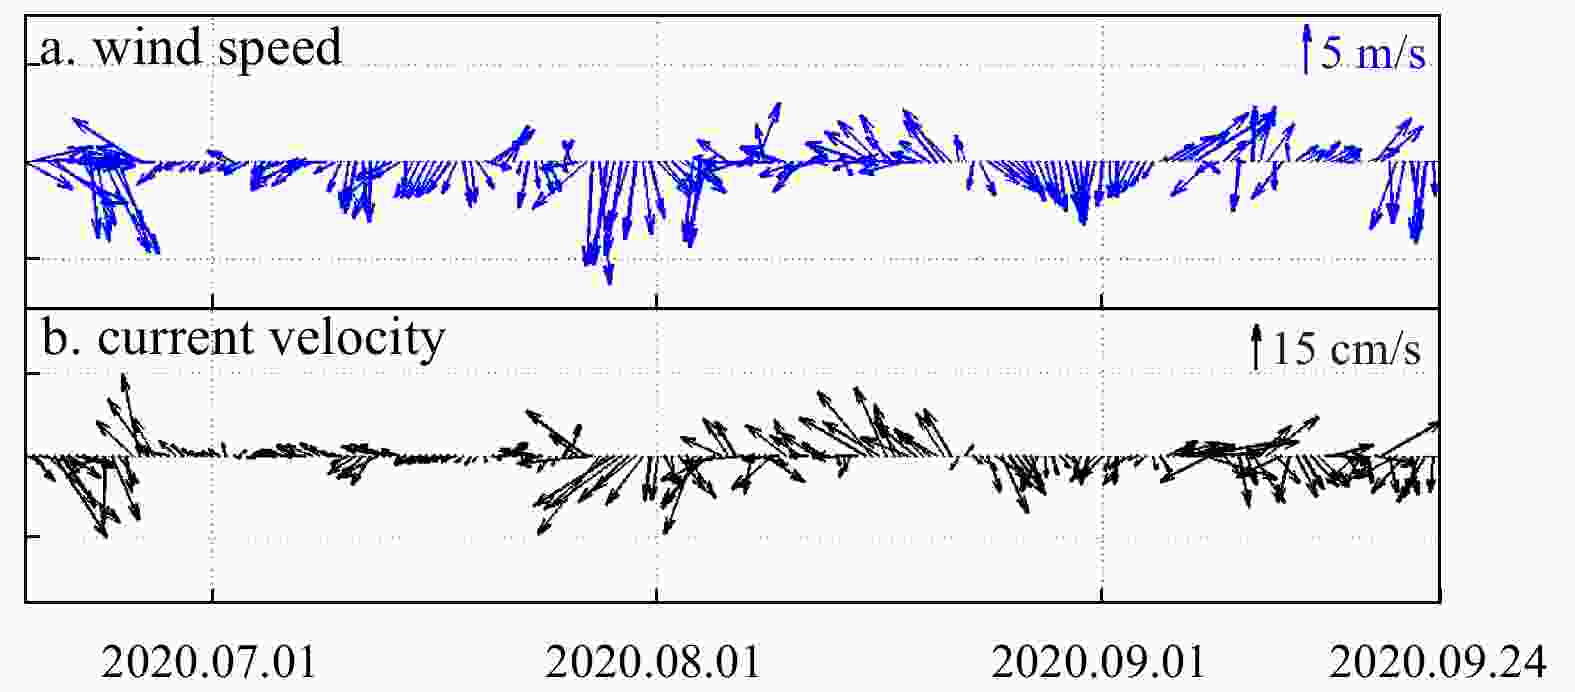
Figure 11. Diagram of ER5 wind speed and direction at point (79.5°N,178°W) (up), velocity and flow direction in the fourth section (down).
Table 1. Division of sections, median values and maximum values of drift residual speed for different sections of the drifting buoy
Section
No.Duration Starting position End position Drift residual speed/(cm · s−1) Figure
No.Main characteristic Median
valueMaximum
value001 Sept. 2–Sept. 30, 2019 74.69°N, 168.99°W 75.87°N, 174.97°W 12.71 32.78 5, 6 inertial flow 002 Oct. 1, 2019–Feb. 19, 2020 75.87°N, 174.95°W 76.33°N, 175.89°W 12.62 50.38 6 disorganized surface flow 003 Feb. 19, 2020–Jun. 18, 2020 76.33°N, 175.89°W 79.86°N, 170.20°W 8.79 28.45 3 transpolar drift 004 Jun. 18–Sept. 24, 2020 79.86°N, 170.20°W 79.41°N, 179.89°E 12.02 39.09 10 surface cross-ridge flow 005 Sept. 24–Nov. 11, 2020 79.41°N, 179.89°E 81.70°N, 178.31°E 12.81 31.92 3 transpolar drift 006 Nov. 20–Dec. 31, 2020 81.41°N, 174.76°W 82.15°N, 173.42°W 10.49 35.83 4, 6 transpolar drift; inertial flow 007 Jan. 6–Mar. 10, 2021 82.06°N, 171.21°W 82.75°N, 177.47°W 10.44 46.83 7 disorganized surface flow 008 Mar. 10–Jun. 9, 2021 82.75°N, 177.47°W 86.32°N, 150.85°W 8.88 30.63 4 transpolar drift  下载: 导出CSV
Table 2. Percentage statistics of 1-hour velocity and residual velocity in cm/s with an interval of 5 cm/s
Velocity type Percentage (0 cm/s,
5 cm/s](5 cm/s,
10 cm/s](10 cm/s,
15 cm/s](15 cm/s,
20 cm/s](20 cm/s,
25 cm/s](25 cm/s,
30 cm/s](30 cm/s,
35 cm/s](35 cm/s,
40 cm/s](>40 cm/s) 1-hour velocity 19.0% 28.2% 21.0% 13.0% 8.8% 5.0% 2.6% 1.1% 1.3% Residual velocity 21.2% 32.0% 22.6% 12.1% 6.6% 3.2% 1.1% 0.7% 0.4%
下载: 导出CSV
Table 3. Average northward velocity of transpolar drift in each period
Section No. Month range Zonal range Average northward velocity/(cm·s−1) 003 Feb.−Jun. 76.33°−79.86°N 3.5 005 Sept.−Nov. 79.41°−81.70°N 6.6 006 Nov.−Dec. 81.41°−82.15°N 3.8 008 Mar.−Jun. 82.75°−86.32°N 4.9
下载: 导出CSV
Table 4. Average northward velocity (80°−85°N) in each latitude calculated from 7 ice buoys records deployed during TICE expedition
Buoy No. Start latitude Average northward velocity/(cm·s−1) 2018S75 80.50°N 4.4 2018S76 80.70°N 4.3 2018T35 80.50°N 4.3 2018T46 80.44°N 4.7 2018T52 80.78°N 5.0 2018T54 79.66°N 5.0 2018T55 80.75°N 5.8
下载: 导出CSV
-
Brugler E T, Pickart R S, Moore G W K, et al. 2014. Seasonal to interannual variability of the Pacific water boundary current in the Beaufort Sea. Progress in Oceanography, 127: 1–20, doi: 10.1016/j.pocean.2014.05.002 Centurioni L R. 2018. Drifter technology and impacts for sea surface temperature, sea-level pressure, and ocean circulation studies. In: Venkatesan R, Tandon A, D’Asaro E, et al, eds. Observing the Oceans in Real Time. Cham: Springer, 37–57,doi: 10.1007/978-3-319-66493-4_3 Centurioni L, Braasch L, Di Lauro E, et al. 2017. A new strategic wave measurement station off Naples port main breakwater. Coastal Engineering Proceedings, 1(35): waves. 36, doi: 10.9753/icce.v35.waves.36 Chen Hongxia, Yang Wangxiao, Lin Lina, et al. 2021. Design and experimental application of surface drift buoy based on GNSS and Iridium communication. Journal of Ocean Technology (in Chinese), 40(4): 8–15, doi: 10.3969/j.issn.1003-2029.2021.04.002 Corlett W B, Pickart R S. 2017. The Chukchi slope current. Progress in Oceanography, 153: 50–65, doi: 10.1016/j.pocean.2017.04.005 Gong D L, Pickart R S. 2015. Summertime circulation in the eastern Chukchi Sea. Deep-Sea Research Part II: Topical Studies in Oceanography, 118: 18–31, doi: 10.1016/j.dsr2.2015.02.006 Haller M, Brümmer B, Müller G. 2014. Atmosphere–ice forcing in the transpolar drift stream: results from the DAMOCLES ice-buoy campaigns 2007–2009. The Cryosphere, 8(1): 275–288, doi: 10.5194/tc-8-275-2014 He Yan, Liu Na, Chen Hongxia, et al. 2015. Observed features of temperature, salinity and current in central Chukchi Sea during the summer of 2012. Acta Oceanologica Sinica, 34(5): 51–59, doi: 10.1007/s13131-015-0642-7 Jones E P, Swift J H, Anderson L G, et al. 2003. Tracing Pacific water in the North Atlantic ocean. Journal of Geophysical Research: Atmospheres, 108(C4): 3116, doi: 10.1029/2001JC001141 Kikuchi T, Itoh M, Nishino S, et al. 2015. Mooring-based long-term observation of oceanographic condition in the Chukchi Sea and Canada Basin of the Arctic Ocean. In: EGU General Assembly 2015. Vienna, Austria: EGU Killworth P D, Smith J M. 1984. A one-and-a-half dimensional model for the Arctic halocline. Deep-Sea Research Part A. Oceanographic Research Papers, 31(3): 271–293, doi: 10.1016/0198-0149(84)90105-5 Lei Ruibo, Hoppmann M, Cheng Bin, et al. 2021. Seasonal changes in sea ice kinematics and deformation in the Pacific sector of the Arctic Ocean in 2018/19. The Cryosphere, 15(3): 1321–1341, doi: 10.5194/tc-15-1321-2021 Li Min, Pickart R S, Spall M A, et al. 2019. Circulation of the Chukchi Sea shelfbreak and slope from moored timeseries. Progress in Oceanography, 172: 14–33, doi: 10.1016/j.pocean.2019.01.002 Liu Haifeng. 2014. Analysis of Fram Strait inertial flow characters and physical mechanism of its generation and change (in Chinese)[dissertation]. Qingdao: Ocean University of China Pickart R S, Moore G W K, Mao Chongyuan, et al. 2016. Circulation of winter water on the Chukchi shelf in early Summer. Deep-Sea Research Part II: Topical Studies in Oceanography, 130: 56–75, doi: 10.1016/j.dsr2.2016.05.001 Poulain P M, Luther D S, Patzert W C. 1992. Deriving inertial wave characteristics from surface drifter velocities: Frequency variability in the tropical Pacific. Journal of Geophysical Research: Oceans, 97(C11): 17947–17959, doi: 10.1029/92JC01381 Shi Jiuxin, Zhao Jinping, Jiao Yutian, et al. 2004. Pacific inflow and its links with abnormal variations in the Arctic Ocean. Chinese Journal of Polar Research (in Chinese), 16(3): 253–260 Shu Qi, Ma Hongyu, Qiao Fanli. 2012. Observation and simulation of a floe drift near the North Pole. Ocean Dynamics, 62(8): 1195–1200, doi: 10.1007/s10236-012-0554-4 Steele M, Zhang Jinlun, Ermold W. 2010. Mechanisms of summertime upper Arctic ocean warming and the effect on sea ice melt. Journal of Geophysical Research: Oceans, 115(C11): C11004, doi: 10.1029/2009JC005849 Sverdrup H U, Johnson M W, Fleming R H. 1942. The Oceans Their Physics, Chemistry, and General Biology. New York: Prentice-Hall Thomson R E, LeBlond P H, Rabinovich A B. 1998. Satellite-tracked drifter measurement of inertial and semidiurnal currents in the northeast Pacific. Journal of Geophysical Research: Oceans, 103(C1): 1039–1052, doi: 10.1029/97JC02374 Tian Yin, Bai Xuezhi, Huang Yingqi. 2021. Analysis of the variation in intensity and source region of the Arctic Transpolar Drift. Chinese Journal of Polar Research (in Chinese), 33(4): 529–544, doi: 10.13679/j.jdyj.20210034 Tomczak M, Godfrey J S. 1994. Regional Oceanography: An Introduction. Oxford: Pergamon, doi: 10.1016/C2009-0-14825-0 Wang Huiwu, Chen Hongxia, Lv Liangang, et al. 2011. Study of tide and residual current observations in Chukchi Sea in the summer 2008. Acta Oceanologica Sinica (in Chinese), 33(6): 1–8 Wang Huiwu, Liu Na, Zhao Chang, et al. 2012. Distribution characteristics of residual current in the Chukchi Sea in Summer 2008. Advances in Marine Science (in Chinese), 30(3): 338–346 Webster F. 1968. Observations of inertial-period motions in the deep sea. Reviews of Geophysics, 6(4): 473–490, doi: 10.1029/rg006i004p00473 Weingartner T, Aagaard K, Woodgate R, et al. 2005. Circulation on the north central Chukchi Sea shelf. Deep-Sea Research Part II: Topical Studies in Oceanography, 52(24−26): 3150–3174, doi: 10.1016/j.dsr2.2005.10.015 Woodgate R A, Aagaard K, Swift J H, et al. 2007. Atlantic water circulation over the Mendeleev Ridge and Chukchi Borderland from thermohaline intrusions and water mass properties. Journal of Geophysical Research: Oceans, 112(C2): C02005, doi: 10.1029/2005JC003416 Woodgate R A, Weingartner T J, Lindsay R. 2012. Observed increases in Bering Strait oceanic fluxes from the Pacific to the Arctic from 2001 to 2011 and their impacts on the Arctic ocean water column. Geophysical Research Letters, 39(24): L24603, doi: 10.1029/2012gl054092 Yi Feng, Liu Bin, Li Zhonghan, et al. 2019. The impact of ocean turbulence on acquisition and processing of seismic data. Chinese Journal of Engineering Geophysics (in Chinese), 16(6): 775–783 Zhao Song, Dong Linsen, Wang Xiangqin, et al. 2020. Composition and provenance analysis of rare-earth elements in the manganese-rich brown layers of the Mendeleev Ridge, Arctic Ocean. Haiyang Xuebao (in Chinese), 42(7): 78–92 Zhao Yunxia, Wei Zexun, Wang Xinyi. 2011. Study of inertial motions using surface trajectories of Argo floats. Journal of Ocean Technology (in Chinese), 30(2): 72–75 -
 Supplement-10.1007_s13131-023-2202-x-1116.pdf

-


 点击查看大图
计量
- 文章访问数: 204
- HTML全文浏览量: 93
- PDF下载量: 11
- 被引次数: 0

