

Influence of asymmetric tidal mixing on sediment dynamics in a partially mixed estuary
-
Abstract: To investigate the influence of asymmetric tidal mixing (ATM) on sediment dynamics in tidal estuaries, we developed a vertically one-dimensional idealized analytical model, in which the M2 tidal flow, residual flow and suspended sediment concentration (SSC) are described. Model solutions are obtained in terms of tidally-averaged, and tidally-varying components (M2 and M4) of both hydrodynamics and sediment dynamics. The effect of ATM was considered with a time-varying eddy viscosity and time-varying eddy diffusivity of SSC. For the first time, an analytical solution for SSC variation driven by varying diffusivity could be derived. The model was applied to York River Estuary, where higher (or lower) eddy diffusivity was observed during flood (or ebb) in a previous study. The model results agreed well with the observation in both hydrodynamics and sediment dynamics. The vertical sediment distribution under the influence of ATM was analyzed in terms of the phase lag of the M2 component of SSC relative to tidal flow. The phase lag increases significantly in estuaries with typical ATM (higher diffusivity during flood and lower diffusivity during ebb) for the case of seaward-directed net bottom shear stress (e.g., strong river discharge). In contrary, the phase lag is reduced by ATM, if the tidally-averaged bottom shear stress is landward (e.g., strong horizontal density gradient). The dynamics of sediment transport was analyzed as a function of ATM phase lag to identify the time of highest sediment diffusivity, as well as a function of the residual flow, to evaluate the relative importance of seaward and landward residual flows. In estuaries with relative strong fresh water discharge or weak tidal forcing (in case of flood season or neap tide), the near bottom SSC could be higher during ebb than during flood, since the bottom shear stress is higher during ebb due to seaward residual flow. However, landward net sediment transport can be expected in these estuaries in case of a typical ATM, because higher diffusivity causes higher SSC and landward transport during the flood period, while both SSC and seaward transport could be lower during ebb. On the contrary, seaward sediment transport can be expected in estuaries with landward tidally mean bottom shear stress in case of a reverse ATM, where sediment diffusivity is higher during the ebb.
-
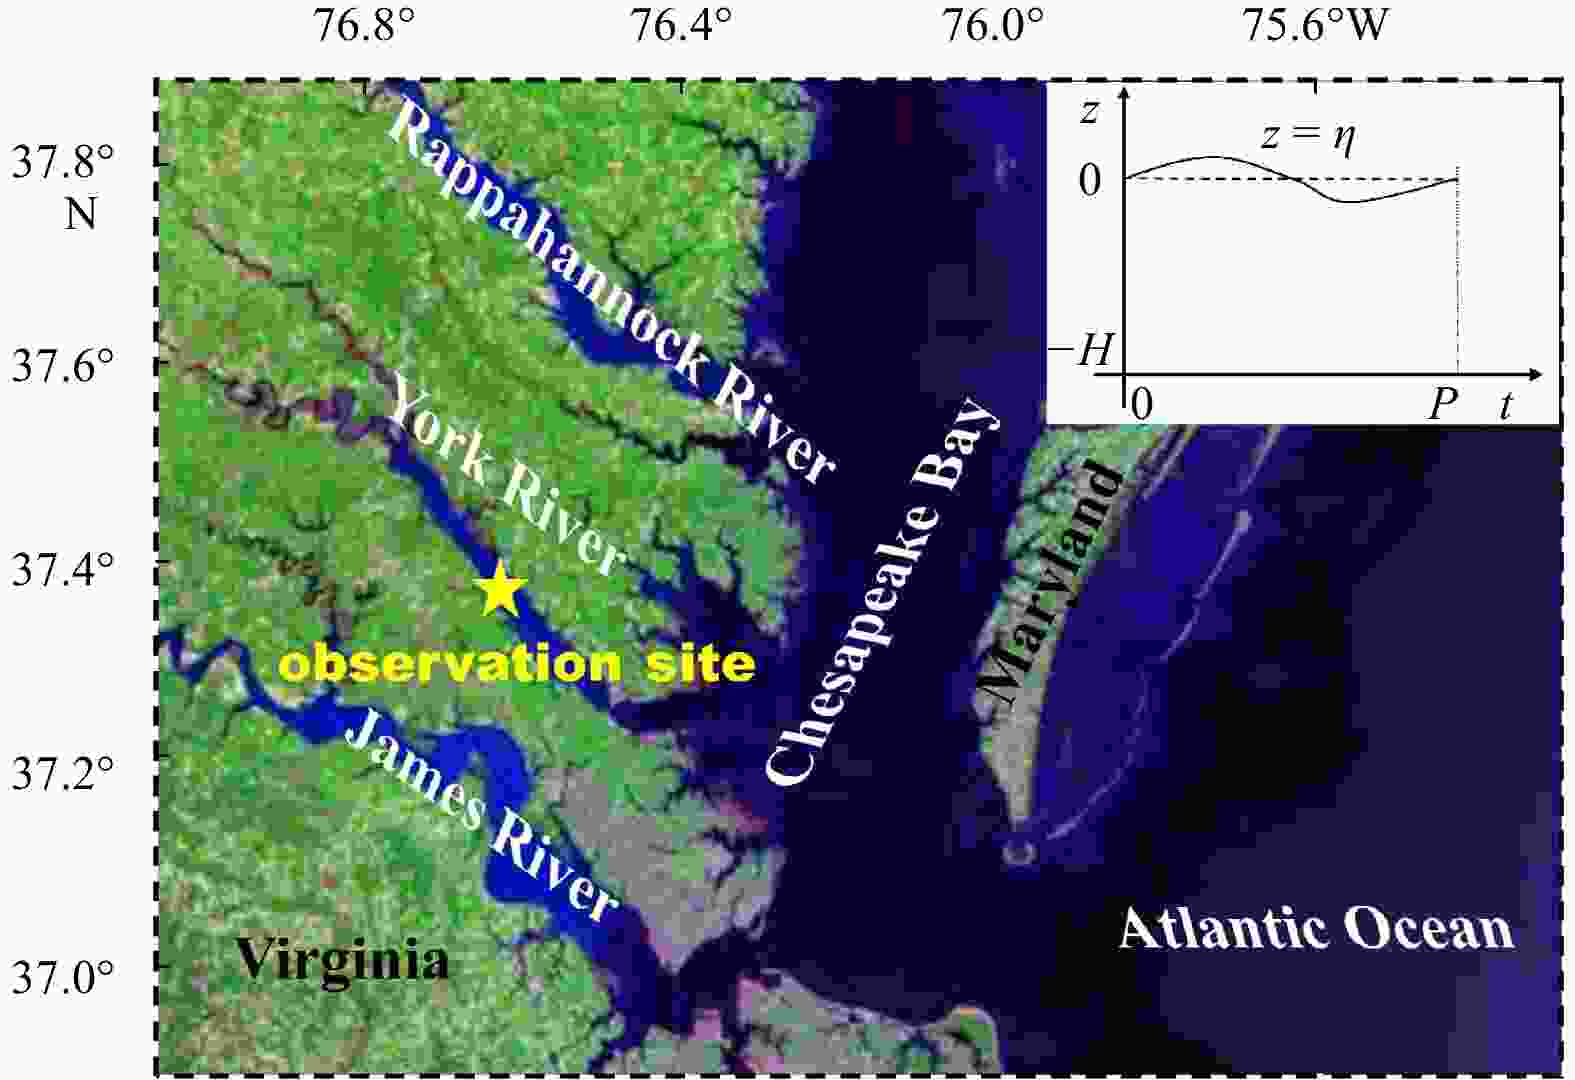
Figure 1. Site map of the York River Estuary showing the location of field observations. A sketch map of the model geometry attached in the top-right corner, where
$ z=\eta $ is the elevation of the water surface and$ z=-H $ is the bed. The horizontal dashed line indicates the average sea level (z = 0), while the solid line shows surface elevation during a tidal period of length P.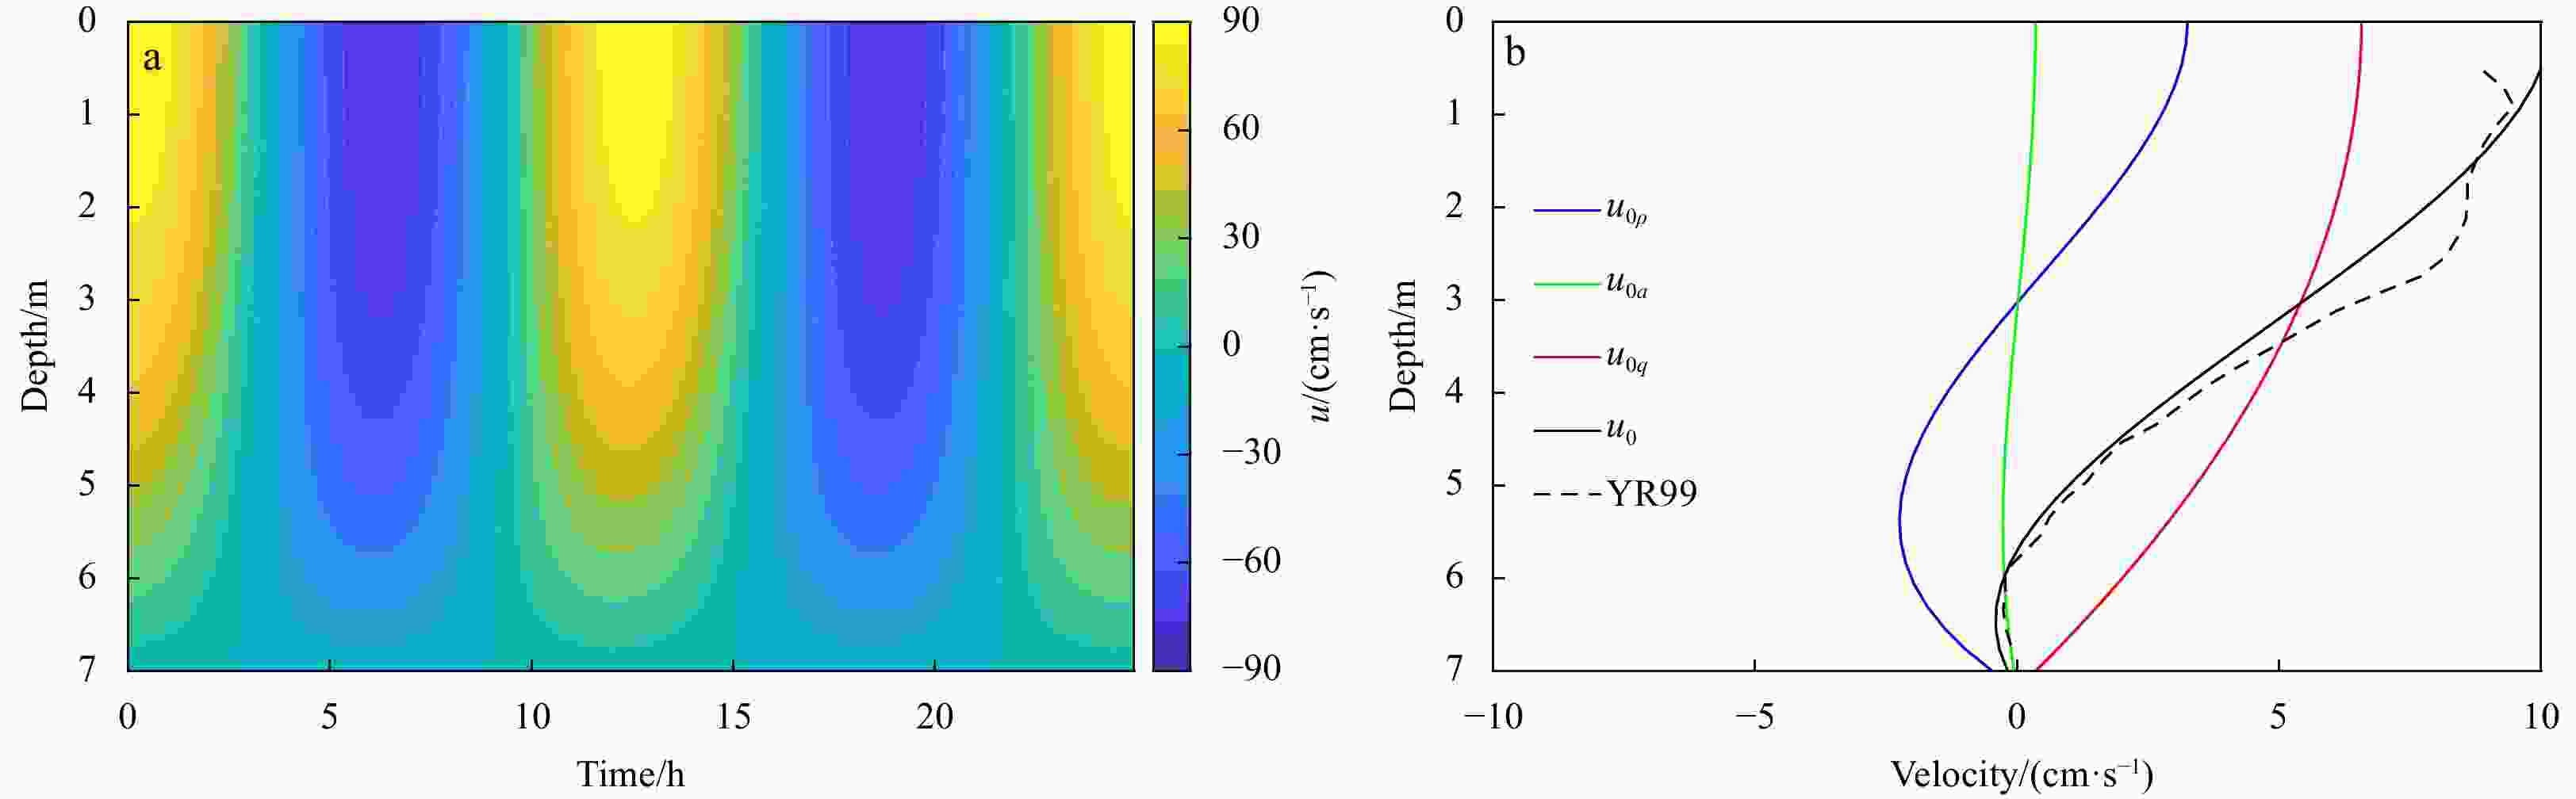
Figure 2. Model results of the vertical-temporal structure of total flow velocity (u = u0+u2) (a) and of the vertical structure of the residual components (b) based on the parameters of an observation point in the York River Estuary (Table 1). The blue line shows the flow component driven by the longitudinal density gradient (
$ {u}_{0\rho } $ ), the green line is contribution of asymmetric tidal mixing ($ {u}_{0a} $ ), and the red line is the contribution from fresh water discharge ($ {u}_{0q} $ ). The solid black line shows the corresponding modeled mean velocity and the dashed line shows the observed mean velocity from Scully and Friedrichs (2003).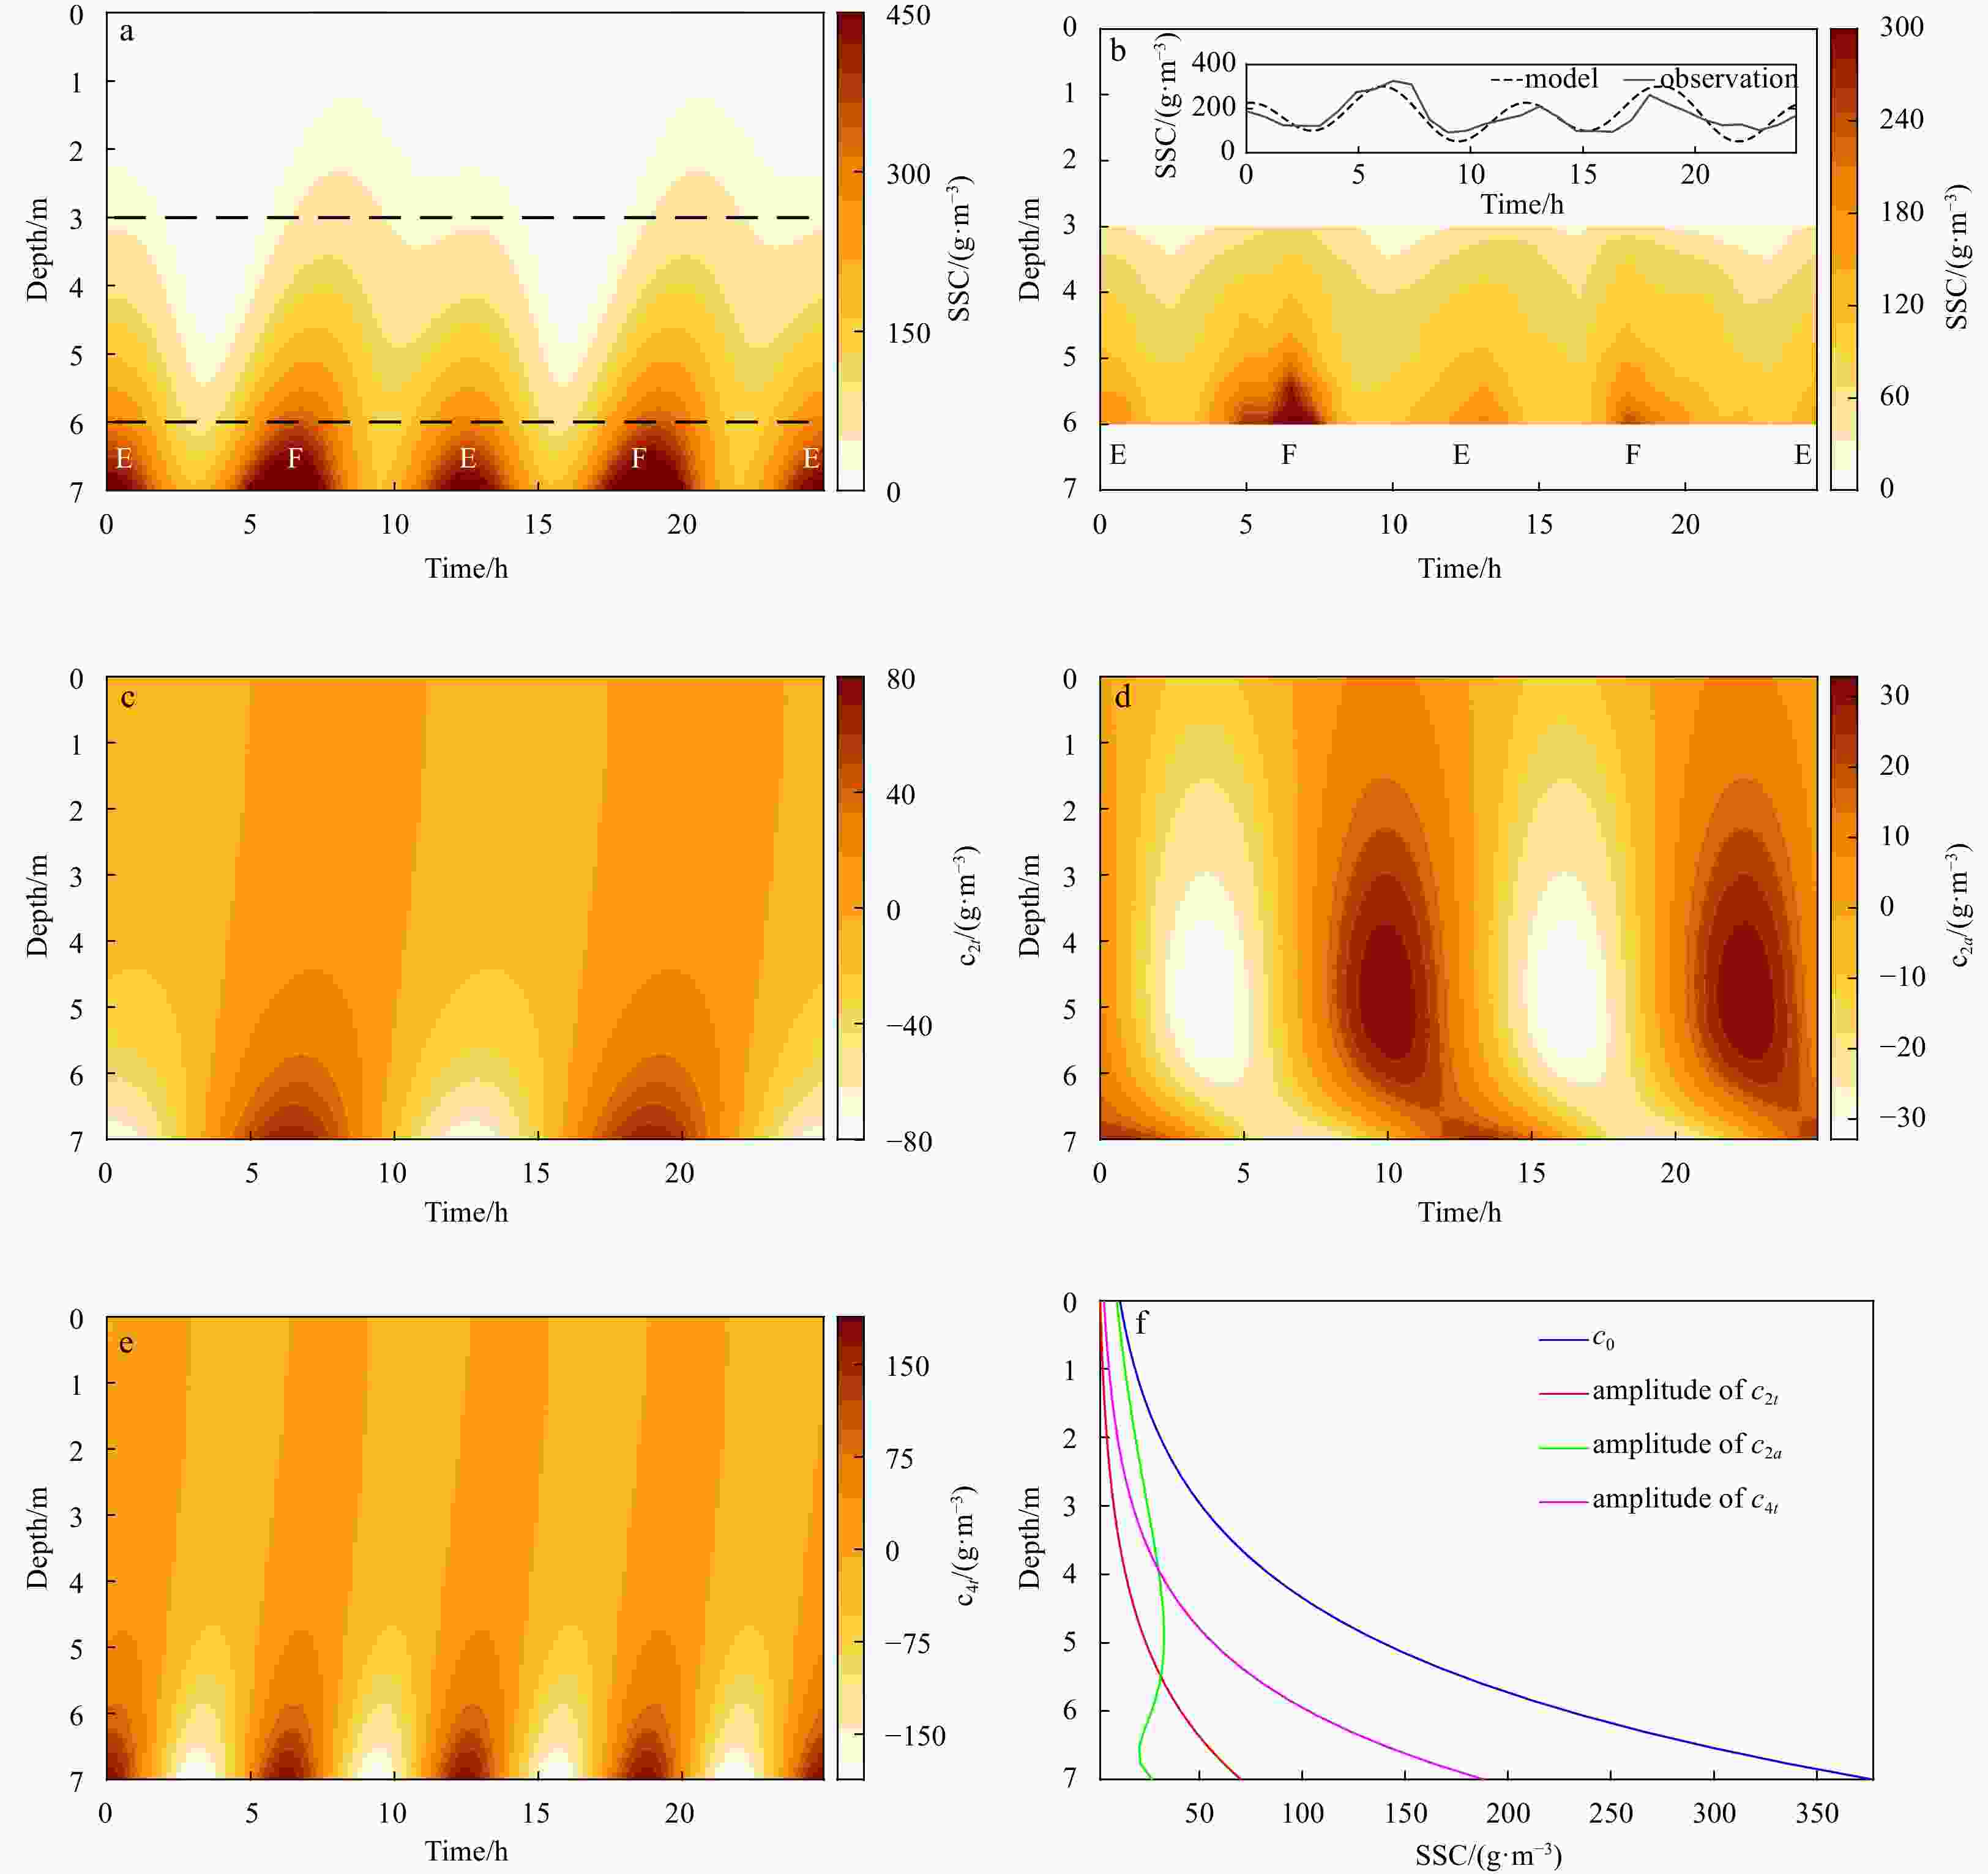
Figure 3. Model results (a) and observations (b, taken from Scully and Friedrichs (2003)) for the vertical-temporal structure of suspended sediment concentration (SSC) over two M2 tidal periods (~ 25 h). The line plots in panel b compares temporal variation of near bottom SSC (z = 7 m) from observations and model results. The dashed horizontal lines in panel a mark the depth range with observational data shown in panel b. The labels “F” and “E” in panel a and b denote “flood” and “ebb”, respectively. Panels c, d and e show individual components of M2 component SSC induced by bottom shear stress (c2t), M2 component SSC induced by asymmetry of diffusivity (c2a), and M4 component SSC induced by bottom shear stress (c4t), respectively. Panel f shows the vertical distribution of SSC amplitude of each component.
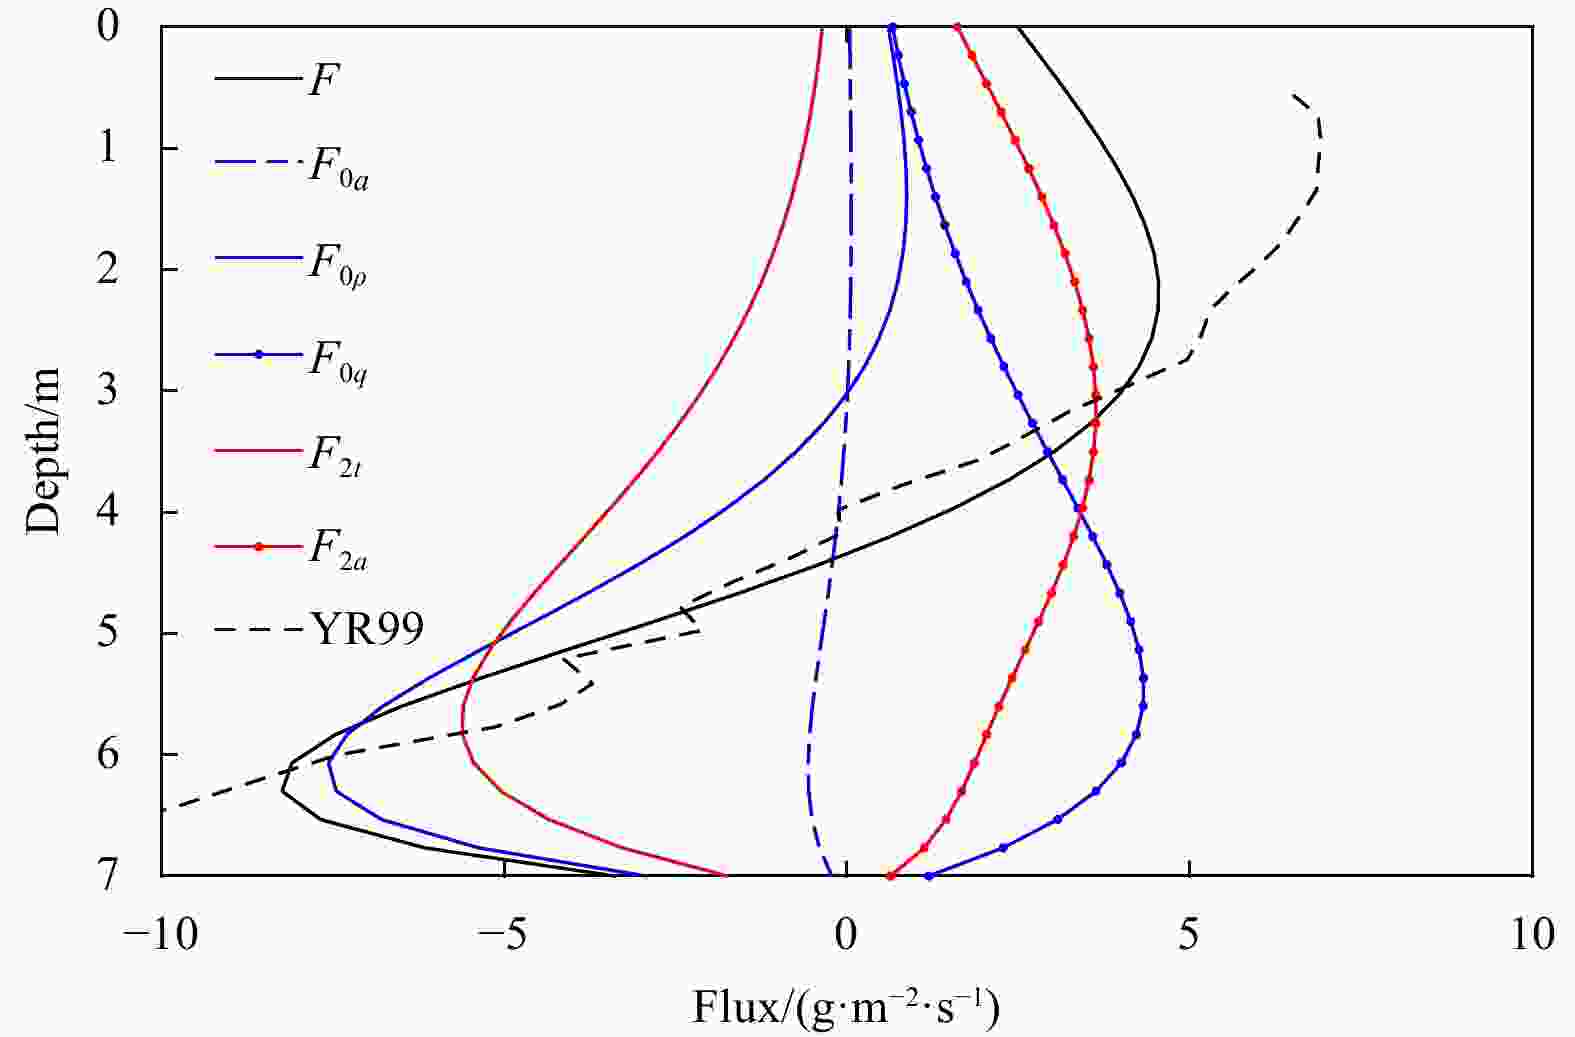
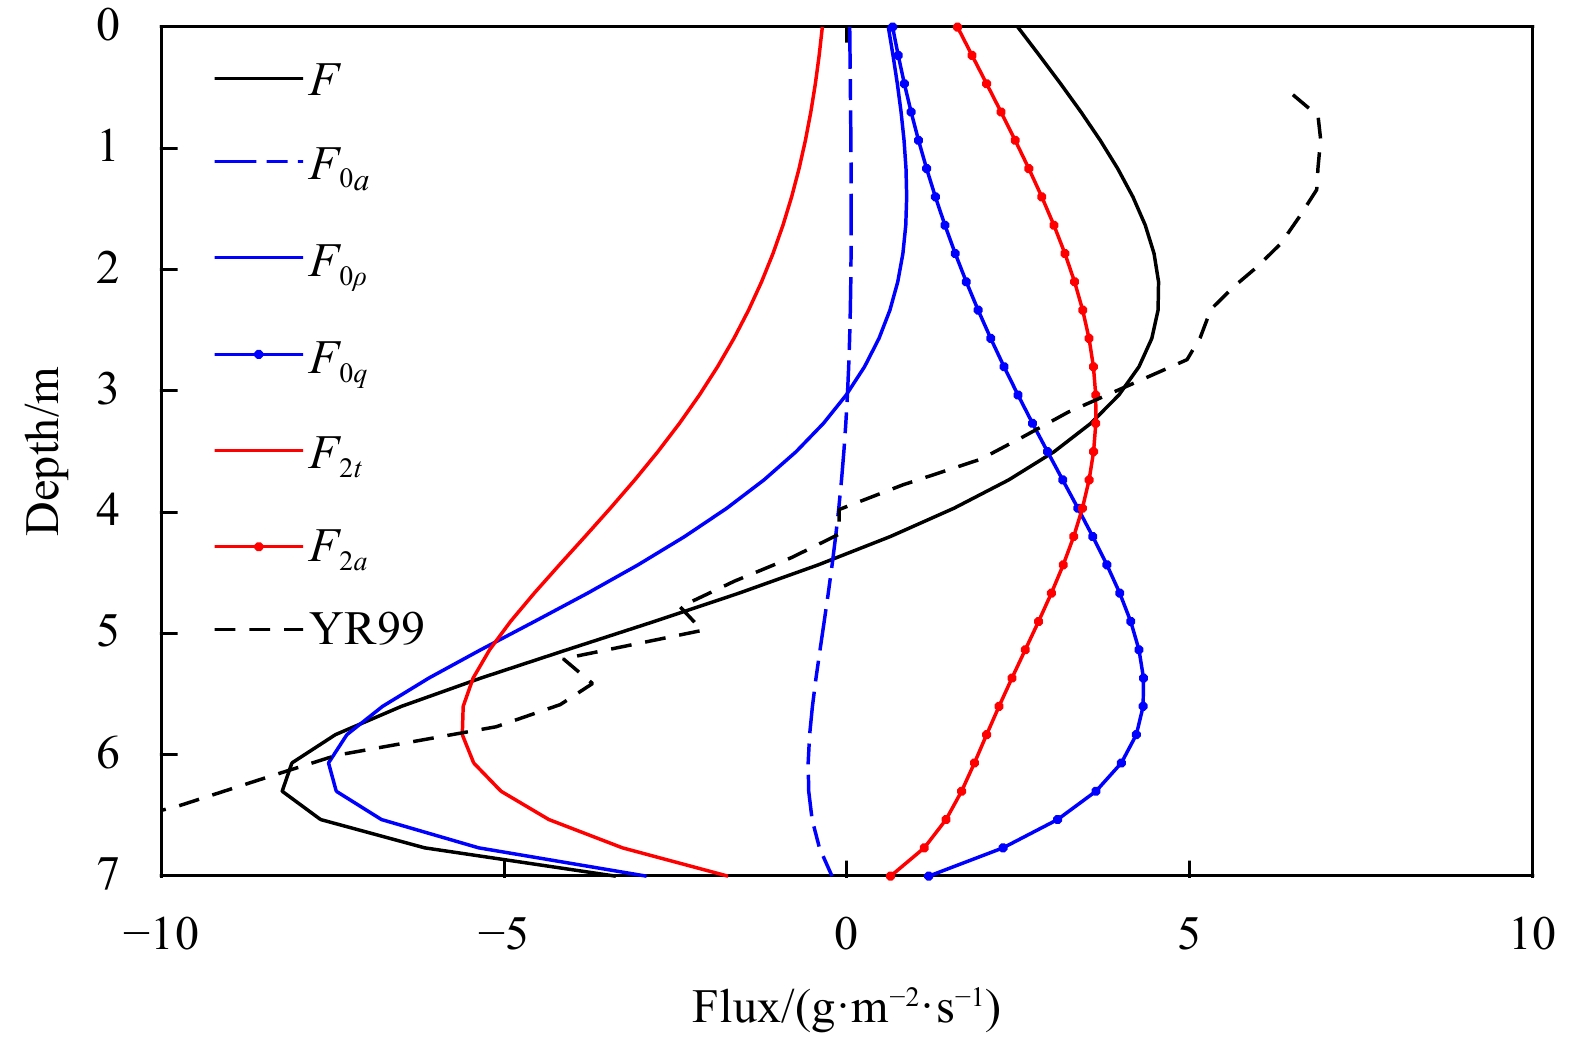
Figure 4. Vertical structure of sediment flux and its components based on the parameters for a point in the York River Estuary.
$ {F}_{0a} $ ,$ {F}_{0\rho } $ and$ {F}_{0q} $ represent residual sediment flux related to asymmetry tidal eddy viscosity, horizontal density gradient, and river discharge.$ {F}_{2t} $ and$ {F}_{2a} $ represent tidal sediment flux related to bottom shear stress varying in M2 frequency and asymmetry tidal diffusivity. The dashed black line (YR99) shows the observed sediment flux cited from Scully and Friedrichs (2003).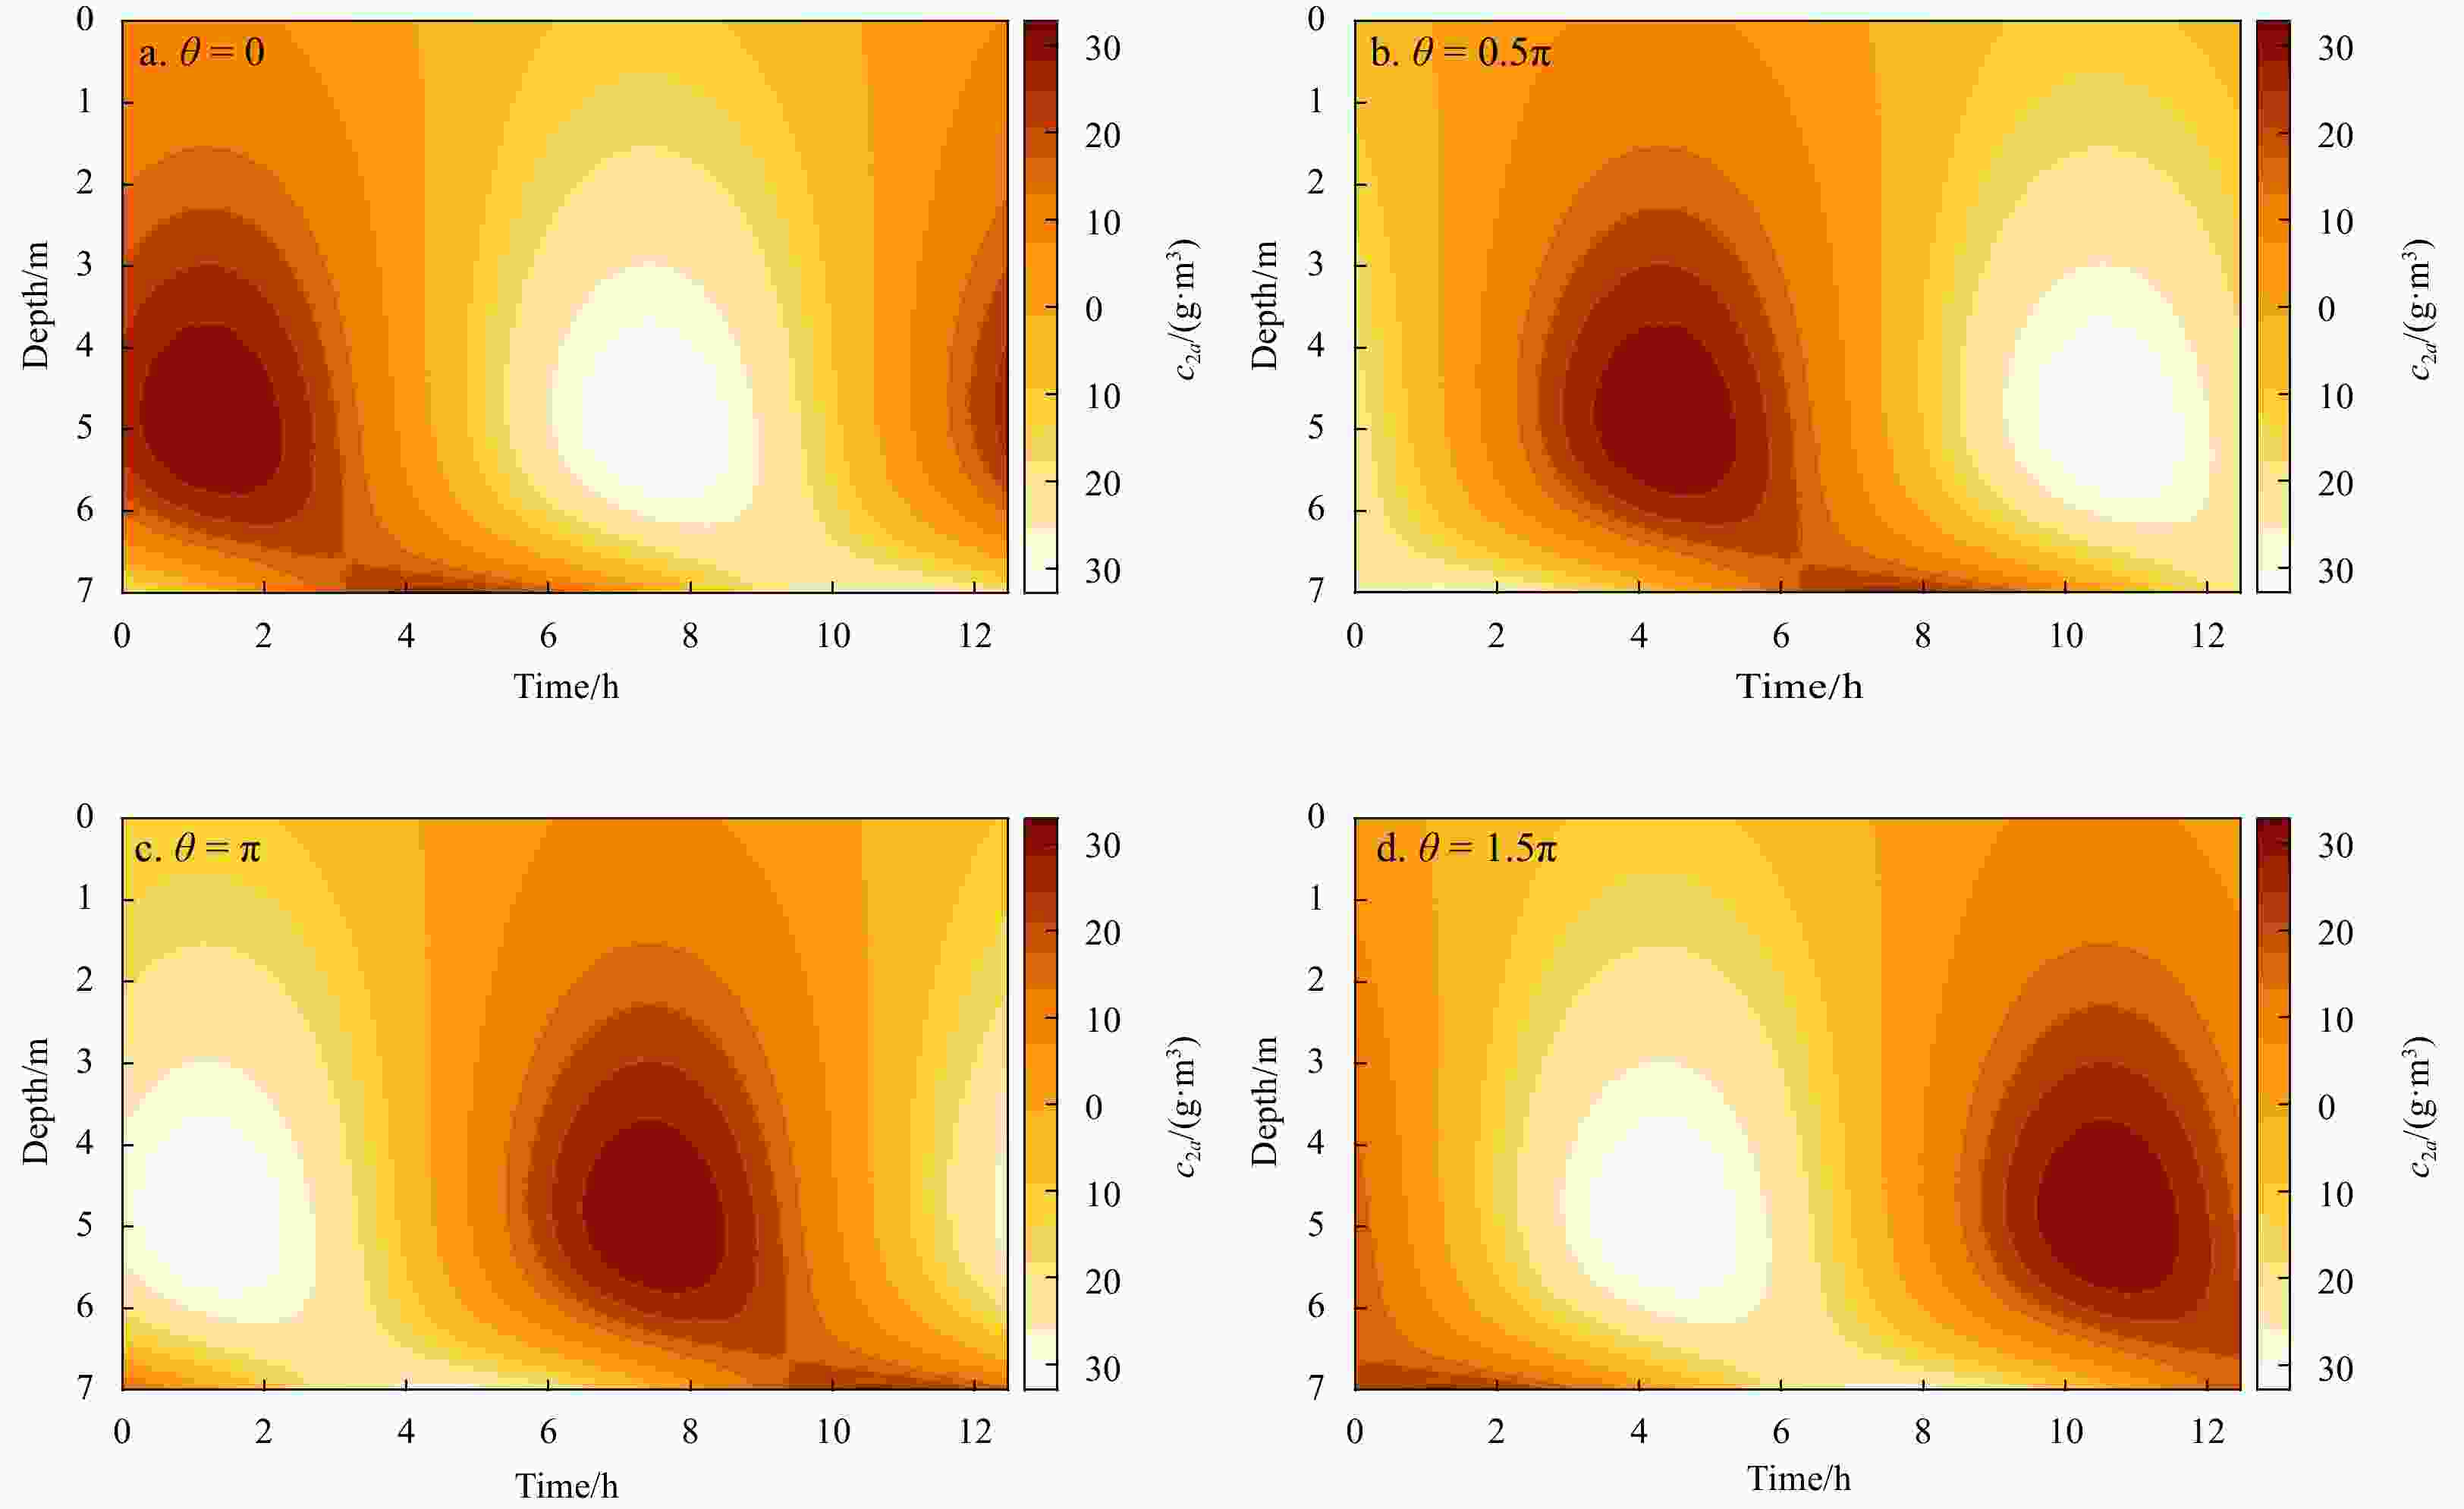
Figure 5. Vertical-temporal structure of the asymmetric tidal mixing (ATM)-induced SSC (c2a) during a single M2 tidal period for different phase angles between tidal flow and sediment diffusivity (
$ \theta $ ). Panels a, b, c and d represent$\theta =0,\theta =0.5\pi , $ $ \theta =\pi \;\mathrm{a}\mathrm{n}\mathrm{d}\;\theta =1.5\pi$ , respectively. The remaining parameters are shown in Table 1.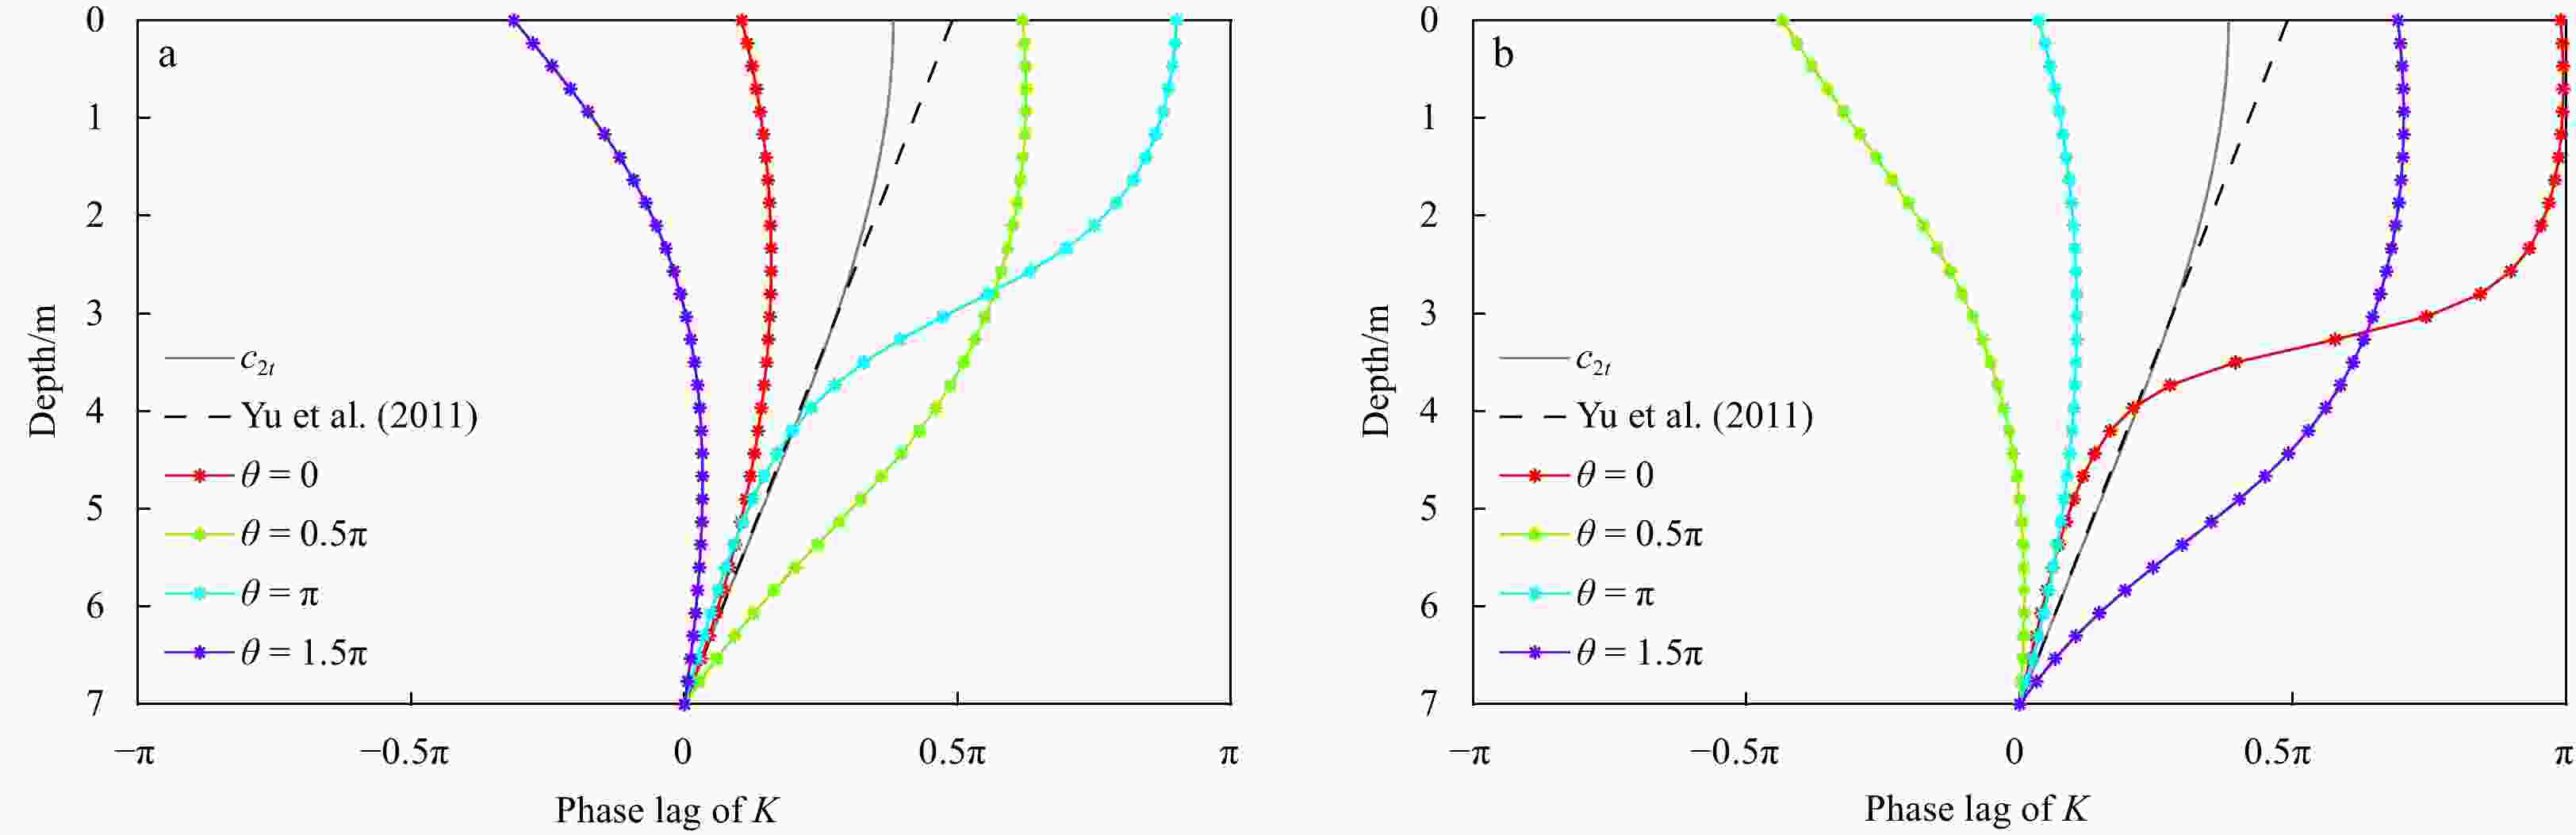
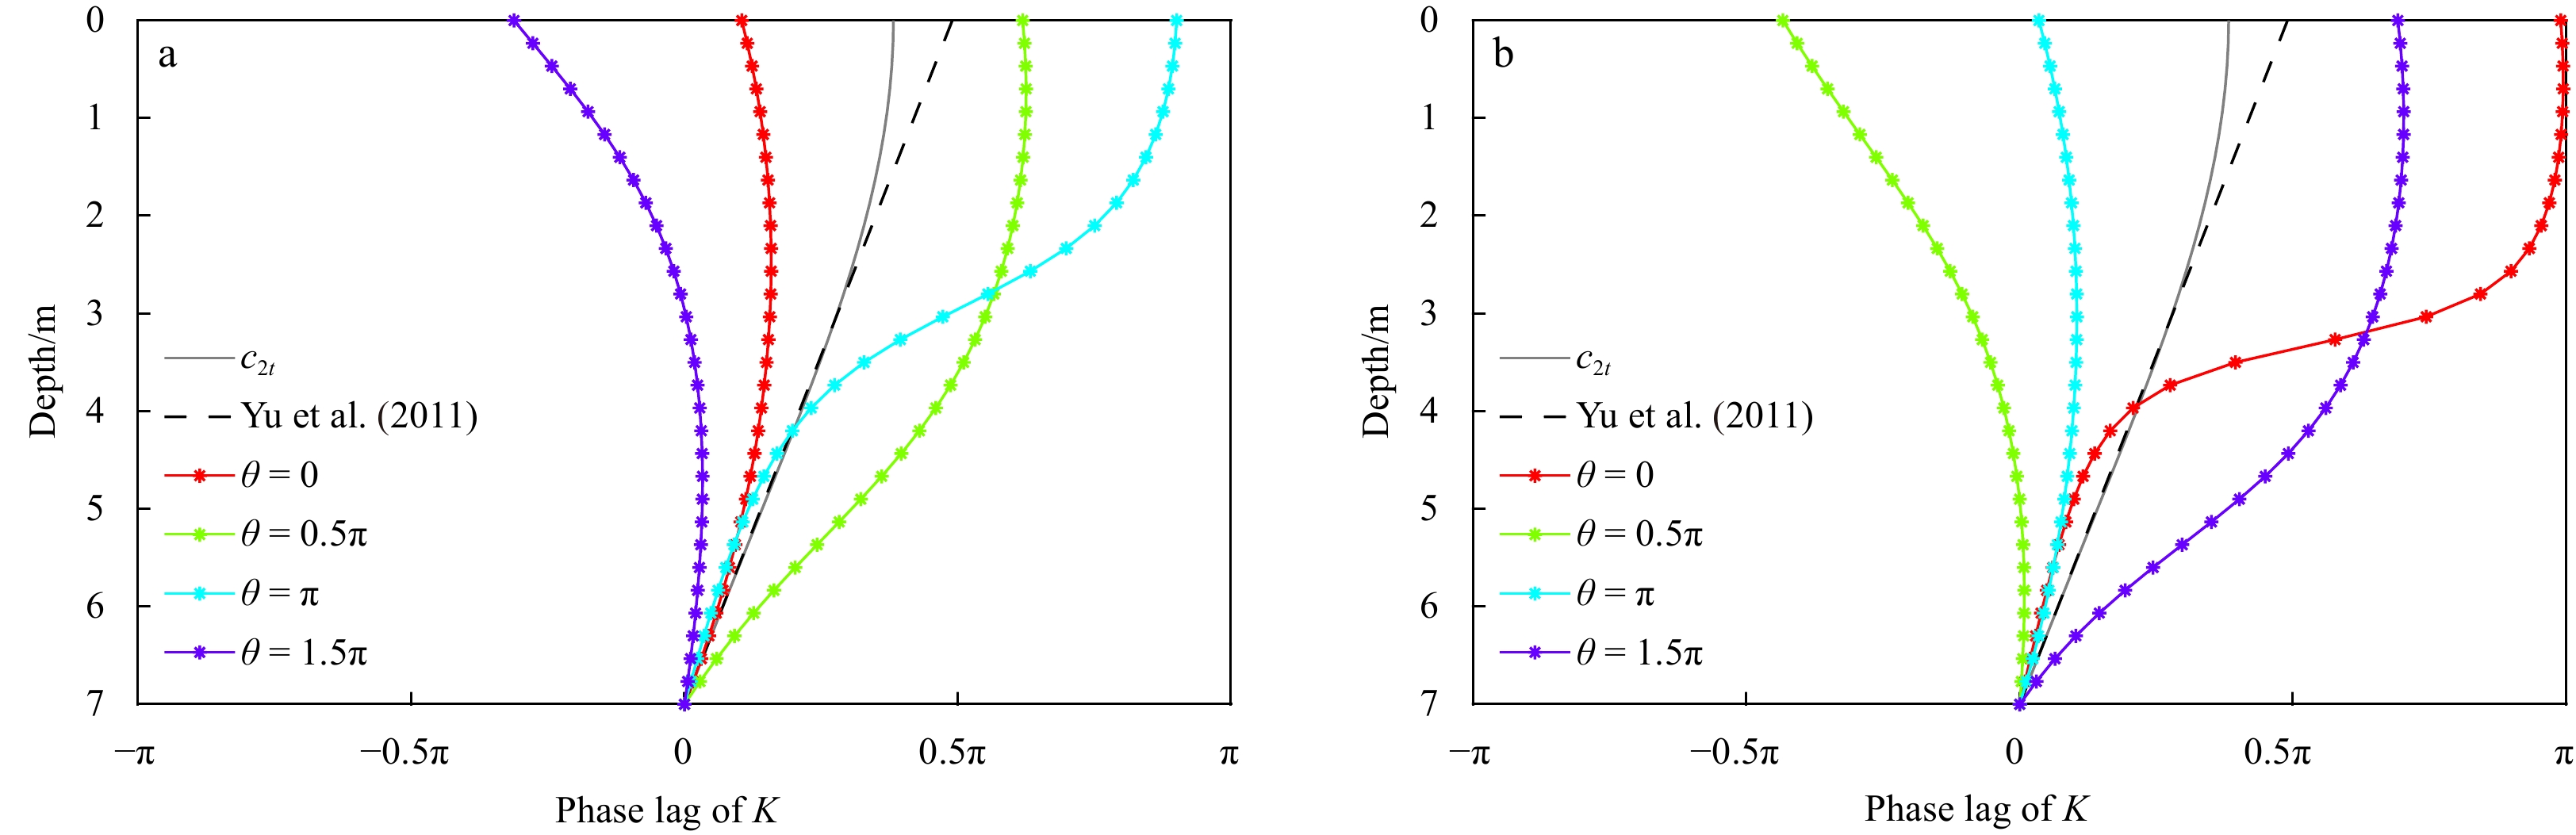
Figure 6. Vertical structure of phase lag of suspended sediment concentration in response to diffusivity phase
$ \theta $ in case of:$\partial \rho /\partial x=0,{U}_{0}=0.15\;\mathrm{m}/{\mathrm{s}}$ (scenario z (i)) (a) and$\partial \rho /\partial x=1\times {10}^{-3}\;\mathrm{k}\mathrm{g}/{\mathrm{m}}^{4},{U}_{0}=0$ (scenario (ii)) (b). The black line represents the analytical result of Yu et al. (2011). The gray line shows the model results of c2t, i.e., without consideration of asymmetric tidal mixing. The remaining 4 colored lines represent the result of$ \phi \left(z\right) $ with consideration of c2a for four$ \theta $ values ($ 0, 0.5\pi ,\pi , 1.5\pi $ ).
Figure 7. Vertical structure of M2 suspended sediment concentration (SSC) component (c2) over a tidal period under four different values of phase angle of tidally varying sediment diffusivity (
$ \theta $ ) in case of scenario (i),$\partial \rho /\partial x=0,{U}_{0}=0.15\;{\rm{m}}/{\rm{s }}$ . Panels a, b, c and d show results for$\theta =0,\;\theta =0.5\pi ,\; \theta =\pi \;\mathrm{a}\mathrm{n}\mathrm{d}\;\theta =1.5\pi$ , respectively.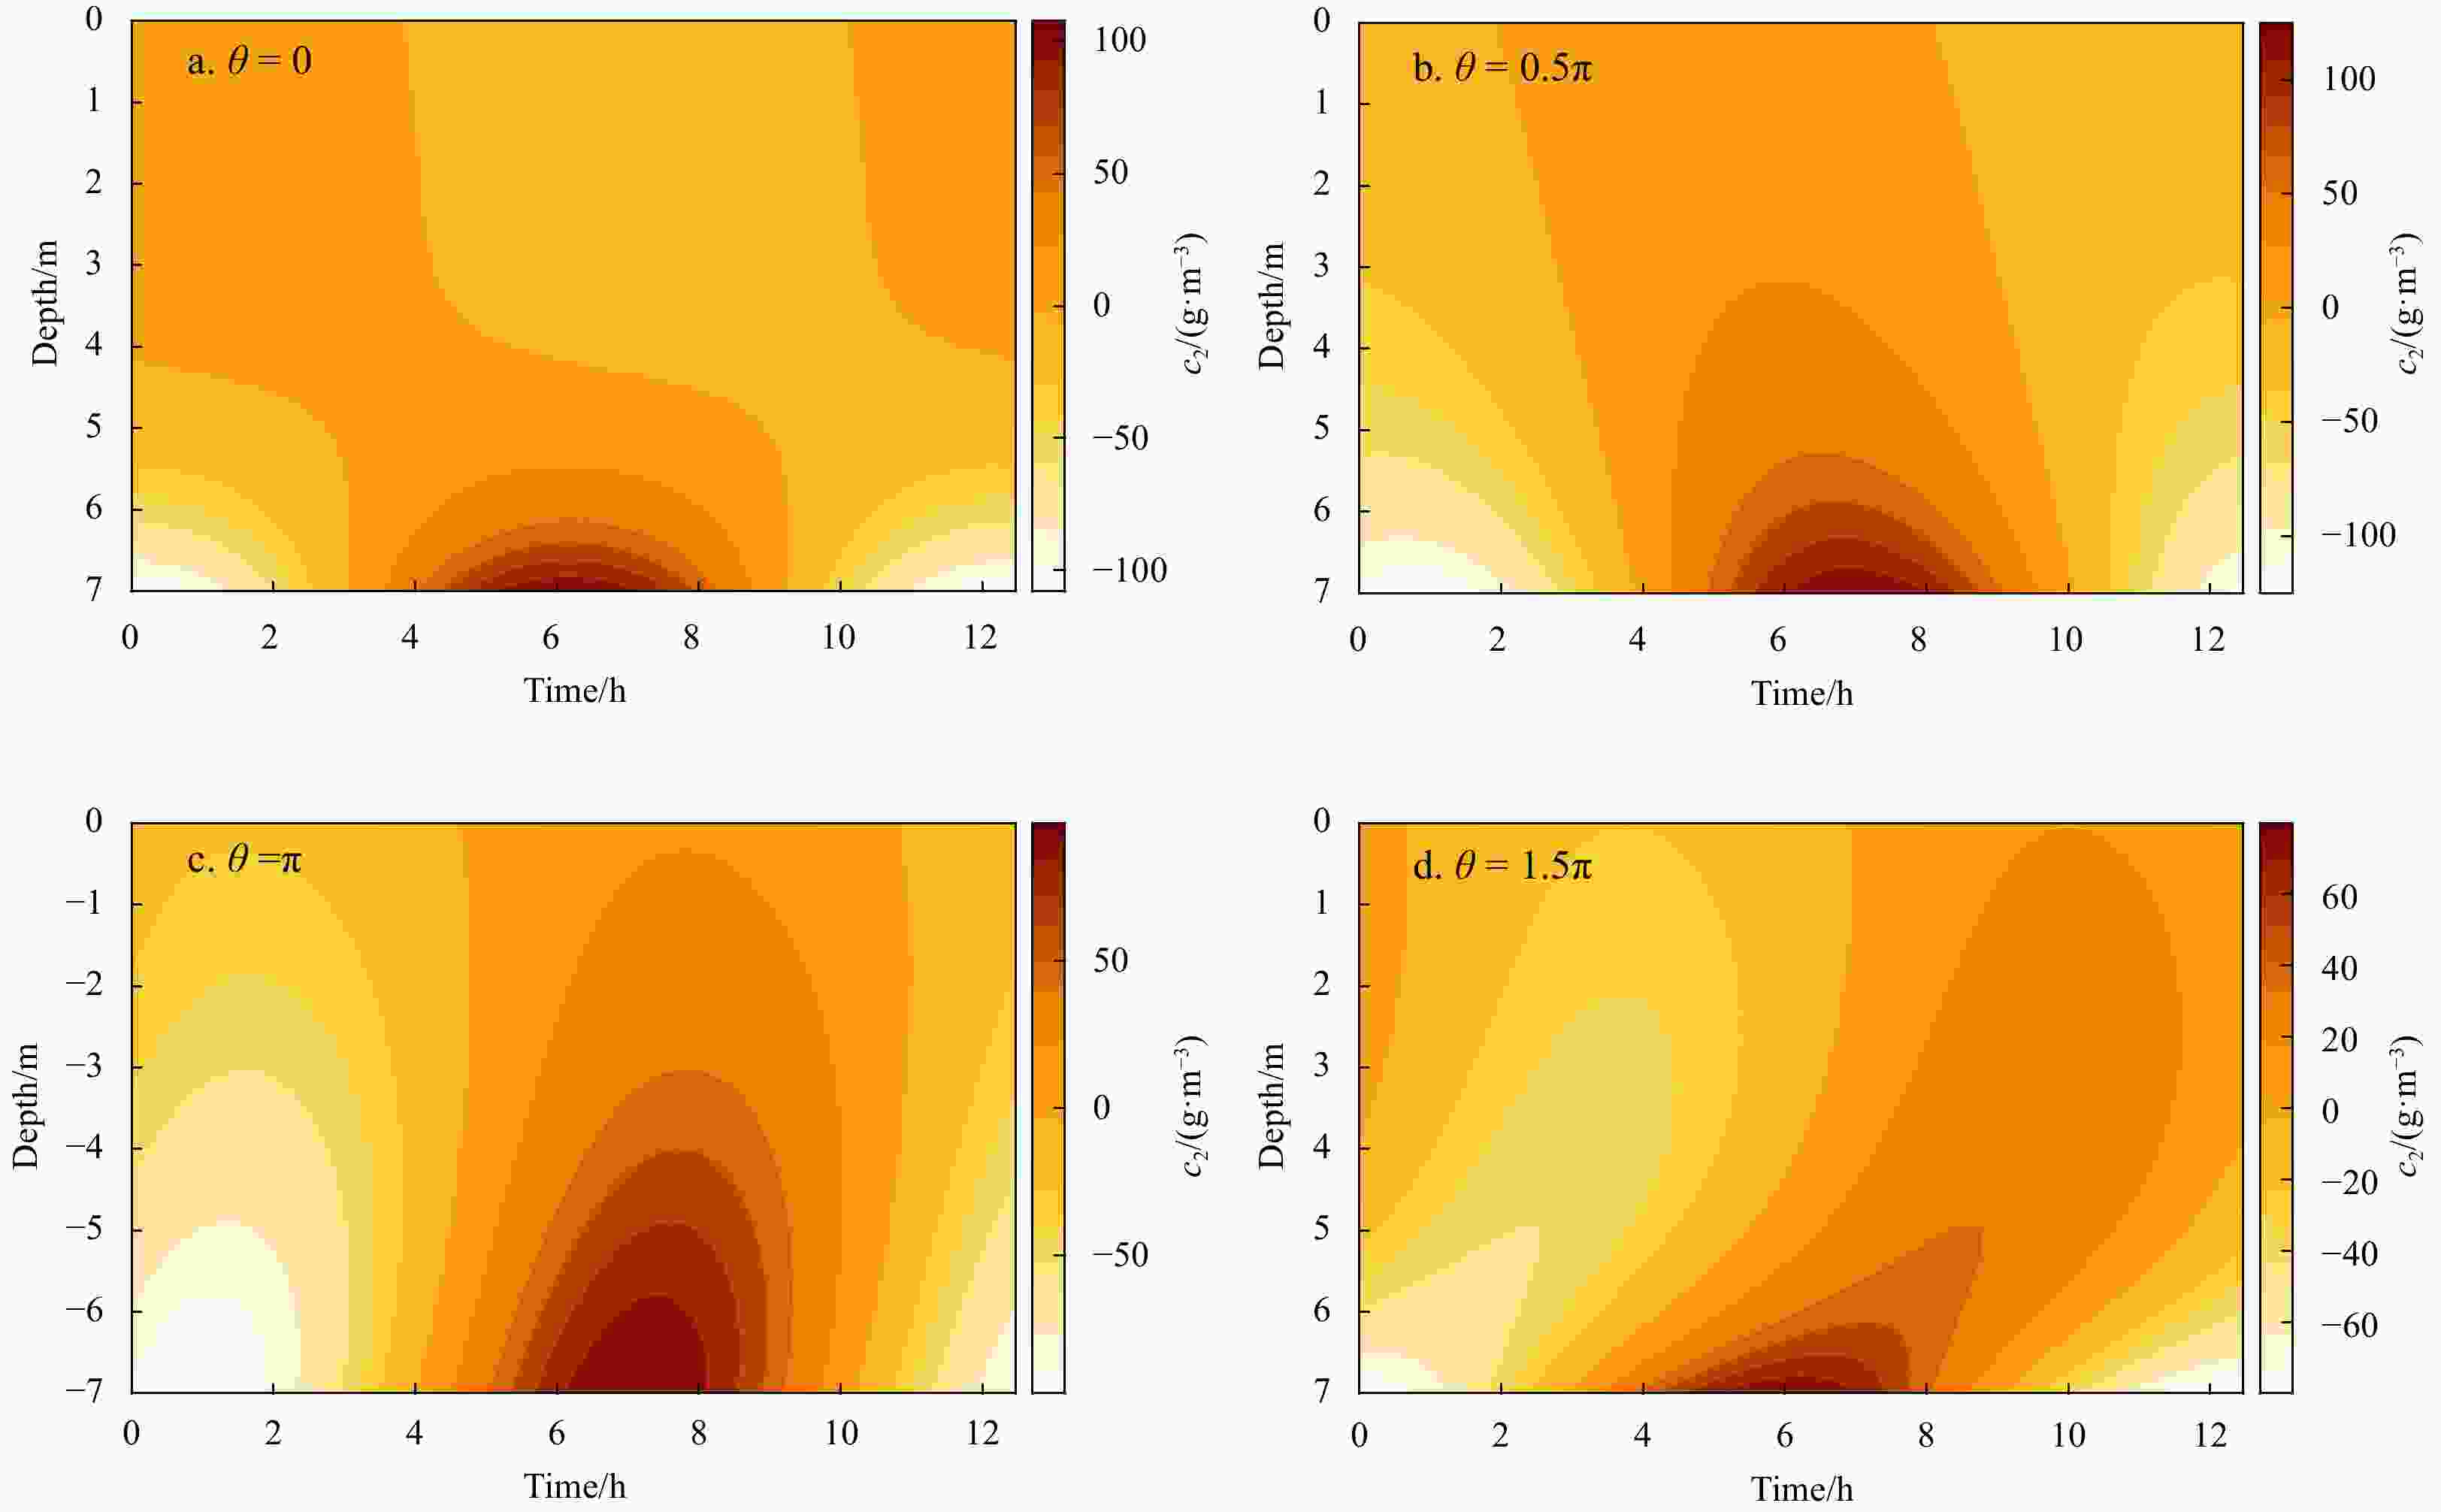
Figure 8. Vertical structure of M2 suspended sediment concentration (SSC) component (c2) over a tidal period under four different values of phase angle of tidally varying sediment diffusivity (
$ \theta $ ) in case of scenario (ii),$ \partial \rho /\partial x=1\times {10}^{-3}\; {\rm{kg}}/{{\rm{m}}}^{4},\;{U}_{0}=0 $ . Panels a, b, c and d show results for$ \theta =0, \; \theta =0.5\pi ,\;\theta =\pi \;\mathrm{and}\;\theta =1.5\pi $ , respectively.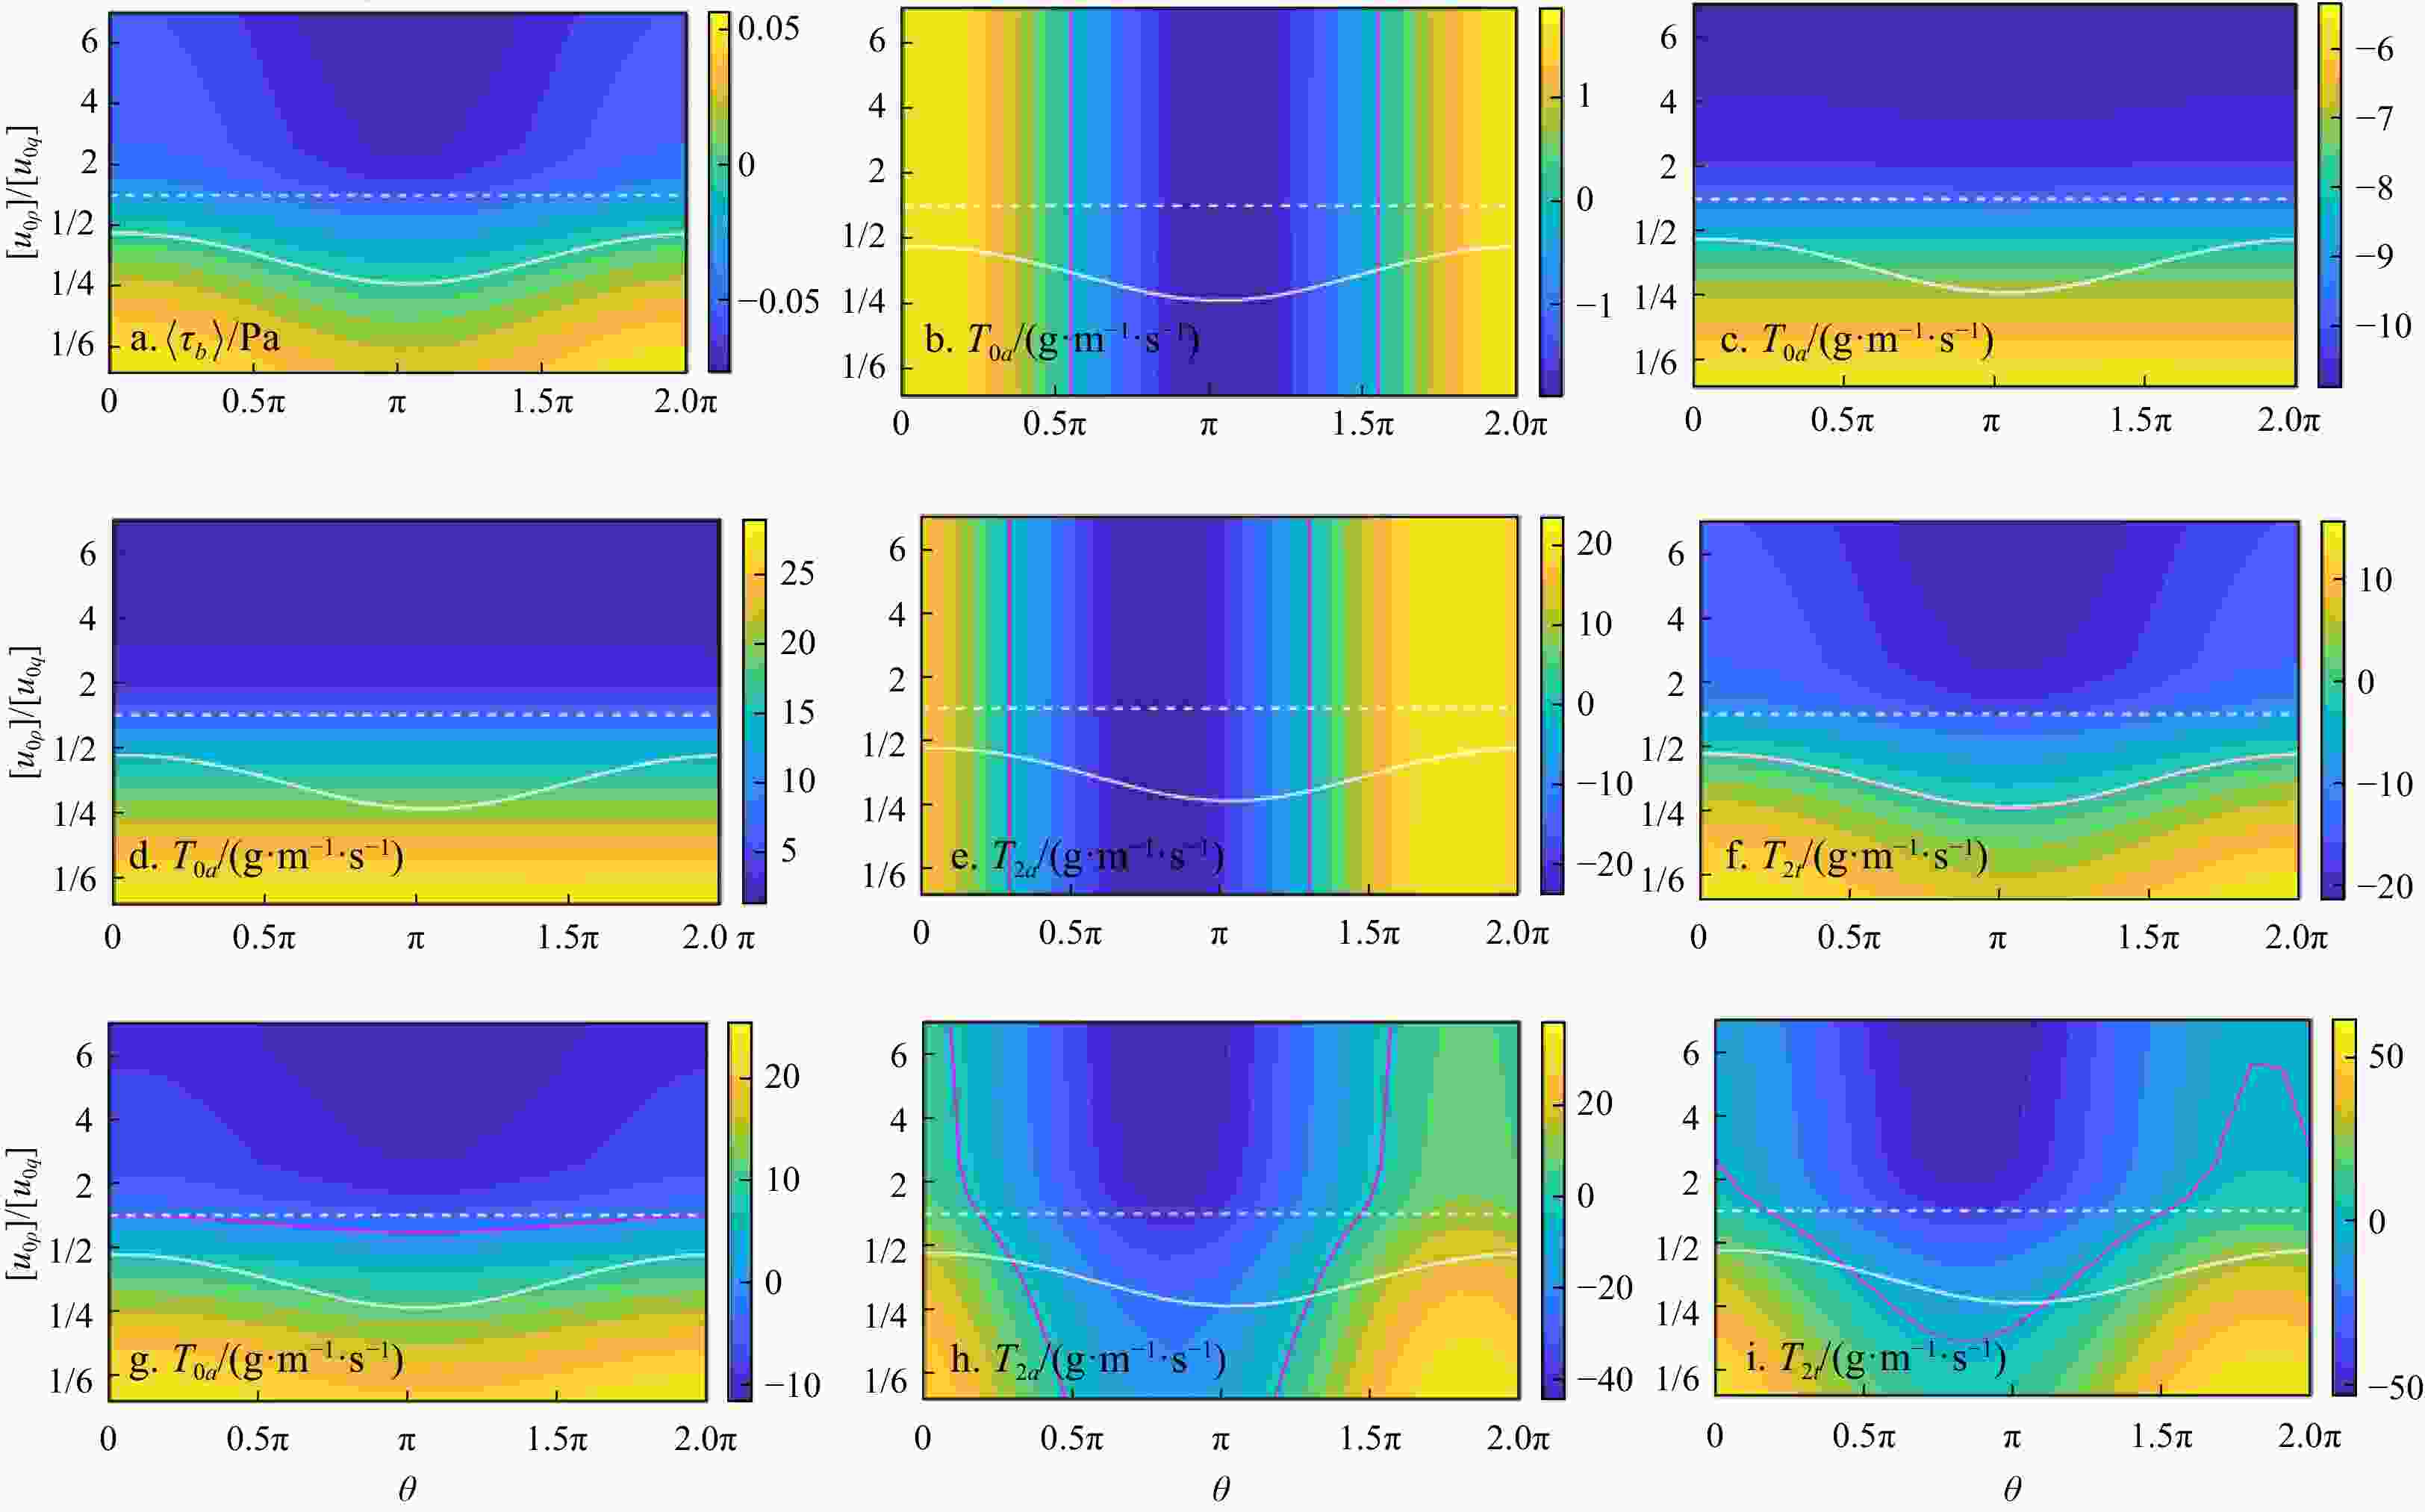
Figure 9. Tidally mean near bottom shear stress
$ \left\langle{{\tau }_{b}}\right\rangle $ (a) and sediment flux (b–i) as a function of$ \theta $ and$ \gamma =\left[{u}_{0\rho }\right]/\left[{u}_{0q}\right] $ . The dashed white line indicates a ratio$ \gamma =1 $ . The solid white line indicates the value$ \gamma $ for which the average shear stress$ \left\langle{{\tau }_{b}}\right\rangle=0 $ . The solid red line in panel b–i indicates values of$ \gamma $ for which the sediment flux is zero. The remaining boundary conditions can be found in Table 1.Table 1. Assumptions of the one-dimensional analytical model
Assumption Explanation $ \dfrac{\eta }{H}=O\left(\varepsilon\right) $ water level fluctuation is an order of magnitude smaller than water depth $ \left(\dfrac{U_0}{U_2},\dfrac{U_d}{U_2},\dfrac{U_q}{U_2}\right)=O\left(\varepsilon\right) $ residual currents are an order of magnitude smaller than tidal currents $ \left(\dfrac{A}{\omega H^2},\dfrac{K}{\omega H^2}\right)=O\left(1\right) $ frictional force can affect the whole water column $ \left(\dfrac{A_2}{A_0},\dfrac{K_2}{K_0}\right)=O\left(\varepsilon\right) $ the fluctuating component of eddy viscosity (diffusivity) is an order of magnitude smaller than the mean component $ \dfrac{w_s}{\omega H}=O\left(1\right) $ length scale of sediment settling during a tidal cycle is comparable to water depth Note: Here, $ \left({U}_{0},{U}_{2}\right) $ represent typical values of the mean velocity and M2 tidal velocity, respectively. The parameters ${U}_{d}=g{H}^{3} \Big(\dfrac{\partial \rho }{\partial x}\Big)/ \left(48\rho A\right)$ and $ {U}_{q}=2q/\left(3H\right) $ are the typical velocity scales for residual currents driven by an along-estuary density gradient and fresh water discharge. The parameter $ \varepsilon \ll 1 $ indicates the magnitude of the difference to higher-order physical components.  下载: 导出CSV
Table 2. Definition of symbols used in the model description
Symbol Definition Symbol Definition $ \omega $ M2 tidal frequency $ {w}_{s} $ settling velocity $ P $ M2 tidal period $ c $ SSC $ Ri $ Richardson number $ {c}_{0} $ tidally mean SSC (dominant order) $ s $ partially slip parameter $ {c}_{4} $ M4 component SSC (dominant order) $ \partial {\rho }/\partial {x} $ along-estuary density gradient $ {c}_{2} $ M2 component SSC (first order) $ {{q}}_{0} $ fresh water discharge $ {c}_{2t} $ bottom shear stress induced $ {c}_{2} $ $ {{q}}_{2} $ M2 tidal discharge $ {c}_{2a} $ ATM induced $ {c}_{2} $ $ {u} $ along-estuary velocity $ {c}_{a} $ reference concentration $ {{u}}_{2} $ M2 tidal velocity (dominant order) ($ A $, $ K $) eddy viscosity and eddy diffusivity $ {{u}}_{0} $ tidally mean velocity (first order) ($ {A}_{0} $, $ {K}_{0} $) tidally mean component of A and K $ {{u}}_{0{a}} $ ATM induced u0 ($ {A}_{2} $, $ {K}_{2} $) M2 component of A and K $ {{u}}_{0{\rho }} $ $ \partial \rho /\partial x $ induced $ {u}_{0} $ ($ \left|{A}_{2}\right| $, $ \left|{K}_{2}\right| $) amplitude of A2 and K2 $ {{u}}_{0{q}} $ fresh water discharge induced u0 $ \theta $ phase of A2 or K2 Note: ATM: asymmetric tidal mixing; SSC: suspended sediment concentration.
下载: 导出CSV
Table 3. Model input parameter values representative for a point in the York River Estuary, USA during April 1999 (referenced from Scully and Friedrichs (2003, 2007))
Quantity Symbol Value Water depth H 7.0 m Amplitude of tidal velocity U2 0.6 m/s Depth mean velocity U0 0.045 m/s Angular M2 tidal frequency $ \omega $ 1.4 × 10⁻⁴ s−1 Gravitational acceleration g 9.81 m/s2 Reference density $ {\rho }_{0} $ 1 020 kg/m3 *Bed to surface density difference $ \Delta \rho $ 2.0 kg/m3 *Along-channel density gradient $ \partial \rho /\partial x $ 8.6 × 10⁻⁴ kg/m4 *Threshold bed shear stress $ {\tau }_{c} $ 0.002 kg/(m·s2) *Settling velocity ws 0.6 mm/s *Ratio of $ \left|{K}_{2}\right|/{K}_{0} $ or $ \left|{A}_{2}\right|/{A}_{0} $ $ \alpha $ 0.3 *Phase lag of $ {K}_{2} $ or $ {A}_{2} $ $ \theta $ $ 1.4\pi $ Note: The stars mark the parameters deduced from the above references and were modified during model validation.
下载: 导出CSV
-
Burchard H, Hetland R D. 2010. Quantifying the contributions of tidal straining and gravitational circulation to residual circulation in periodically stratified tidal estuaries. Journal of Physical Oceanography, 40(6): 1243–1262. doi: 10.1175/2010JPO4270.1 Burchard H, Schuttelaars H M, Ralston D K. 2018. Sediment trapping in estuaries. Annual Review of Marine Science, 10: 371–395. doi: 10.1146/annurev-marine-010816-060535 Chen Wei, De Swart H E. 2018. Estuarine residual flow induced by eddy viscosity-shear covariance: Dependence on axial bottom slope, tidal intensity and constituents. Continental Shelf Research, 167: 1–13. doi: 10.1016/j.csr.2018.07.011 Cheng Peng, De Swart H E, Valle-Levinson A. 2013. Role of asymmetric tidal mixing in the subtidal dynamics of narrow estuaries. Journal of Geophysical Research: Oceans, 118(5): 2623–2639. doi: 10.1002/jgrc.20189 Cheng Peng, Mao Jianshan, Yu Fengling, et al. 2019. A numerical study of residual flow induced by eddy viscosity-shear covariance in a tidally energetic estuary. Estuarine, Coastal and Shelf Science, 230: 106446 Cheng Peng, Valle-Levinson A, De Swart H E. 2010. Residual currents induced by asymmetric tidal mixing in weakly stratified narrow estuaries. Journal of Physical Oceanography, 40(9): 2135–2147. doi: 10.1175/2010JPO4314.1 Cheng Peng, Valle-Levinson A, De Swart H E. 2011. A numerical study of residual circulation induced by asymmetric tidal mixing in tidally dominated estuaries. Journal of Geophysical Research: Oceans, 116(C1): C01017 Cheng Peng, Wilson R E. 2008. Modeling sediment suspensions in an idealized tidal embayment: Importance of tidal asymmetry and settling lag. Estuaries and Coasts, 31(5): 828–842. doi: 10.1007/s12237-008-9081-4 Cheng Peng, Yu Fengling, Chen Nengwang, et al. 2020. Observational study of tidal mixing asymmetry and eddy viscosity-shear covariance−induced residual flow in the Jiulong River estuary. Continental Shelf Research, 193: 104035. doi: 10.1016/j.csr.2019.104035 Chernetsky A S, Schuttelaars H M, Talke S A. 2010. The effect of tidal asymmetry and temporal settling lag on sediment trapping in tidal estuaries. Ocean Dynamics, 60(5): 1219–1241. doi: 10.1007/s10236-010-0329-8 Dijkstra Y M, Schuttelaars H M, Burchard H. 2017. Generation of exchange flows in estuaries by tidal and gravitational eddy viscosity-shear covariance (ESCO). Journal of Geophysical Research: Oceans, 122(5): 4217–4237. doi: 10.1002/2016JC012379 Dijkstra Y M, Schuttelaars H M, Schramkowski G P, et al. 2019. Modeling the transition to high sediment concentrations as a response to channel deepening in the Ems River Estuary. Journal of Geophysical Research: Oceans, 124(3): 1578–1594. doi: 10.1029/2018JC014367 Dyer K R. 1997. Estuaries: A Physical Introduction. 2nd ed. Chichester: John Wiley and Sons, 22–29 Fram J P, Martin M A, Stacey M T. 2007. Dispersive fluxes between the coastal ocean and a semienclosed estuarine basin. Journal of Physical Oceanography, 37(6): 1645–1660. doi: 10.1175/JPO3078.1 Friedrichs C T, Aubrey D G. 1994. Tidal propagation in strongly convergent channels. Journal of Geophysical Research: Oceans, 99(C2): 3321–3336. doi: 10.1029/93JC03219 Friedrichs C T, Hamrick J M. 1996. Effects of channel geometry on cross sectional variations in along channel velocity in partially stratified estuaries. In: Aubrey D G, Friedrichs C T, eds. Buoyancy Effects on Coastal and Estuarine Dynamics. Washington, D.C: American Geophysical Union, 53: 283–300 Fugate D C, Friedrichs C T, Sanford L P. 2007. Lateral dynamics and associated transport of sediment in the upper reaches of a partially mixed estuary, Chesapeake Bay, USA. Continental Shelf Research, 27(5): 679–698. doi: 10.1016/j.csr.2006.11.012 Geyer W R, MacCready P. 2014. The estuarine circulation. Annual Review of Fluid Mechanics, 46: 175–197. doi: 10.1146/annurev-fluid-010313-141302 Geyer W R, Scully M E, Ralston D K. 2008. Quantifying vertical mixing in estuaries. Environmental Fluid Mechanics, 8(5−6): 495–509. doi: 10.1007/s10652-008-9107-2 Geyer W R, Signell R P, Kineke G C. 1997. Lateral trapping of sediment in partially mixed estuary. In: Dronker J, Scheffers M, eds. Physics of Estuaries and Coastal Seas. The Hague, 115–124 Huijts K M H, Schuttelaars H M, De Swart H E, et al. 2006. Lateral entrapment of sediment in tidal estuaries: An idealized model study. Journal of Geophysical Research: Oceans, 111(C12): C12016. doi: 10.1029/2006JC003615 Huijts K M H, Schuttelaars H M, De Swart H E, et al. 2009. Analytical study of the transverse distribution of along-channel and transverse residual flows in tidal estuaries. Continental Shelf Research, 29(1): 89–100. doi: 10.1016/j.csr.2007.09.007 Jay D A, Musiak J D. 1994. Particle trapping in estuarine tidal flows. Journal of Geophysical Research: Oceans, 99(C10): 20445–20461. doi: 10.1029/94JC00971 Jiang Chenjuan, De Swart H E, Li Jiufa, et al. 2013. Mechanisms of along-channel sediment transport in the North Passage of the Yangtze Estuary and their response to large-scale interventions. Ocean Dynamics, 63(2): 283–305 Lacy J R, Monismith S G. 2001. Secondary currents in a curved, stratified, estuarine channel. Journal of Geophysical Research: Oceans, 106(C12): 31283–31302. doi: 10.1029/2000JC000606 Li Xiangyu, Geyer W R, Zhu Jianrong, et al. 2018. The transformation of salinity variance: A new approach to quantifying the influence of straining and mixing on estuarine stratification. Journal of Physical Oceanography, 48(3): 607–623. doi: 10.1175/JPO-D-17-0189.1 Li Lu, Wu Hui, Liu Jame T., et al 2015. Sediment transport induced by the advection of a moving salt wedge in the Changjiang Estuary. Journal of Coastal Research, 31(3): 671–679 Lin Jing, Kuo A Y. 2001. Secondary turbidity maximum in a partially mixed microtidal estuary. Estuaries, 24(5): 707–720. doi: 10.2307/1352879 Luan Hualong, Ding Pingxing, Wang Zhengbing, et al. 2017. Process-based morphodynamic modeling of the Yangtze Estuary at a decadal timescale: Controls on estuarine evolution and future trends. Geomorphology, 290: 347–364. doi: 10.1016/j.geomorph.2017.04.016 Manning A J, Bass S J. 2006. Variability in cohesive sediment settling fluxes: Observations under different estuarine tidal conditions. Marine Geology, 235(1−4): 177–192. doi: 10.1016/j.margeo.2006.10.013 Munk W H, Anderson E R. 1948. Notes on a theory of the thermocline. Journal of Marine Research, 7(3): 276–295 Scully M E, Friedrichs C T. 2003. The influence of asymmetries in overlying stratification on near-bed turbulence and sediment suspension in a partially mixed estuary. Ocean Dynamics, 53(3): 208–219. doi: 10.1007/s10236-003-0034-y Scully M E, Friedrichs C T. 2007. Sediment pumping by tidal asymmetry in a partially mixed estuary. Journal of Geophysical Research: Oceans, 112(C7): C07028 Scully M E, Geyer W R. 2012. The role of advection, straining, and mixing on the tidal variability of estuarine stratification. Journal of Physical Oceanography, 42(5): 855–868. doi: 10.1175/JPO-D-10-05010.1 Simpson J H, Brown J, Matthews J, et al. 1990. Tidal straining, density currents, and stirring in the control of estuarine stratification. Estuaries, 13(2): 125–132. doi: 10.2307/1351581 Stacey M T, Brennan M L, Burau J R, et al. 2010. The tidally averaged momentum balance in a partially and periodically stratified estuary. Journal of Physical Oceanography, 40(11): 2418–2434. doi: 10.1175/2010JPO4389.1 Stacey M T, Fram J P, Chow F K. 2008. Role of tidally periodic density stratification in the creation of estuarine subtidal circulation. Journal of Geophysical Research: Oceans, 113(C8): C08016 Talke S A, De Swart H E, Schuttelaars H M. 2009. Feedback between residual circulations and sediment distribution in highly turbid estuaries: An analytical model. Continental Shelf Research, 29(1): 119–135. doi: 10.1016/j.csr.2007.09.002 Tessier E, Garnier C, Mullot J U, et al. 2011. Study of the spatial and historical distribution of sediment inorganic contamination in the Toulon Bay (France). Marine Pollution Bulletin, 62(10): 2075–2086. doi: 10.1016/j.marpolbul.2011.07.022 Uncles R J, Stephens J A, Law D J. 2006. Turbidity maximum in the macrotidal, highly turbid Humber Estuary, UK: Flocs, fluid mud, stationary suspensions and tidal bores. Estuarine, Coastal and Shelf Science, 67(1–2): 30–52 Wang Chenglong, Zhao Yifei, Zou Xinqing, et al. 2017. Recent changing patterns of the Changjiang (Yangtze River) Estuary caused by human activities. Acta Oceanologica Sinica, 36(4): 87–96. doi: 10.1007/s13131-017-1017-z Winterwerp J C. 2002. On the flocculation and settling velocity of estuarine mud. Continental Shelf Research, 22(9): 1339–1360. doi: 10.1016/S0278-4343(02)00010-9 Yang Zhongyong, De Swart H E, Cheng Heqin, et al. 2014. Modelling lateral entrapment of suspended sediment in estuaries: The role of spatial lags in settling and M4 tidal flow. Continental Shelf Research, 85: 126–142. doi: 10.1016/j.csr.2014.06.005 Yang Zhongyong, Wang Zhong, Cheng Heqin, et al. 2017. Analytical study of the sediment transport in the South Channel of Yangtze estuary, China. Haiyang Xuebao (in Chinese), 39(5): 22–32 Yu Qian, Flemming B W, Gao Shu. 2011. Tide-induced vertical suspended sediment concentration profiles: phase lag and amplitude attenuation. Ocean Dynamics, 61(4): 403–410. doi: 10.1007/s10236-010-0335-x -


 点击查看大图

计量
- 文章访问数: 319
- HTML全文浏览量: 155
- PDF下载量: 31
- 被引次数: 0

