

Prokaryotic diversity and community composition in the surface sediments of the Changjiang River Estuary in summer
-
Abstract: Microorganisms are fundamental for the functioning of marine ecosystems and are involved in the decomposition of organic matter, transformation of nutrients and circulation of biologically-important chemicals. Based on the complexity of the natural geographic characteristics of the Changjiang River Estuary, the geographic distribution of sedimentary microorganisms and the causes of this distribution are largely unexplored. In this work, the surface sediment samples from the adjacent sea area of the Changjiang River Estuary were collected. Their prokaryotic diversity was examined by high-throughput sequencing technology, and the environmental factors of the bacterial community were investigated. The results indicated that the distribution of prokaryotic communities in the sediments of the study areas showed obvious spatial heterogeneity. The sampling sequences divided the sample regions into three distinct clusters. Each geographic region had a unique community structure, although Proteobacteria, Bacteroidota, Desulfobacterota, Acidobacteriota, and Actinobacteriota all existed in these three branches. Canonical correspondence analysis demonstrated that prokaryotic diversity and community distribution were significantly correlated with the geographic location of sediment, seawater depth, and in particular, nutrient content (e.g., total phosphorus, total organic carbon and dissolved oxygen). Moreover, it was found for the first time that the metal ions obviously affected the composition and distribution of the prokaryotic community in this area. In general, this work provides new insights into the structural characteristics and driving factors of prokaryotic communities under the background of the ever-changing Changjiang River Estuary.
-
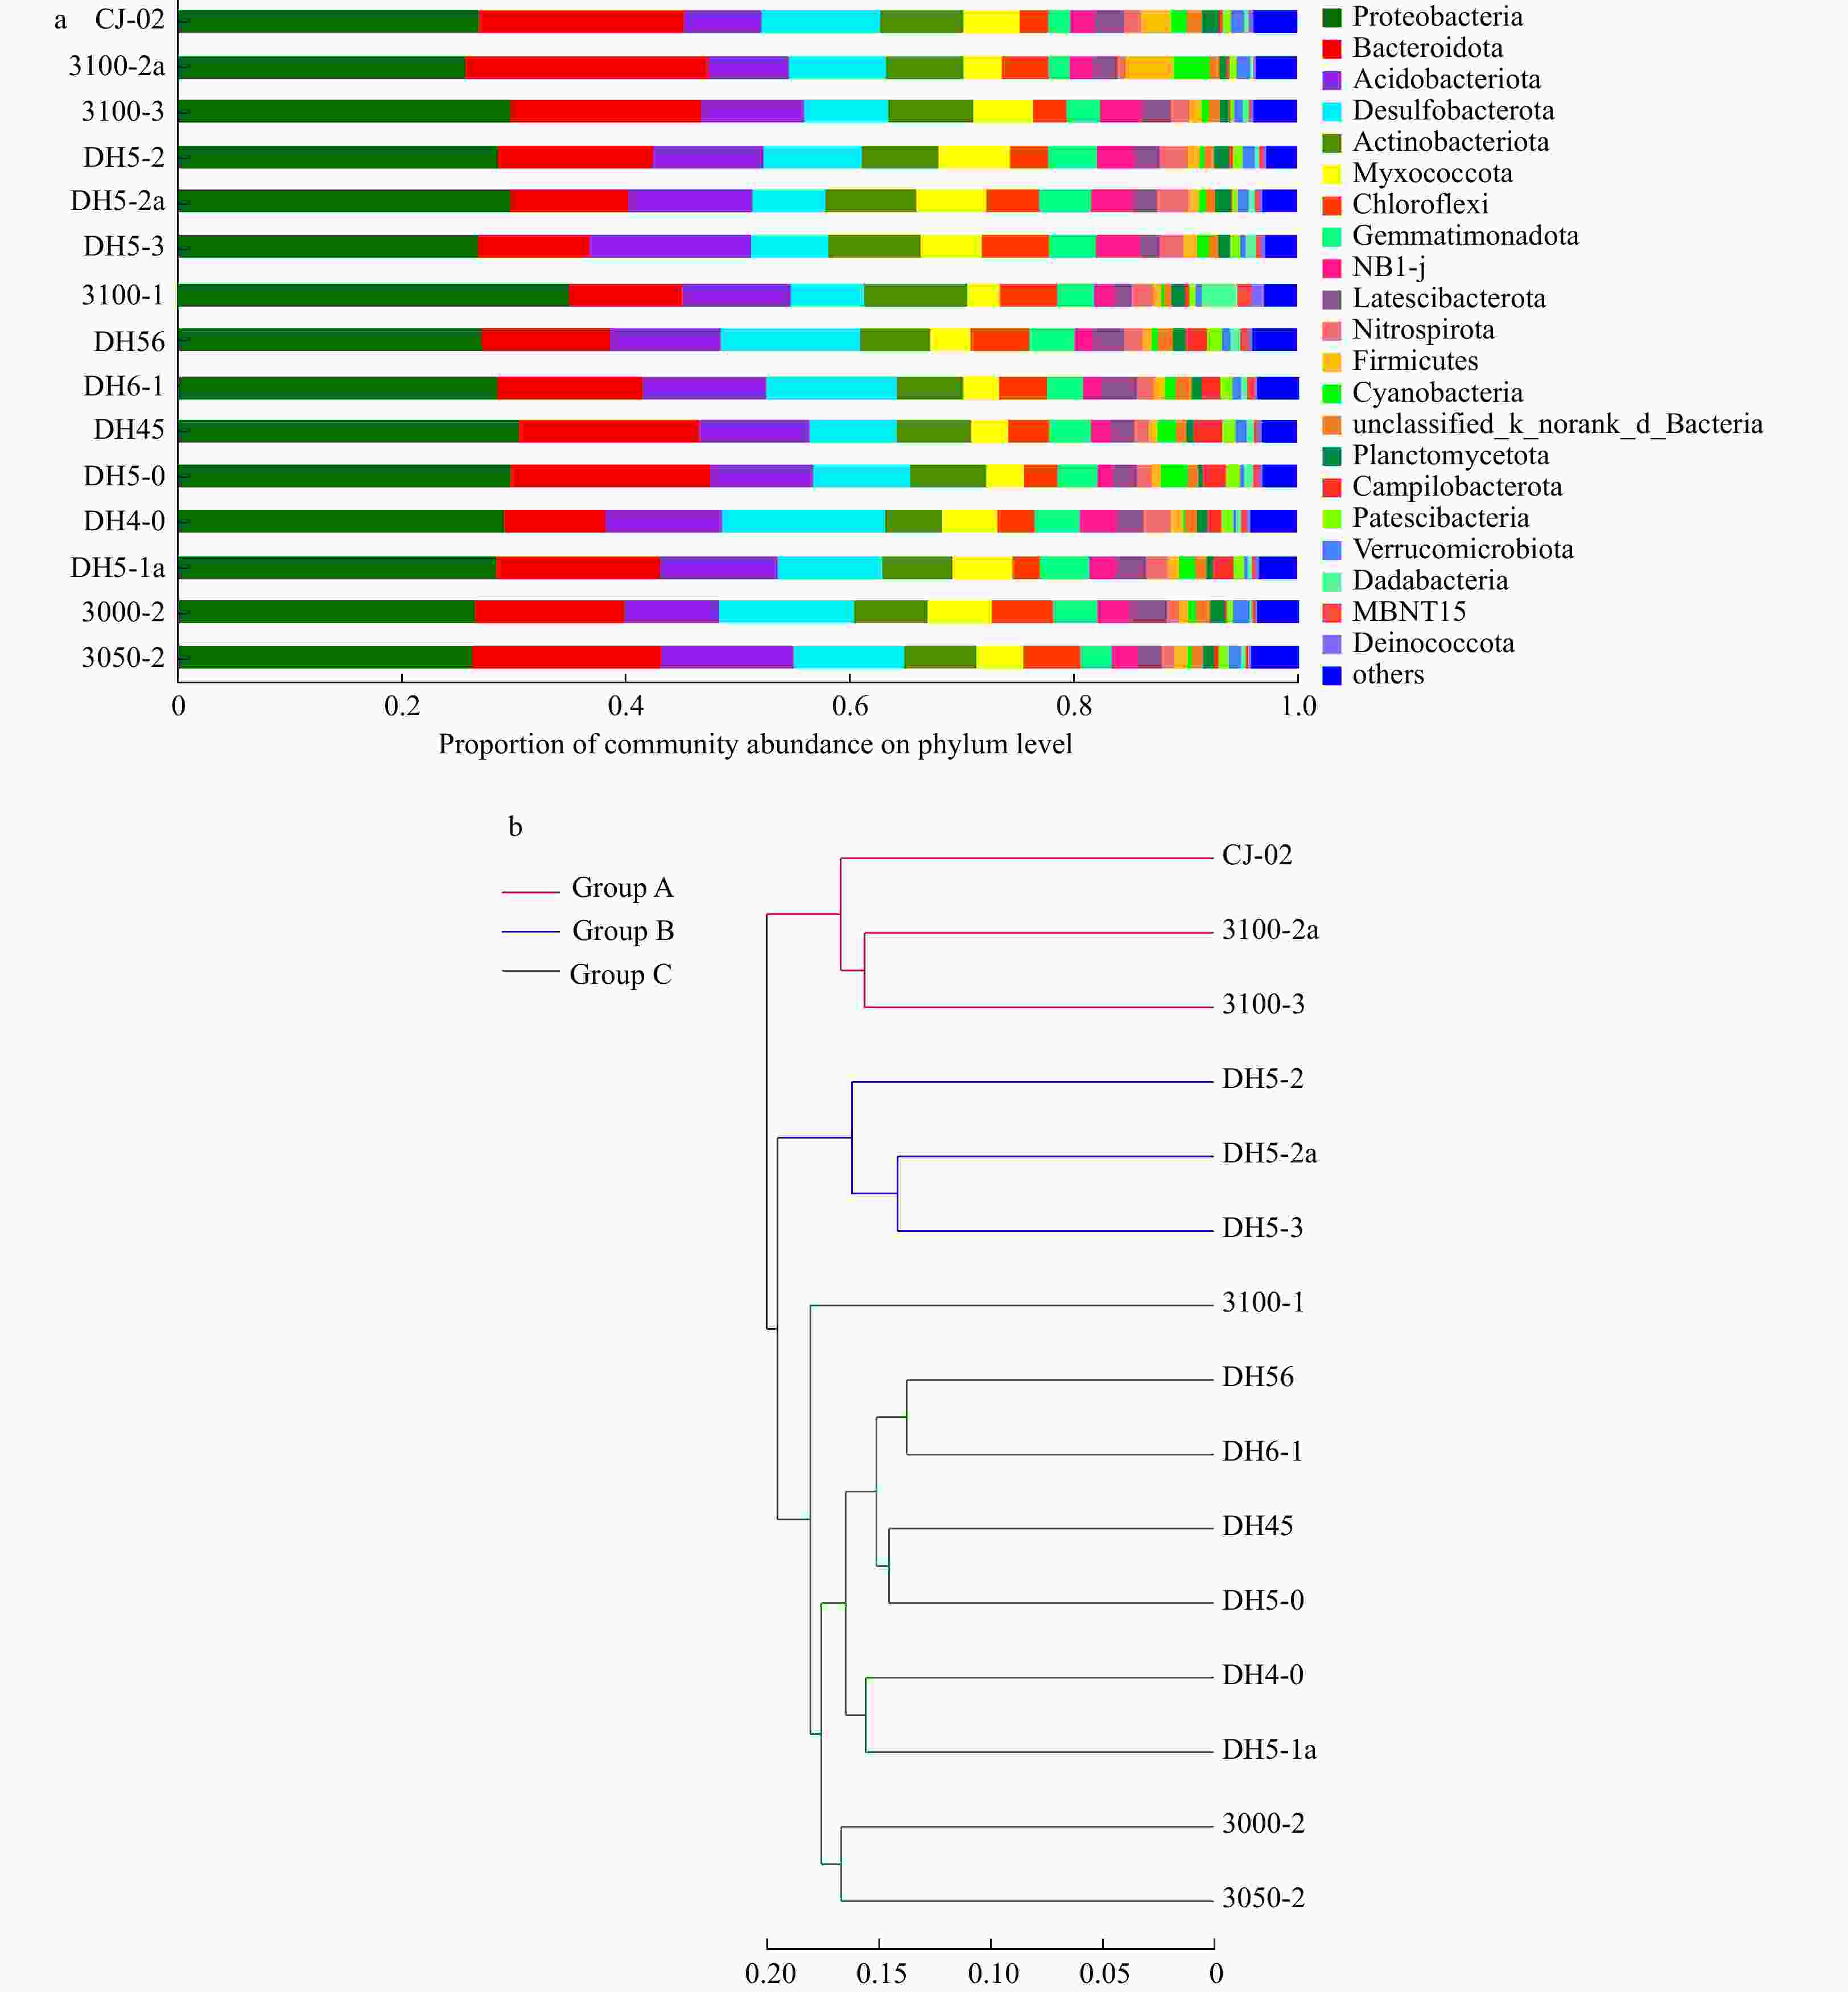
Figure 2. Clustering of surface sediment prokaryotic communities of sampling sites (a) and of each sample (b) by Unweighted Pair-group Method with Arithmetic Mean.
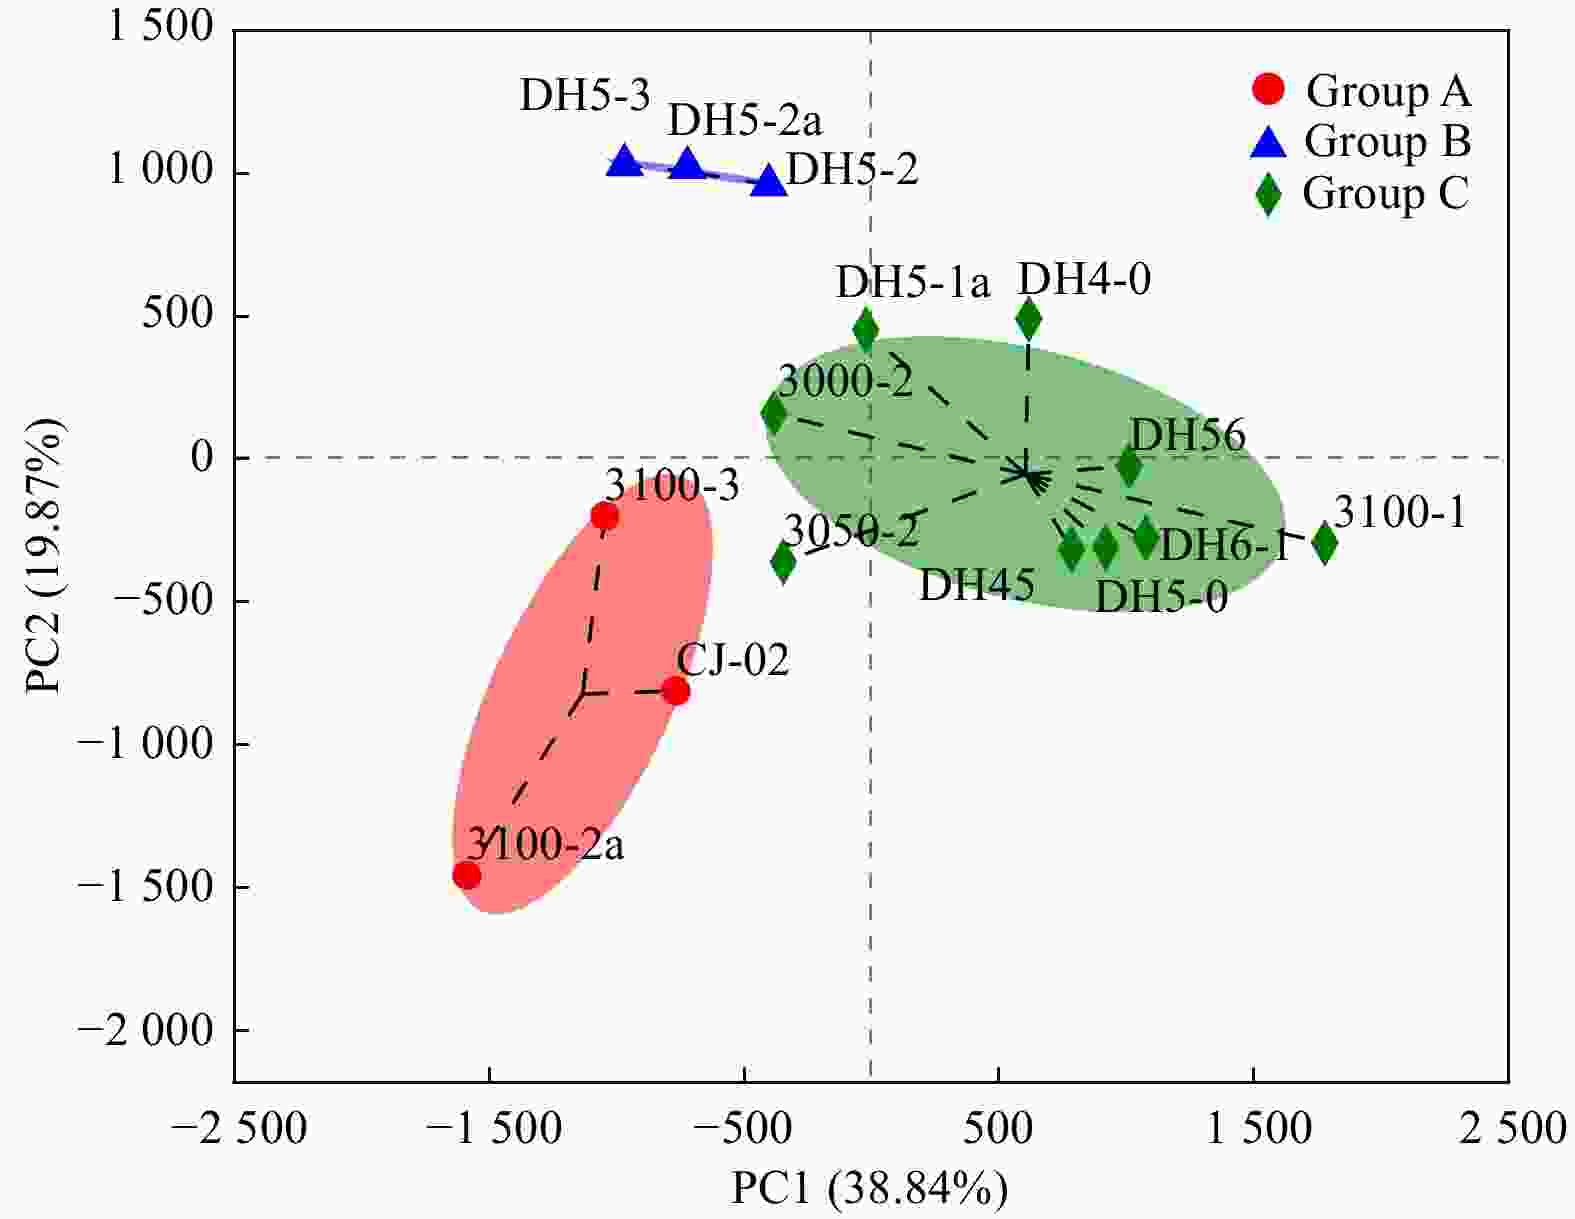
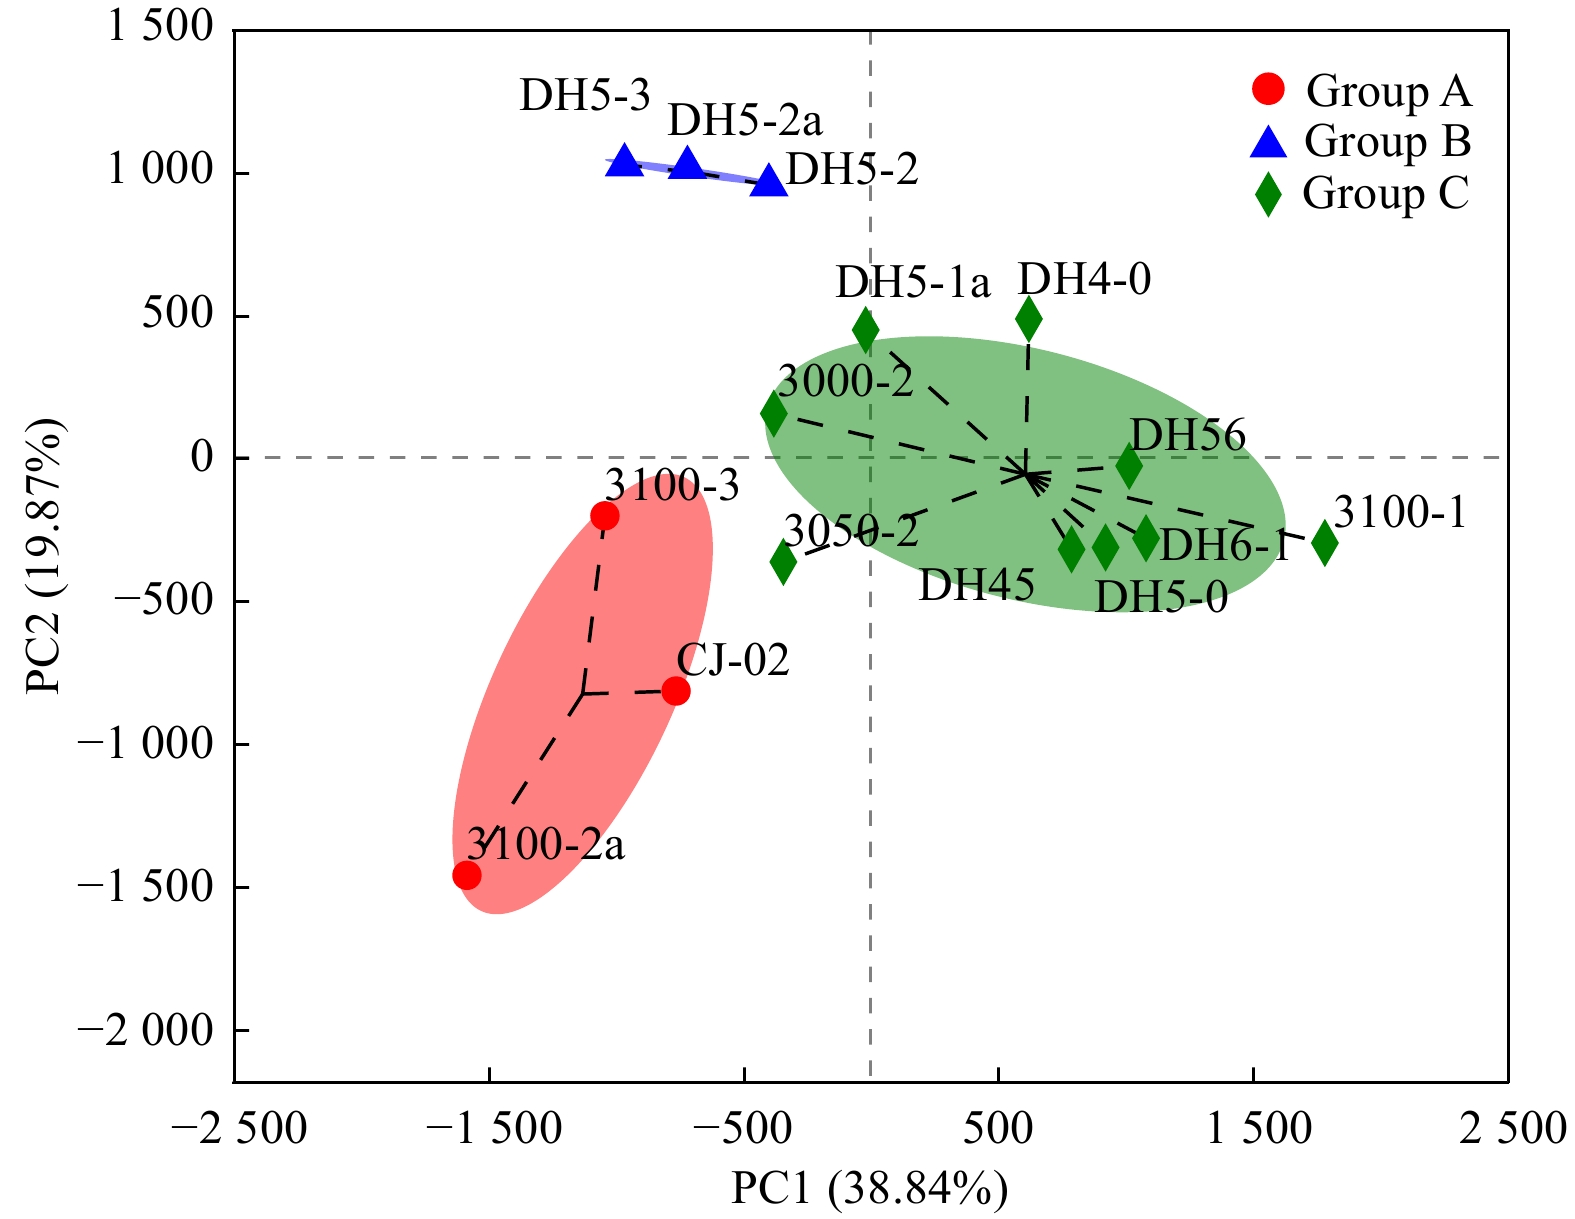
Figure 3. Principal coordinate analysis plots. The first principal coordinate (PC1) clearly separates the samples according to their collection positions, as indicated by the ovals around pooled samples from the same collection site.
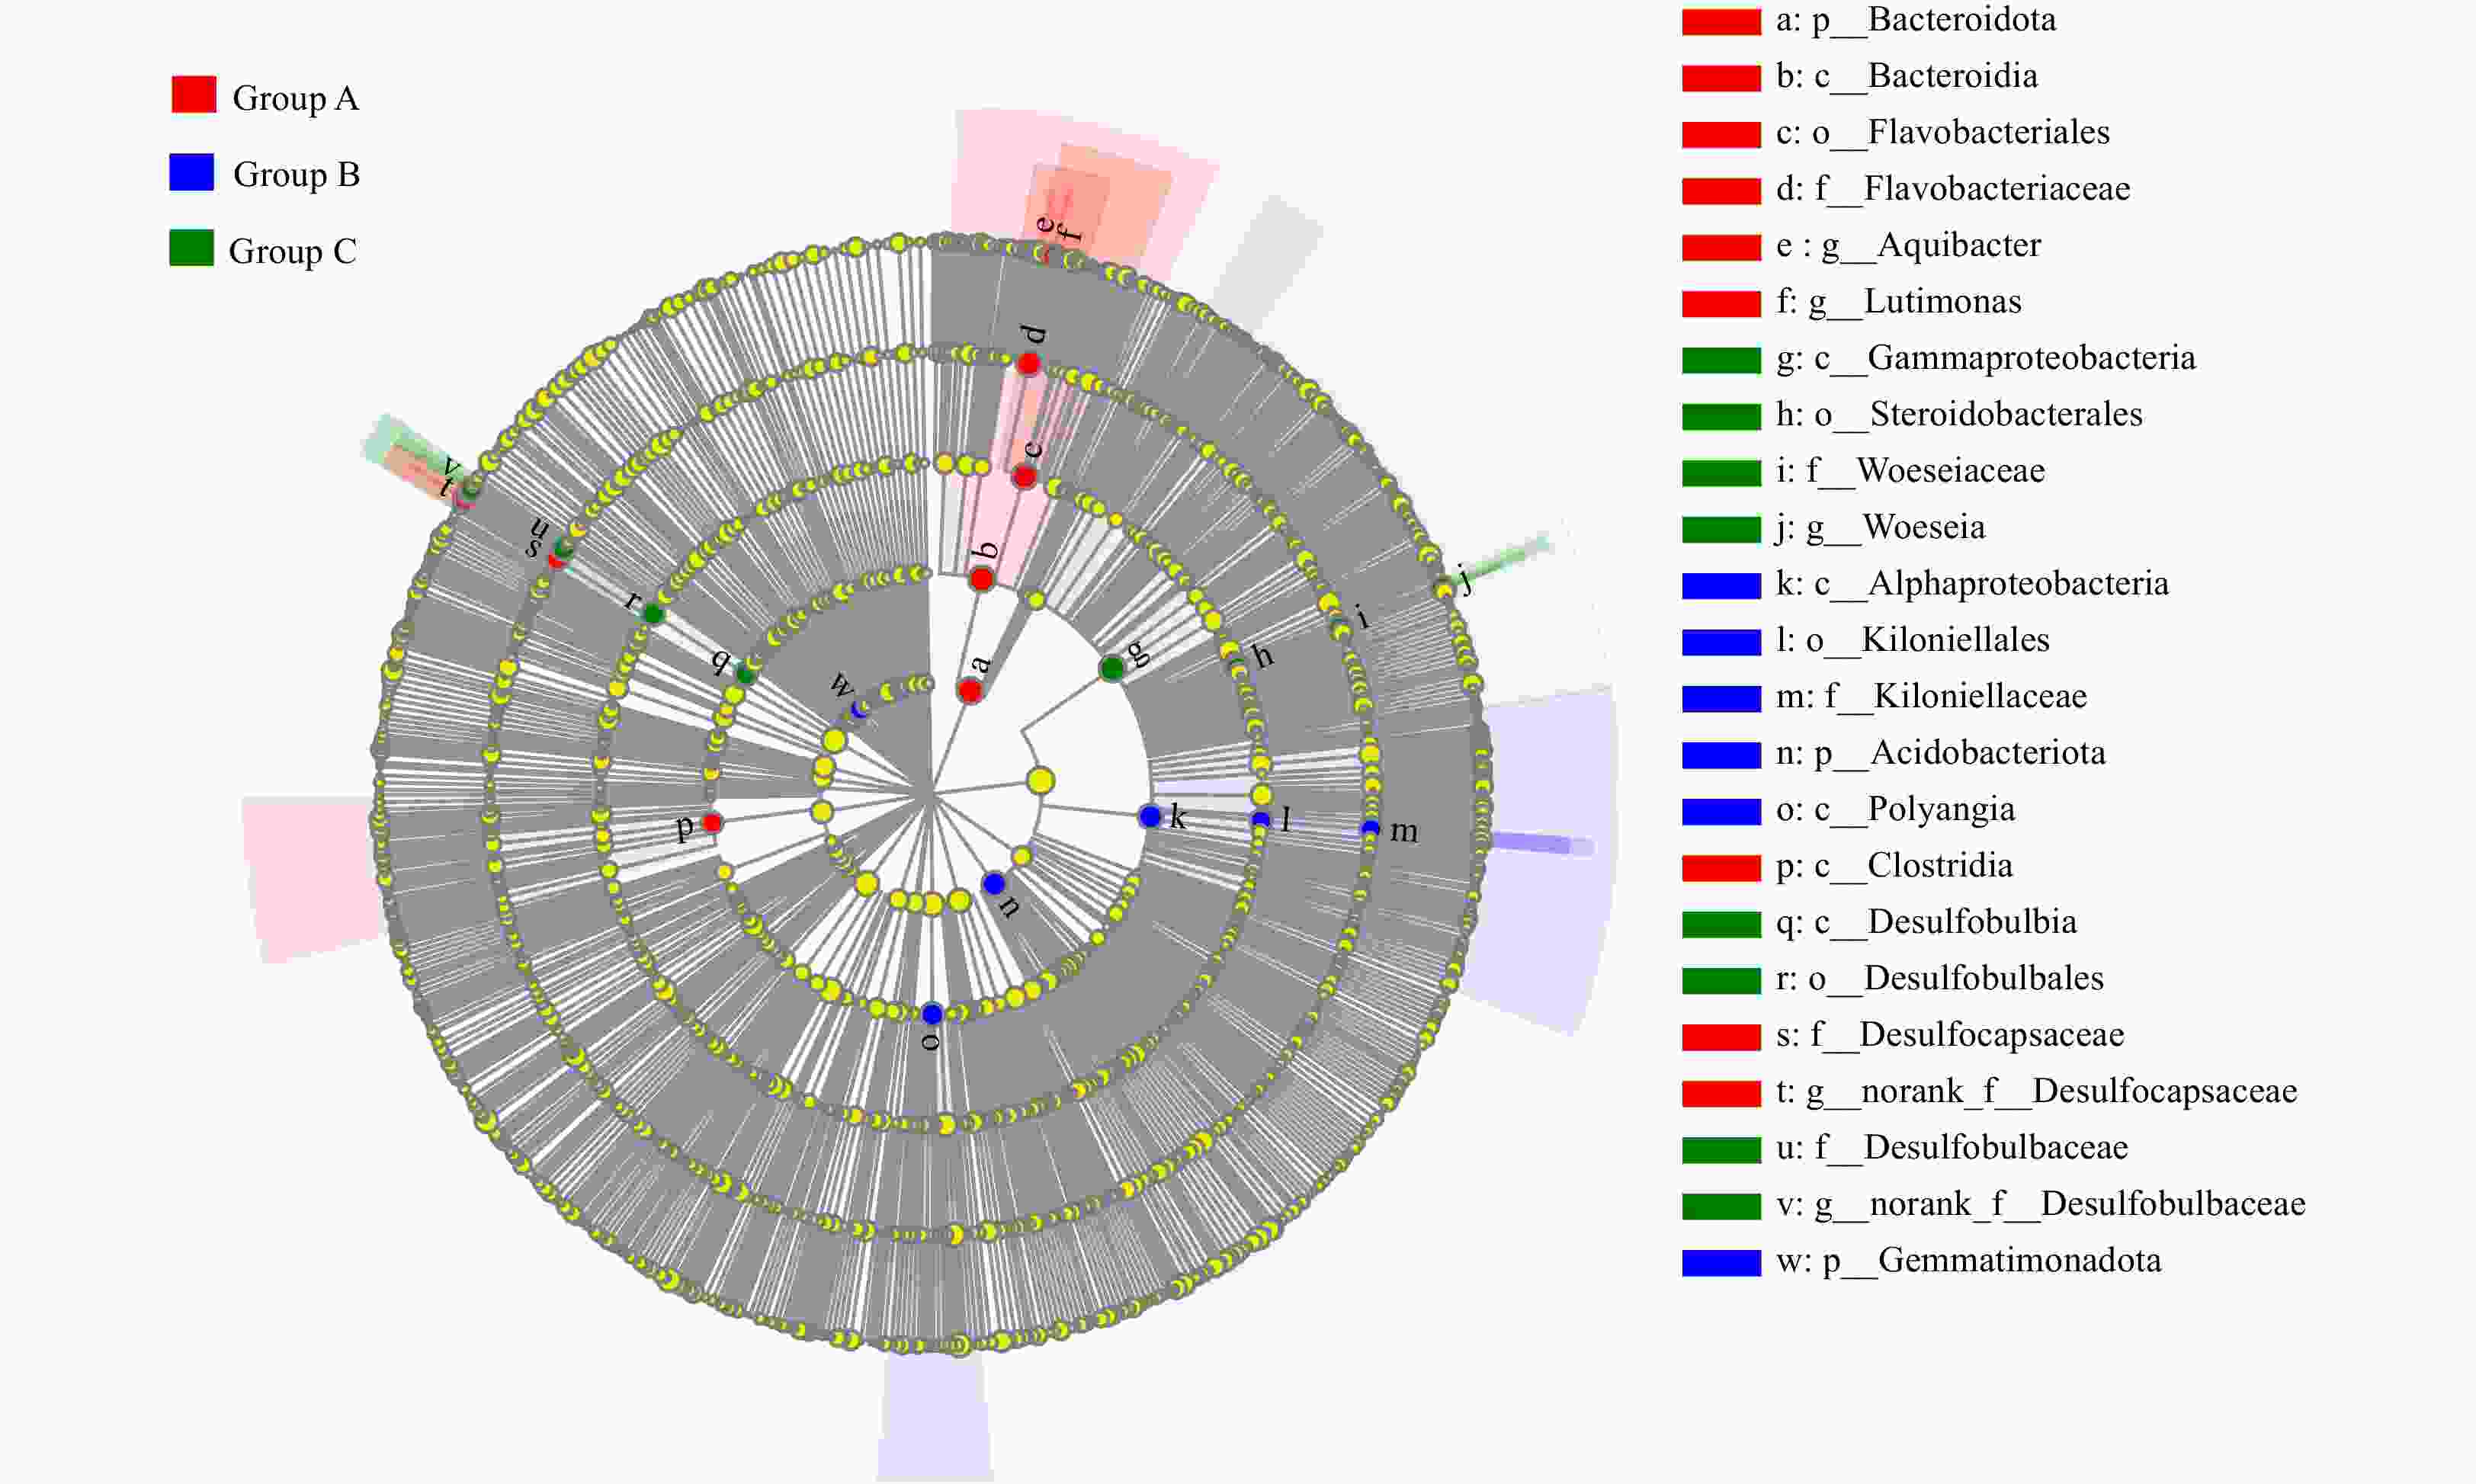
Figure 4. Identification of the distinct bacterial taxa from different sampling regions using LEfSe. Only bacterial taxa with linear discriminant analysis influence values greater than 4 are displayed in this cladogram. Differences in the most abundant taxa are represented by colors (red, blue, and green indicate Group A, Group B, and Group C, respectively). The diameter of each circle is proportional to the corresponding taxon’s abundance. Circles represent phylogenetic levels from phylum to genus. Labels are shown from phylum to genus level.
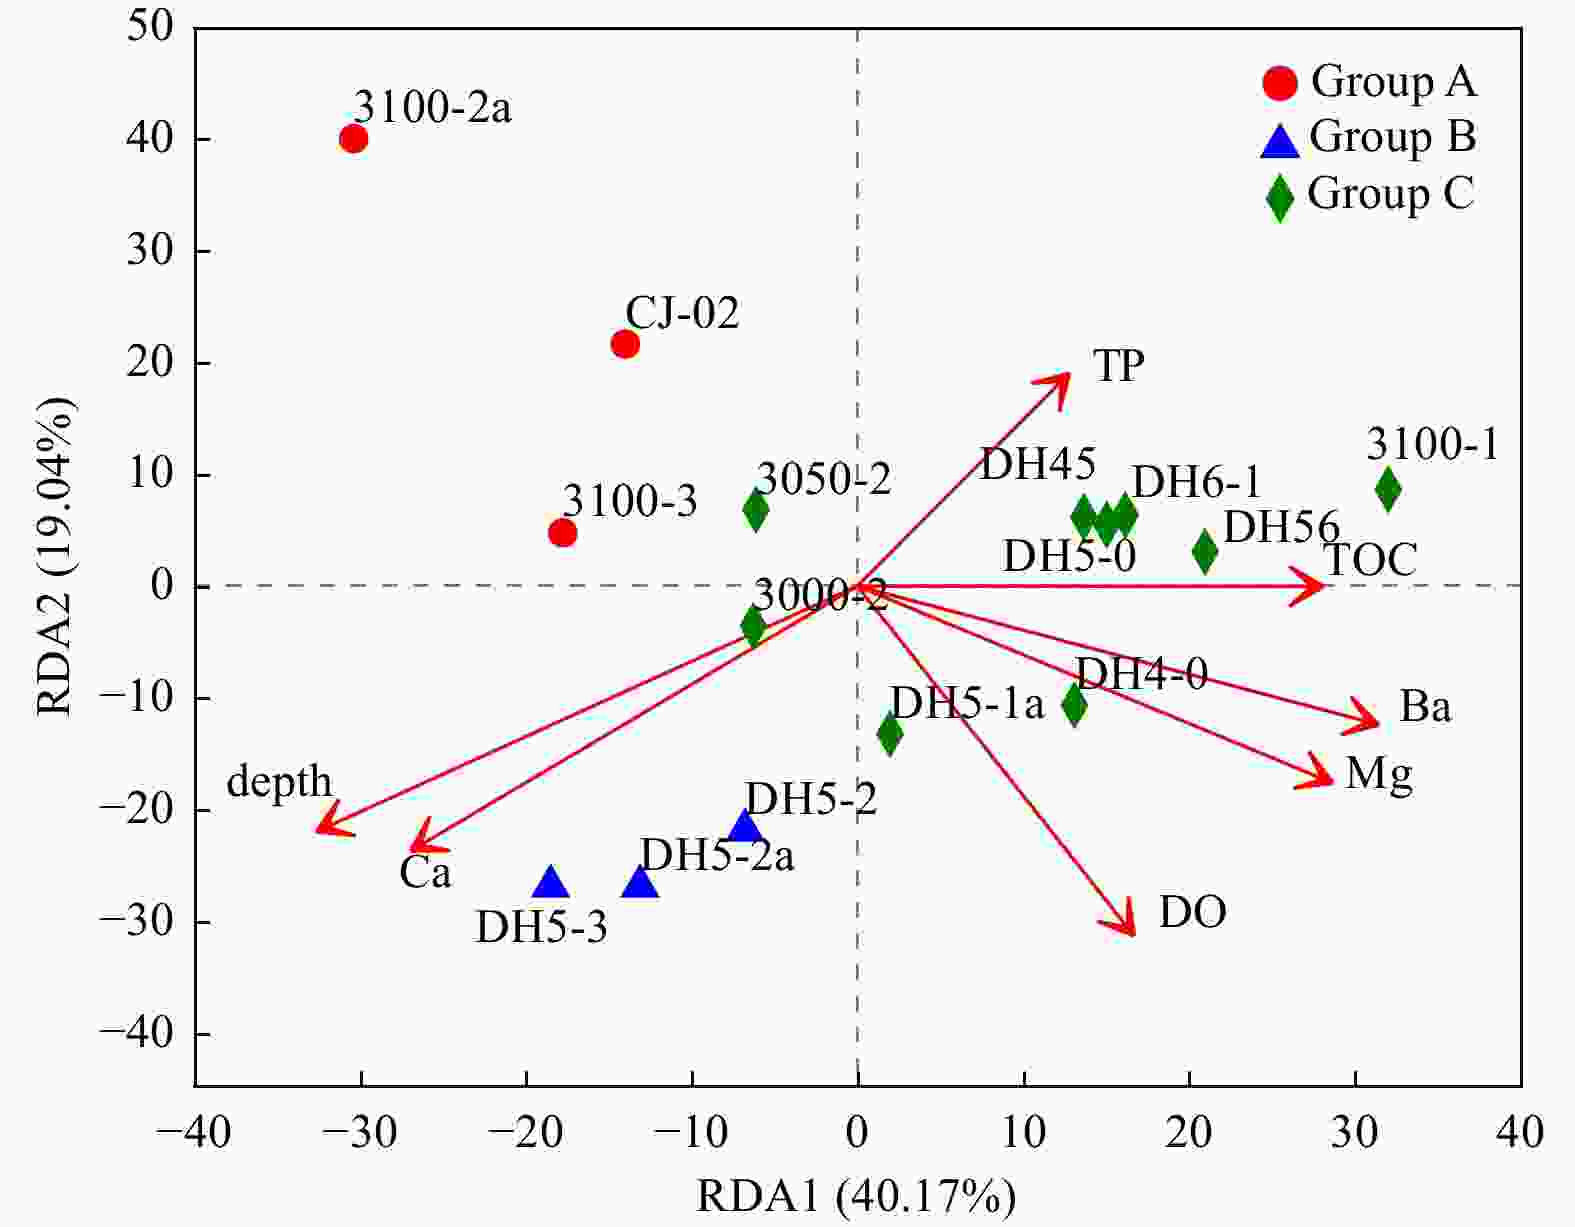
Figure 5. Canonical correspondence analysis diagram illustrating the relationships between the OTU-level community structures of different sampling sites. The angle between the arrow line and the sorting axis represents the correlation between a certain environmental factor and the sorting axis. The smaller angle represents the higher the correlation is, on the contrary, the lower the correlation is.
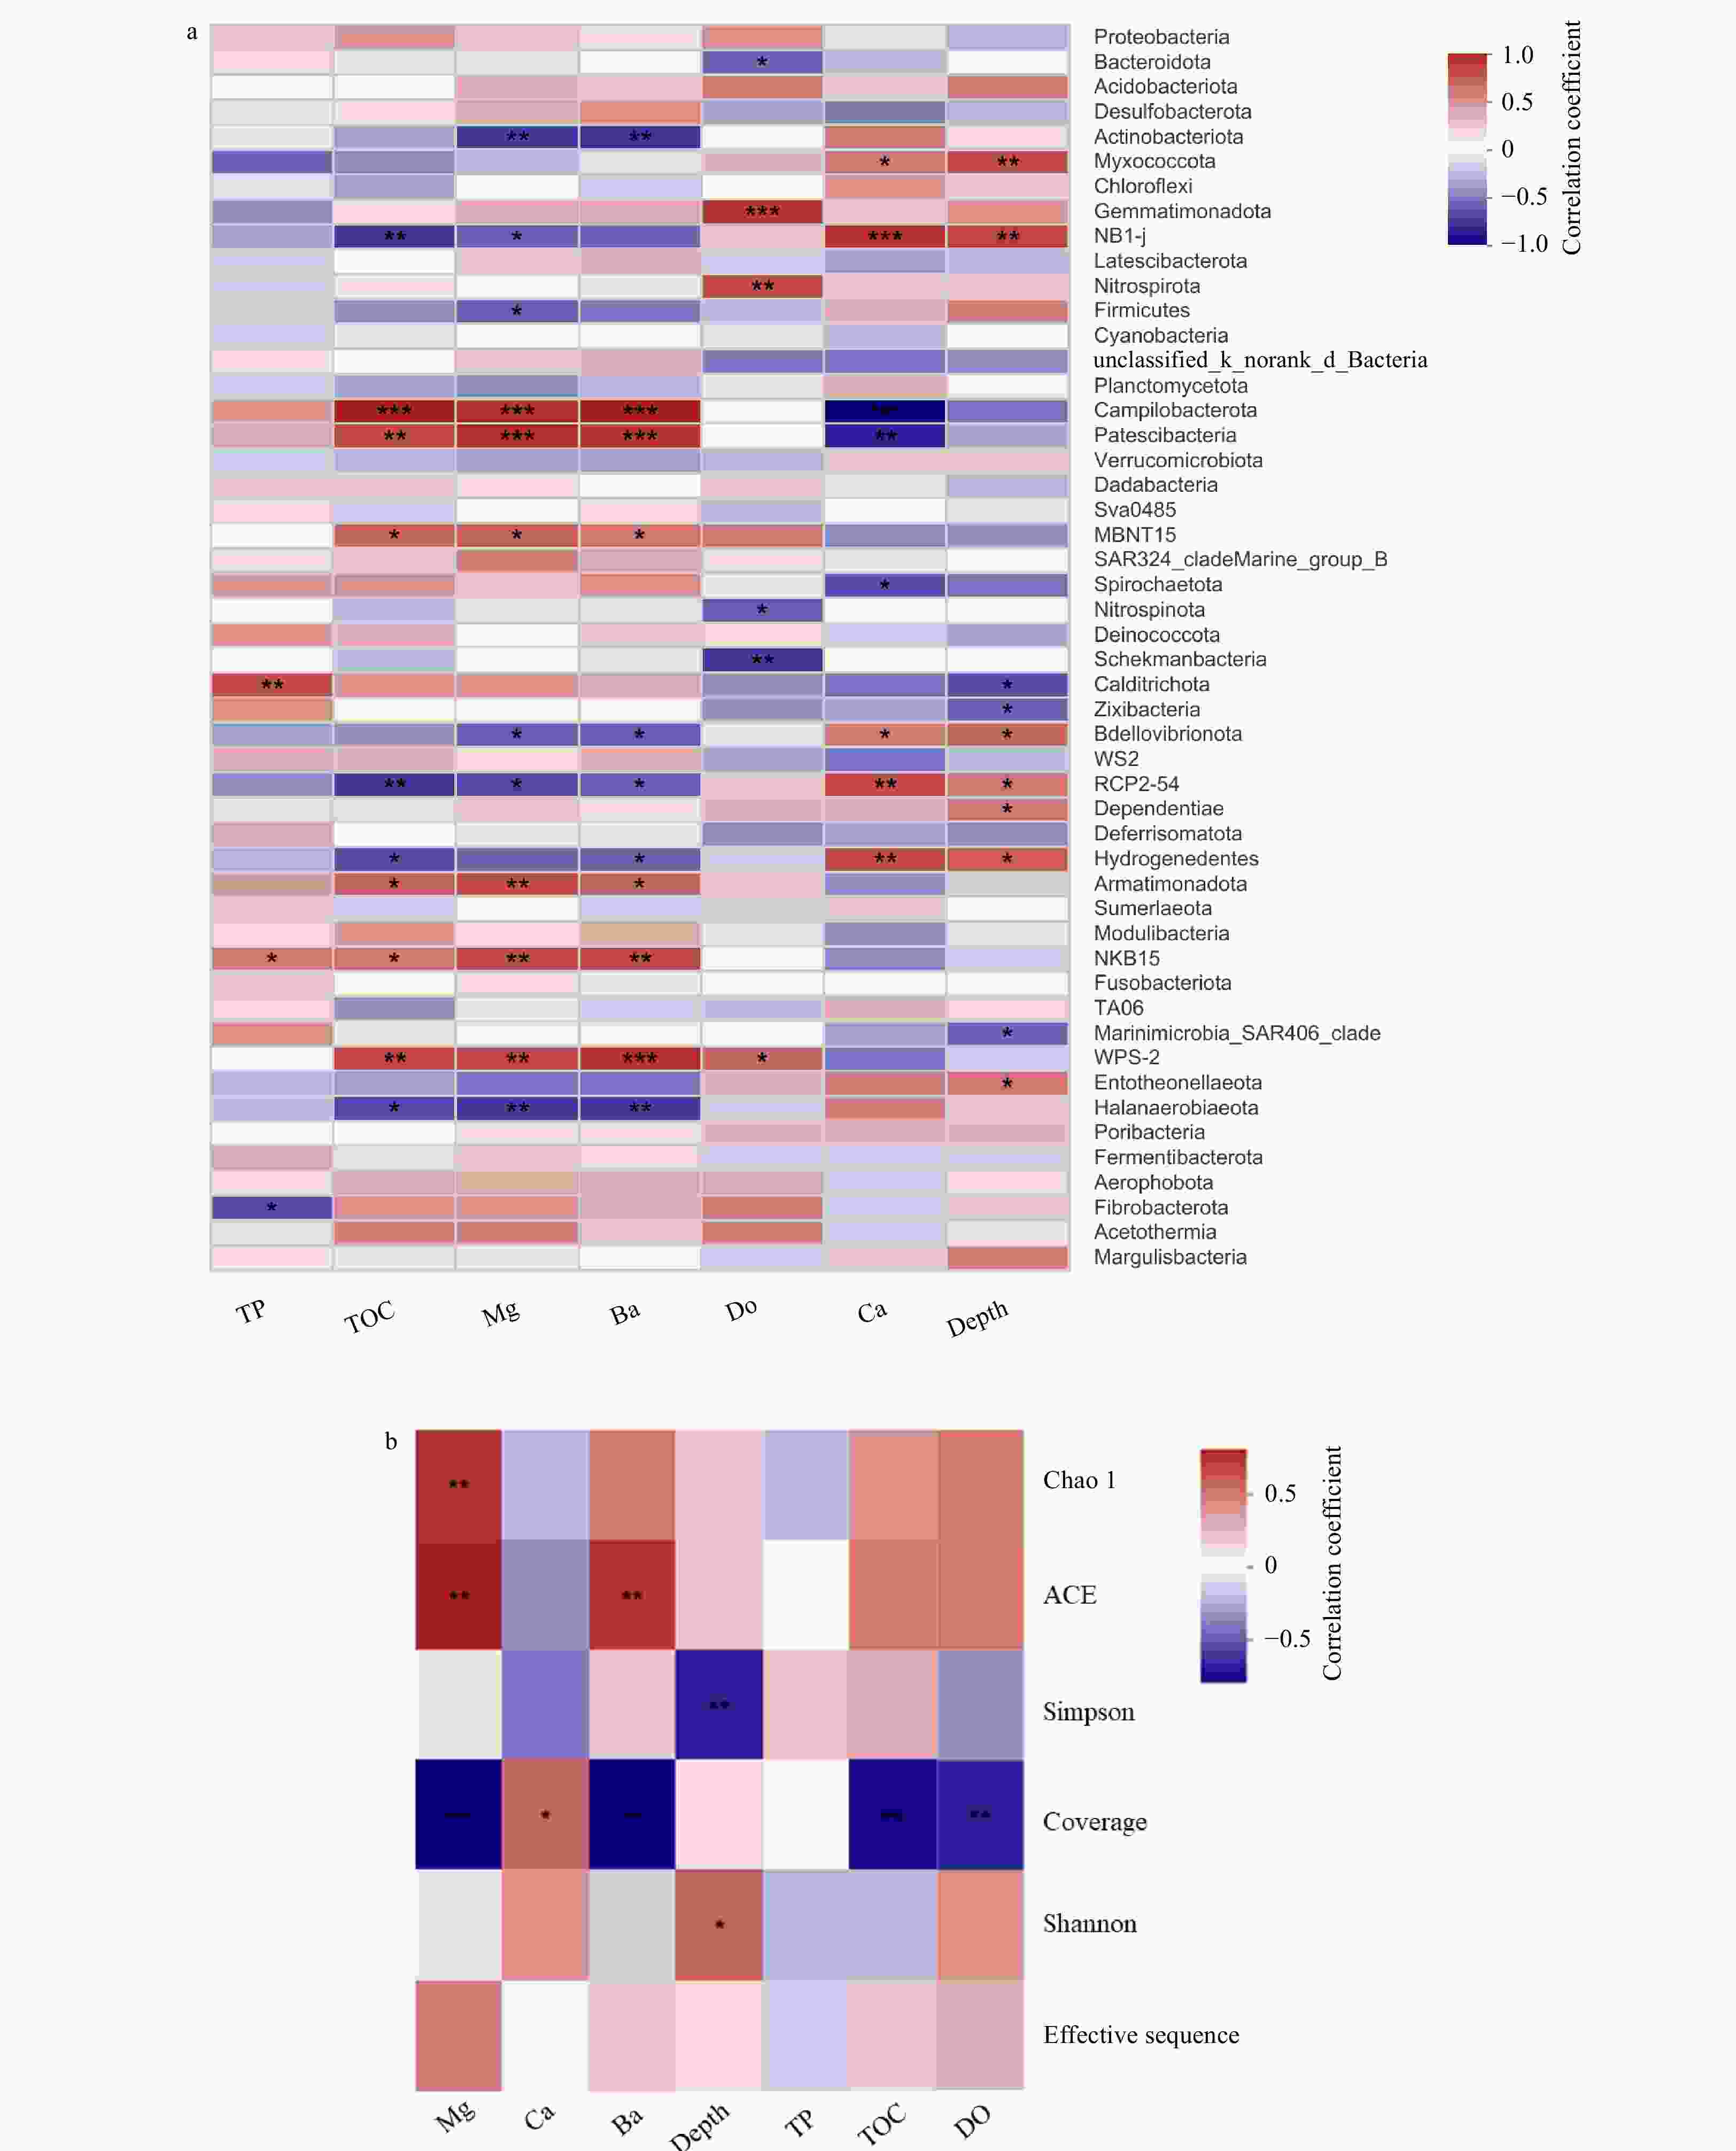
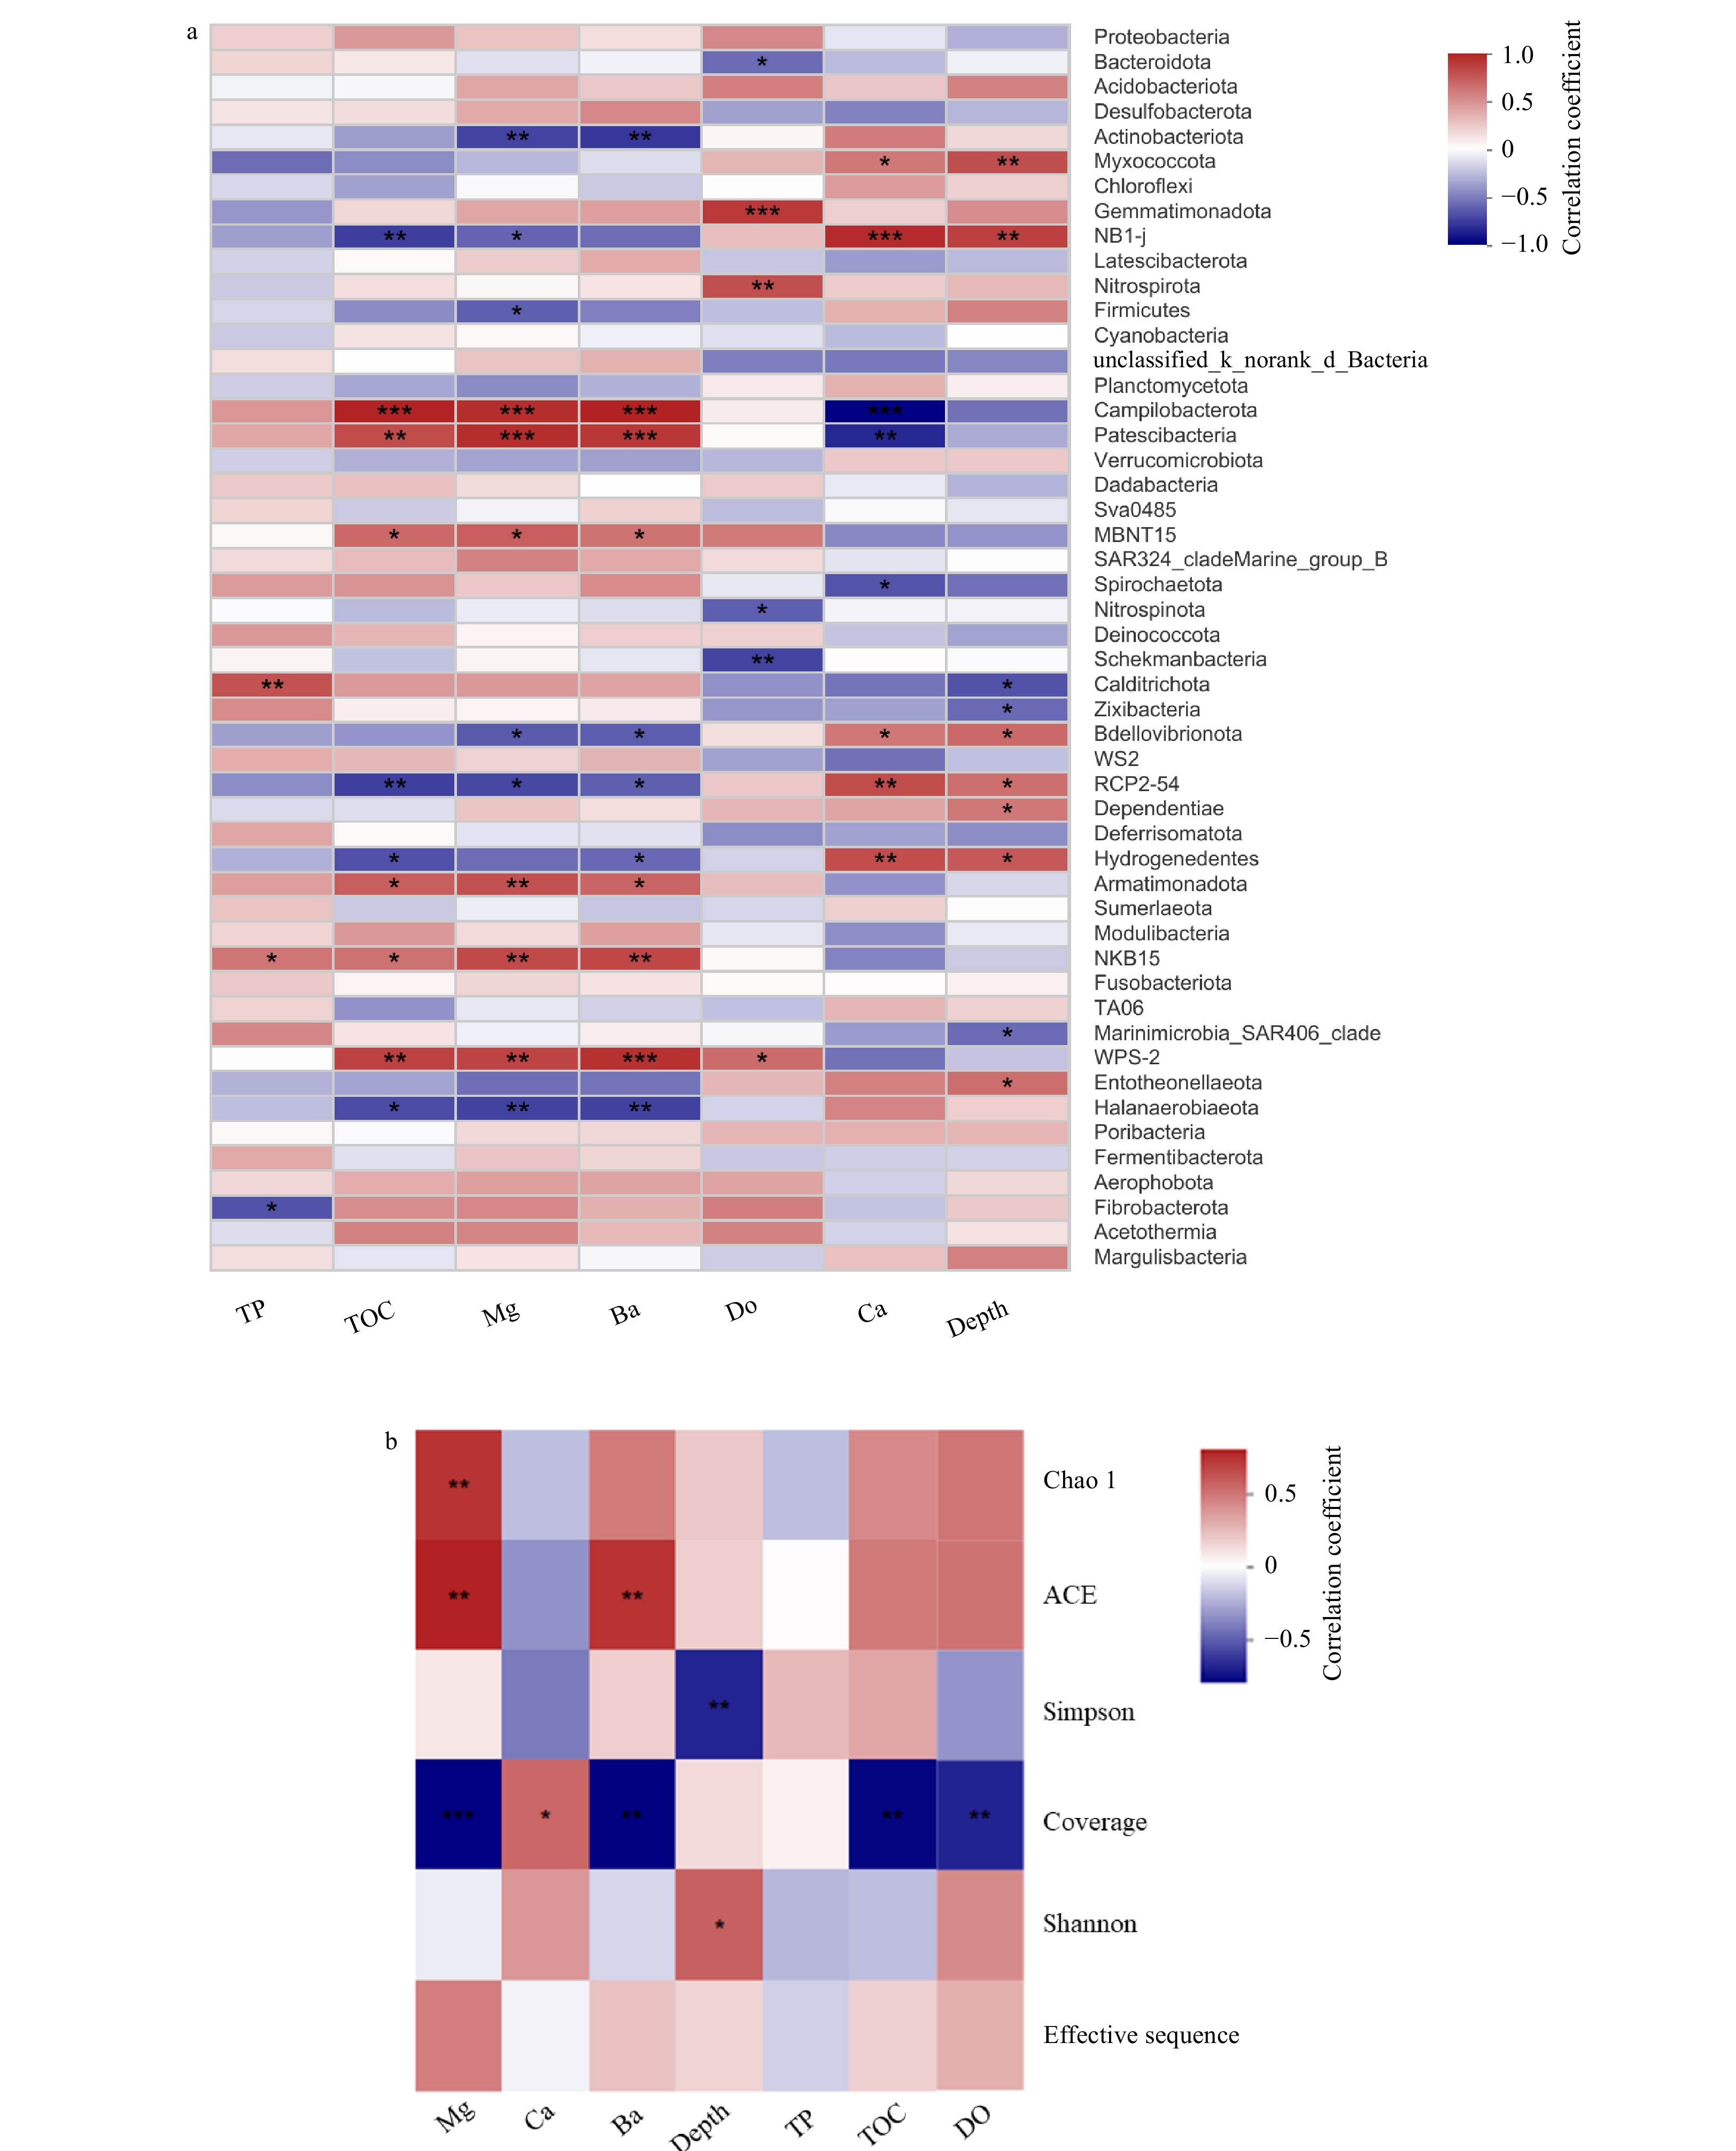
Figure 6. Spearman analysis of the effects of geochemical parameters on the phylogenetic structure of the prokaryotic communities. a. Cluster analysis between main environmental factor and community abundance; b. cluster analysis between main environmental factor and diversity indices. In Spearman correlation analysis, the intermediate heat map corresponding value is the Spearman correlation coefficient r, r > 0 is the positive correlation, r < 0 is the negative correlation.* indicates the significance test p < 0.05, ** indicates the significance test p < 0.01, *** indicates the significance test p < 0.001. The contents of the metal elements are represented by symbols Mg, Ca, and Ba, while TP, TON, and DO represent the concentrations of total phosphorus, total organic nitrogen and dissolved oxygen.
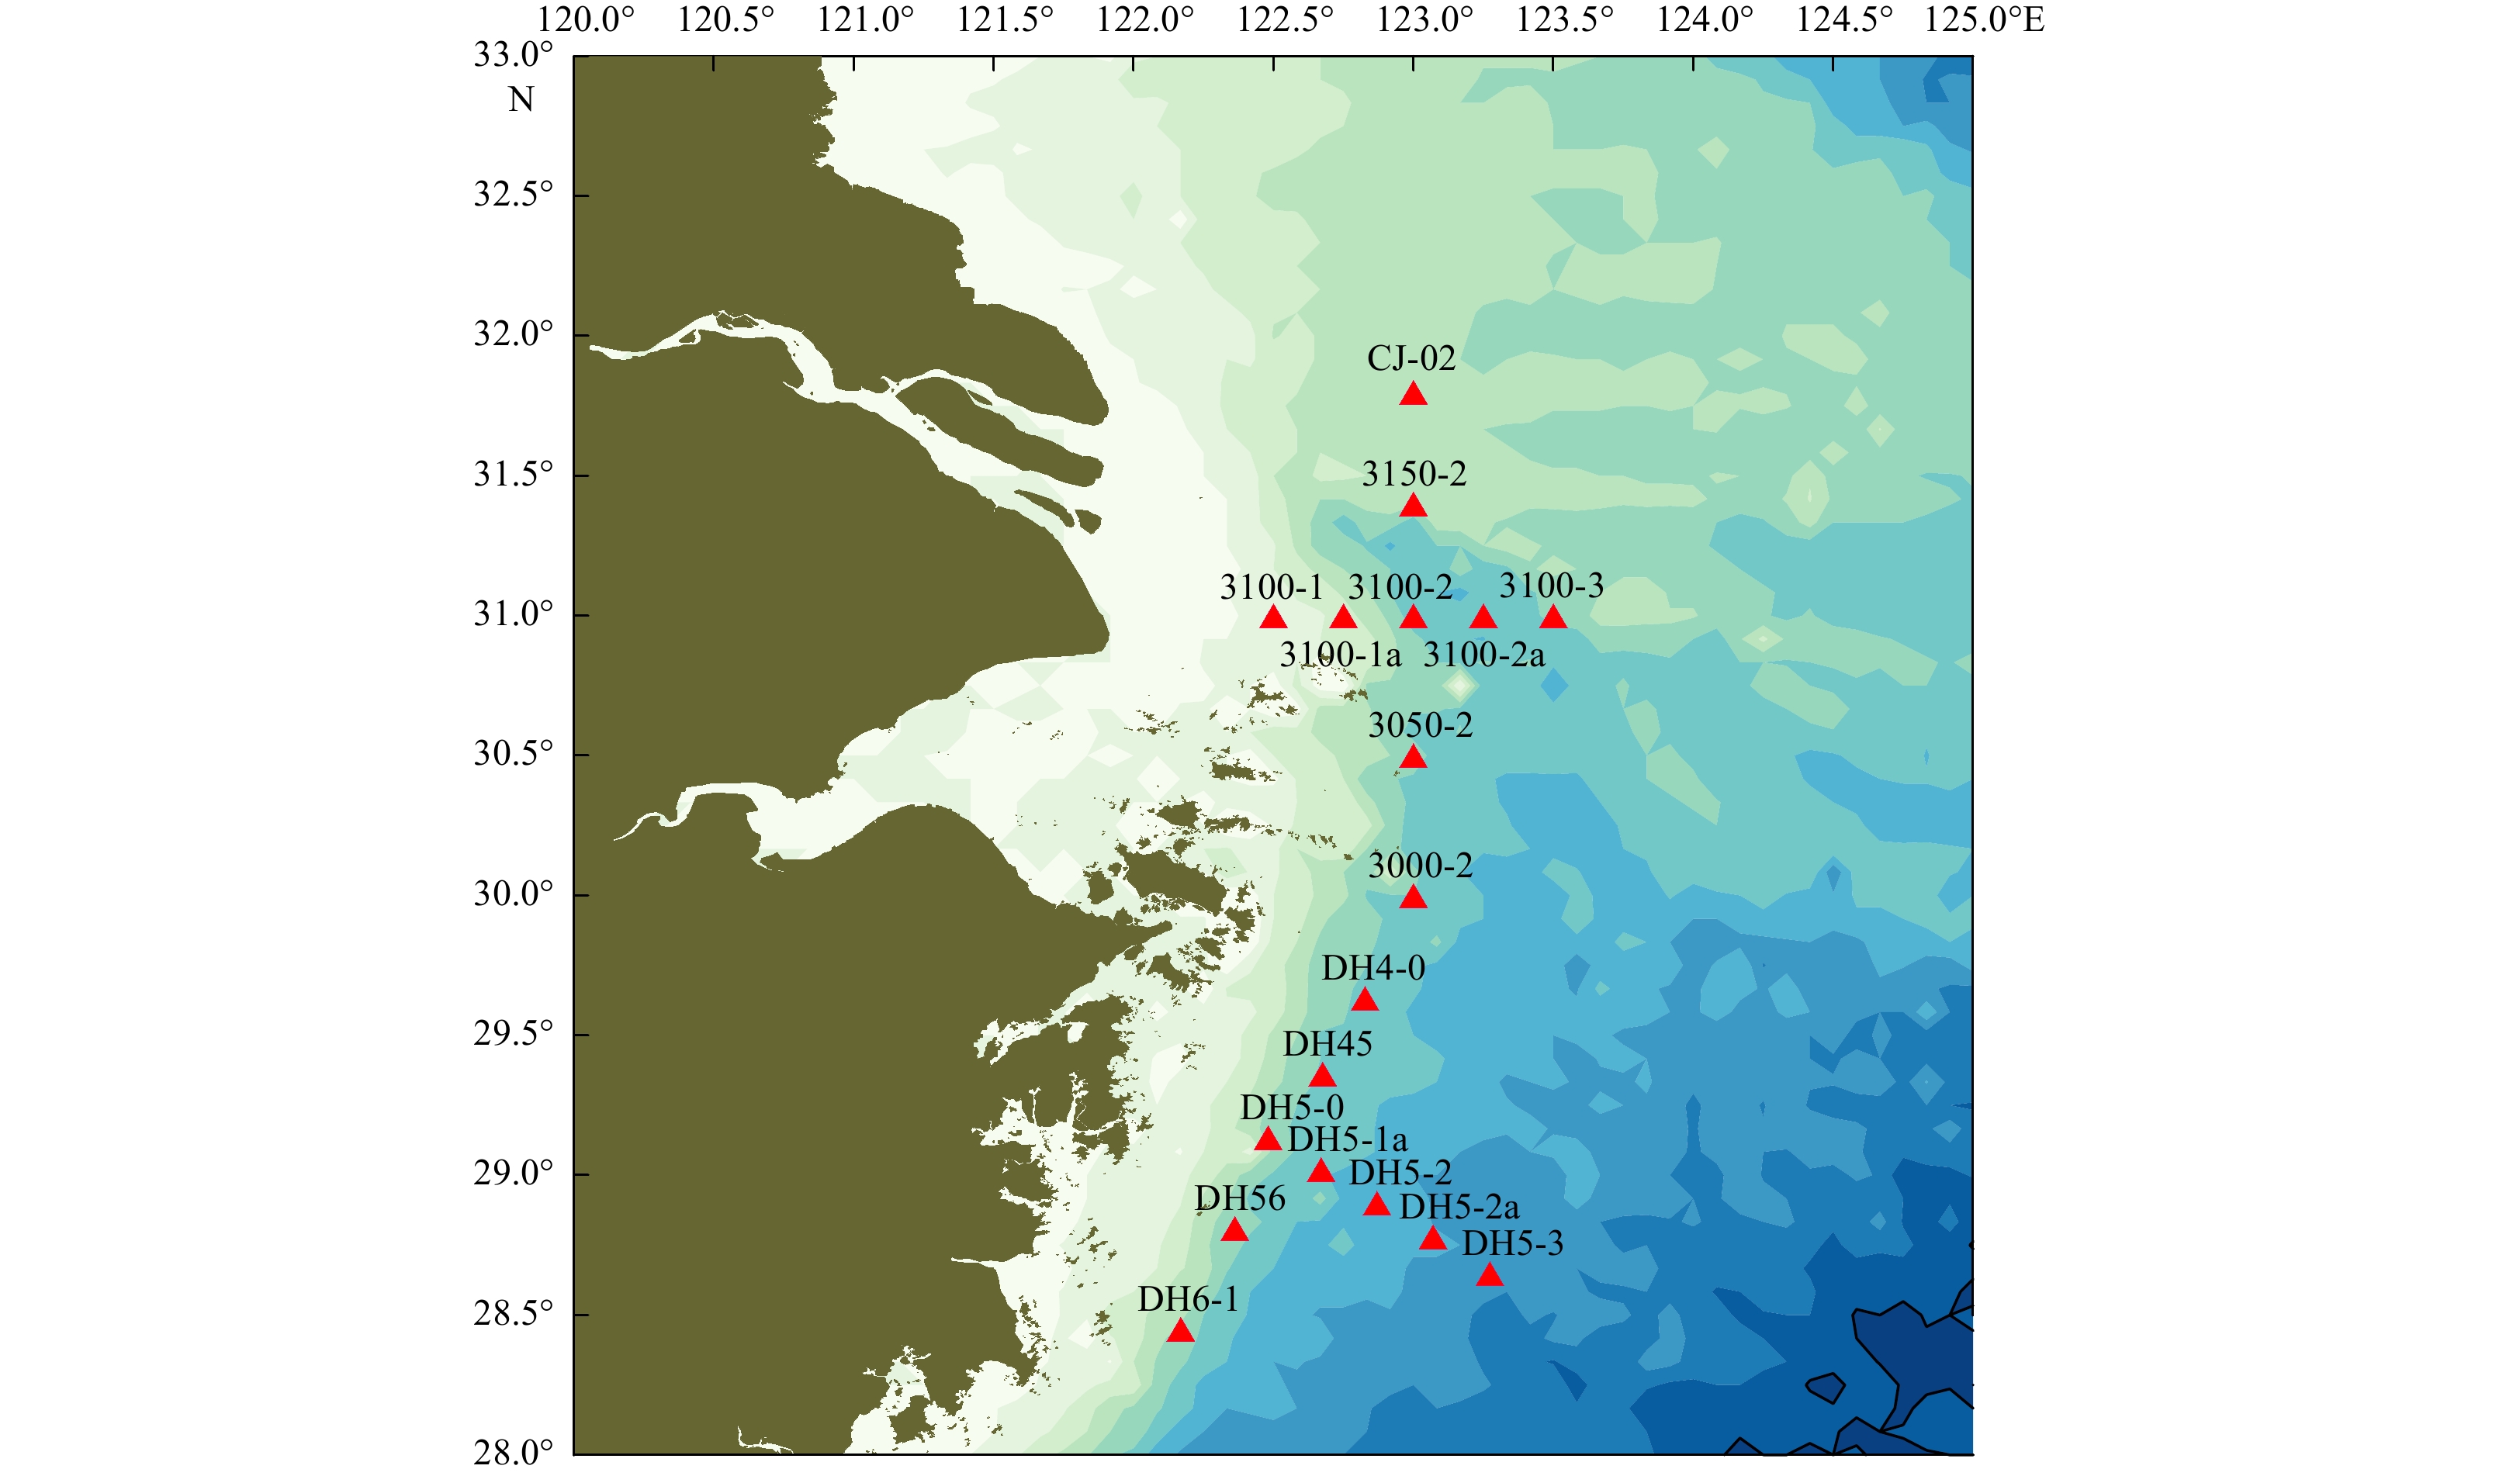
Table 1. Sample sites description of the 15 surface sediment samples from the Changjiang River Estuary adjacent sea area
Sampling site ID Sampling site description Latitude Longitude Layer/cm Collected method Sample amount/g Water depth/m Collected time CJ-02 31.792 86°N 122.996 90°E 0–2 sediment box corer 50 38.6 2020-08-17 3100-1 30.902 66°N 122.452 16°E 0–2 sediment box corer 50 14.5 2020-08-18 3100-2a 31.010 40°N 123.250 10°E 0–2 sediment box corer 50 60.0 2020-08-18 3100-3 31.000 56°N 123.501 38°E 0–2 sediment box corer 50 55.0 2020-08-18 3050-2 30.494 22°N 123.016 68°E 0–2 sediment box corer 50 61.0 2020-08-16 3000-2 30.000 98°N 122.999 94°E 0–2 sediment box corer 50 52.0 2020-08-16 DH4-0 29.631 02°N 122.830 10°E 0–2 sediment box corer 50 51.0 2020-08-14 DH45 29.363 42°N 122.678 72°E 0–2 sediment box corer 50 51.0 2020-08-14 DH5-0 29.136 61°N 122.480 70°E 0–2 sediment box corer 50 44.0 2020-08-14 DH5-1a 29.017 12°N 122.668 46°E 0–2 sediment box corer 50 57.0 2020-08-14 DH5-2 28.897 74°N 122.868 94°E 0–2 sediment box corer 50 64.0 2020-08-15 DH5-2a 28.781 67°N 123.070 78°E 0–2 sediment box corer 50 68.0 2020-08-15 DH5-3 28.650 79°N 123.276 02°E 0–2 sediment box corer 50 72.0 2020-08-15 DH56 28.809 90°N 122.361 22°E 0–2 sediment box corer 50 47.0 2020-08-15 DH6-1 28.450 96°N 122.179 00°E 0–2 sediment box corer 50 43.0 2020-08-15  下载: 导出CSV
Table 2. Geochemical parameters of the 15 surface sediment samples from the Changjiang River Estuary adjacent sea area
Sample
IDSample geochemical factors characteristic TN/
(μg·g−1)TP/
(μg·g−1)TON/
(μg·g−1)TOP/
(μg·g−1)TOC/
(mg·g−1)DO/
(mg·L−1)Mg/% Al/(%) K/(%) Ca/(%) Fe/% Mn/
(mg·kg−1)Cu/
(mg·kg−1)Zn/
(mg·kg−1)As/
(mg·kg−1)Ba/
(mg·kg−1)Pb/
(mg·kg−1)Cd/
(mg·kg−1)CJ-02 171.30 214.20 155.71 118.17 3.05 2.29 1.90 11.03 2.23 3.56 3.89 504.1 8.2 48.3 3.1 418 17.8 0.12 3100-1 395.27 245.21 382.54 135.70 4.32 4.71 2.69 14.42 2.65 4.13 5.57 763.5 28.8 91.1 9.4 425 28.1 0.20 3100-2a 400.76 193.65 385.41 149.30 3.43 3.12 2.46 13.78 2.55 4.29 4.24 475.4 12.0 59.9 4.6 400 20.0 0.13 3100-3 362.86 210.42 350.85 116.99 2.25 3.22 2.36 12.51 2.35 5.17 3.98 573.6 11.7 59.5 3.3 398 16.2 0.12 3050-2 437.76 246.53 425.94 85.46 2.38 1.76 2.84 14.95 2.73 4.34 5.16 618.1 18.8 79.0 5.5 428 25.0 0.14 3000-2 416.37 81.16 402.16 58.53 1.99 4.23 2.75 14.65 2.71 4.60 4.93 761.1 15.9 73.8 5.1 426 19.6 0.12 DH4-0 570.39 231.32 555.69 214.63 4.00 4.26 2.90 15.42 2.92 4.11 5.96 624.1 27.3 97.3 7.2 432 31.1 0.18 DH45 719.52 246.42 702.14 161.07 6.66 4.35 3.10 16.35 3.07 3.63 6.62 841.7 35.0 113.9 10.6 441 32.4 0.19 DH5-0 904.97 192.60 889.69 158.24 8.50 4.33 3.13 16.63 3.13 3.37 6.91 1 154.3 37.1 119.1 12.0 458 36.3 0.21 DH5-1a 696.37 202.97 684.89 143.71 4.87 5.14 3.04 16.40 3.08 3.78 6.34 845.8 28.1 106.4 8.8 459 30.2 0.16 DH5-2 766.00 187.82 727.64 125.48 7.20 5.41 2.94 16.39 3.14 4.10 6.54 859.2 25.9 110.9 7.0 450 31.9 0.16 DH5-2a 552.91 36.92 537.40 31.92 3.02 5.16 2.73 15.07 2.83 6.22 5.41 749.9 17.7 85.0 3.7 415 26.1 0.11 DH5-3 550.00 148.94 533.17 138.84 2.21 4.83 2.69 15.18 2.86 5.63 5.32 644.4 17.7 83.1 4.1 417 23.4 0.11 DH56 795.04 216.08 774.52 204.57 7.20 4.18 3.10 16.69 3.22 3.42 7.17 1 012.1 40.2 124.0 11.8 458 38.7 0.21 DH6-1 847.24 87.20 835.40 80.09 5.35 4.99 3.11 16.64 3.16 3.37 7.07 1 179.0 38.0 121.9 12.7 448 37.0 0.21 Note: The contents of Mg、Al、K、 Ca and Fe are presented by the percentages of their related oxides (MgO, Al2O3, K2O, CaO and Fe2O3) in sediment. TN: total nitrogen; TP: total phosphorus; TON: total organic nitrogen; TOP: total organic phosphorus; TOC: total organic carbon; DO: dissolved oxygen.
下载: 导出CSV
Table 3. Biodiversity parameters of the 15 locations of surface Changjiang River Estuary adjacent sea area
Sample ID Effective sequence Base number Operational Taxonomic Shannon index ACE estimator Coverage/% CJ-02 49959 21112433 2781 6.31 3446.88 0.98 3100-1 54373 22949506 2811 6.21 3694.29 0.977 3100-2a 44908 18883844 2517 6.04 3452.74 0.98 3100-3 53385 22541097 3003 6.42 3874.58 0.98 3050-2 66852 28235313 3296 6.40 4452.27 0.98 3000-2 55133 23327239 2768 6.08 3836.63 0.98 DH4-0 51194 21682724 3123 6.37 4336.89 0.97 DH45 60438 25475554 3096 6.27 4359.16 0.97 DH5-0 58946 24869661 2973 6.20 4330.02 0.97 DH5-1a 41935 17703747 2757 6.32 4975.49 0.96 DH5-2 68649 28984752 3310 6.43 4490.64 0.98 DH5-2a 54684 23052855 3138 6.53 4319.96 0.97 DH5-3 54545 22973489 2953 6.56 3721.15 0.98 DH56 52897 22363027 3064 6.33 4267.99 0.97 DH6-1 63476 26841604 3387 6.40 4688.09 0.97 Note: ACE: Abundance-based Coverage Estimator.
下载: 导出CSV
-
Aldunate M, De La Iglesia R, Bertagnolli A D, et al. 2018. Oxygen modulates bacterial community composition in the coastal upwelling waters off central Chile. Deep-Sea Research Part II: Topical Studies in Oceanography, 156: 68–79. doi: 10.1016/j.dsr2.2018.02.001 Aponte H, Meli P, Butler B, et al. 2020. Meta-analysis of heavy metal effects on soil enzyme activities. Science of the Total Environment, 737: 139744. doi: 10.1016/j.scitotenv.2020.139744 Baldock J A, Skjemstad J O. 2000. Role of the soil matrix and minerals in protecting natural organic materials against biological attack. Organic Geochemistry, 31(7−8): 697–710. doi: 10.1016/S0146-6380(00)00049-8 Beardsley R C, Limeburner R, Yu H, et al. 1985. Discharge of the Changjiang (Yangtze River) into the East China Sea. Continental Shelf Research, 4(1−2): 57–76. doi: 10.1016/0278-4343(85)90022-6 Bell T H, Yergeau E, Maynard C, et al. 2013. Predictable bacterial composition and hydrocarbon degradation in Arctic soils following diesel and nutrient disturbance. The ISME Journal, 7(6): 1200–1210. doi: 10.1038/ismej.2013.1 Biddle J F, Lipp J S, Lever M A, et al. 2006. Heterotrophic Archaea dominate sedimentary subsurface ecosystems off Peru. Proceedings of the National Academy of Sciences of the United States of America, 103(10): 3846–3851 Caporaso J G, Kuczynski J, Stombaugh J, et al. 2010. QIIME allows analysis of high-throughput community sequencing data. Nature Methods, 7(5): 335–336. doi: 10.1038/nmeth.f.303 Chai Chao, Yu Zhiming, Shen Zhiliang, et al. 2009. Nutrient characteristics in the Yangtze River Estuary and the adjacent East China Sea before and after impoundment of the Three Gorges Dam. Science of the Total Environment, 407(16): 4687–4695. doi: 10.1016/j.scitotenv.2009.05.011 Chen Quanrui, Fan Jingfeng, Su Jie, et al. 2020. Spatial distribution characteristics of bacterial community structure and gene abundance in sediments of the Bohai Sea. Acta Oceanologica Sinica, 39(2): 69–78. doi: 10.1007/s13131-020-1554-8 Chen Chung-Chi, Gong Gwo-Ching, Shiah Fuh-Kwo. 2007. Hypoxia in the East China Sea: one of the largest coastal low-oxygen areas in the world. Marine Environmental Research, 64(4): 399–408. doi: 10.1016/j.marenvres.2007.01.007 Chen Shifu, Zhou Yanqing, Chen Yaru, et al. 2018. fastp: an ultra-fast all-in-one FASTQ preprocessor. Bioinformatics, 34(17): i884–i890. doi: 10.1093/bioinformatics/bty560 D’Hondt S, Jørgensen B B, Miller D J, et al. 2004. Distributions of microbial activities in deep subseafloor sediments. Science, 306(5705): 2216–2221. doi: 10.1126/science.1101155 Dong Chunming, Sheng Huafang, Wang Weiguo, et al. 2017. Bacterial distribution pattern in the surface sediments distinctive among shelf, slope and basin across the western Arctic Ocean. Polar Biology, 40(2): 423–436. doi: 10.1007/s00300-016-1970-6 Edgar R C. 2013. UPARSE: highly accurate OTU sequences from microbial amplicon reads. Nature Methods, 10(10): 996–998. doi: 10.1038/nmeth.2604 Ehrlich H L. 1997. Microbes and metals. Applied Microbiology and Biotechnology, 48(6): 687–692. doi: 10.1007/s002530051116 Fuerst J A, Sagulenko E. 2011. Beyond the bacterium: planctomycetes challenge our concepts of microbial structure and function. Nature Reviews Microbiology, 9(6): 403–413. doi: 10.1038/nrmicro2578 Green J, Bohannan B J M. 2006. Spatial scaling of microbial biodiversity. Trends in Ecology & Evolution, 21(9): 501–507 Hinrichs K U, Inagaki F. 2012. Downsizing the deep biosphere. Science, 338(6104): 204–205. doi: 10.1126/science.1229296 Hollingsworth A L, Jones D O B, Young C R. 2021. Spatial variability of abyssal nitrifying microbes in the North-Eastern Clarion-Clipperton zone. Frontiers in Marine Science, 8: 663420. doi: 10.3389/fmars.2021.663420 Horner-Devine M C, Carney K M, Bohannan B J M. 2004. An ecological perspective on bacterial biodiversity. Proceedings of the Royal Society B: Biological Sciences, 271(1535): 113–122. doi: 10.1098/rspb.2003.2549 Hoshino T, Doi H, Uramoto G I, et al. 2020. Global diversity of microbial communities in marine sediment. Proceedings of the National Academy of Sciences of the United States of America, 117(44): 27587–27597 Hoshino T, Inagaki F. 2019. Abundance and distribution of Archaea in the subseafloor sedimentary biosphere. The ISME Journal, 13(1): 227–231. doi: 10.1038/s41396-018-0253-3 Jeandel C, Tachikawa K, Bory A, et al. 2000. Biogenic barium in suspended and trapped material as a tracer of export production in the tropical NE Atlantic (EUMELI sites). Marine Chemistry, 71(1−2): 125–142. doi: 10.1016/S0304-4203(00)00045-1 Jetten M S M, Sliekers O, Kuypers M, et al. 2003. Anaerobic ammonium oxidation by marine and freshwater planctomycete-like bacteria. Applied Microbiology and Biotechnology, 63(2): 107–114. doi: 10.1007/s00253-003-1422-4 Ji M K, van Dorst J, Bissett A, et al. 2016. Microbial diversity at Mitchell Peninsula, Eastern Antarctica: a potential biodiversity “hotspot”. Polar Biology, 39(2): 237–249. doi: 10.1007/s00300-015-1776-y Kallmeyer J, Pockalny R, Adhikari R R, et al. 2012. Global distribution of microbial abundance and biomass in subseafloor sediment. Proceedings of the National Academy of Sciences of the United States of America, 109(40): 16213–16216 Li Jiang, Gu Xiaoqian, Gui Yuanyuan. 2020. Prokaryotic diversity and composition of sediments from Prydz Bay, the Antarctic peninsula region, and the Ross Sea, Southern Ocean. Frontiers in Microbiology, 11: 783. doi: 10.3389/fmicb.2020.00783 Li Daoji, Zhang Jing, Huang Daji, et al. 2002. Oxygen depletion off the Changjiang (Yangtze River) Estuary. Science in China Series D: Earth Sciences, 45(12): 1137–1146. doi: 10.1360/02yd9110 Lozupone C, Knight R. 2005. UniFrac: a new phylogenetic method for comparing microbial communities. Applied and Environmental Microbiology, 71(12): 8228–8235. doi: 10.1128/AEM.71.12.8228-8235.2005 Lozupone C, Lladser M E, Knights D, et al. 2011. UniFrac: an effective distance metric for microbial community comparison. The ISME Journal, 5(2): 169–172. doi: 10.1038/ismej.2010.133 Ludwig W, Probst J L, Kempe S. 1996. Predicting the oceanic input of organic carbon by continental erosion. Global Biogeochemical Cycles, 10(1): 23–41. doi: 10.1029/95GB02925 Magoč T, Salzberg S L. 2011. FLASH: fast length adjustment of short reads to improve genome assemblies. Bioinformatics, 27(21): 2957–2963. doi: 10.1093/bioinformatics/btr507 Martin J M, Meybeck M. 1979. Elemental mass-balance of material carried by major world rivers. Marine Chemistry, 7(3): 173–206. doi: 10.1016/0304-4203(79)90039-2 Martiny J B H, Bohannan B J M, Brown J H, et al. 2006. Microbial biogeography: putting microorganisms on the map. Nature Reviews Microbiology, 4(2): 102–112. doi: 10.1038/nrmicro1341 Milliman J D, Syvitski J P M. 1992. Geomorphic/tectonic control of sediment discharge to the ocean: the importance of small mountainous rivers. The Journal of Geology, 100(5): 525–544. doi: 10.1086/629606 Muyzer G, Stams A J M. 2008. The ecology and biotechnology of sulphate-reducing bacteria. Nature Reviews Microbiology, 6(6): 441–454. doi: 10.1038/nrmicro1892 Orcutt B N, Sylvan J B, Knab N J, et al. 2011. Microbial ecology of the dark ocean above, at, and below the seafloor. Microbiology and Molecular Biology Reviews, 75(2): 361–422. doi: 10.1128/MMBR.00039-10 Pfeifer K, Kasten S, Hensen C, et al. 2001. Reconstruction of primary productivity from the barium contents in surface sediments of the South Atlantic Ocean. Marine Geology, 177(1−2): 13–24. doi: 10.1016/S0025-3227(01)00121-9 Segata N, Izard J, Waldron L, et al. 2011. Metagenomic biomarker discovery and explanation. Genome Biology, 12(6): R60. doi: 10.1186/gb-2011-12-6-r60 Smit E, Leeflang P, Gommans S, et al. 2001. Diversity and seasonal fluctuations of the dominant members of the bacterial soil community in a wheat field as determined by cultivation and molecular methods. Applied and Environmental Microbiology, 67(5): 2284–2291. doi: 10.1128/AEM.67.5.2284-2291.2001 Smith S V, Renwick W H, Buddemeier R W, et al. 2001. Budgets of soil erosion and deposition for sediments and sedimentary organic carbon across the conterminous United States. Global Biogeochemical Cycles, 15(3): 697–707. doi: 10.1029/2000GB001341 Smouse P E, Long J C, Sokal R R. 1986. Multiple regression and correlation extensions of the mantel test of matrix correspondence. Systematic Biology, 35(4): 627–632 Stackebrandt E, Goebel B M. 1994. Taxonomic Note: A place for DNA-DNA reassociation and 16S rRNA sequence analysis in the present species definition in bacteriology. International Journal of Systematic and Evolutionary Microbiology, 44(4): 846–849. doi: 10.1099/00207713-44-4-846 Sun Qiqi, Song Jinming, Li Xuegang, et al. 2021. The bacterial diversity and community composition altered in the oxygen minimum zone of the Tropical Western Pacific Ocean. Journal of Oceanology and Limnology, 39(5): 1690–1704. doi: 10.1007/s00343-021-0370-0 Takebayashi S, Narihiro T, Fujii Y, et al. 2007. Water availability is a critical determinant of a population shift from Proteobacteria to Actinobacteria during start-up operation of mesophilic fed-batch composting. Microbes and Environments, 22(3): 279–289. doi: 10.1264/jsme2.22.279 Thamdrup B, Rosselló-Mora R, Amann R. 2000. Microbial manganese and sulfate reduction in Black Sea shelf sediments. Applied and Environmental Microbiology, 66(7): 2888–2897. doi: 10.1128/AEM.66.7.2888-2897.2000 Thomson B C, Ostle N, McNamara N, et al. 2010. Vegetation affects the relative abundances of dominant soil bacterial taxa and soil respiration rates in an upland grassland soil. Microbial Ecology, 59(2): 335–343. doi: 10.1007/s00248-009-9575-z Wang Houjie, Yang Zuosheng, Wang Yan, et al. 2008. Reconstruction of sediment flux from the Changjiang (Yangtze River) to the sea since the 1860s. Journal of Hydrology, 349(3−4): 318–332. doi: 10.1016/j.jhydrol.2007.11.005 Wang Qiong Garrity G M, Tiedje J M, et al. 2007. Naive Bayesian classifier for rapid assignment of rRNA sequences into the new bacterial taxonomy. Applied and Environmental Microbiology, 73(16): 5261–5267. doi: 10.1128/AEM.00062-07 Yergeau E, Bokhorst S, Kang S, et al. 2012. Shifts in soil microorganisms in response to warming are consistent across a range of Antarctic environments. The ISME Journal, 6(3): 692–702. doi: 10.1038/ismej.2011.124 Zhang Dongsheng. 2011. Diversity and distribution of microorganism in Changjiang Estuary and adjacent areas (in Chinese)[dissertation]. Hangzhou: Zhejiang University Zhang Jing, Liu Sumei, Ren Jingling, et al. 2007. Nutrient gradients from the eutrophic Changjiang (Yangtze River) Estuary to the oligotrophic Kuroshio waters and re-evaluation of budgets for the East China Sea Shelf. Progress in Oceanography, 74(4): 449–478. doi: 10.1016/j.pocean.2007.04.019 Zhang Guiling, Zhang Jiezhang, Liu Sumei, et al. 2010. Nitrous oxide in the Changjiang (Yangtze River) Estuary and its adjacent marine area: riverine input, sediment release and atmospheric fluxes. Biogeosciences, 7(11): 3505–3516. doi: 10.5194/bg-7-3505-2010 Zhu Jianrong, Zhu Zhuoyi, Lin Jun, et al. 2016. Distribution of hypoxia and pycnocline off the Changjiang Estuary, China. Journal of Marine Systems, 154: 28–4. doi: 10.1016/j.jmarsys.2015.05.002 -


 点击查看大图
计量
- 文章访问数: 175
- HTML全文浏览量: 81
- PDF下载量: 5
- 被引次数: 0

