

A case study of continental shelf waves in the northwestern South China Sea induced by winter storms in 2021
-
Abstract: This study aims to investigate characteristics of continental shelf wave (CSW) on the northwestern continental shelf of the South China Sea (SCS) induced by winter storms in 2021. Mooring and cruise observations, tidal gauge data at stations Hong Kong, Zhapo and Qinglan and sea surface wind data from January 1 to February 28, 2021 are used to examine the relationship between along-shelf wind and sea level fluctuation. Two events of CSWs driven by the along-shelf sea surface wind are detected from wavelet spectra of tidal gauge data. The signals are triply peaked at periods of 56 h, 94 h and 180 h, propagating along the coast with phase speed ranging from 6.9 m/s to 18.9 m/s. The dispersion relation shows their property of the Kelvin mode of CSW. We develop a simple method to estimate amplitude of sea surface fluctuation by along-shelf wind. The results are comparable with the observation data, suggesting it is effective. The mode 2 CSWs fits very well with the mooring current velocity data. The results from rare current help to understand wave-current interaction in the northwestern SCS.
-
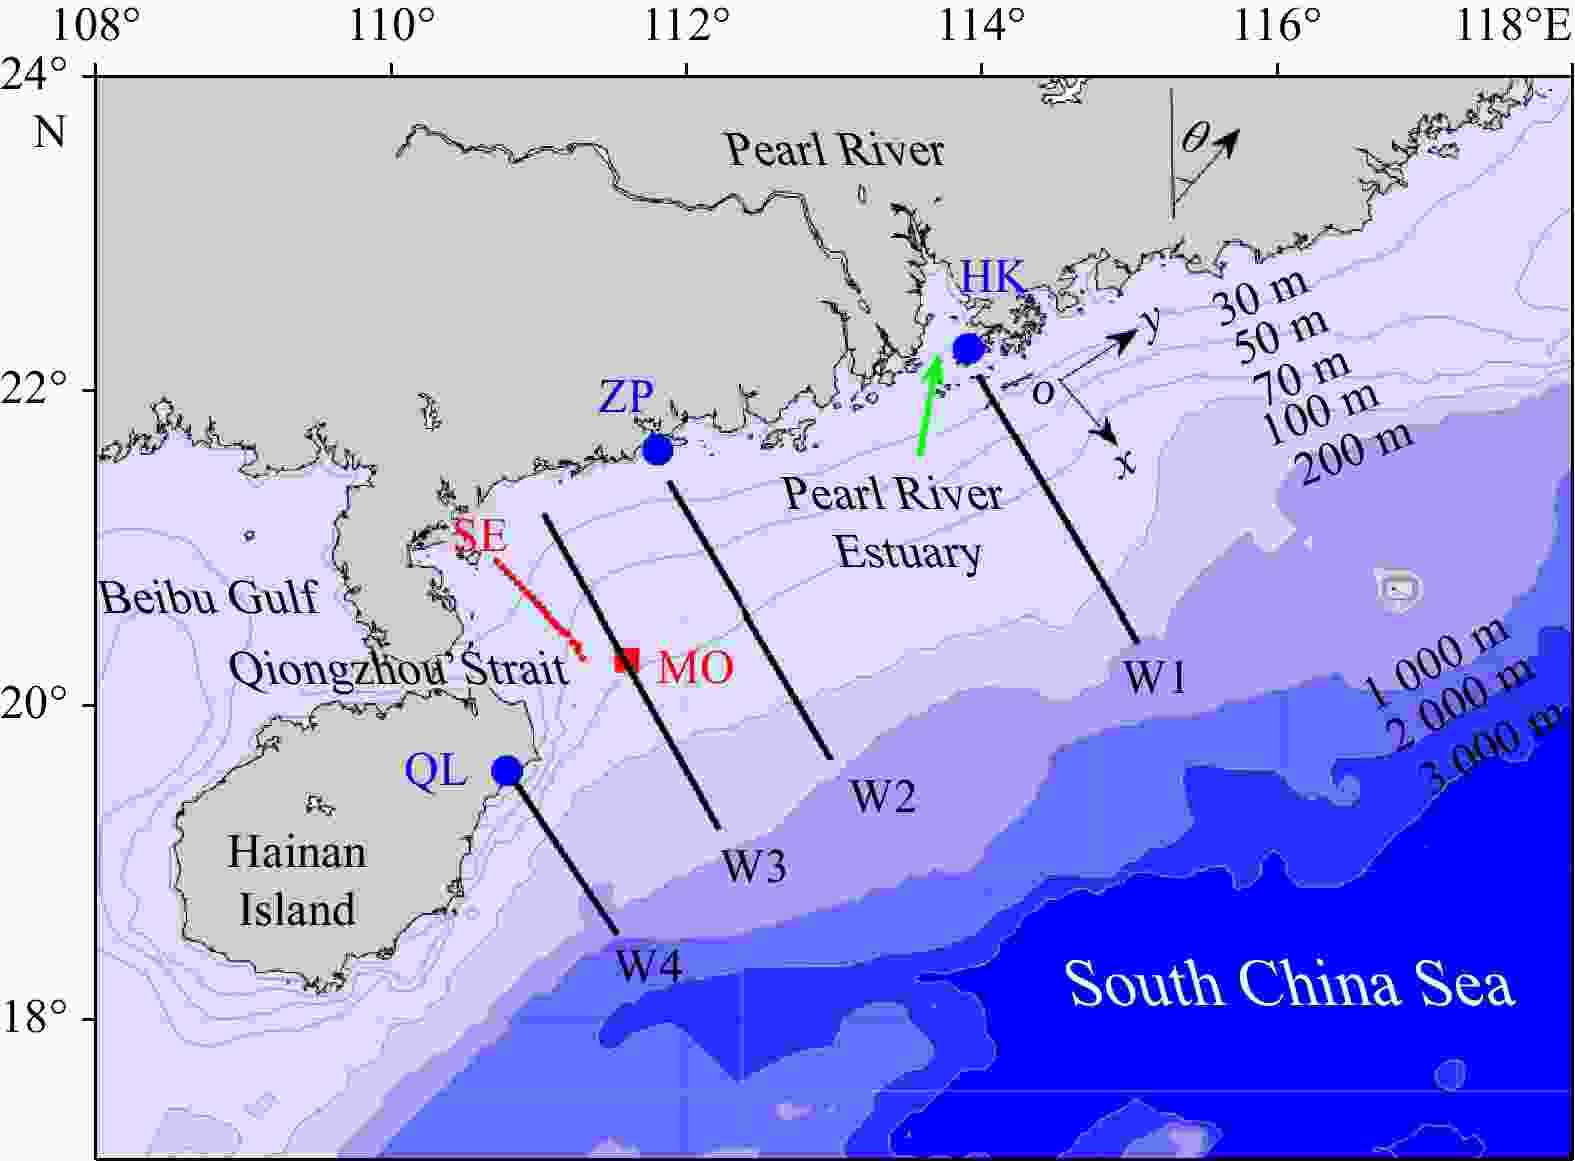
Figure 1. Study area and locations of observation stations. Blue dots are locations of tidal gauge stations of Hong Kong (HK), Zhapo (ZP) and Qinglan (QL). Red square is the location of mooring station MO. Red dots represent cruise observation section SE. Black lines represent sea surface wind observation sections W1, W2, W3 and W4. Coordinate system x-o-y is set as x-axis perpendicular to the coastline seaward positive and y-axis parallel to the coastline leftward positive. θ (= 35°) is the y-axis direction referring to true north. Contours display water depth.
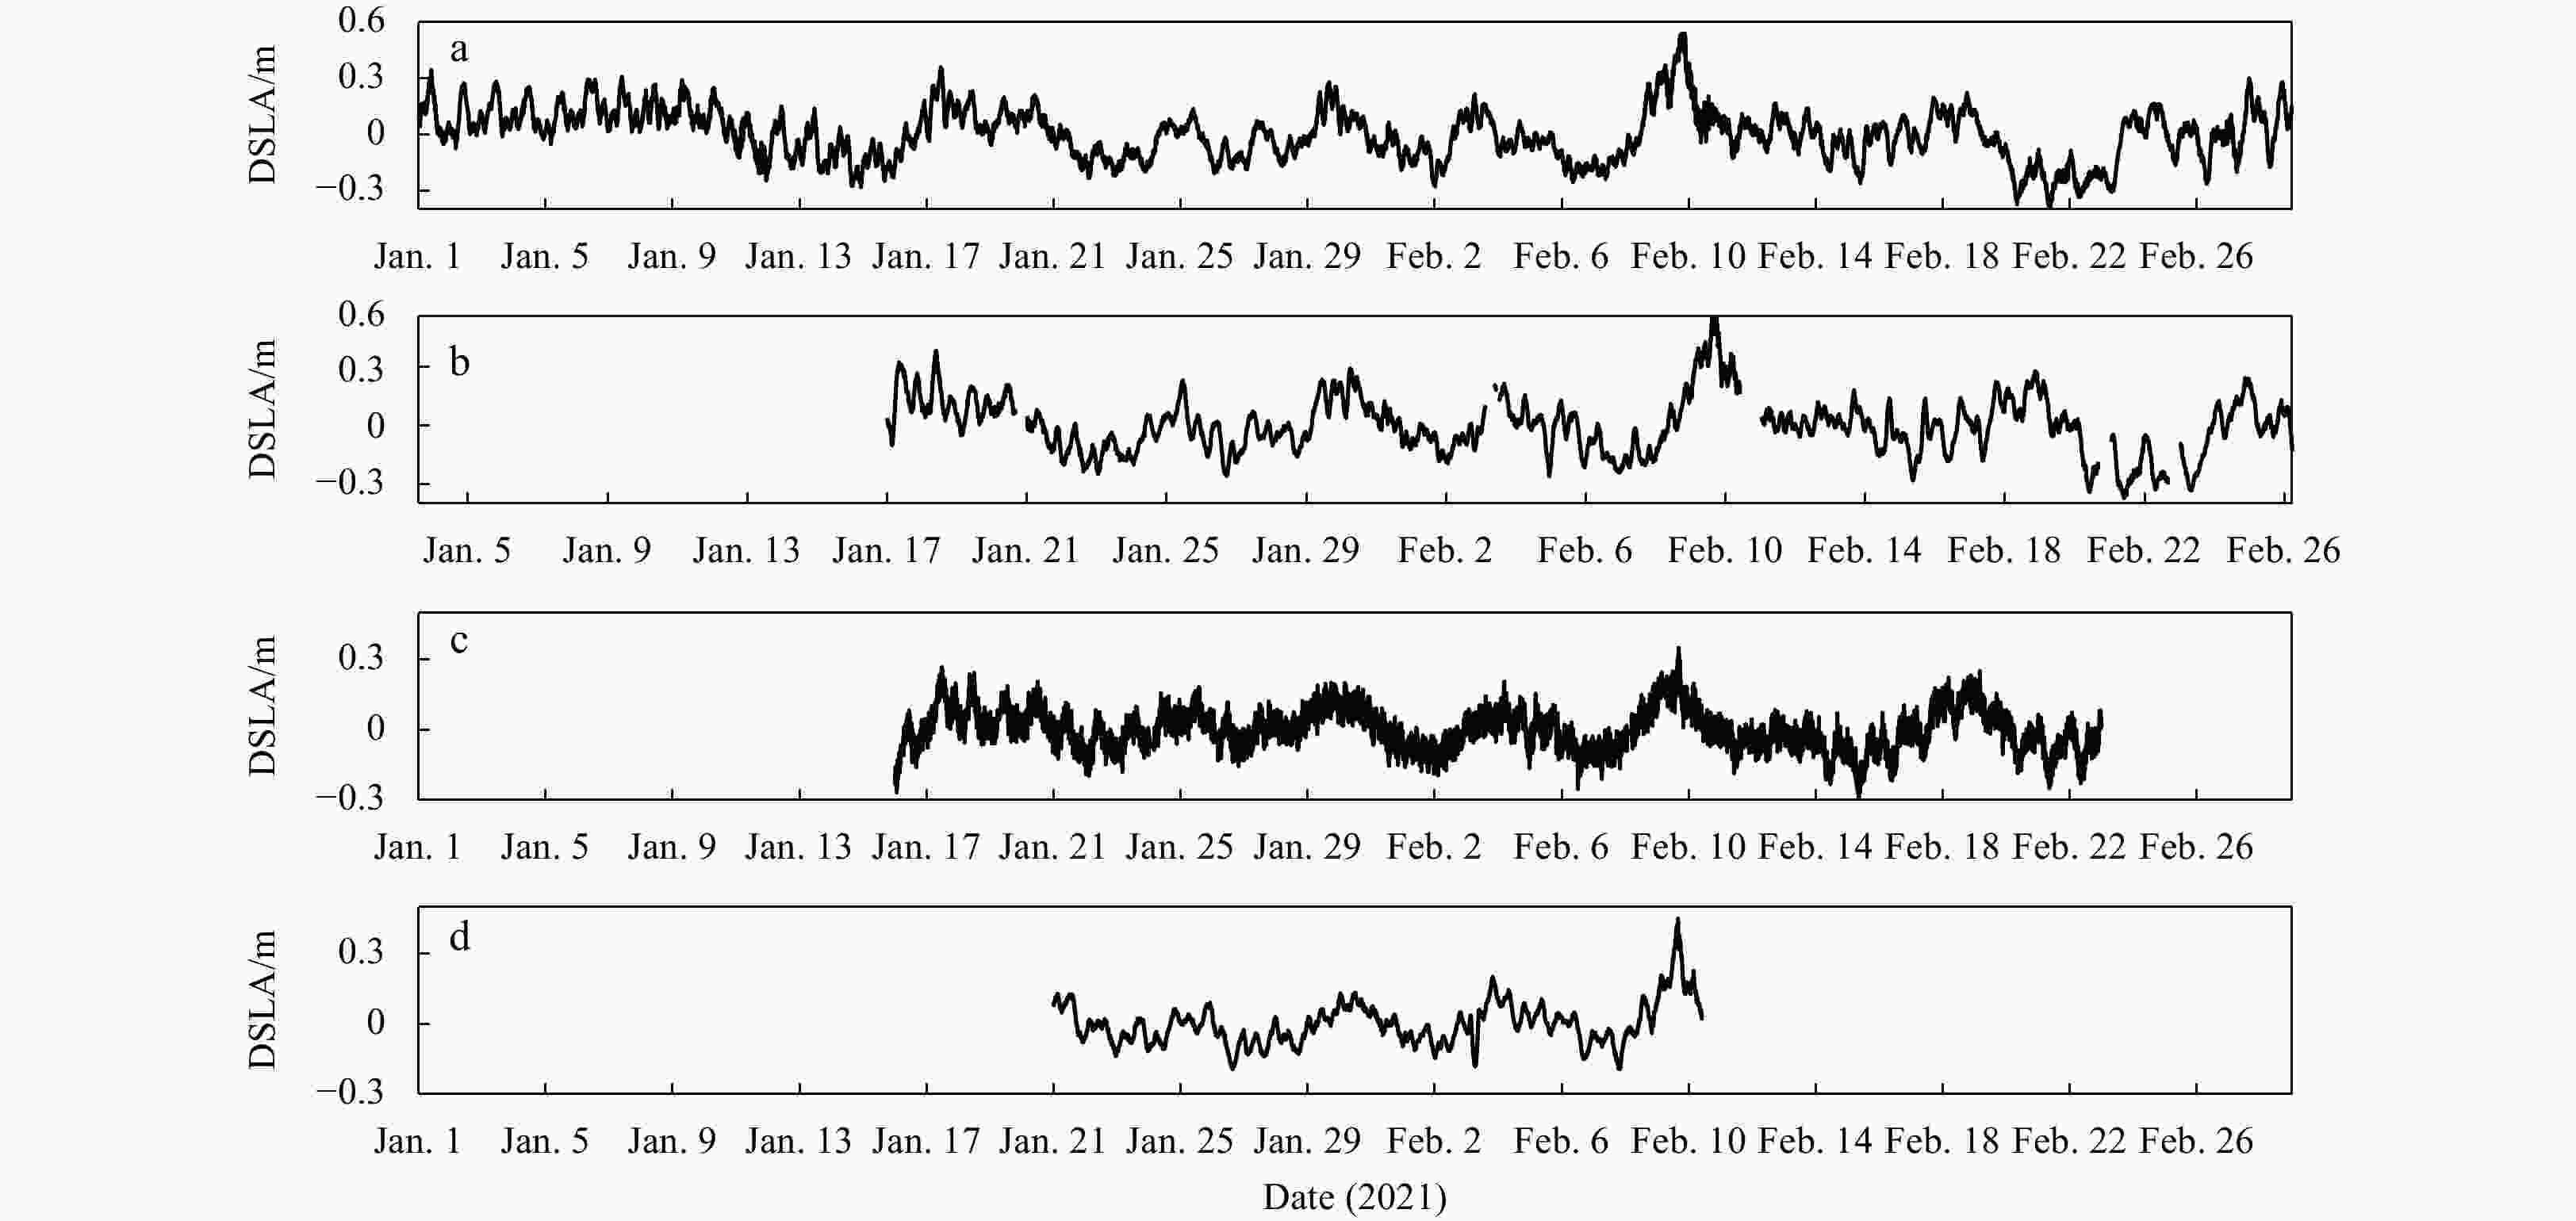
Figure 2. Time series DSLA data at tidal gauge stations: a. HK, b. ZP, c. MO and d. QL.
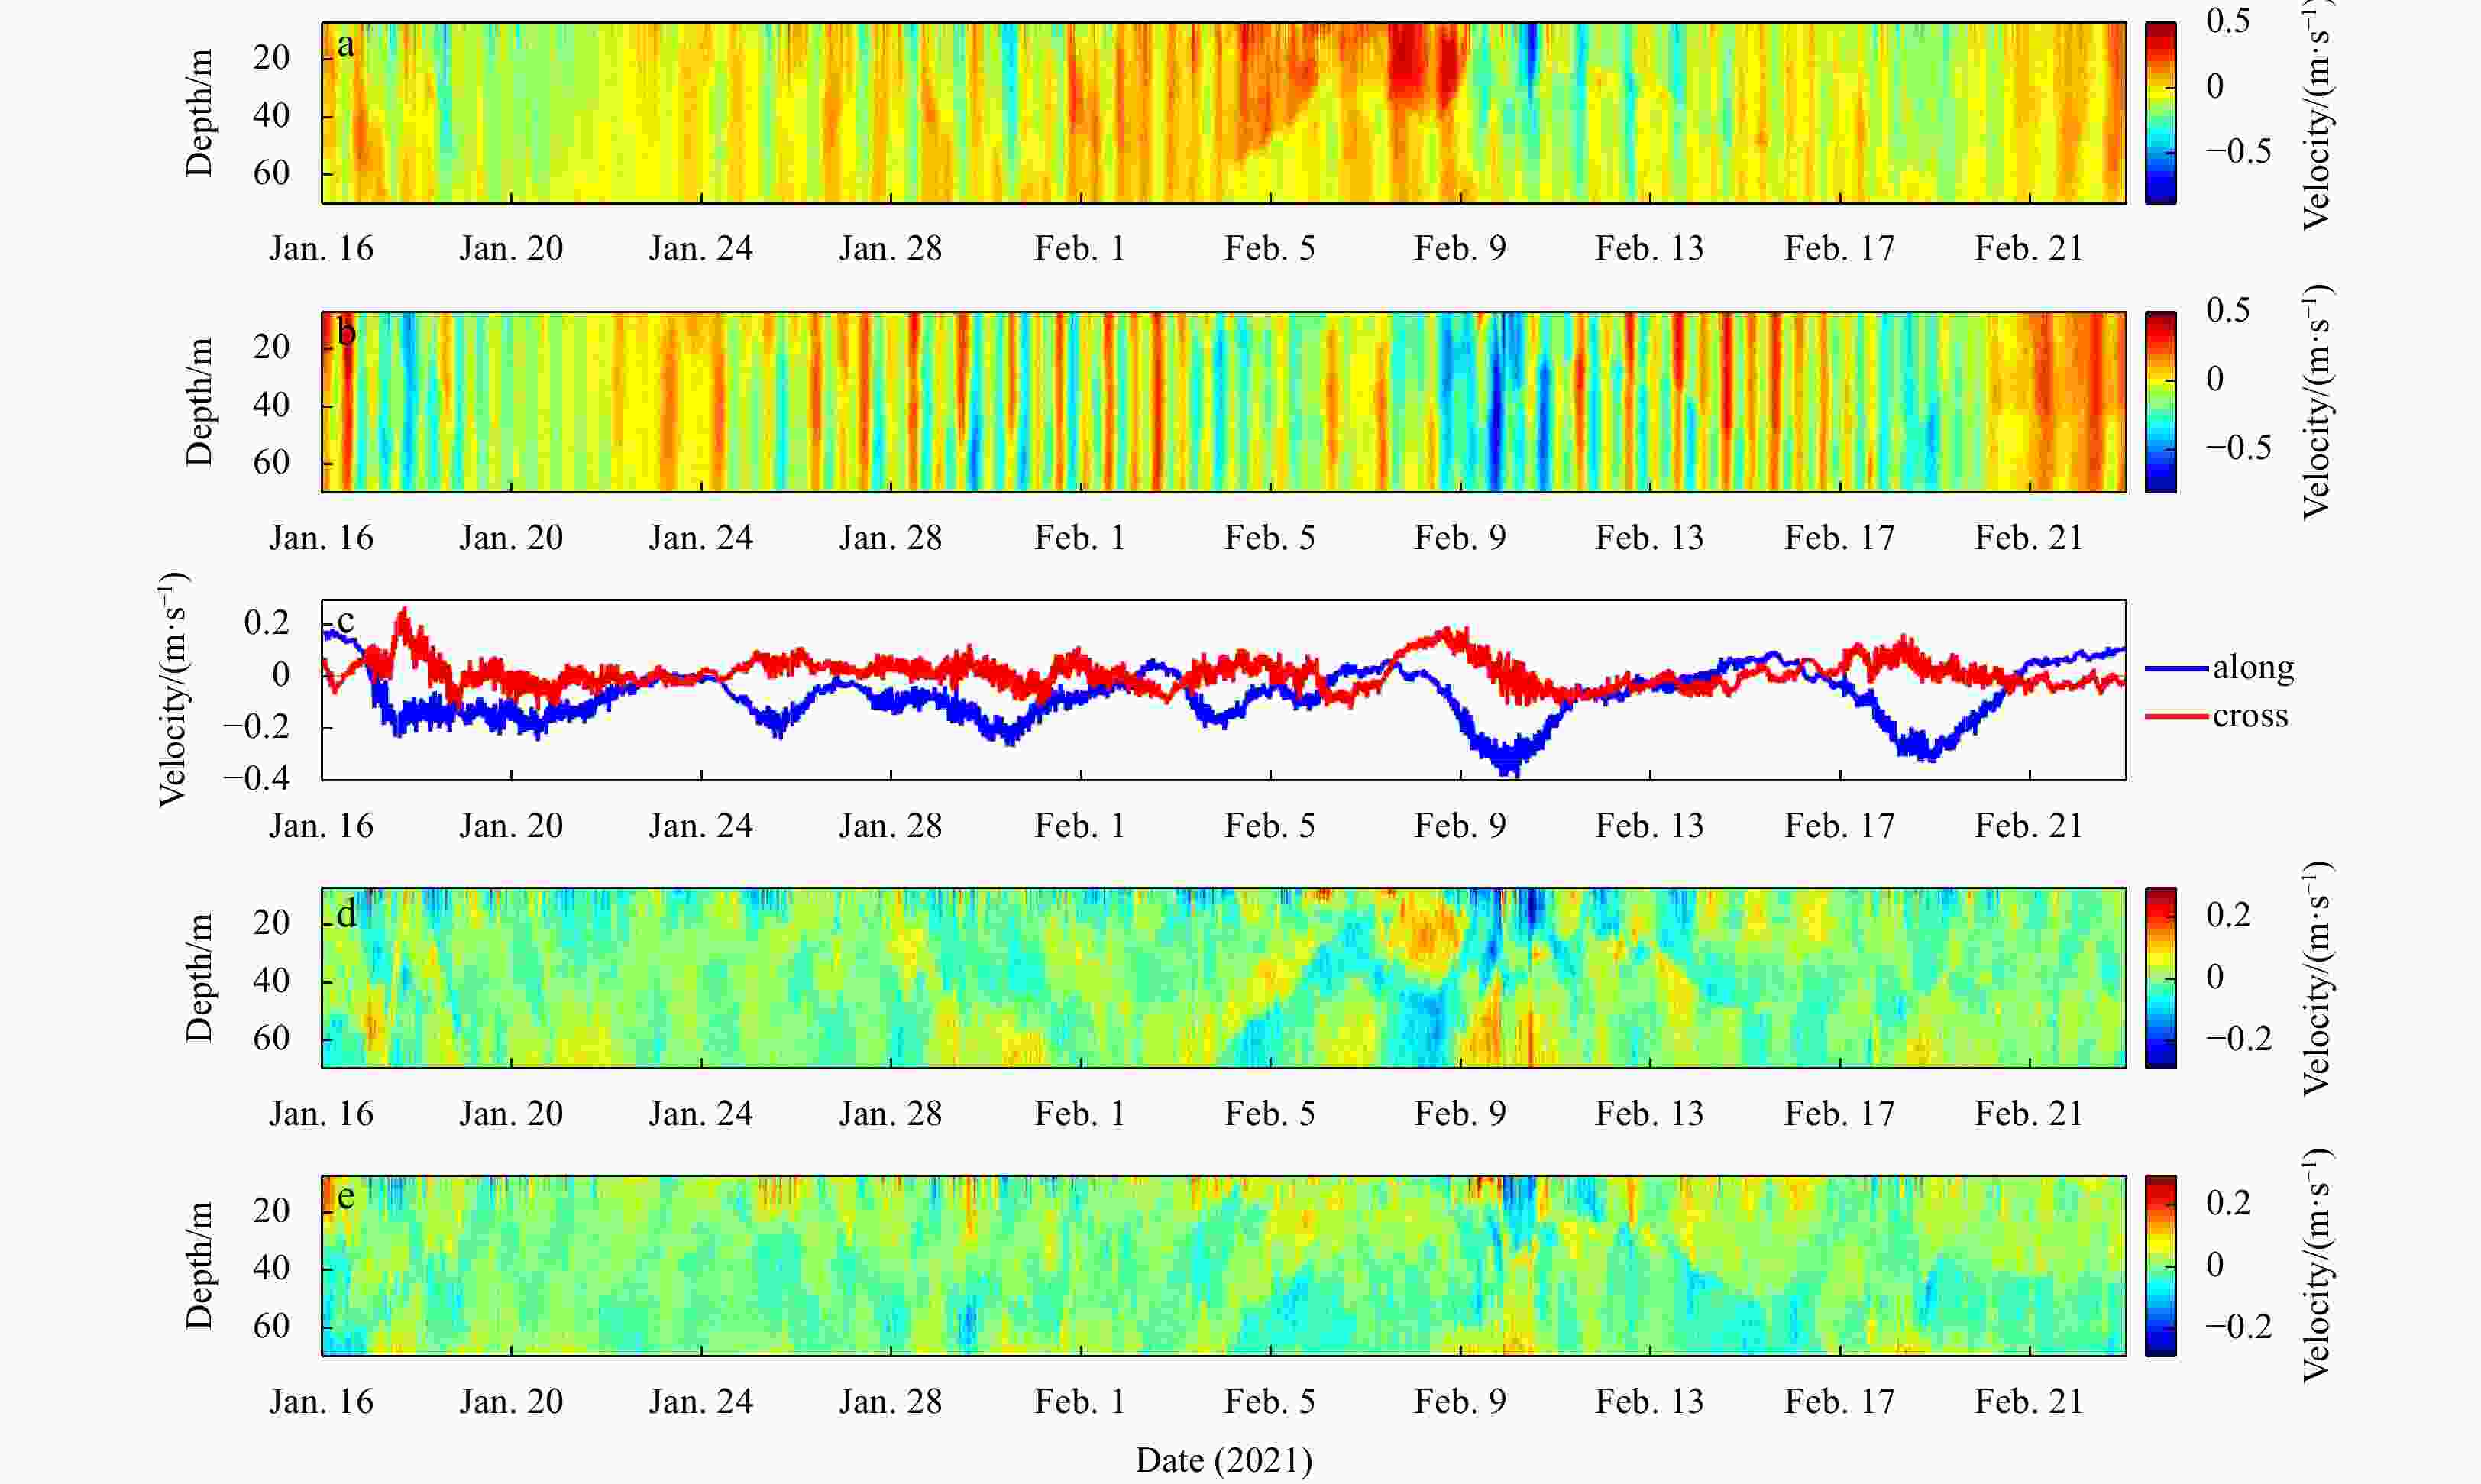
Figure 3. Velocity components derived from mooring observed data. a. Cross-shelf current component, b. along-shelf current component, c. barotropic current component, d. baroclinic cross-shelf current component and e. baroclinic along-shelf current component.
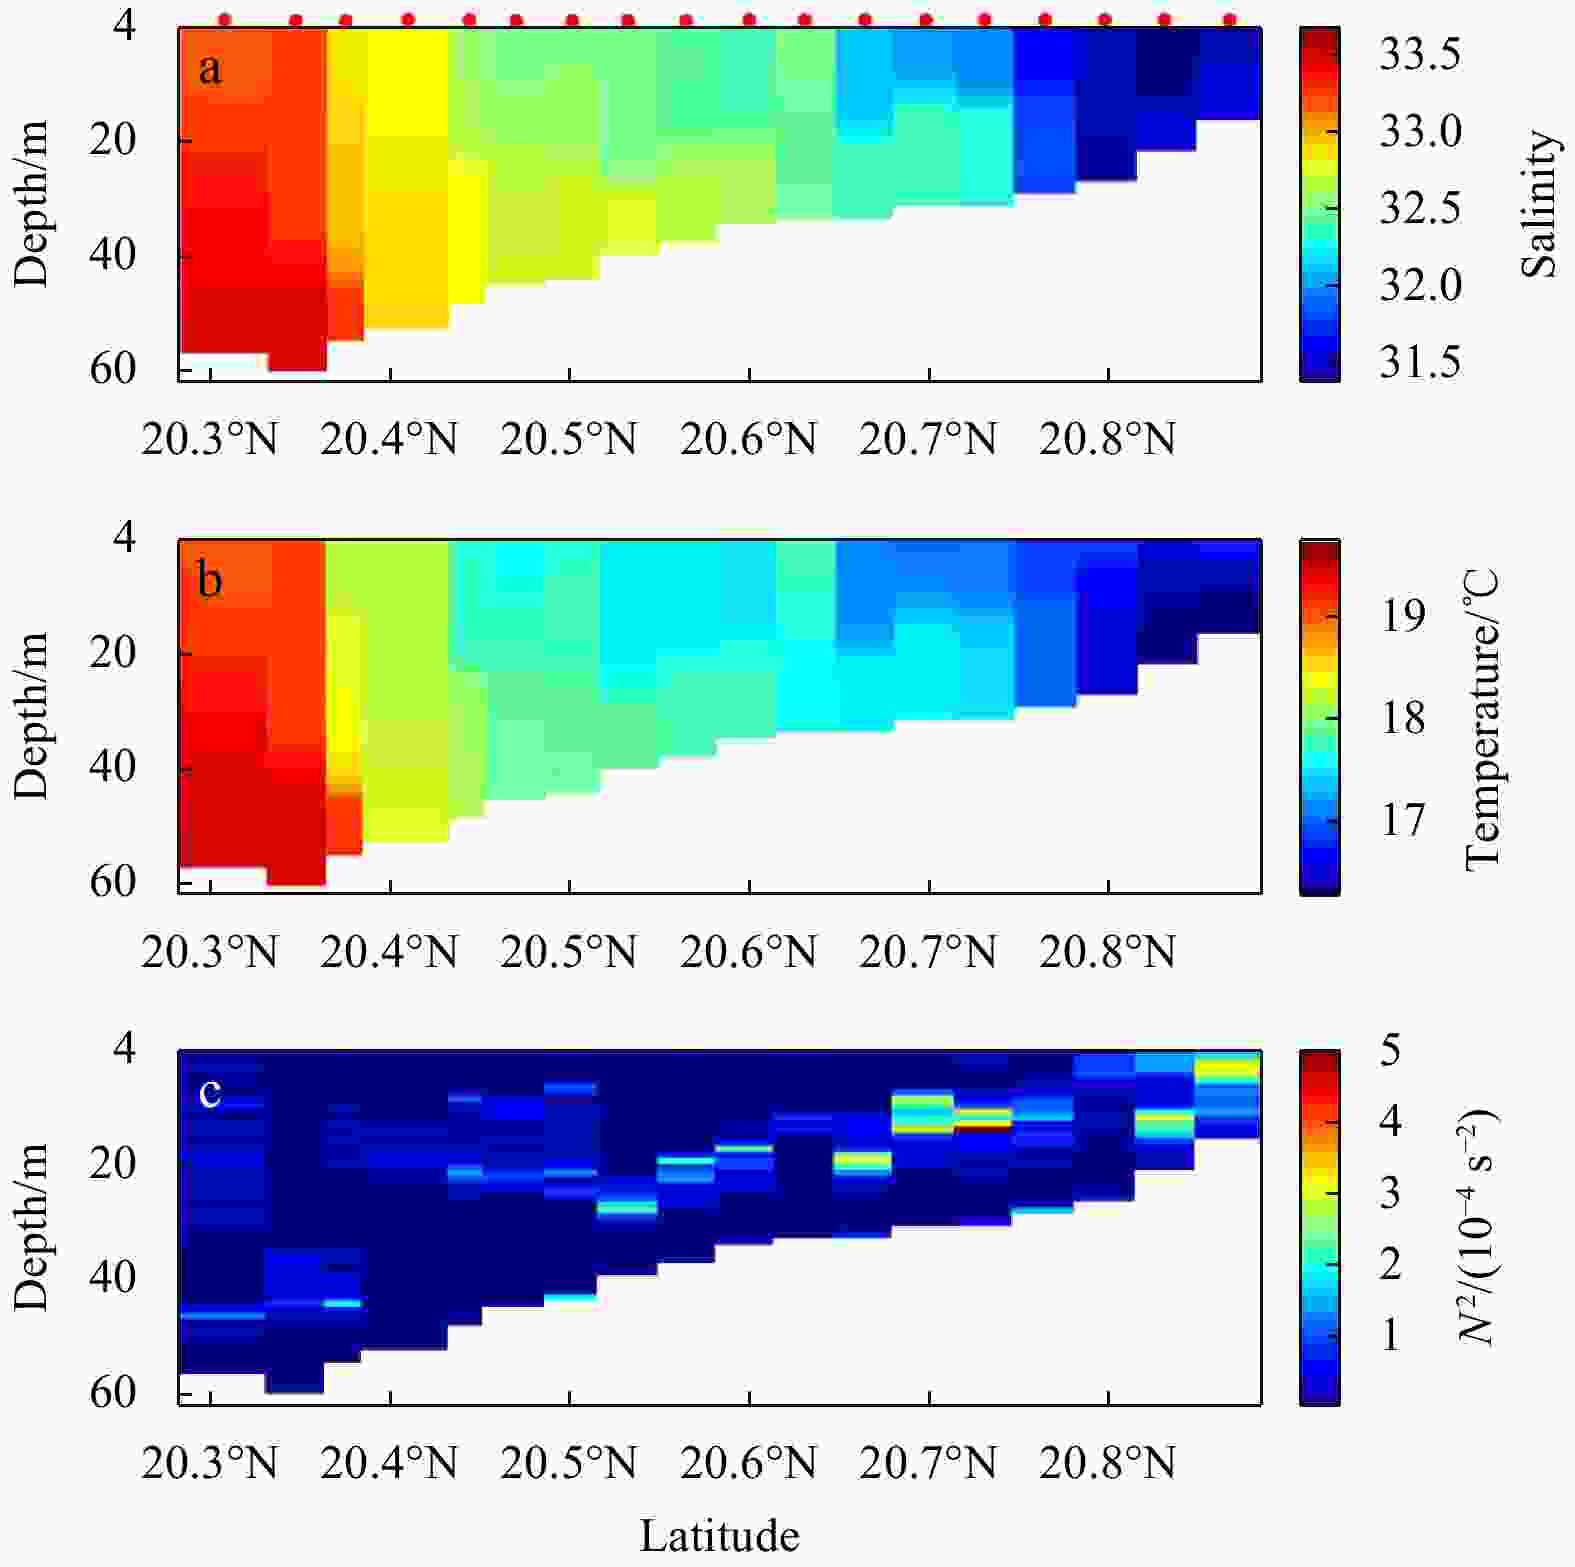
Figure 4. Cruise observed salinity (a), temperature (b) and squared buoyancy frequency (c) along Section SE. Red dots in a indicates stations.
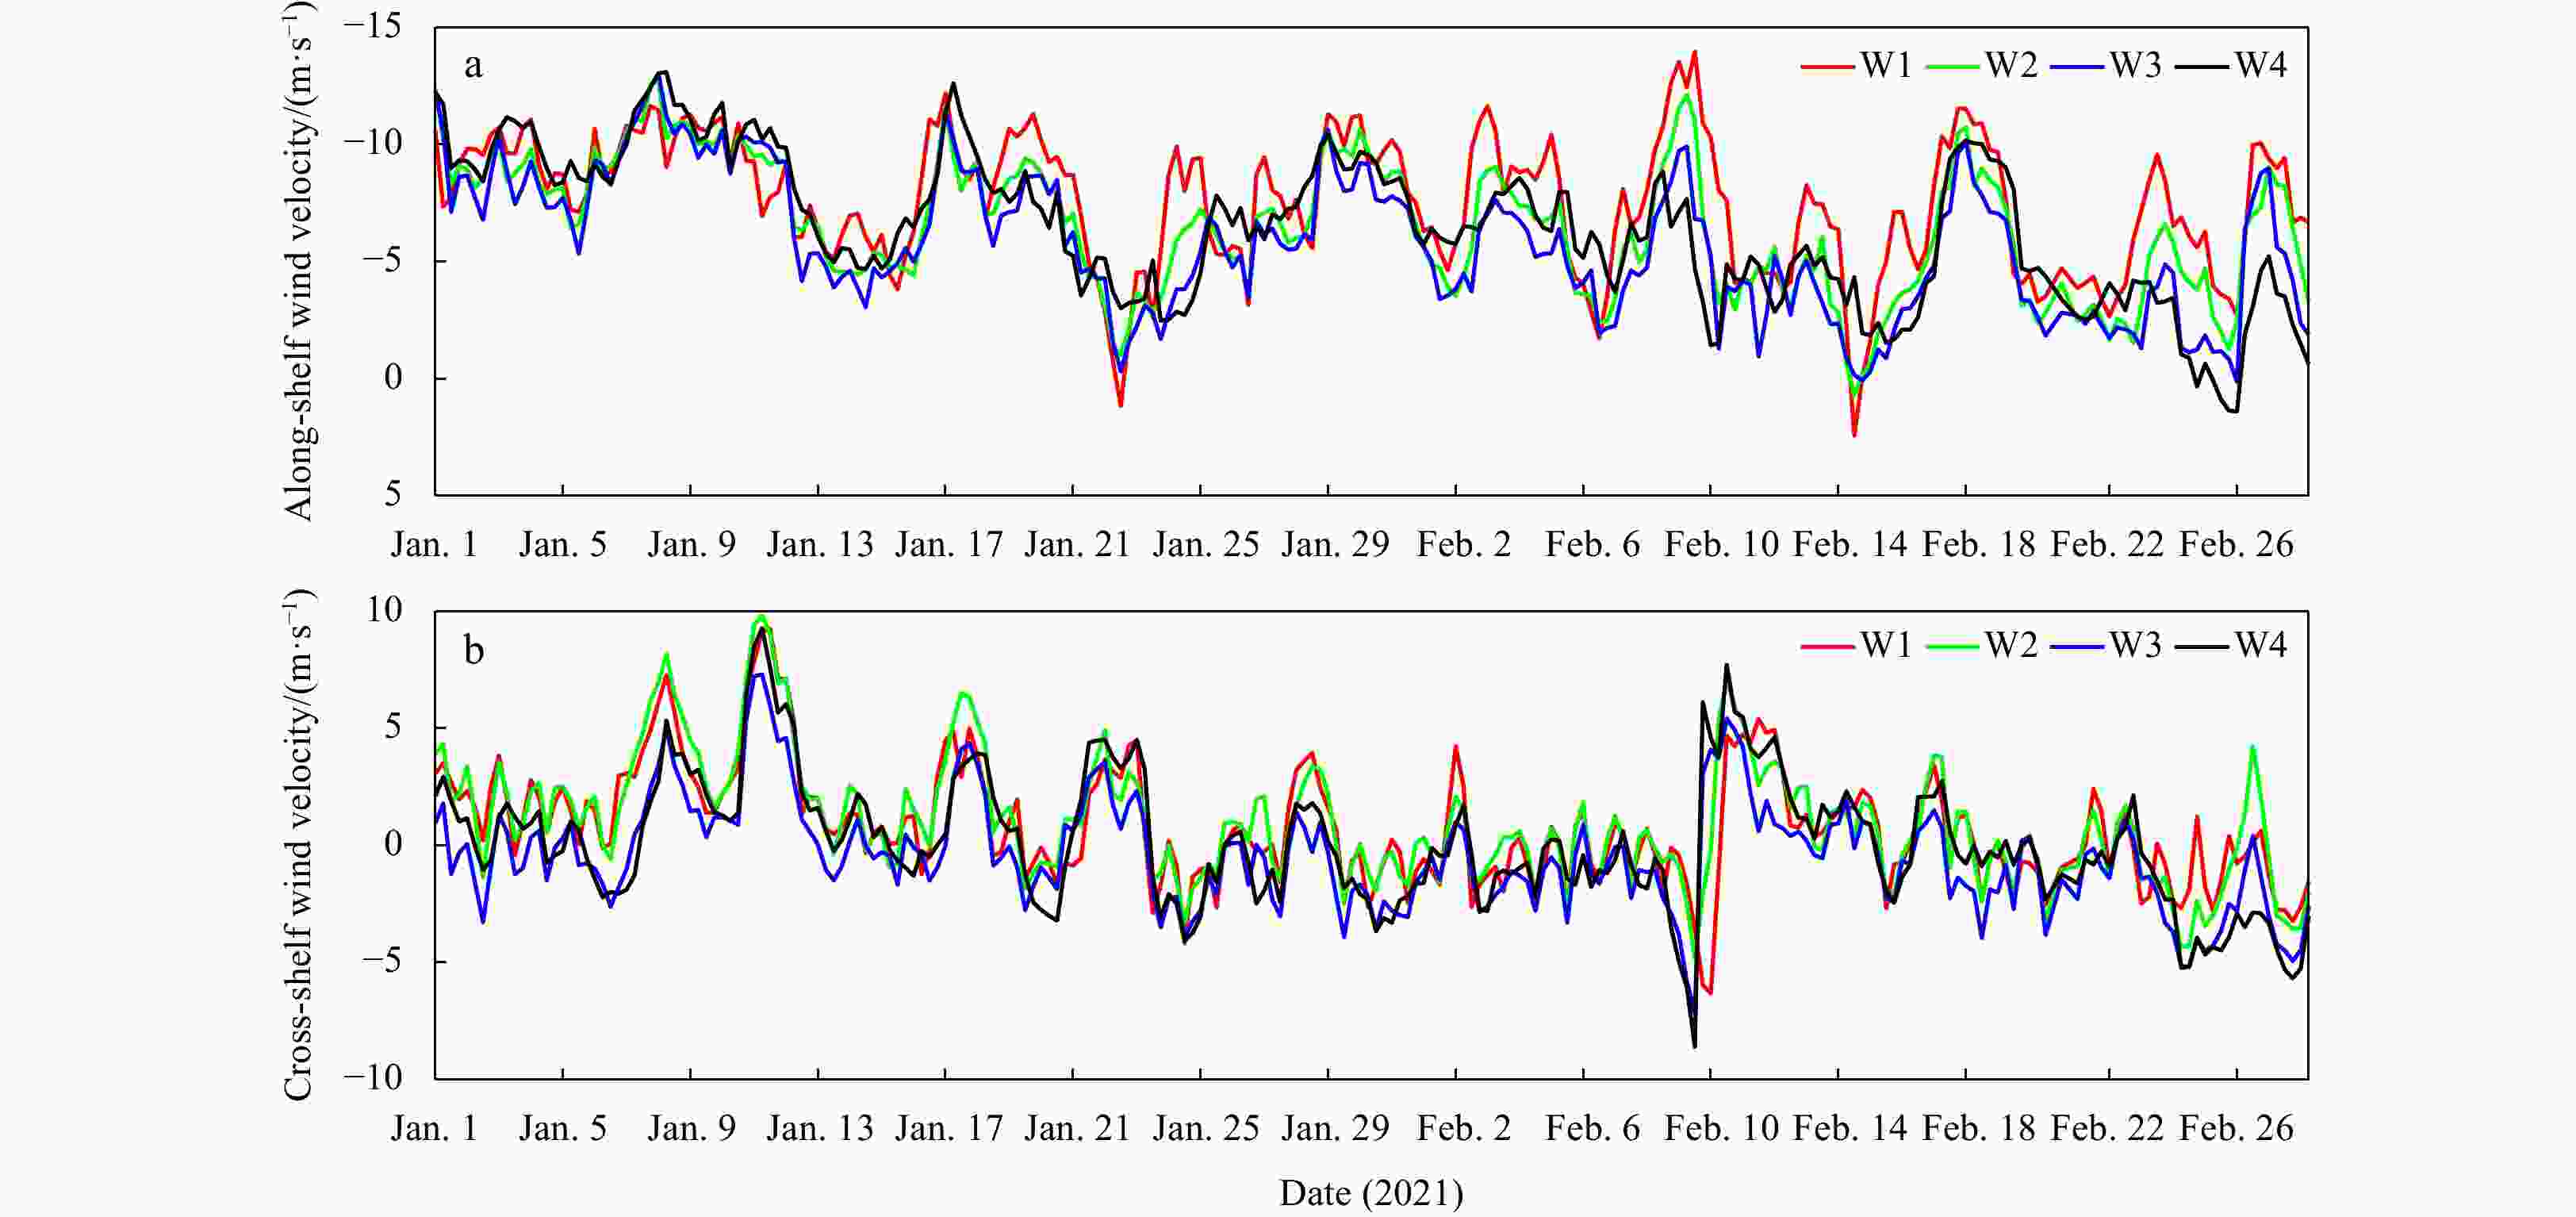
Figure 5. Time series of sea surface wind component derived from CMEMS wind product. a. Along-shelf wind; b. cross-shelf wind at sections W1 (red curve), W2 (green curve), W3 (blue curve) and W4 (black curve).
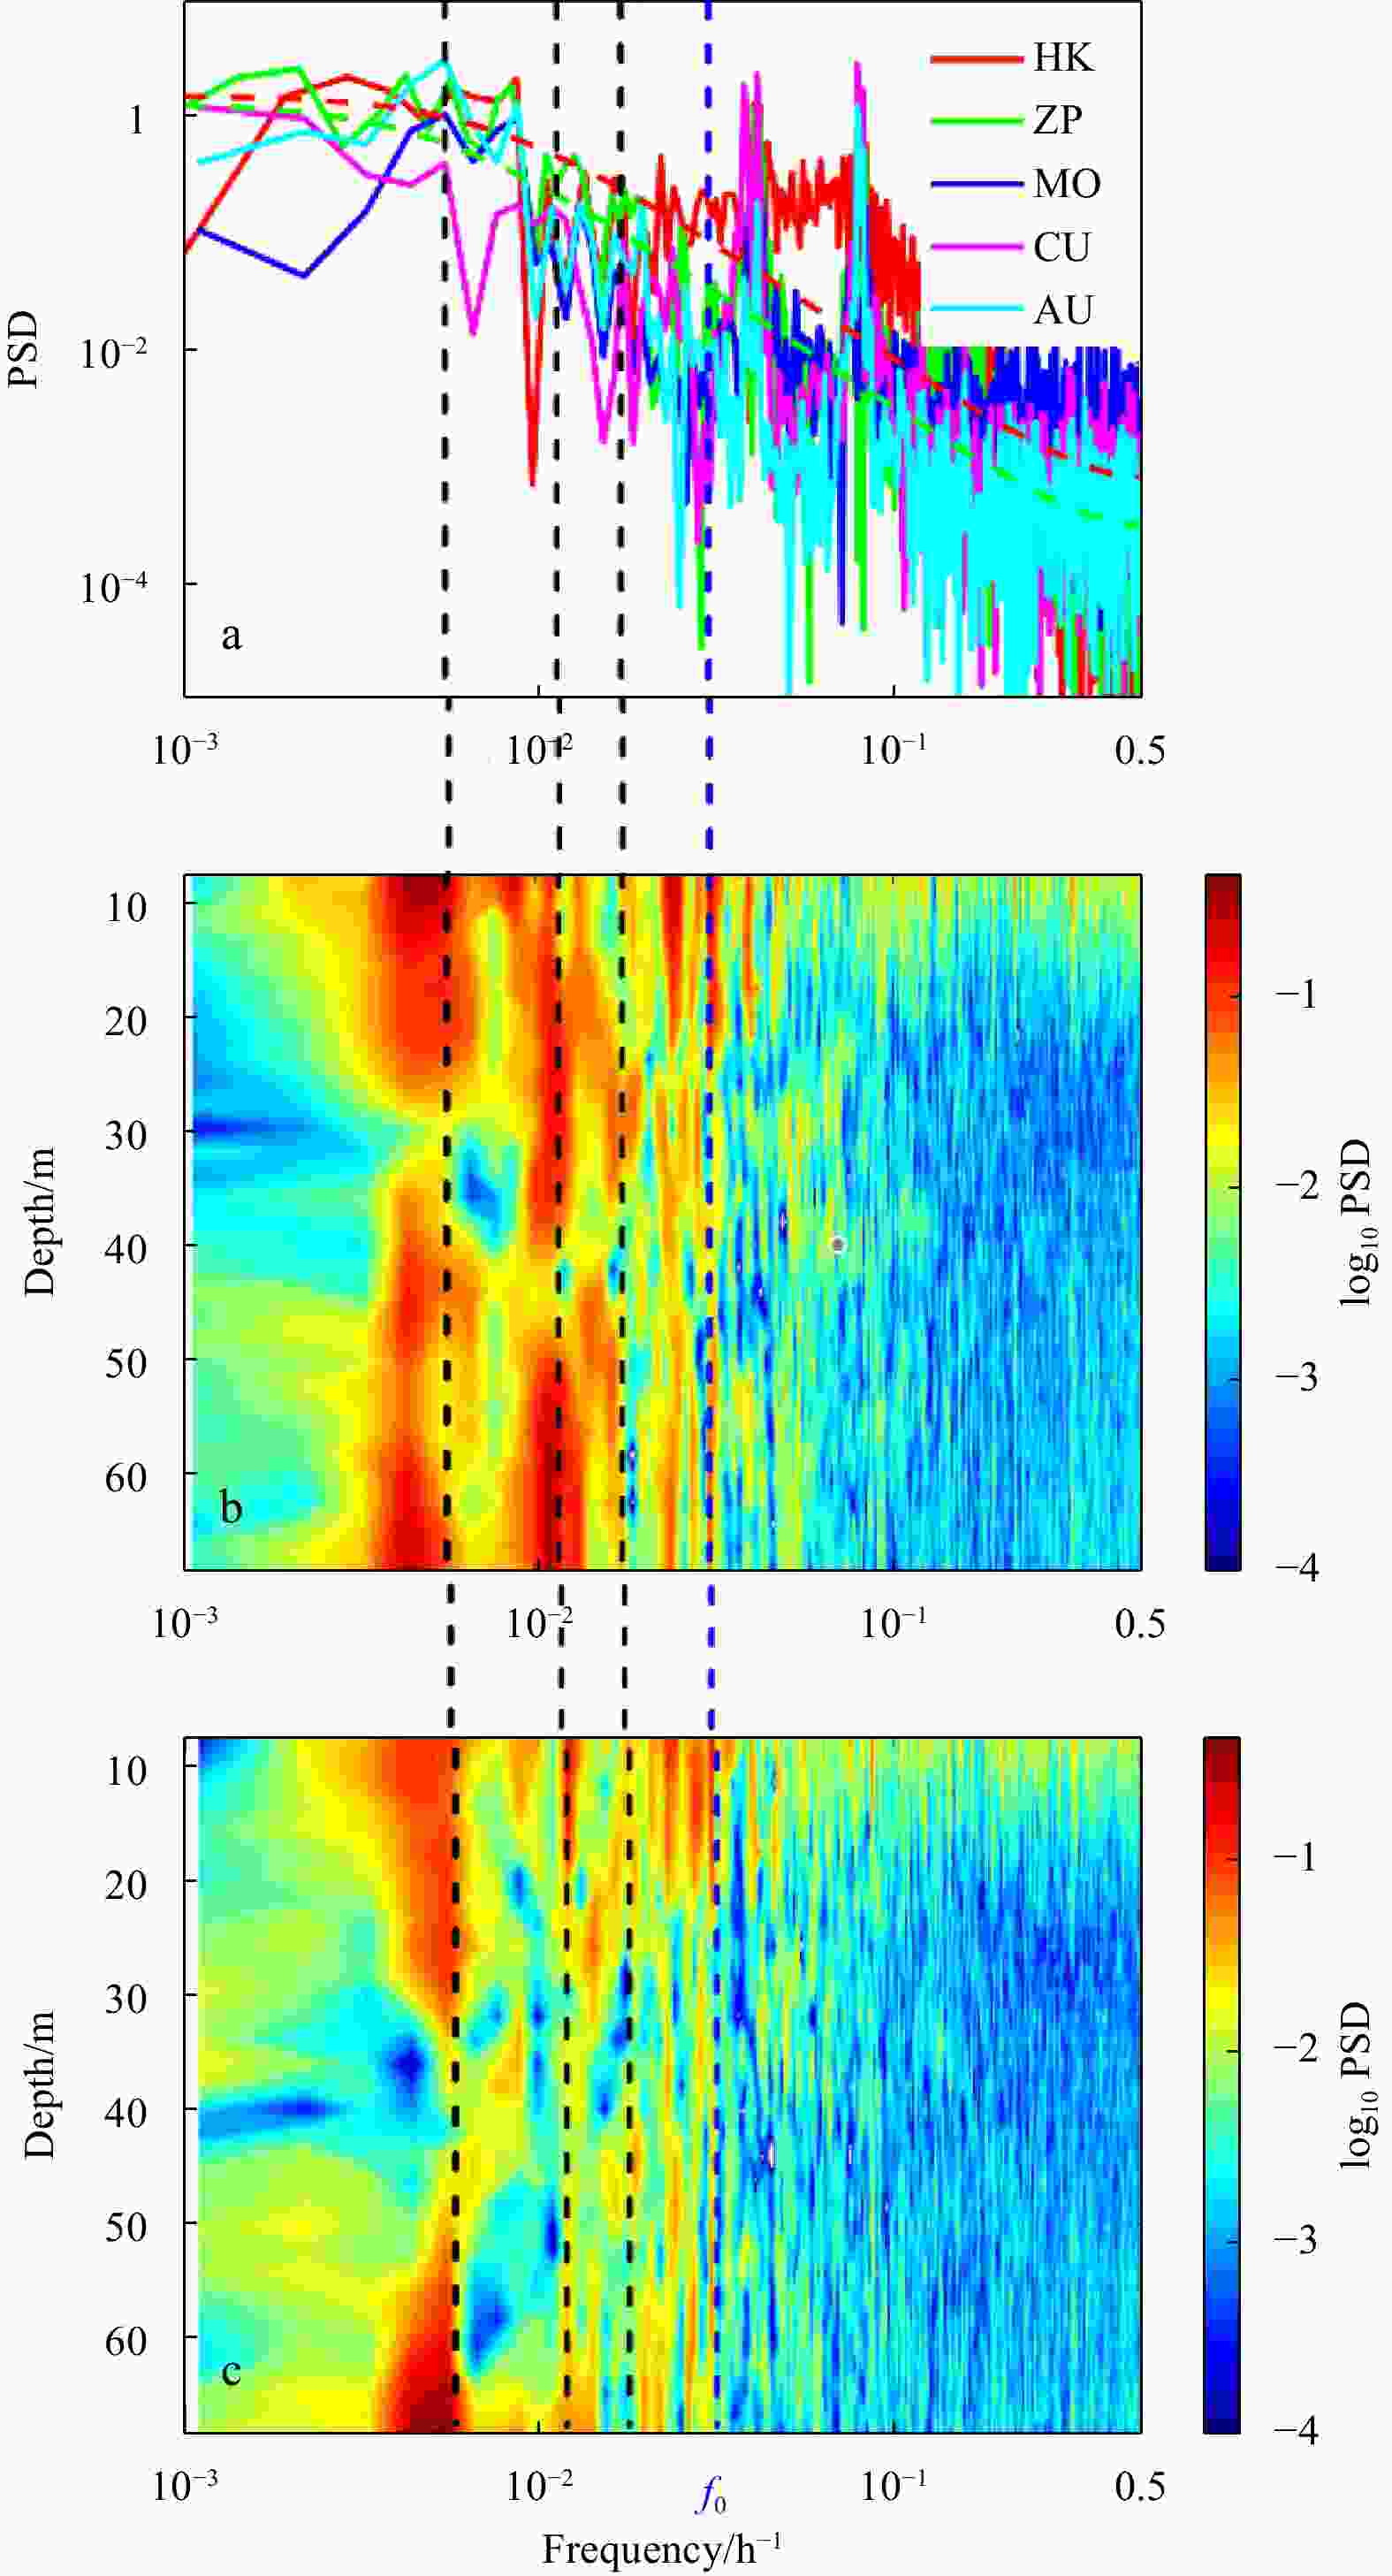
Figure 6. Power spectral density (PSD) of observation data. a. PSD of DSLA at stations HK (red), ZP (green), MO (blue), and that of barotropic current of cross-shelf component (CU, magenta) and along-shelf component (AU, cyan). Green and red dashed lines in a are the 5% significance level against red noise for DSLA at HK and ZP, respectively. PSD of de-tided baroclinic current of cross-shelf (b) and along-shelf components (c). Black dashed lines represent three frequency bands 0.0177 h−1, 0.0106 h−1 and 0.0056 h−1; blue dashed line indicates the inertial frequency band (f0).

Figure 7. Wavelet transforms of DSLA at stations. a. ZP and b. MO, c. along-shelf and d. cross-shelf components of barotropic (BT) current, e. along-shelf and f. cross-shelf components of baroclinic (BC) current at the depth of 14 m. The black and blue dashed lines with arrows and squares point out events and spectral bands. The thick black lines are the 5% significance level against red noise. The power spectrum is normalized, and the unit is 1. The color code represents normalized PSD.
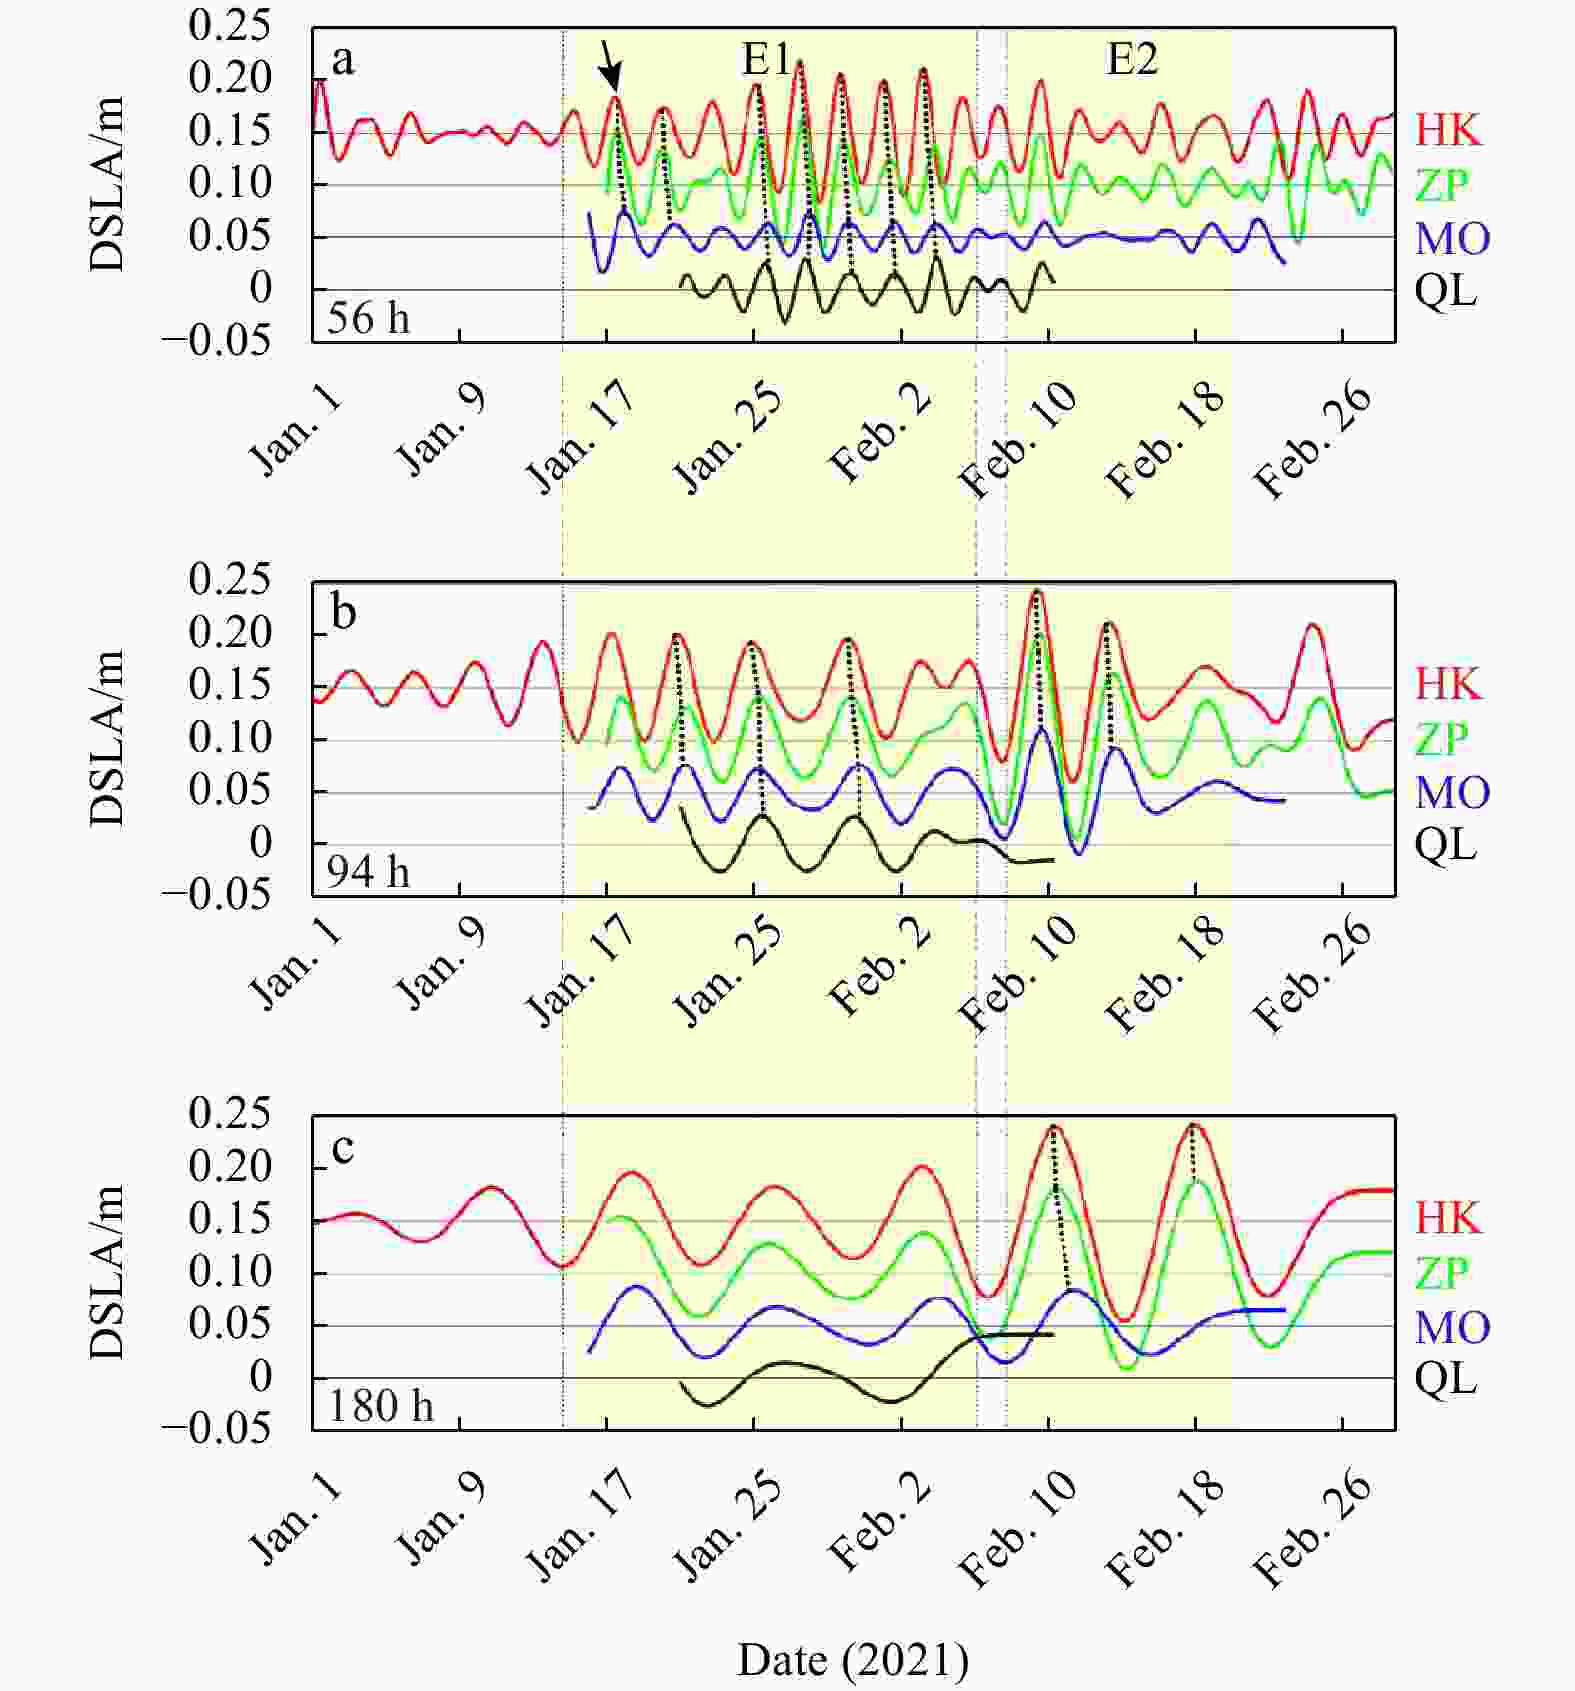
Figure 8. Time series of bandpass DSLA at stations HK, ZP, MO and QL with periods of 56 h (a), 94 h (b) and 180 h (c) derived from 4-order Butterworth filter. Dashed lines with shadow point out E1 and E2. Dashed black curves and arrow indicate the propagation of signals in DSLA. A 4-order Butterworth bandpass filter with frequency cutoffs (−3 dB) at 0.34 d−1 and 0.60 d−1 for 56 h period band, 0.20 d−1 and 0.30 d−1 for 94 h period band, 0.11 d−1 and 0.16 d−1 for 180 h period band.
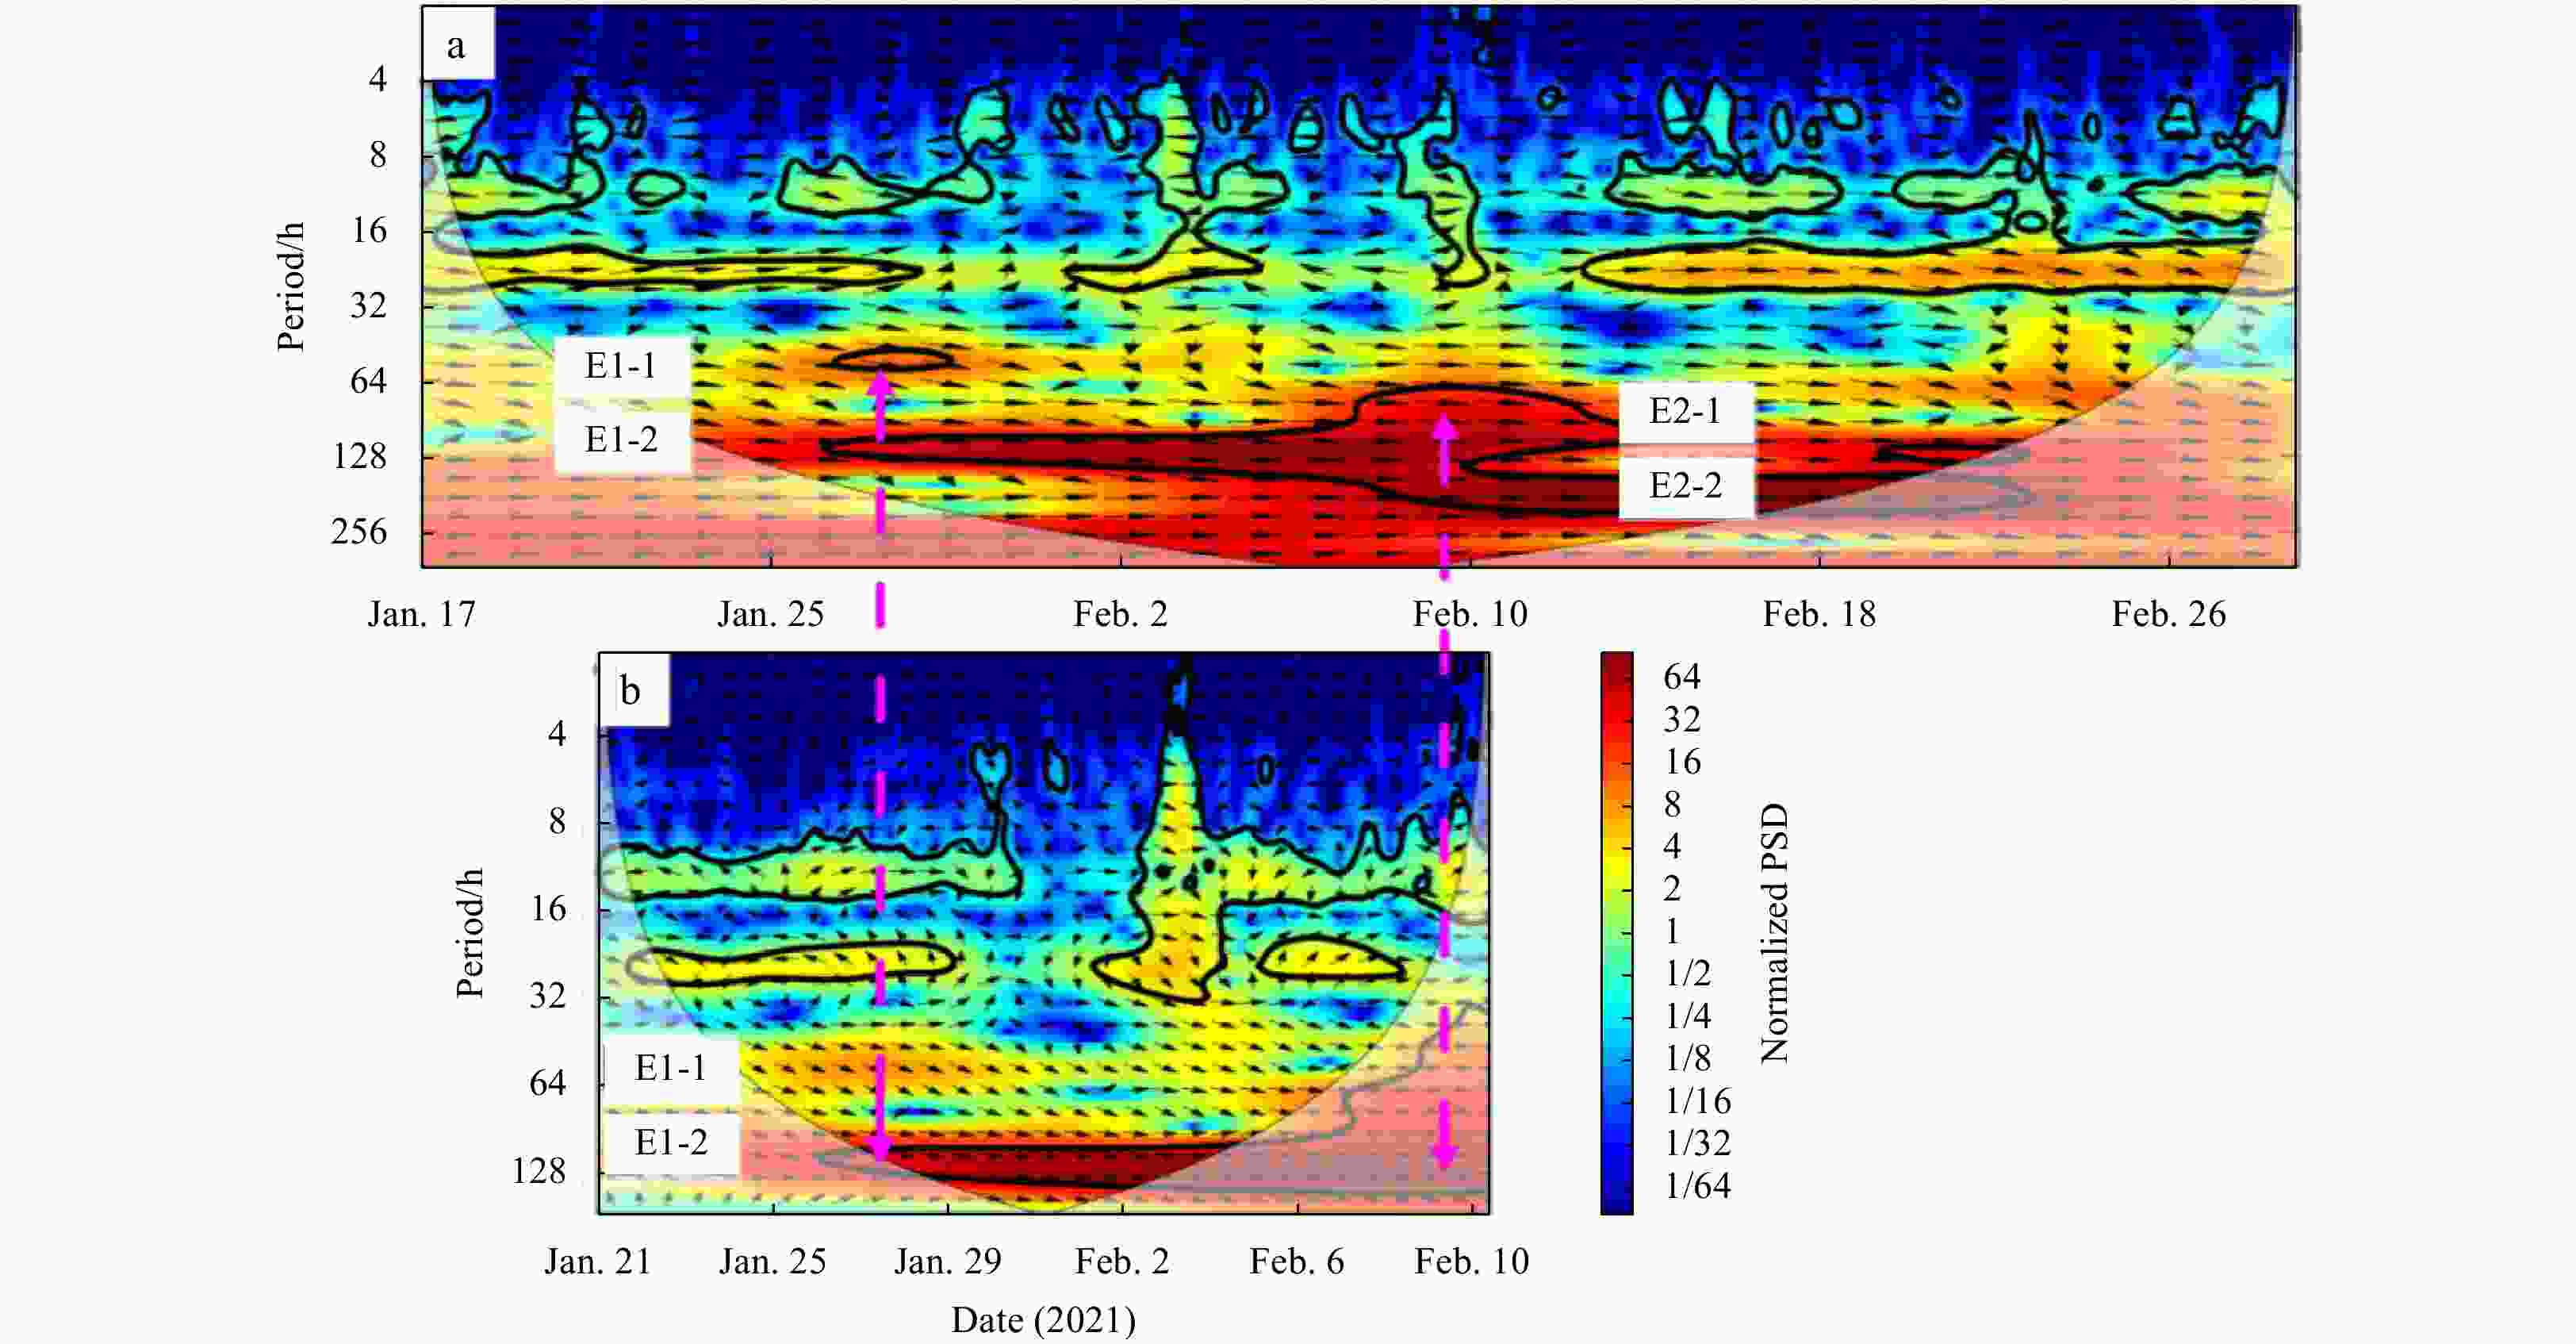
Figure 9. XWT of DSLA for station pairs: HK–ZP (a) and ZP–QL (b). The thick black lines are the 5% significance level against red noise. The thin black lines show the cone of influence (COI). The arrows show the relative phase relationship between two time series with in-phase (anti-phase, leading and lagging) pointing right (left, down and up). Color codes are normalized power spectra. The magenta dashed lines with arrows point out signal events. The power spectrum is normalized, and the unit is 1.

Figure 10. Comparison of dispersion relation derived from this study with the Kelvin mode and the lowest mode of CSW (a); arbitrary amplitude of sea level in cross-shelf direction, the amplitude of sea level calculated from the toolbox (blue curve) and that of Kelvin mode (black curve) (b), arbitrary along-shelf velocity component in cross-shelf direction (c), and mean depth profile between ZP and MO (d). The data points in a are calculated from XWT of DSLA for station pairs. For a, theoretical dispersion relations are derived from the mean depth profile (blue curve) as shown in d. Black curve in d represents the idealized depth profile.
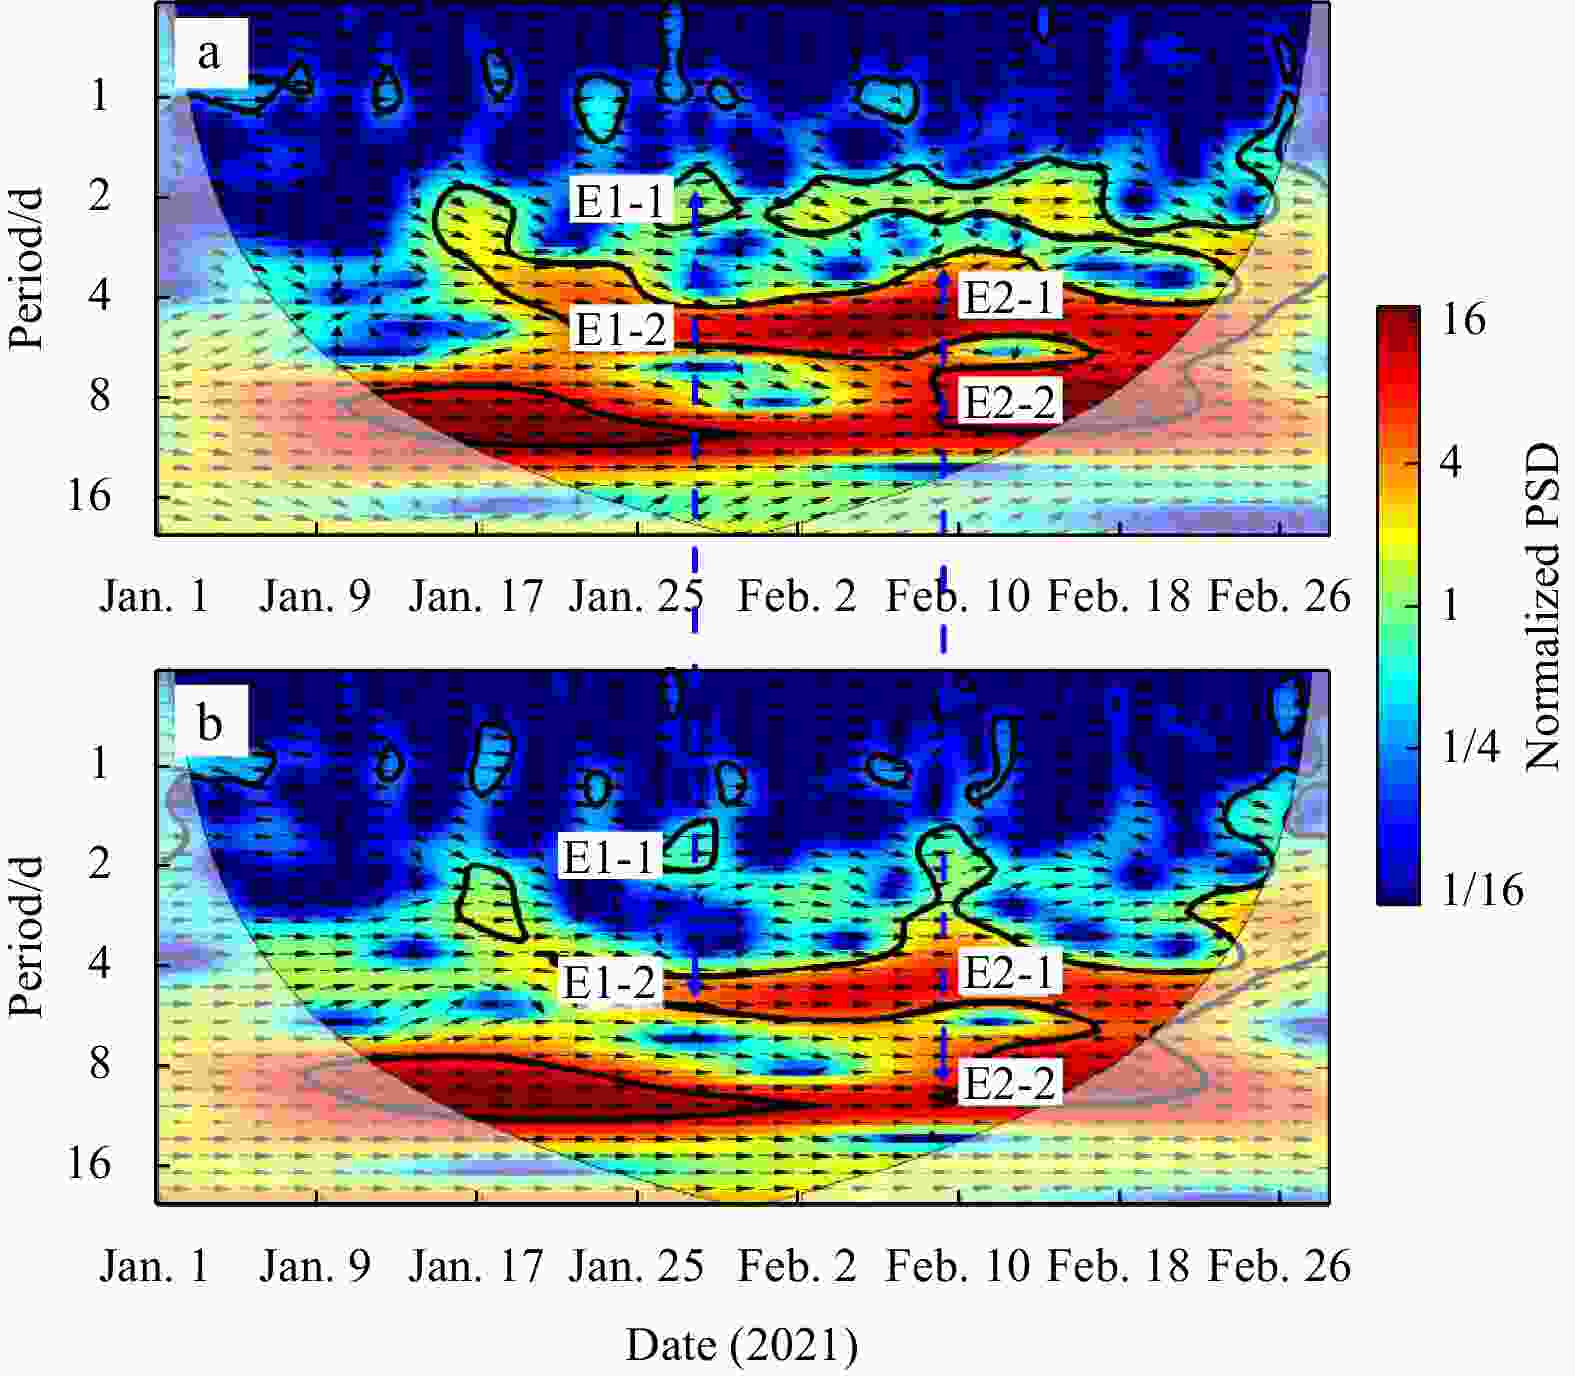
Figure 11. XWT of along-shelf velocity component of sea surface wind for section pairs W1–W2 (a) and W2–W3 (b). The thick line is the 5% significance level against red noise. The thin line shows the cone of influence (COI). The arrows show the relative phase relationship between two time series with in-phase (anti-phase, leading and lagging) pointing right (left, down and up). Color codes are normalized power spectra. The blue lines with arrows point out CSW events. The power spectrum is normalized, and the unit is 1.
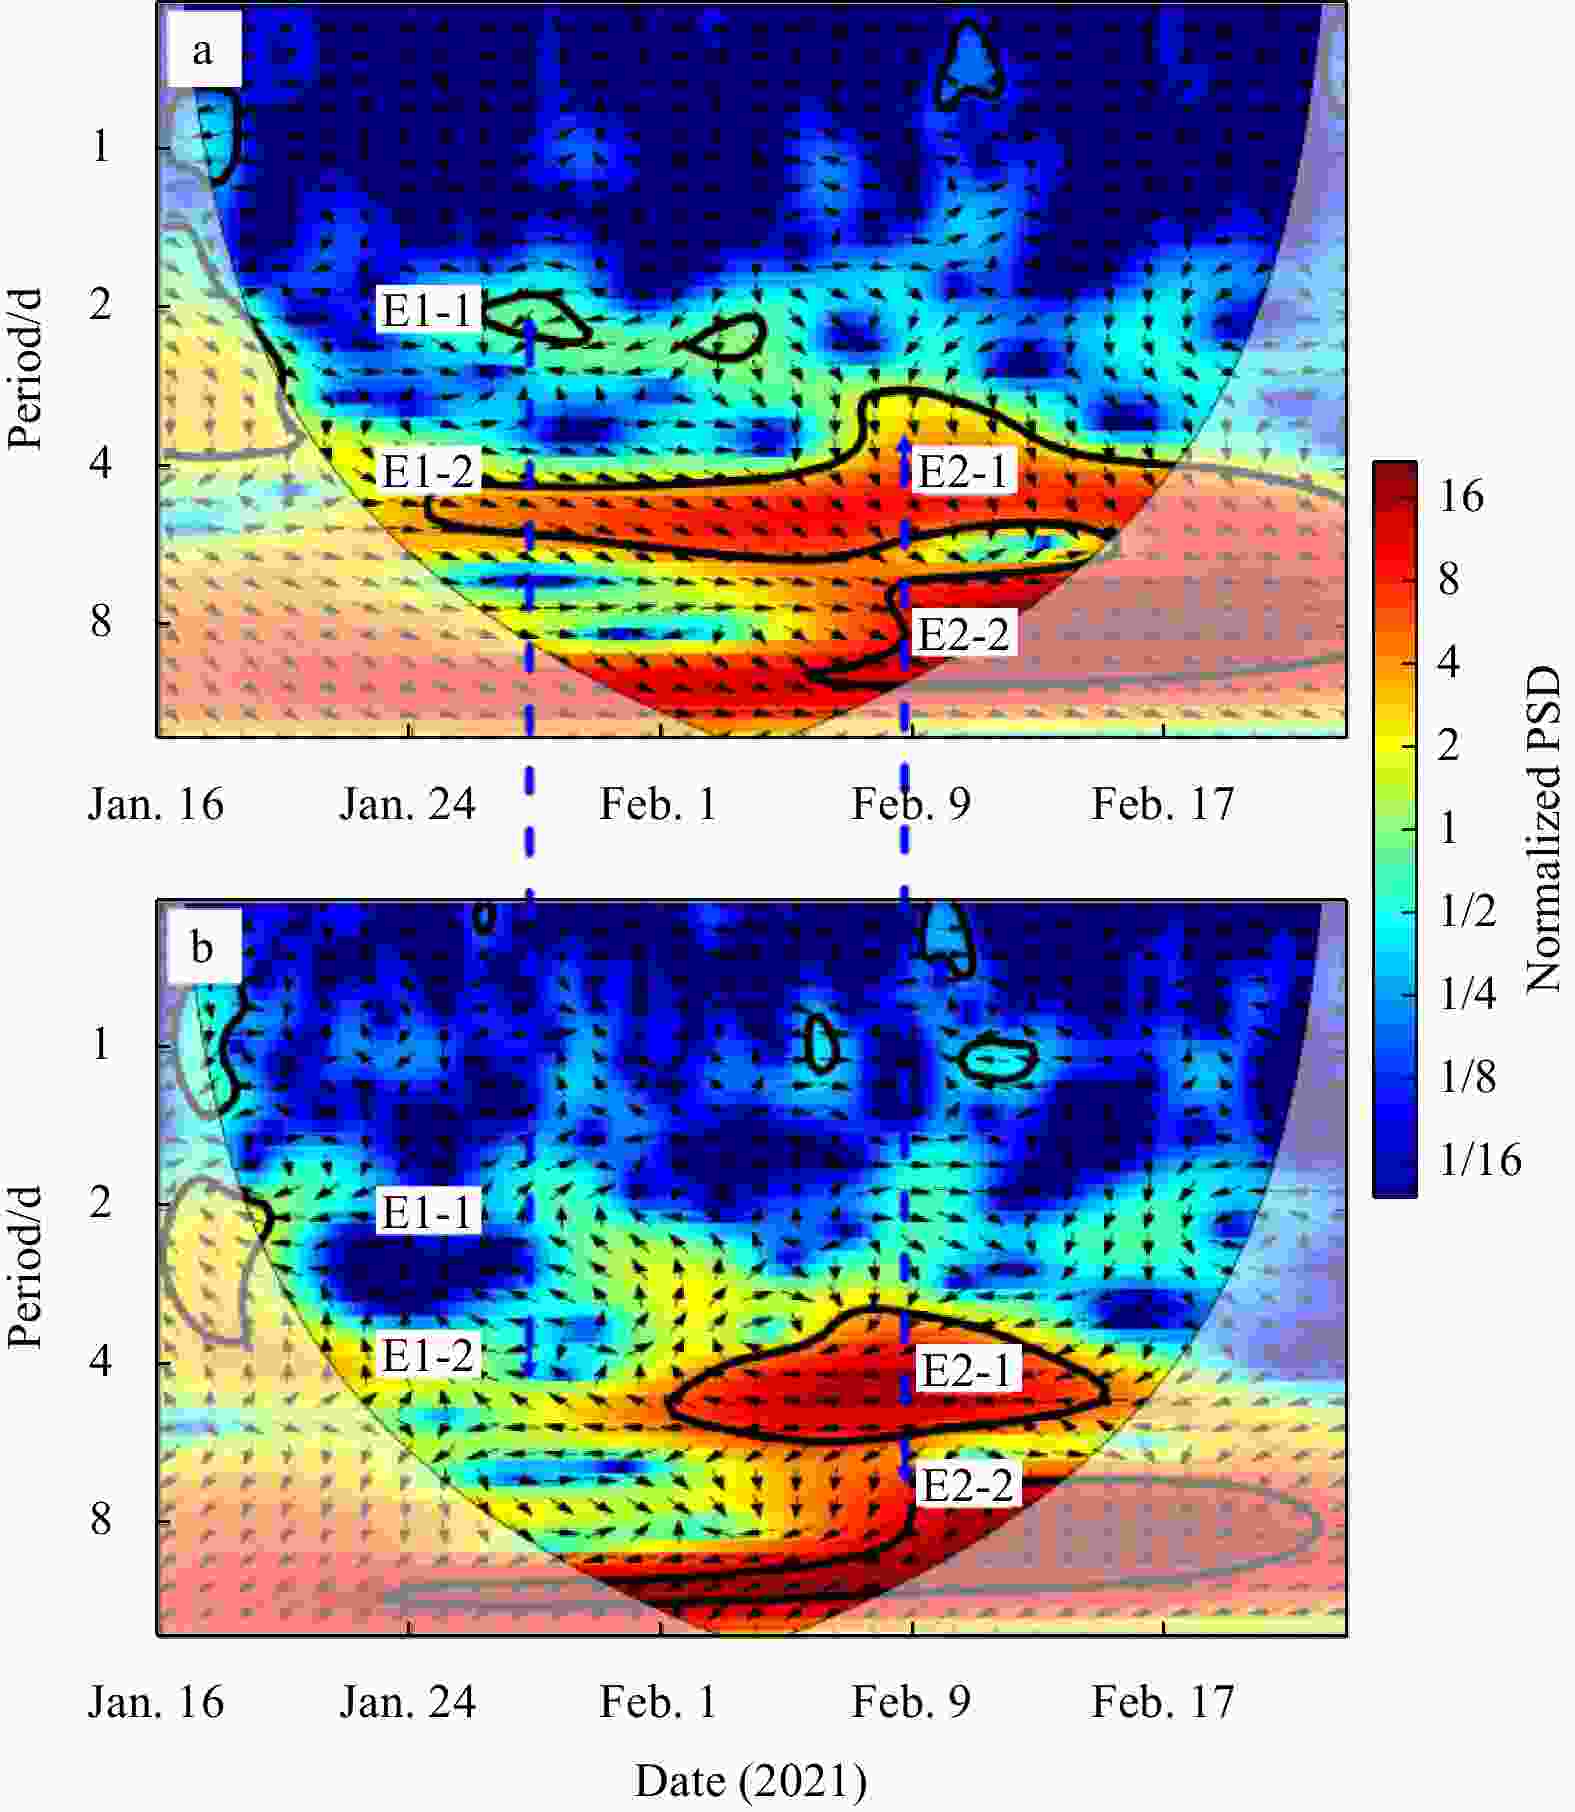
Figure 12. XWT of along-shelf wind component at section W3 with cross-shelf (a) and along-shelf (b) velocities measured by mooring station MO. The thick line is the 5% significance level against red noise. The thin line shows the cone of influence (COI). The arrows show the relative phase relationship between two time series with in-phase (anti-phase, leading and lagging) pointing right (left, down and up). Color codes are normalized power spectra. The blue dashed lines with arrows point out CSW events. The power spectrum is normalized, and the unit is 1. The color code represents normalized PSD.
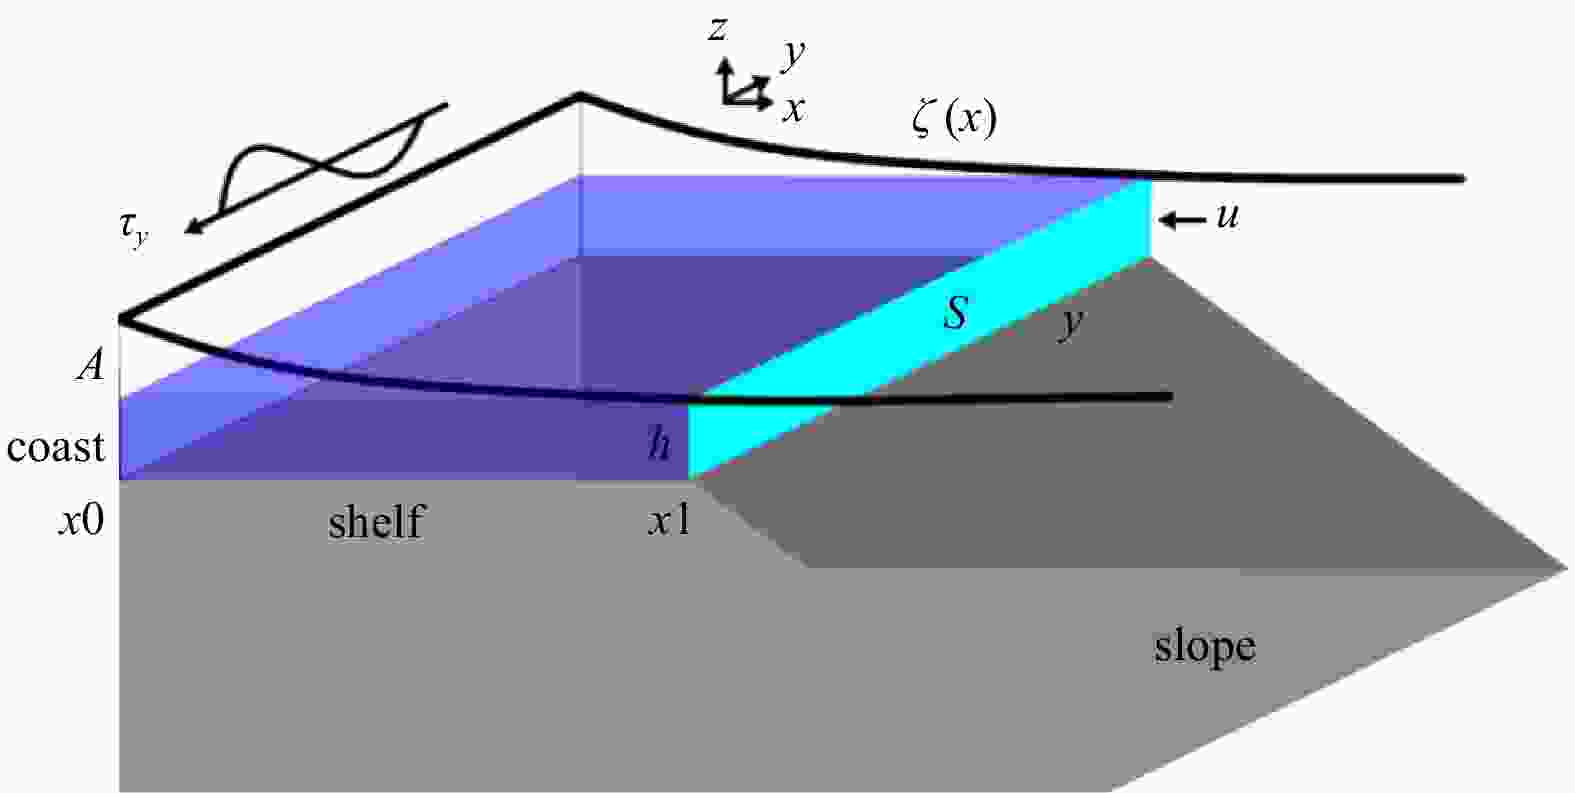
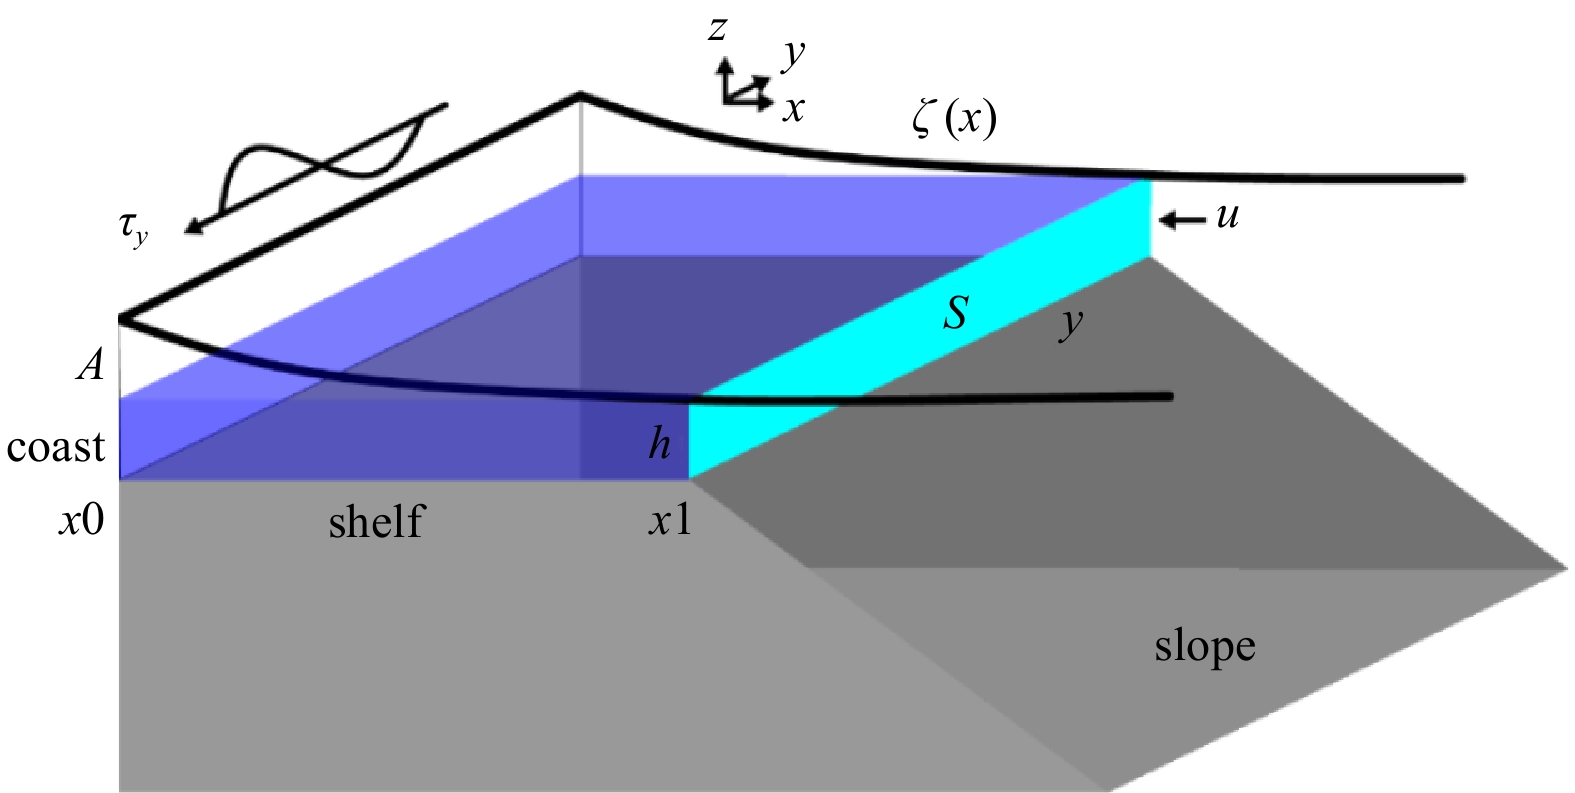
Figure 13. Sketch of the wind-driven sea surface fluctuation and Ekman transport over the continental shelf.
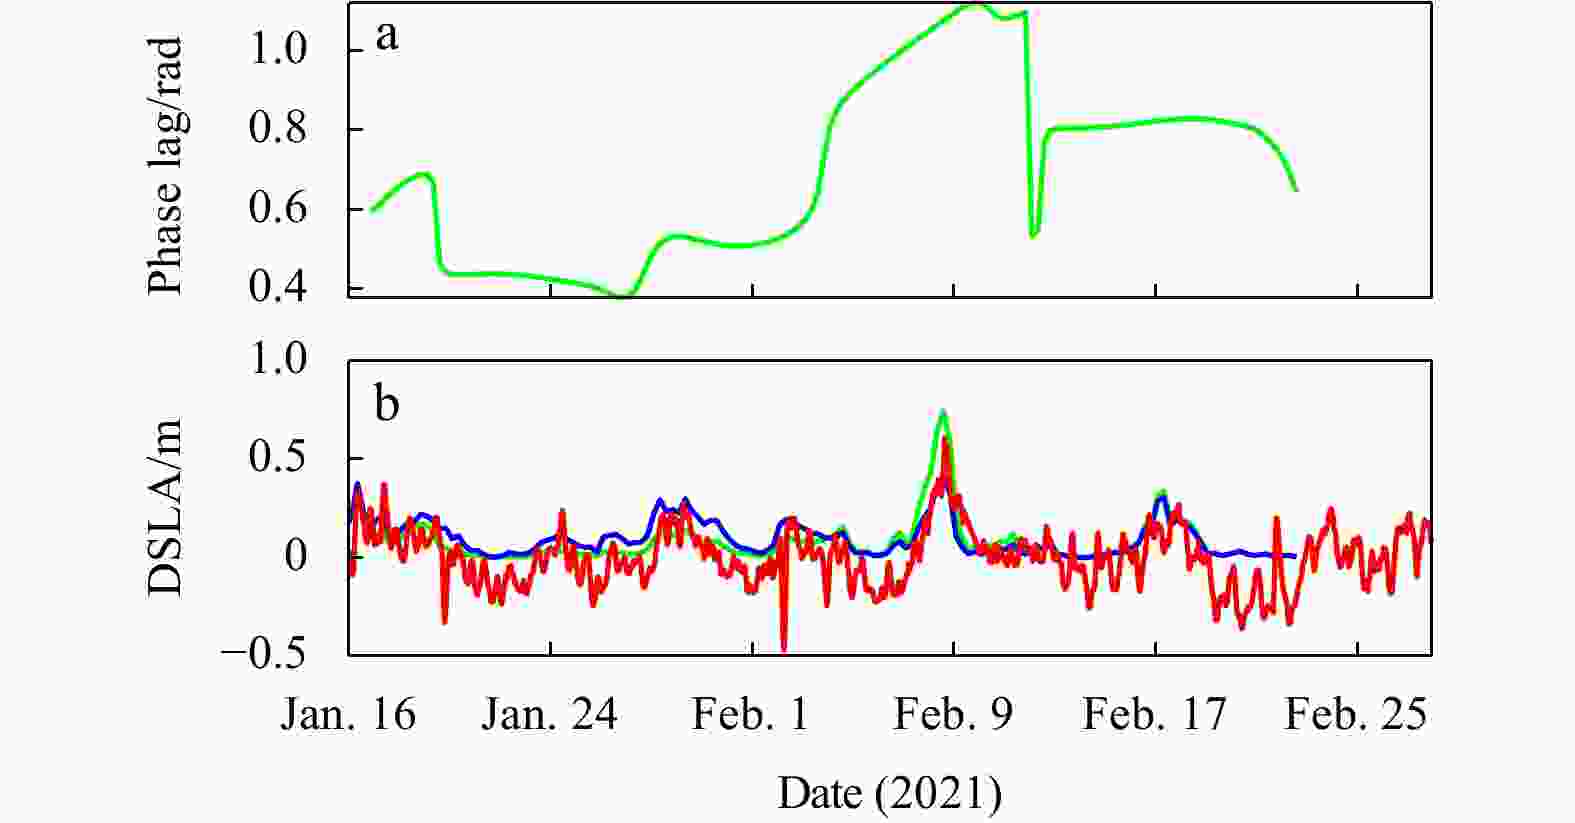
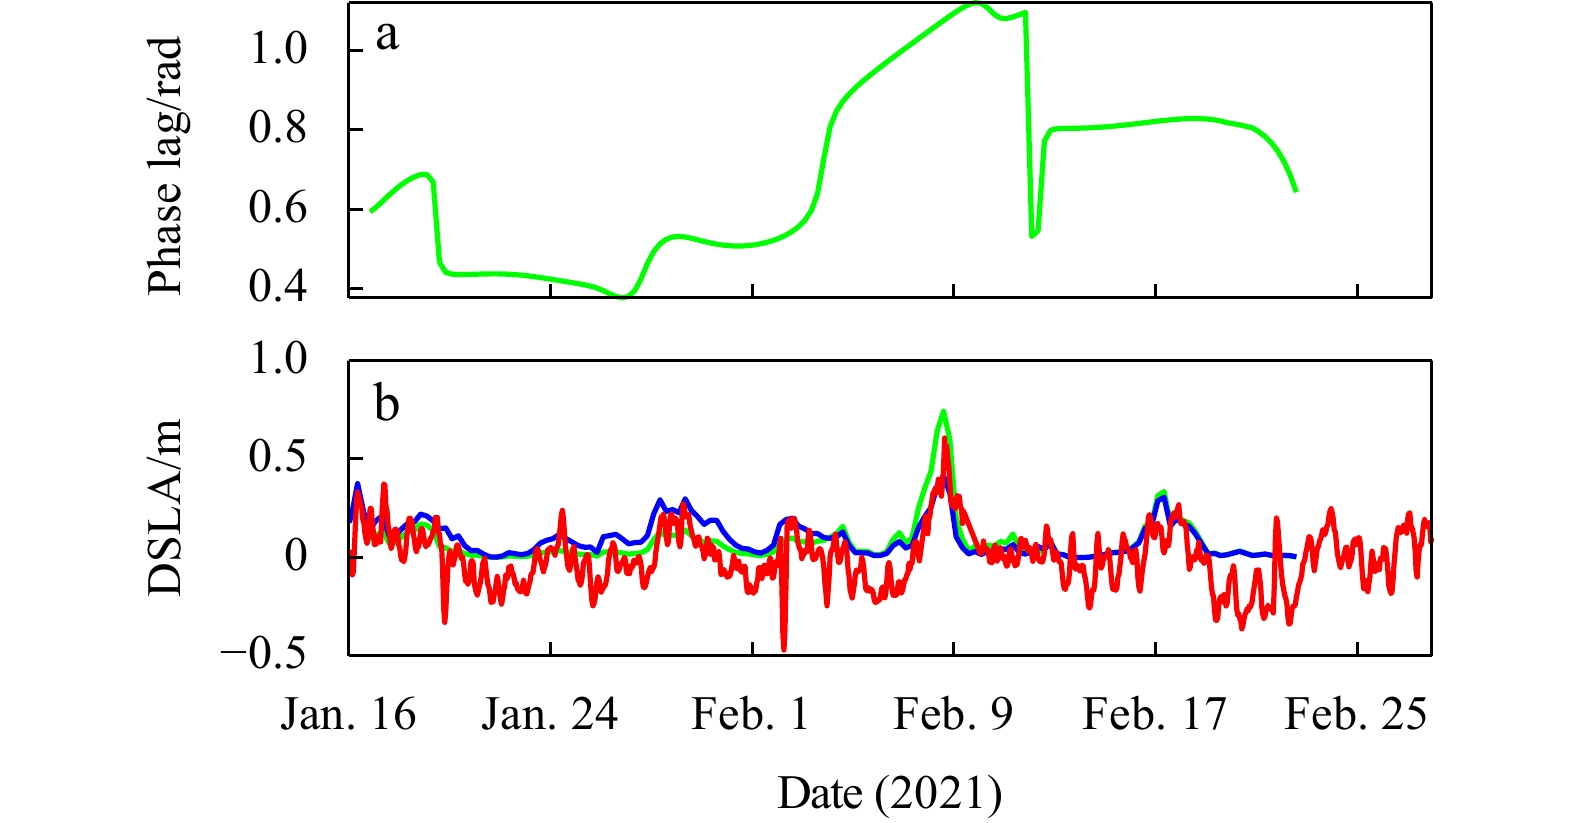
Figure 14. Phase lag between sea surface fluctuation and along-shelf wind from Fig. 12a (a); comparison of the DSLA at station ZP (red curve) with amplitude of sea surface fluctuation with the fixed phase of π/4 (blue curve), and amplitude of sea surface fluctuation (green curve) calculated with the phase lag in a (b).
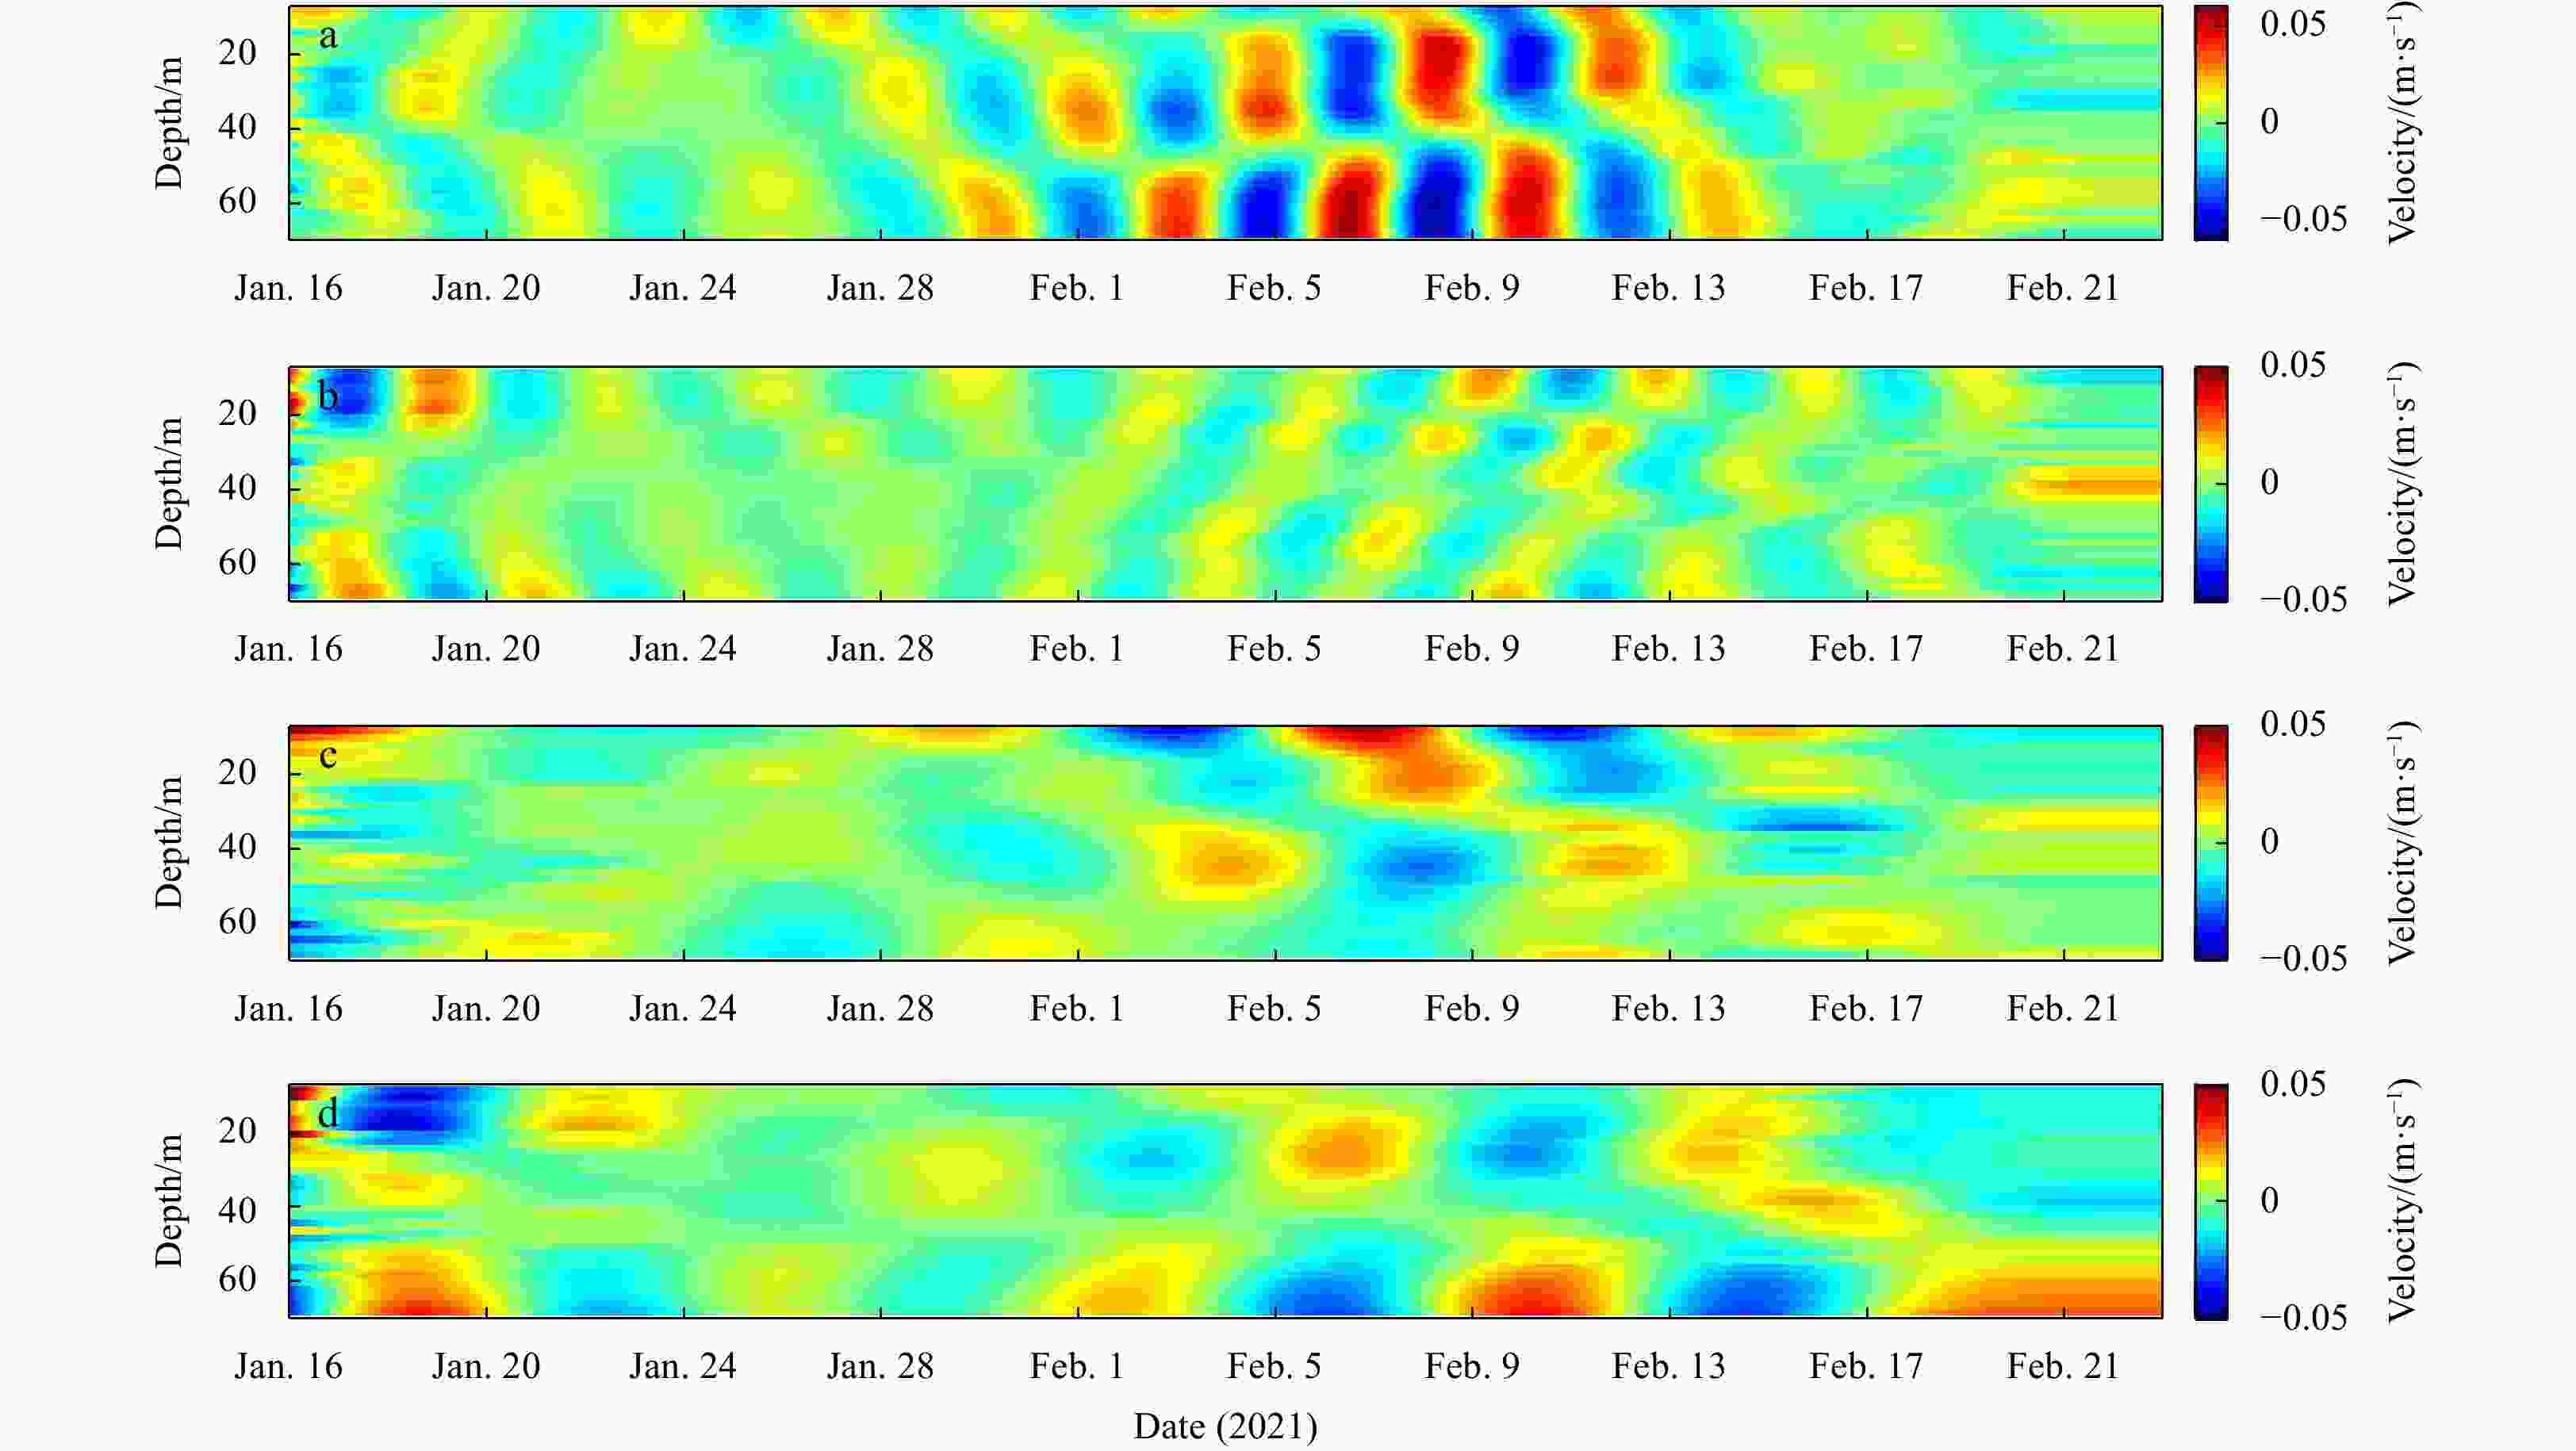
Figure 15. Bandpass cross-shelf current (a), along-shelf current velocity (b) distribution with a central period of 90 h, and bandpass cross-shelf current (c) and along-shelf current velocity (d) distribution with a central period of 190 h.
Table 1. XWT of DSLA at different station pairs
Station Distance/km Event Period/h Time lag/h Phase speed/(m∙s-1) HK–ZP 225 E1-1 56 4.6 ± 0.5 13.6 ± 1.6 E1-2 119 9.1 ± 3.8 6.9 ± 4.9 E2-1 91 3.3 ± 0.7 18.9 ± 5.1 E2-2 181 4.3 ± 1.1 14.5 ± 5.0 ZP–QL 174 E1-1 56 5.9 ± 0.7 8.2 ± 1.1 E1-2 119 2.9 ± 1.0 16.7 ± 8.7  下载: 导出CSV
Table 2. XWT of along-shelf wind at different station pairs
Station Distance/km Event Period/h Time lag/h Phase speed/(m∙s−1) W1–W2 225 E1-1 56 –2.3 ± 0.2 –27.2 ± 2.1 E1-2 119 3.6 ± 1.2 17.4 ± 4.4 E2-1 91 –3.9 ± 0.5 –16.0 ± 1.8 E2-2 181 3.3 ± 0.1 18.9 ± 0.5 W2–W3 73 E1-1 56 –0.2 ± 0.4 –101.4 ± 67.6 E1-2 119 3.0 ± 0.4 6.8 ± 0.8 E2-1 91 0.7 ± 0.5 29.0 ± 12.1 E2-2 181 3.1 ± 0.1 6.5 ± 0.2
下载: 导出CSV
-
Brink K H, Chapman D C. 1985. Programs for computing properties of coastal-trapped waves and wind-driven motions over the continental shelf and slope. Woods Hole: Woods Hole Oceanographic Institution Chen Dake, Su Jilan. 1987. Continental shelf waves along the coasts of China. Acta Oceanologica Sinica (in Chinese), 9(3): 317–334 Ding Yang, Bao Xianwen, Shi Maochong. 2012. Characteristics of coastal trapped waves along the northern coast of the South China Sea during year 1990. Ocean Dynamics, 62(9): 1259–1285, doi: 10.1007/s10236-012-0563-3 Garratt J R. 1977. Review of drag coefficients over oceans and continents. Monthly Weather Review, 105(7): 915–929, doi: 10.1175/1520-0493(1977)105<0915:RODCOO>2.0.CO;2 Grinsted A, Moore J C, Jevrejeva S. 2004. Application of the cross wavelet transform and wavelet coherence to geophysical time series. Nonlinear Processes in Geophysics, 11(5/6): 561–566 Hellerman S, Rosenstein M. 1983. Normal monthly wind stress over the world ocean with error estimates. Journal of Physical Oceanography, 13(7): 1093–1104, doi: 10.1175/1520-0485(1983)013<1093:NMWSOT>2.0.CO;2 Hsueh Y, Romea R D. 1983. Wintertime winds and coastal sea-level fluctuations in the Northeast China Sea. Part I: observations. Journal of Physical Oceanography, 13(11): 2091–2106, doi: 10.1175/1520-0485(1983)013<2091:WWACSL>2.0.CO;2 Hsueh Y, Romea R D, DeWitt P W. 1986. Wintertime winds and coastal sea-level fluctuations in the Northeast China Sea. Part II: Numerical model. Journal of Physical Oceanography, 16(2): 241–261, doi: 10.1175/1520-0485(1986)016<0241:WWACSL>2.0.CO;2 Huang Daji, Zeng Dingyong, Ni Xiaobo, et al. 2016. Alongshore and cross-shore circulations and their response to winter monsoon in the western East China Sea. Deep-Sea Research Part II: Topical Studies in Oceanography, 124: 6–18, doi: 10.1016/j.dsr2.2015.01.001 Jacobs G A, Preller R H, Riedlinger S K, et al. 1998. Coastal wave generation in the Bohai Bay and propagation along the Chinese coast. Geophysical Research Letters, 25(6): 777–780, doi: 10.1029/97GL03636 Li Li. 1993. A study of winter subtidal sea level fluctuation along the northern coast of the South China Sea. Tropic Oceanology (in Chinese), 12(3): 52–60 Li Junyi, Zheng Quanan, Hu Jianyu, et al. 2015. Wavelet analysis of coastal-trapped waves along the China coast generated by winter storms in 2008. Acta Oceanologica Sinica, 34(11): 22–31, doi: 10.1007/s13131-015-0701-0 Li Junyi, Zheng Quanan, Hu Jianyu, et al. 2016. A case study of winter storm-induced continental shelf waves in the northern South China Sea in winter 2009. Continental Shelf Research, 125: 127–135, doi: 10.1016/j.csr.2016.06.013 Li Junyi, Zheng Quanan, Li Min, et al. 2021. Spatiotemporal distributions of ocean color elements in response to tropical cyclone: a case study of Typhoon Mangkhut (2018) past over the northern South China Sea. Remote Sensing, 13(4): 687, doi: 10.3390/rs13040687 Lin Wenqiang, Lin Hongyang, Hu Jianyu, et al. 2022. Relative contributions of open-ocean forcing and local wind to sea level variability along the west coasts of ocean basins. Journal of Geophysical Research: Oceans, 127(11): e2022JC019218, doi: 10.1029/2022JC019218 Lin Xiaopei, Yang Jiayan. 2011. An asymmetric upwind flow, Yellow Sea Warm Current: 2. Arrested topographic waves in response to the northwesterly wind. Journal of Geophysical Research: Oceans, 116(C4): C04027 Lin Xiaopei, Yang Jiayan, Guo Jingsong, et al. 2011. An asymmetric upwind flow, Yellow Sea Warm Current: 1. New observations in the western Yellow Sea. Journal of Geophysical Research: Oceans, 116(C4): C04026 Pawlowicz R, Beardsley B, Lentz S. 2002. Classical tidal harmonic analysis including error estimates in MATLAB using T_TIDE. Computers & Geosciences, 28(8): 929–937 Pedlosky J. 1987. Geophysical Fluid Dynamics. 2nd ed. New York: Springer, 628–636 Schulz Jr W J, Mied R P, Snow C M. 2012. Continental shelf wave propagation in the Mid-Atlantic Bight: a general dispersion relation. Journal of Physical Oceanography, 42(4): 558–568, doi: 10.1175/JPO-D-11-098.1 Shen Junqiang, Qiu Yun, Zhang Shanwu, et al. 2017. Observation of tropical cyclone-induced shallow water currents in Taiwan Strait. Journal of Geophysical Research: Oceans, 122(6): 5005–5021, doi: 10.1002/2017JC012737 Shen Junqiang, Zhang Shanwu, Zhang Junpeng, et al. 2021. Observation of continental shelf wave propagating along the eastern Taiwan Strait during Typhoon Meranti 2016. Journal of Oceanology and Limnology, 39(1): 45–55, doi: 10.1007/s00343-020-9346-8 Shu Yeqiang, Wang Jinghong, Xue Huijie, et al. 2022. Deep-current intraseasonal variability interpreted as topographic Rossby waves and deep eddies in the Xisha Islands of the South China Sea. Journal of Physical Oceanography, 52(7): 1415–1430, doi: 10.1175/JPO-D-21-0147.1 Shu Yeqiang, Xue Huijie, Wang Dongxiao, et al. 2016. Persistent and energetic bottom-trapped topographic Rossby waves observed in the southern South China Sea. Scientific Reports, 6(1): 24338, doi: 10.1038/srep24338 Torrence C, Compo G P. 1998. A practical guide to wavelet analysis. Bulletin of the American Meteorological Society, 79(1): 61–78, doi: 10.1175/1520-0477(1998)079<0061:APGTWA>2.0.CO;2 Wang Jinghong, Shu Yeqiang, Wang Dongxiao, et al. 2021. Observed variability of bottom-trapped topographic Rossby waves along the slope of the northern South China Sea. Journal of Geophysical Research: Oceans, 126(12): e2021JC017746, doi: 10.1029/2021JC017746 Weber J E H, Drivdal M. 2012. Radiation stress and mean drift in continental shelf waves. Continental Shelf Research, 35: 108–116, doi: 10.1016/j.csr.2012.01.001 Yang Yang, Wang Yinxia, Sui Junpeng, et al. 2016. Slowdown of the topography trapped wave propagation by the Dongsha Islands in the northern South China Sea. Ocean Dynamics, 66(1): 11–17, doi: 10.1007/s10236-015-0904-0 Yin Liping, Qiao Fangli, Zheng Quanan. 2014. Coastal-trapped waves in the East China Sea observed by a mooring array in winter 2006. Journal of Physical Oceanography, 44(2): 576–590, doi: 10.1175/JPO-D-13-07.1 Zhang Shuwen, Xie Lingling, Hou Yijun, et al. 2014. Tropical storm-induced turbulent mixing and chlorophyll- a enhancement in the continental shelf southeast of Hainan Island. Journal of Marine Systems, 129: 405–414, doi: 10.1016/j.jmarsys.2013.09.002 Zhao Ruixiang, Zhu Xiaohua, Park J H. 2017. Near 5-day nonisostatic response to atmospheric surface pressure and coastal-trapped waves observed in the northern South China Sea. Journal of Physical Oceanography, 47(9): 2291–2303, doi: 10.1175/JPO-D-17-0013.1 Zheng Quanan, Zhu Benlu, Li Junyi, et al. 2015. Growth and dissipation of typhoon-forced solitary continental shelf waves in the northern South China Sea. Climate Dynamics, 45(3): 853–865 Zhou Lei, Tian Jiwei, Wang Dongxiao. 2005. Energy distributions of the large-scale horizontal currents caused by wind in the baroclinic ocean. Science in China Series D: Earth Sciences, 48(12): 2267–2275, doi: 10.1360/04yd0125 -


 点击查看大图

计量
- 文章访问数: 484
- HTML全文浏览量: 196
- PDF下载量: 29
- 被引次数: 0

