

Three-dimensional circulation in northern South China Sea during early summer of 2015
-
Abstract: Using the hydrographic data obtained during two nearly simultaneous surveys in June 2015, we carried out semi-diagnostic calculations with the help of a finite element model and a modified inverse method, to study the circulation in the northern South China Sea (NSCS) during the early summer of 2015. A number of new circulation features were found. (1) In most of the observation region, a large, basin-scale anticyclonic gyre appeared south of the 50-m isobath, which contained anticyclonic eddies. One anticyclonic eddy existed from the sea surface to 50-m depth, whose center showed no tilt, while the center of another eddy tilted eastward from the sea surface to 500-m depth. In the eastern part of the observation region, which is west of the Dongsha Islands, there was a sub-basin-scale cyclonic gyre containing a cyclonic eddy whose center tilted southward from the sea surface to 200-m depth. (2) There was a cross-continental slope current (CCSC) in the area southwest of the Dongsha Islands. Its volume transport was about 2.0×10⁶ m3/s. (3) From the estimated order of magnitude of the stream function equation, the joint effect term of the baroclinity and relief (JEBAR) and β-effect term are two important dynamic mechanisms affecting the variation of the circulation in the NSCS. (4) The JEBAR, as a transport-generating term, resulted in the dynamic mechanism determining the pattern of the depth-averaged flow across the contours of potential vorticity fH–1. Furthermore, we show that the negative values of the JEBAR were the most dominant dynamic mechanism, causing the CCSC southwest of the Dongsha Islands to deflect from the isobaths and veer toward the deep water. The CCSC around the Dongsha Islands was located further southwest during the early summer of 2015 than during the fall of 2005 (revealed by a published study), which suggests that the location of the CCSC around the Dongsha Islands may vary with season.
-
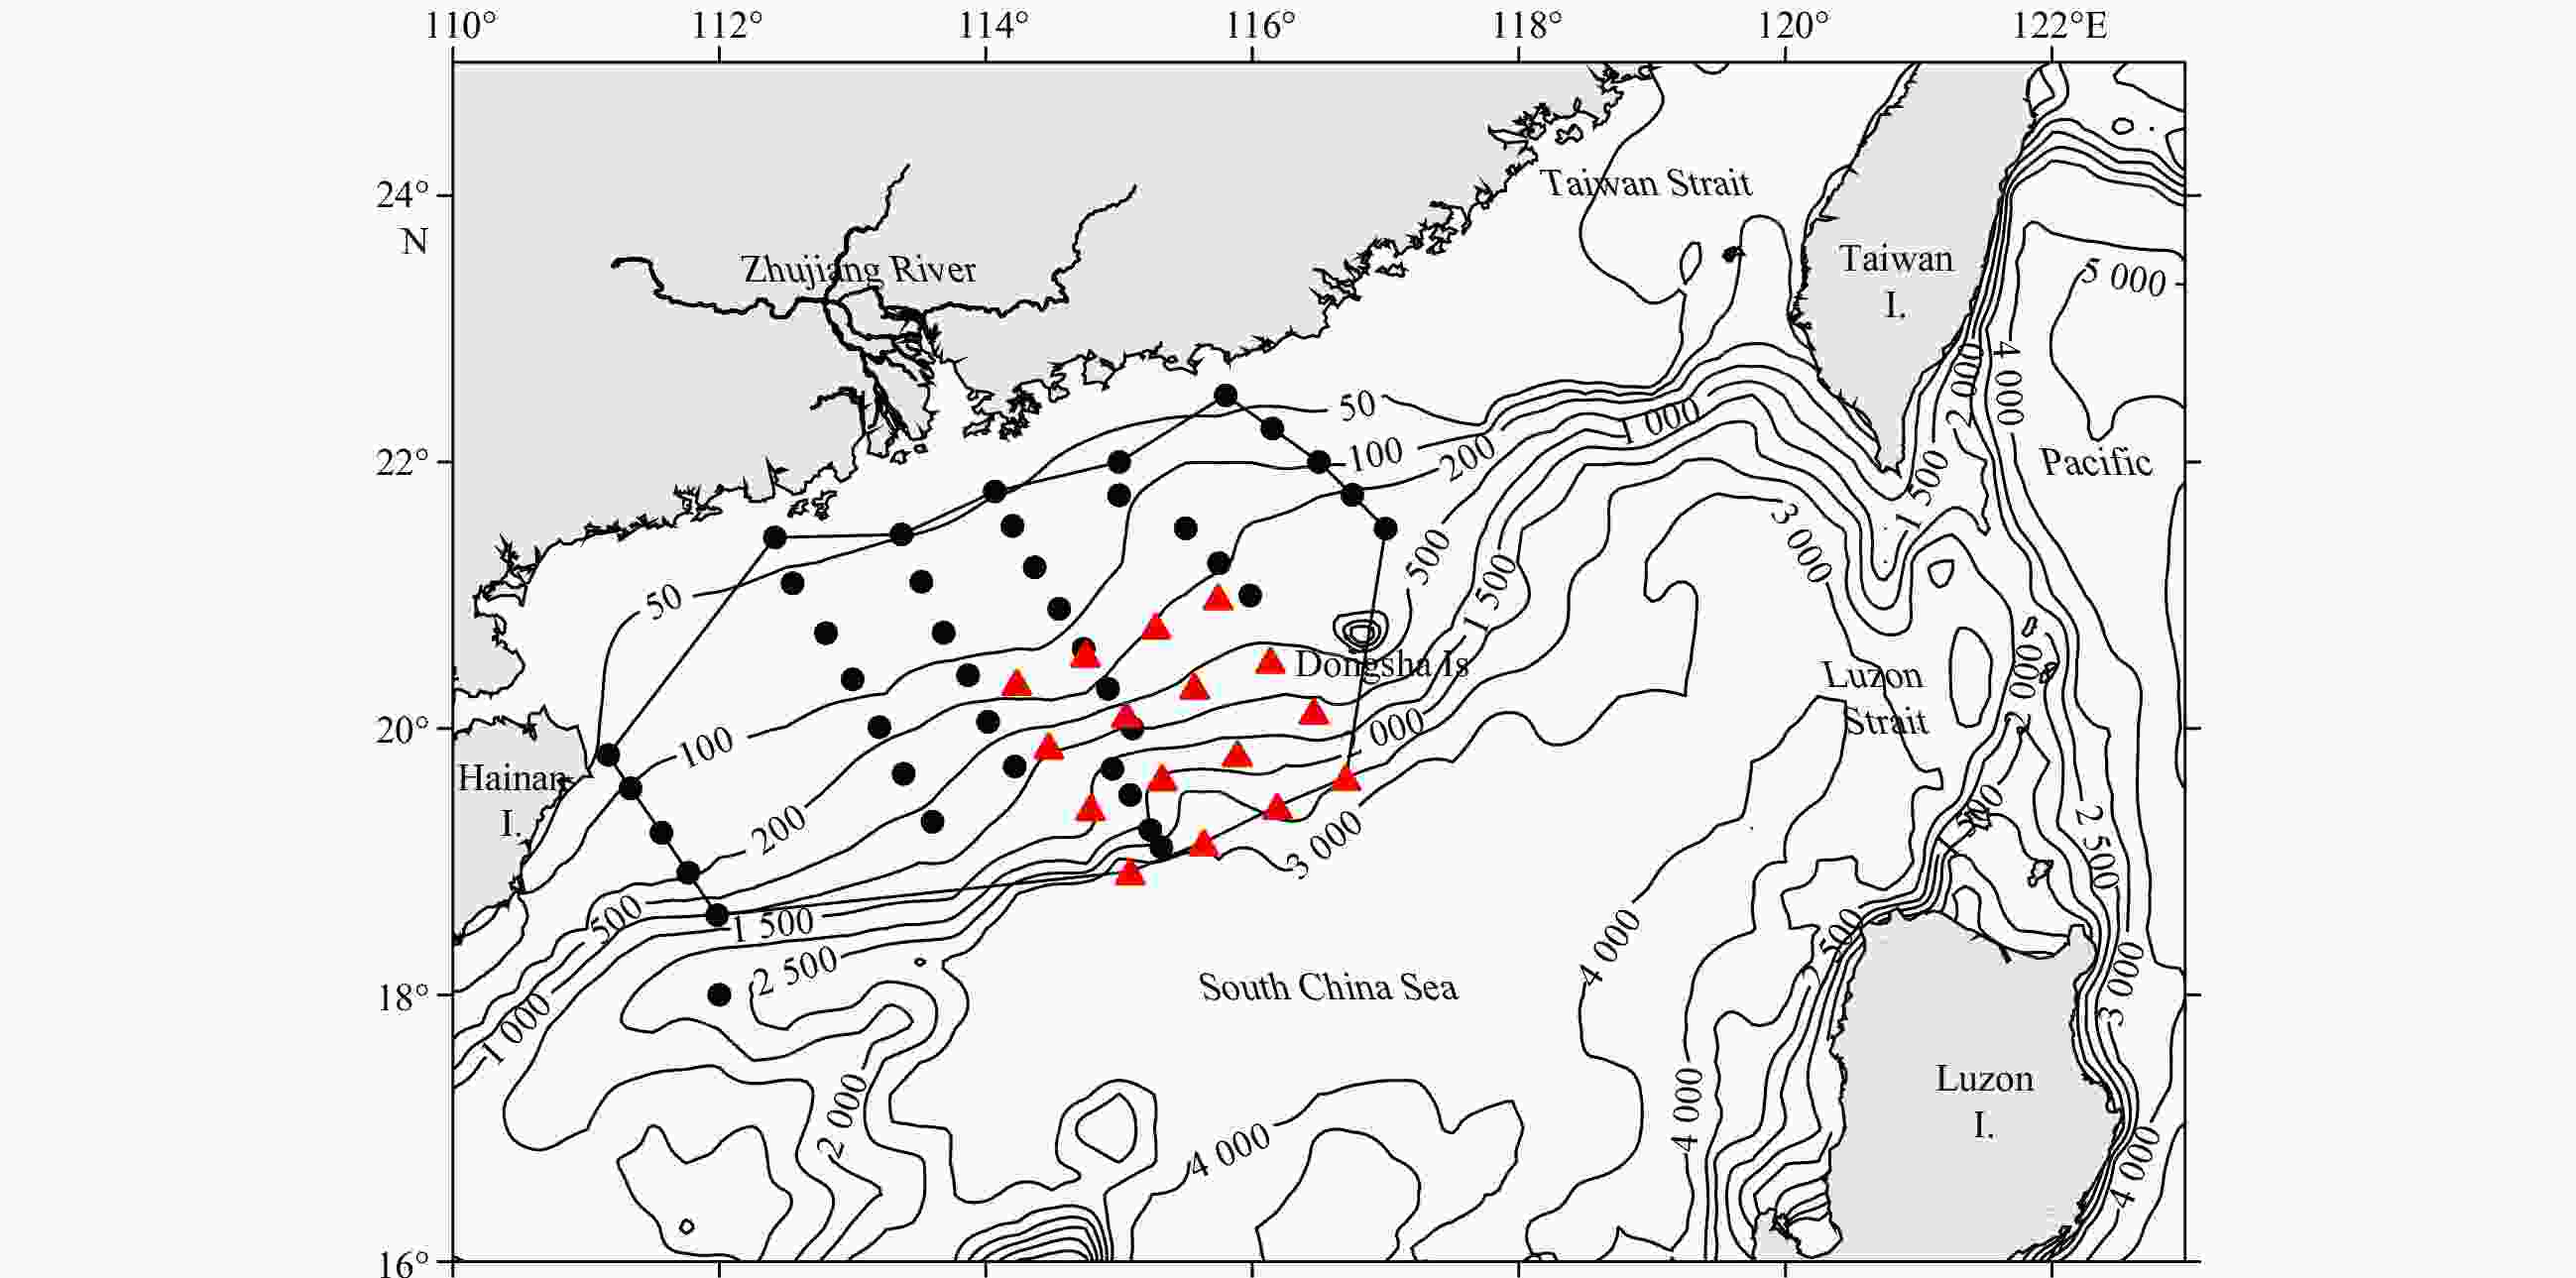
Figure 1. Bottom topography (m) of the South China Sea and observation stations of the two surveys in June 2015. The dots denote the open cruise from 21 to 30 June 2015, and the triangles denote the slope cruise from 13 to 25 June 2015. The polygon connecting the exterior markers indicates the observational domain.
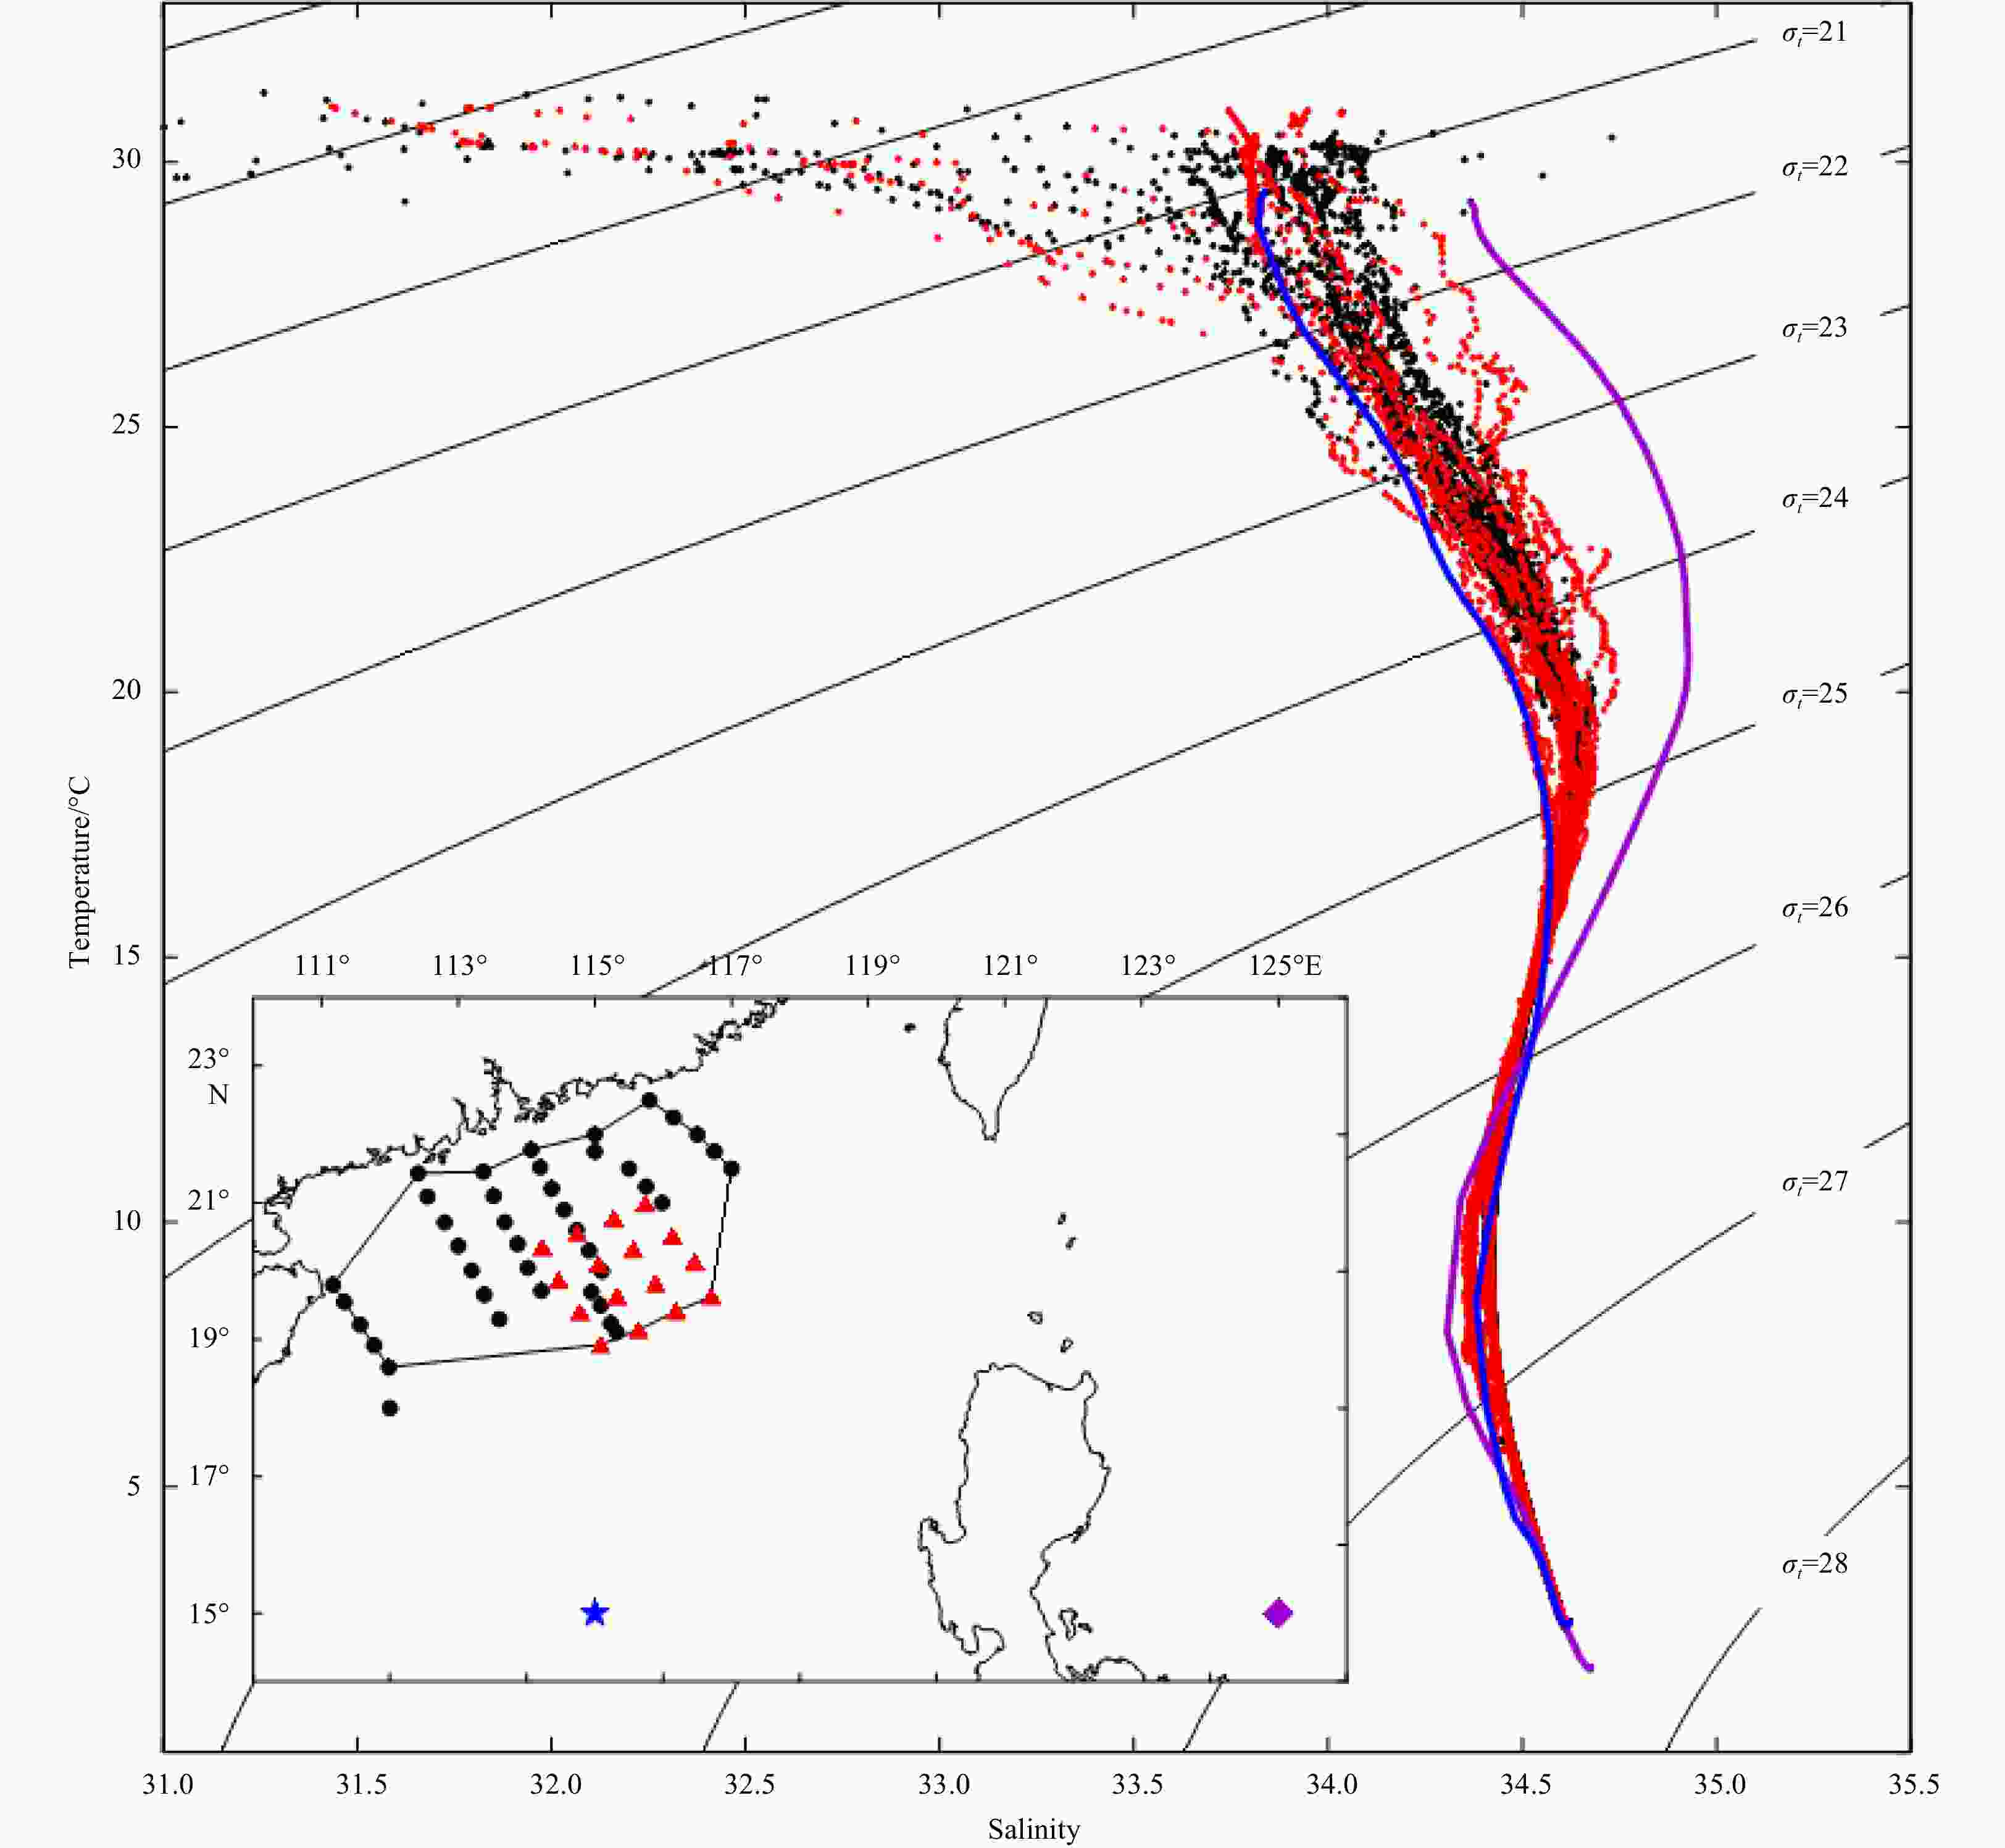
Figure 2. Temperature-salinity (T-S) diagram from all hydrographic stations of the two surveys. Black and red are used to distinguish the two surveys, while the monthly climatological profiles of observed temperature and salinity in June for the SCS (15°N, 115°E) and Pacific (15°N, 125°E) are in blue and purple, respectively.
$ {\sigma }_{t} $ (kg/m3) is the density anomaly of a water sample when the total pressure on it has been reduced to atmospheric pressure.
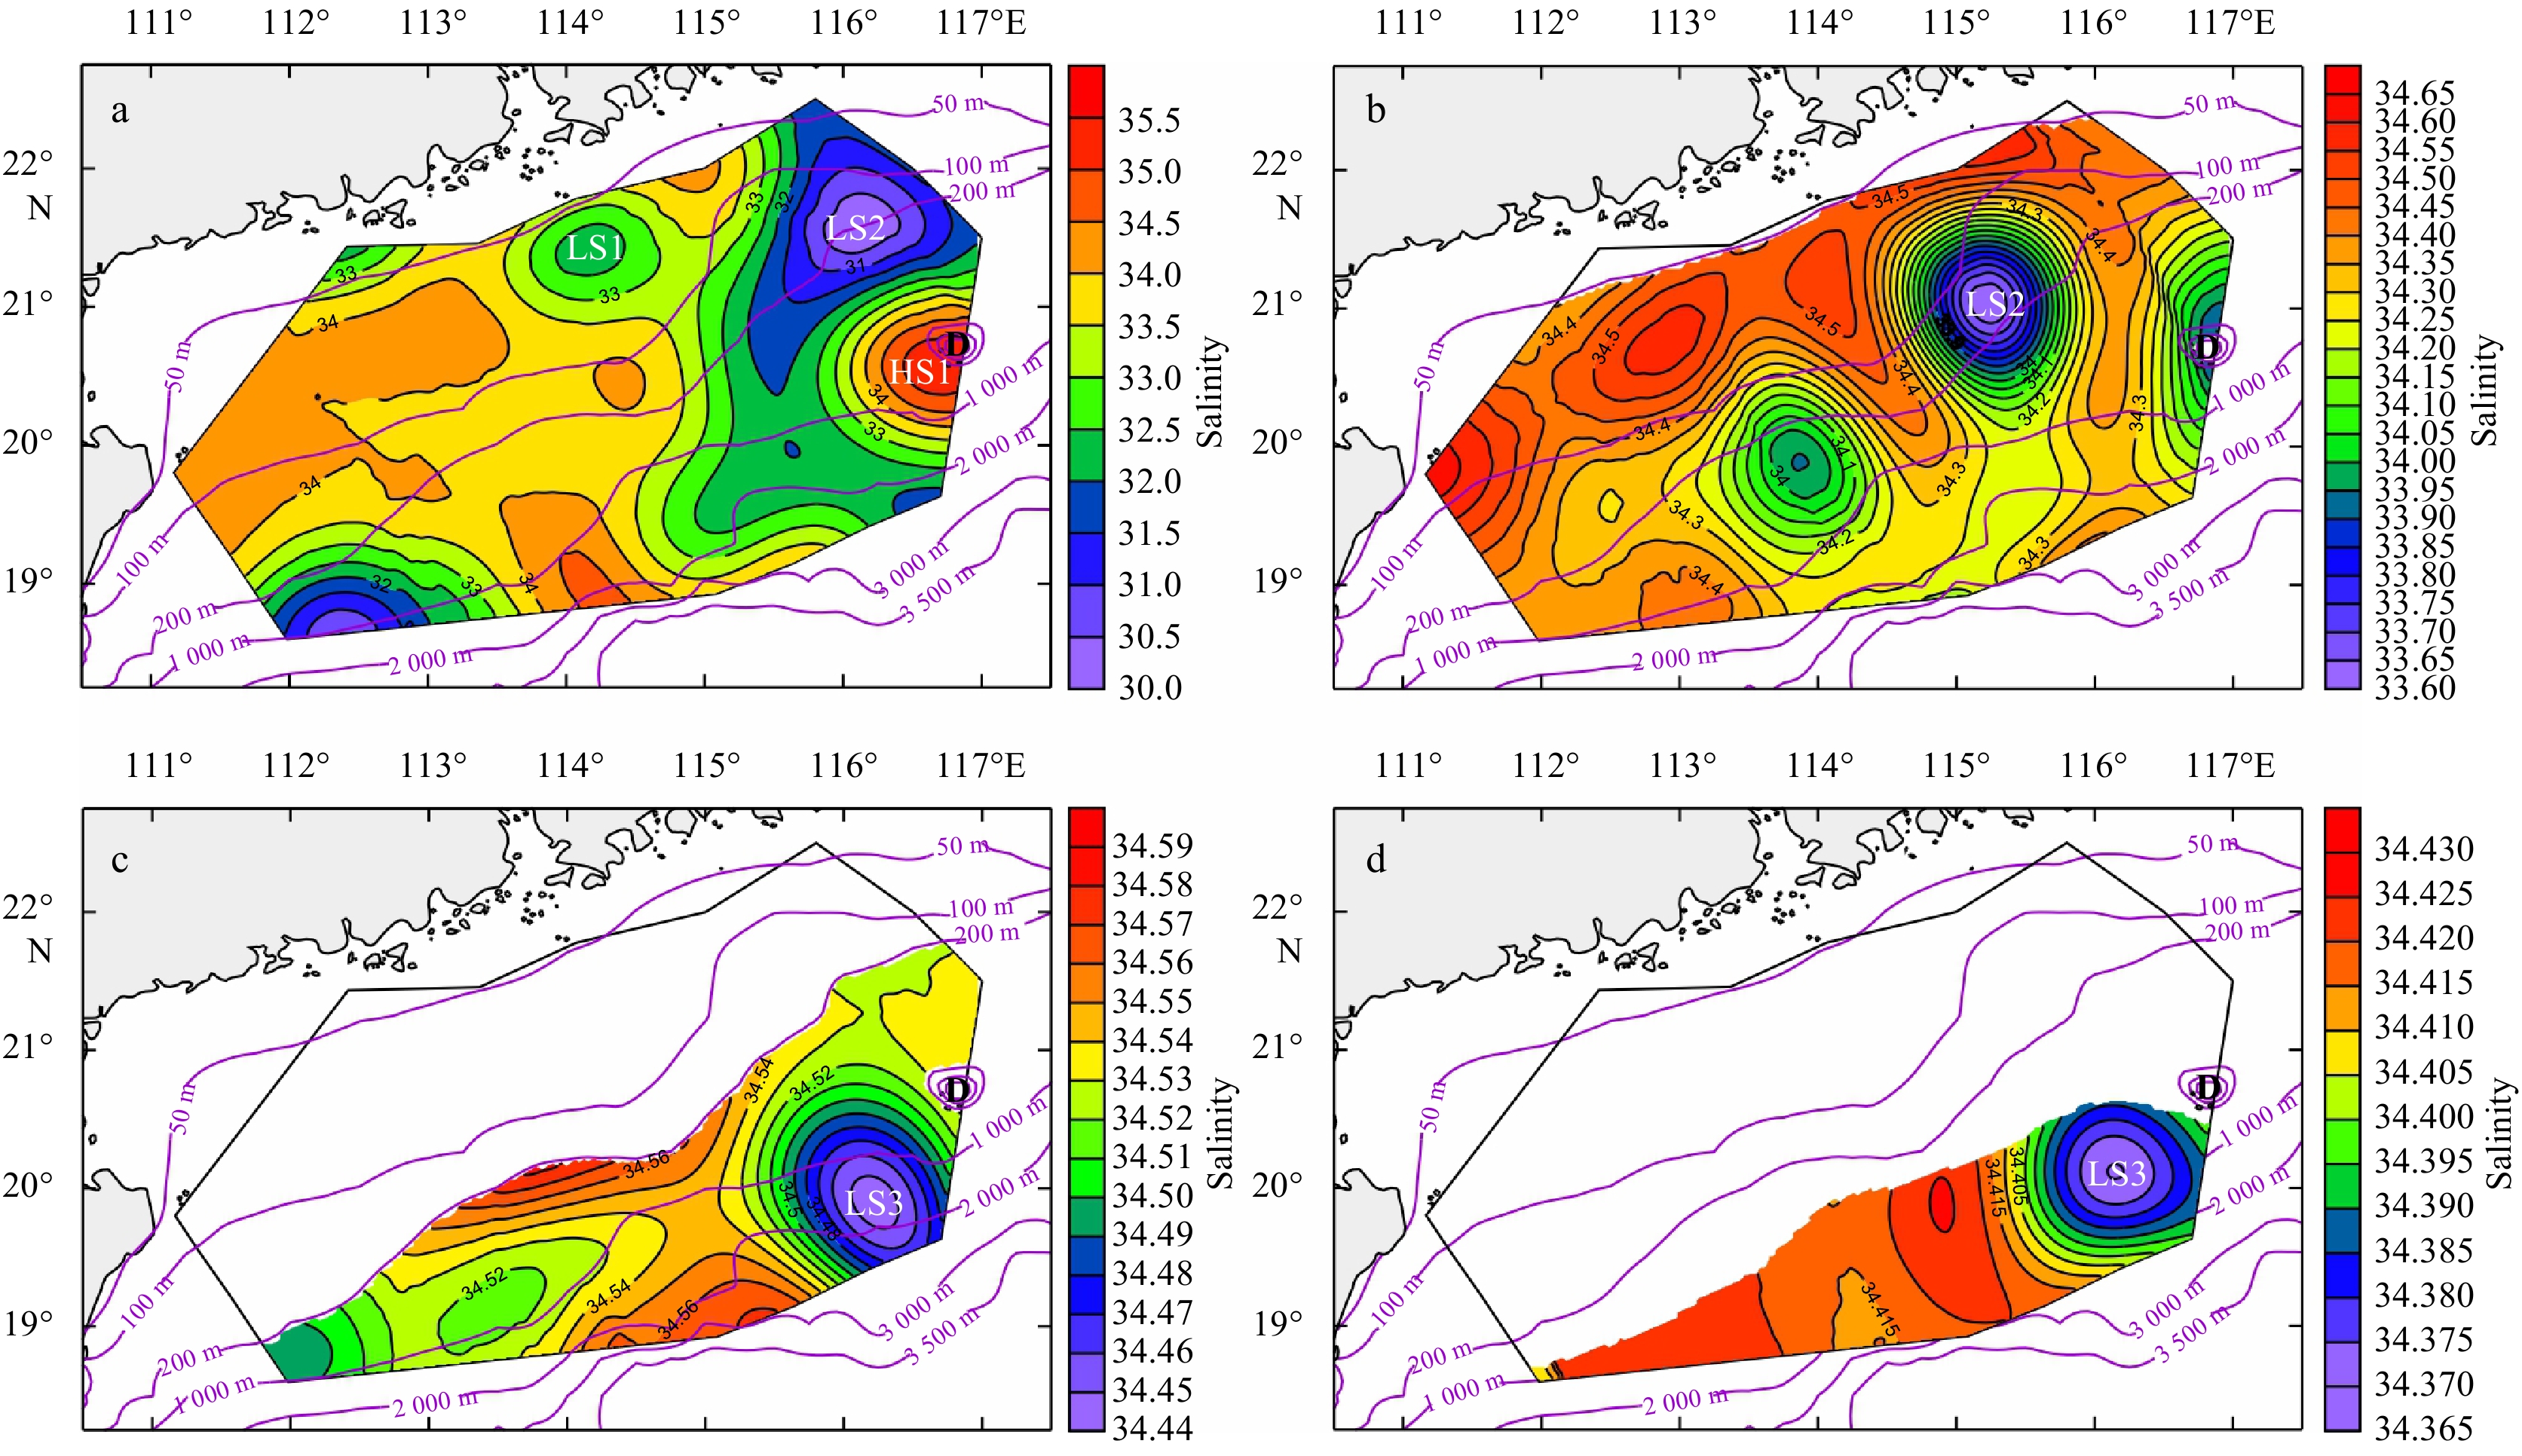
Figure 3. Salinity distributions at surface (a), 50 m (b), 200 m (c), and 500 m (d) measured in June 2015. “HS” indicates higher-salinity water, “LS” indicates lower-salinity water, “D” indicates the Dongsha Islands, and purple contours indicate isobaths.

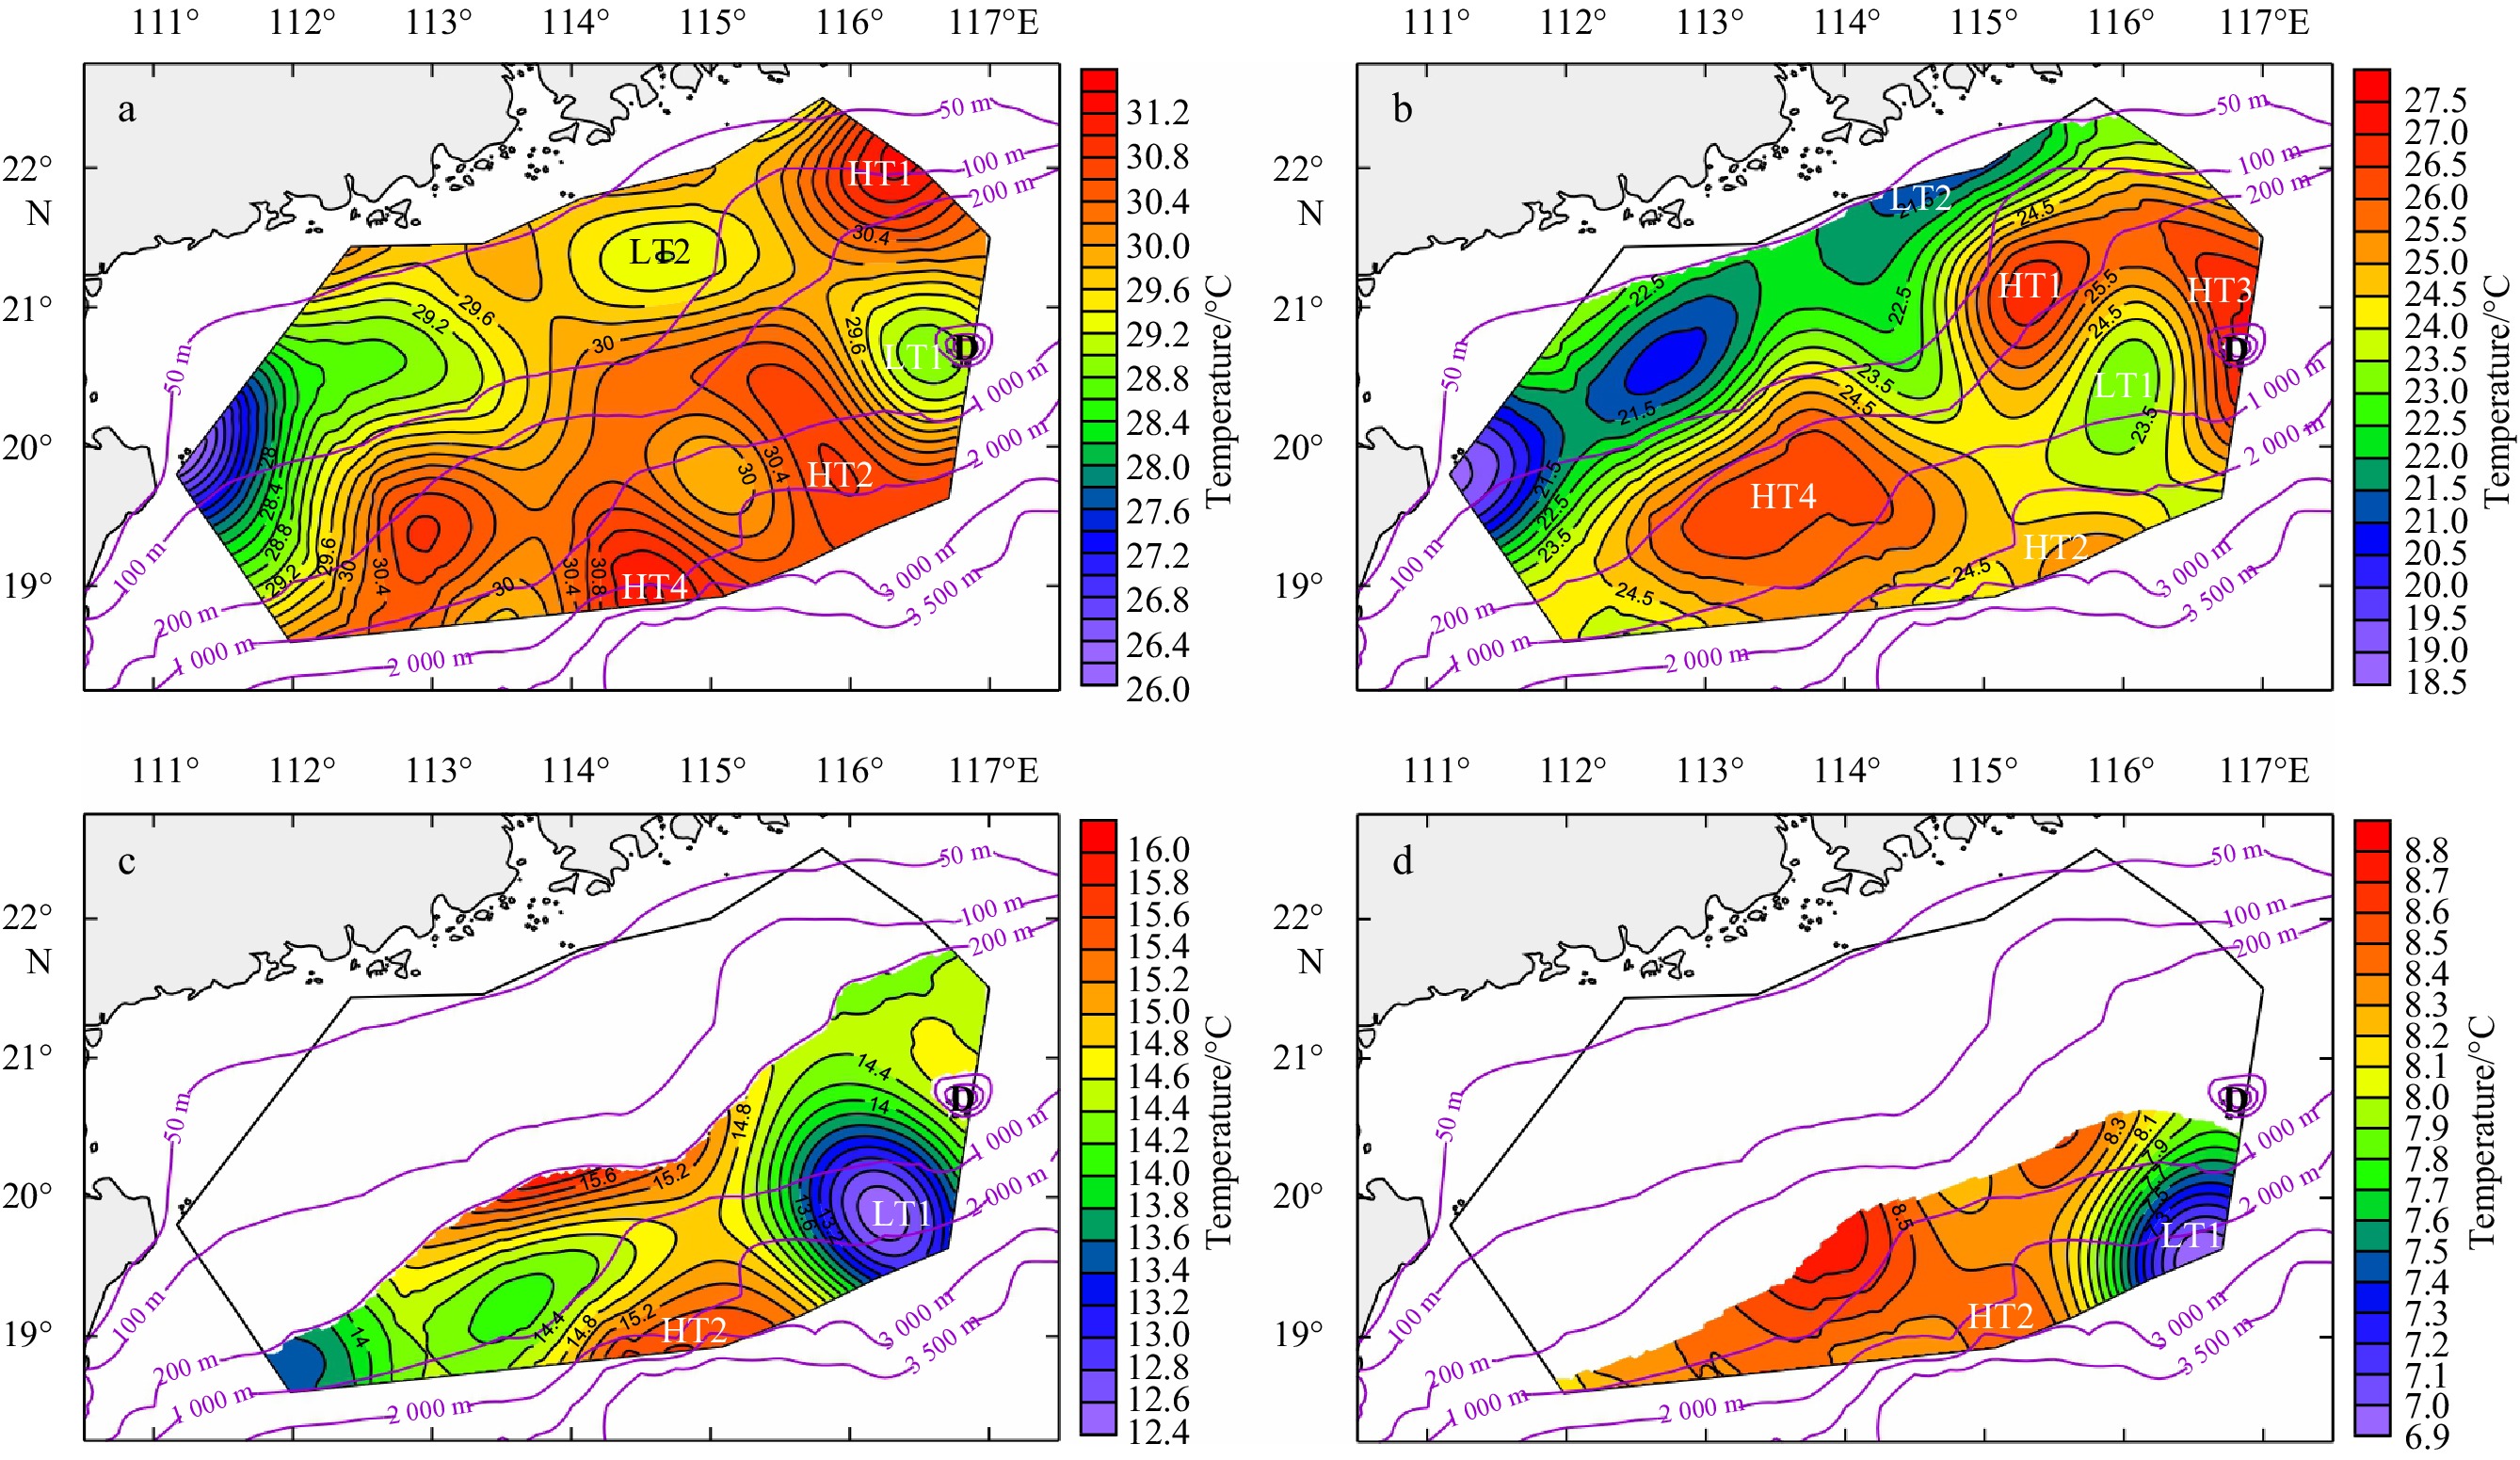
Figure 4. Temperature distributions at surface (a), 50 m (b), 200 m (c), and 500 m (d) measured in June 2015. “HT”indicates higher- temperature water, “LT” indicates lower- temperature water, “D” indicates the Dongsha Islands, and purple contours indicate isobaths.
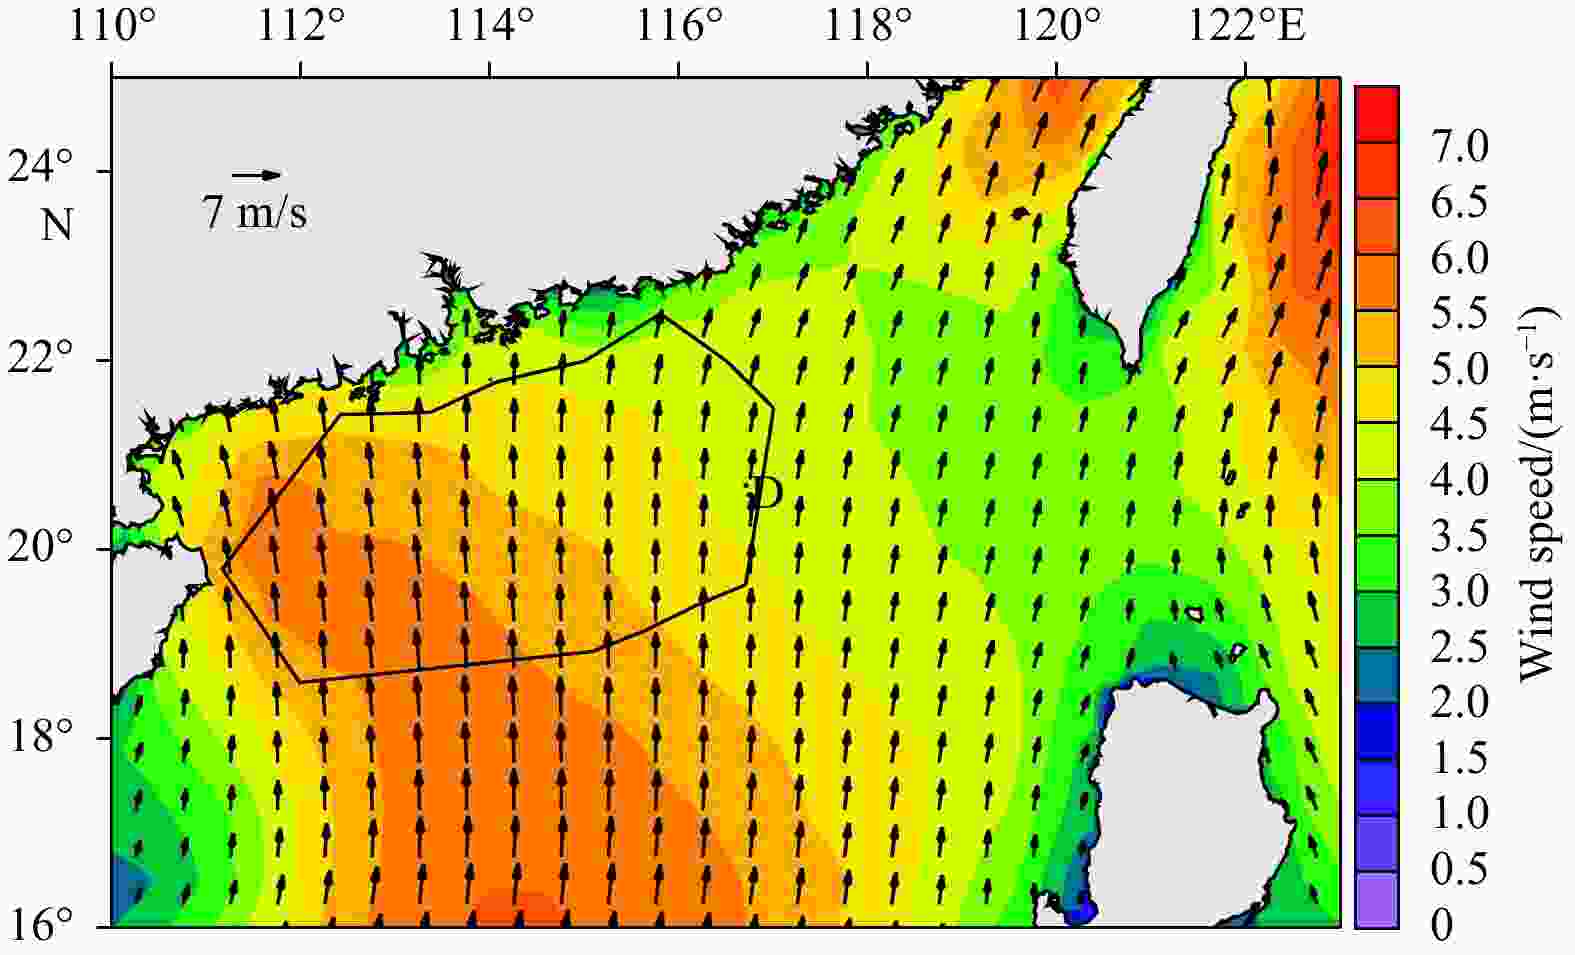
Figure 5. Mean wind field derived from the ERA-Interim Reanalysis for the survey period. The polygon indicates the computational domain, and “D” indicates the Dongsha Islands.

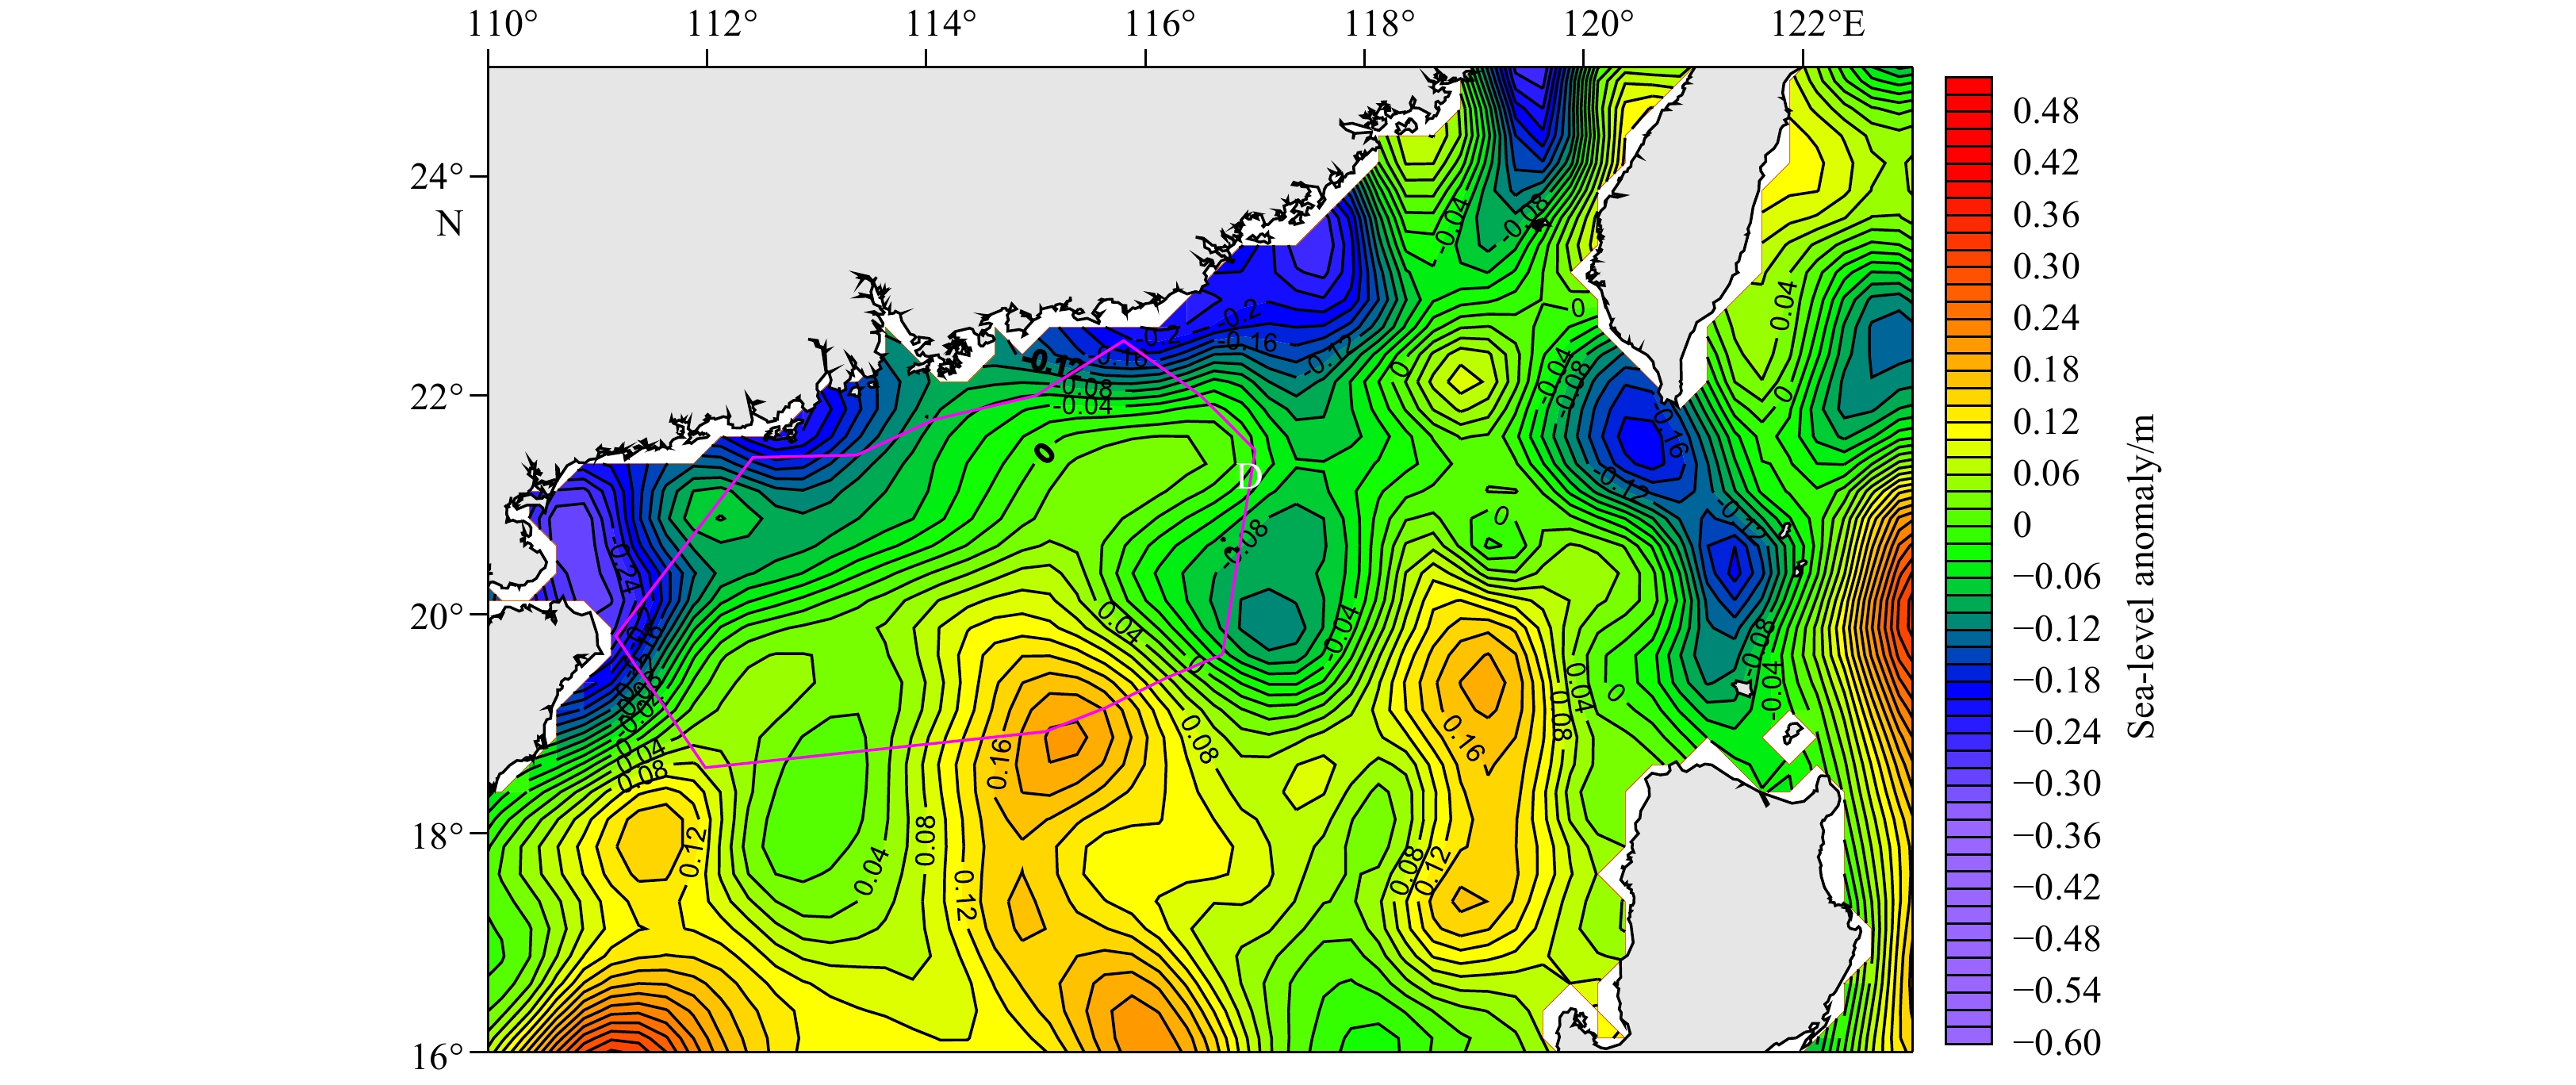
Figure 6. Averaged weekly composite sea-level anomaly (m) from 9 to 29 June 2015. The polygon indicates the computational domain, and “D” indicates the Dongsha Islands.
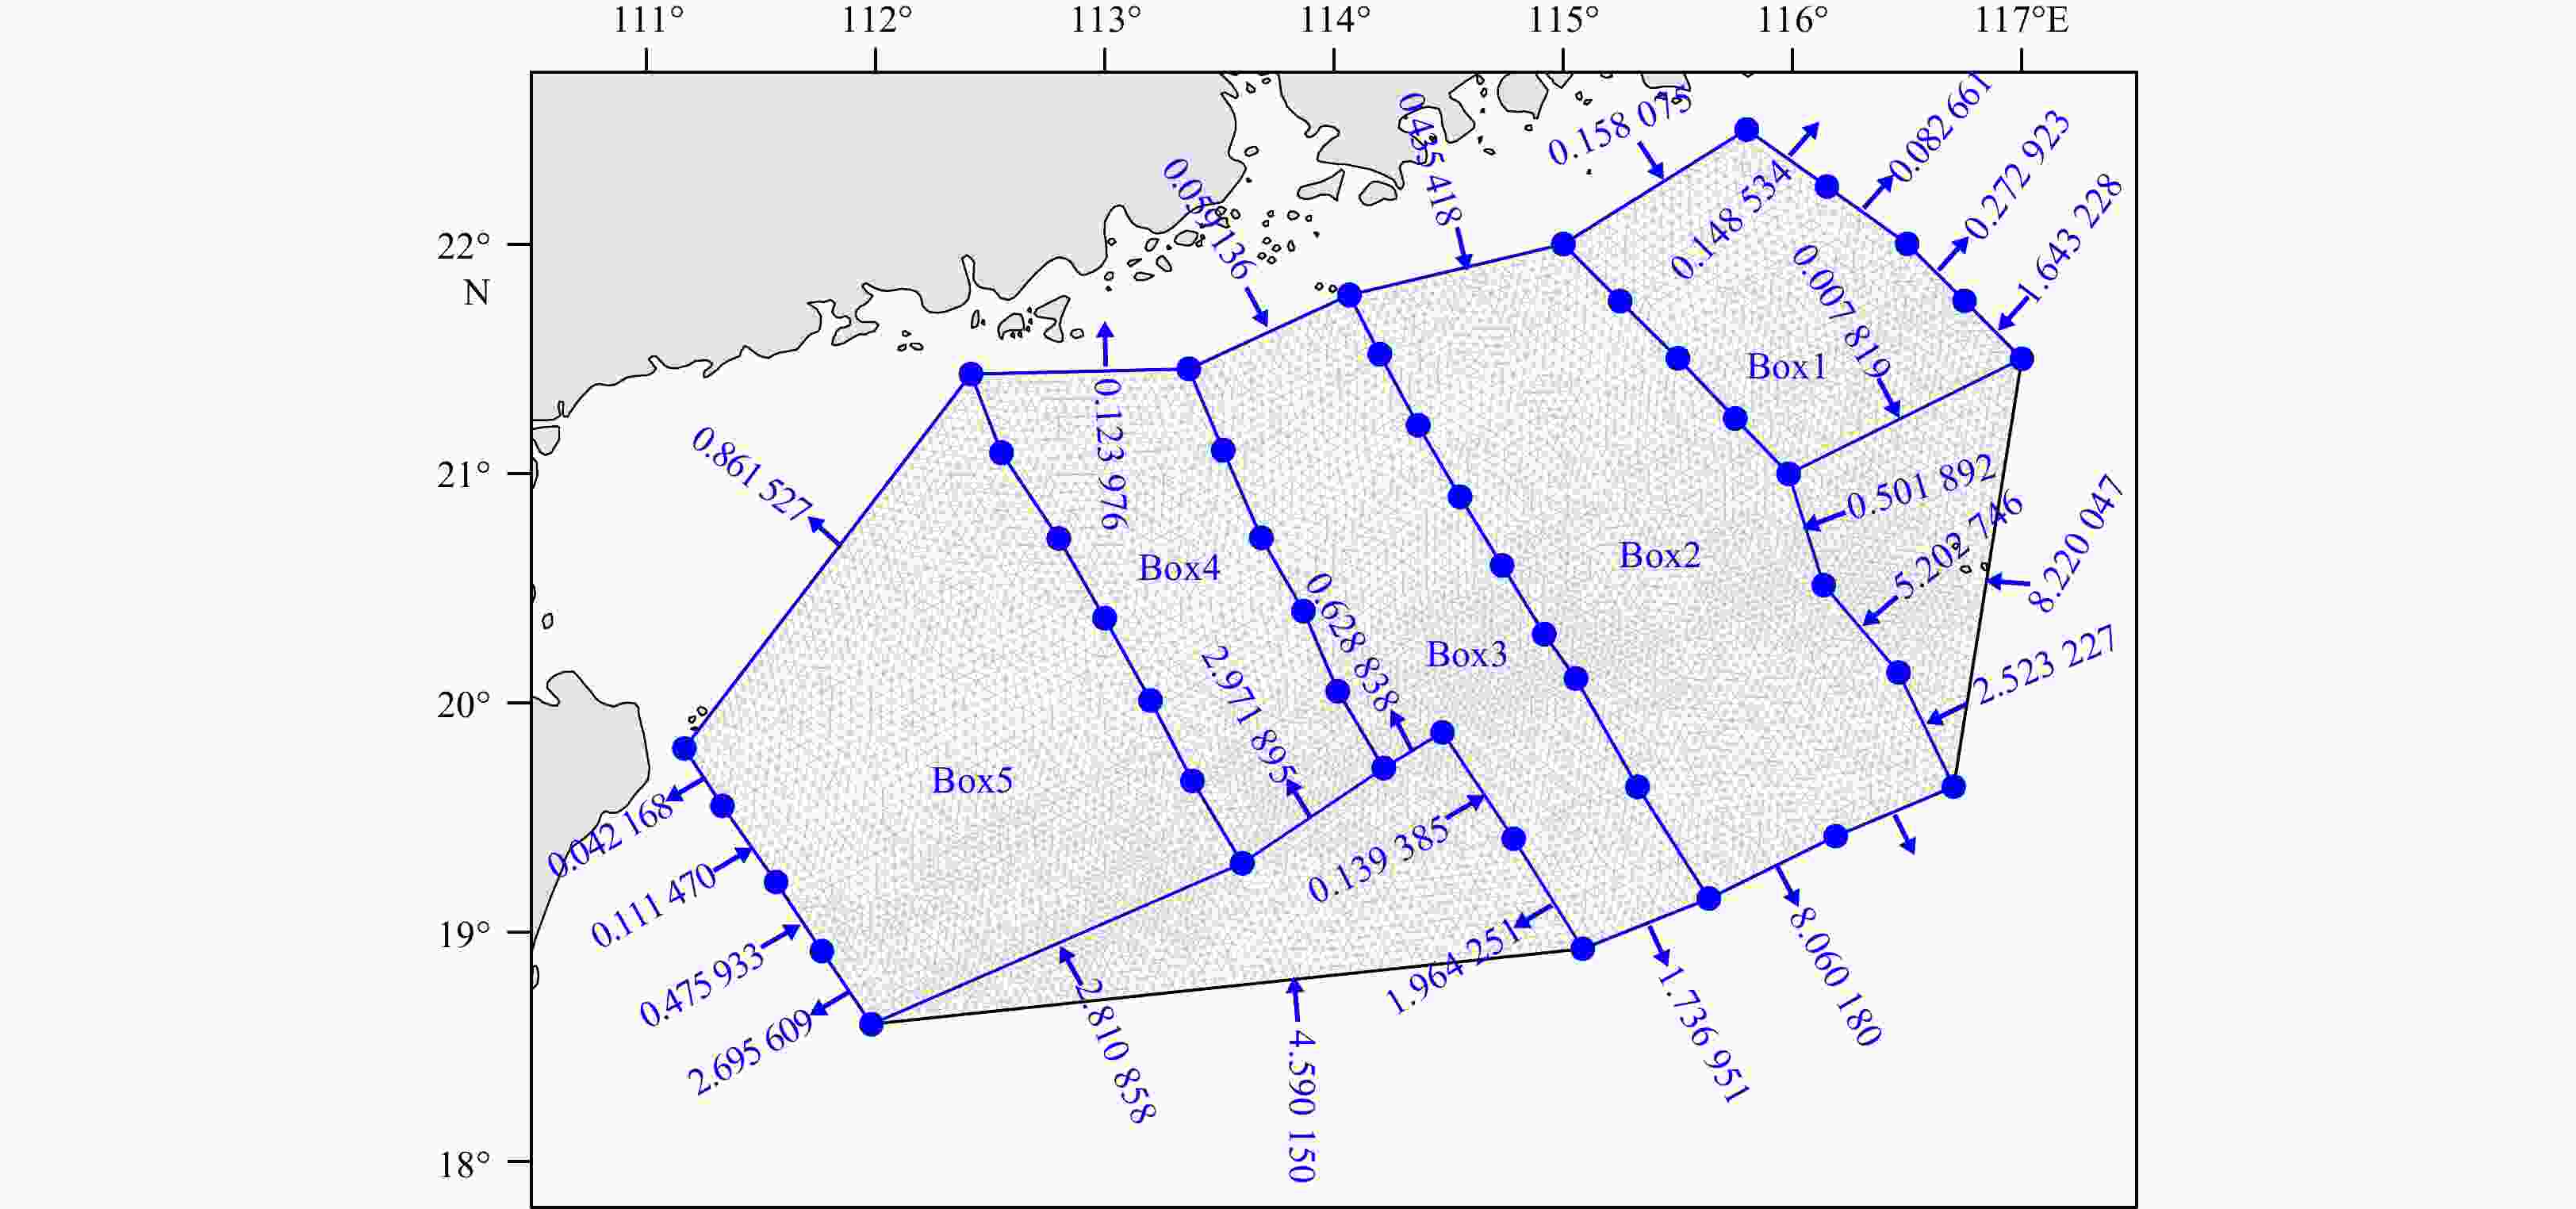
Figure 7. Boxes of the modified inverse method and horizontal grid of the numerical model. The transports (106 m3/s) listed at the boundaries of the computational region were calculated using the modified inverse method.
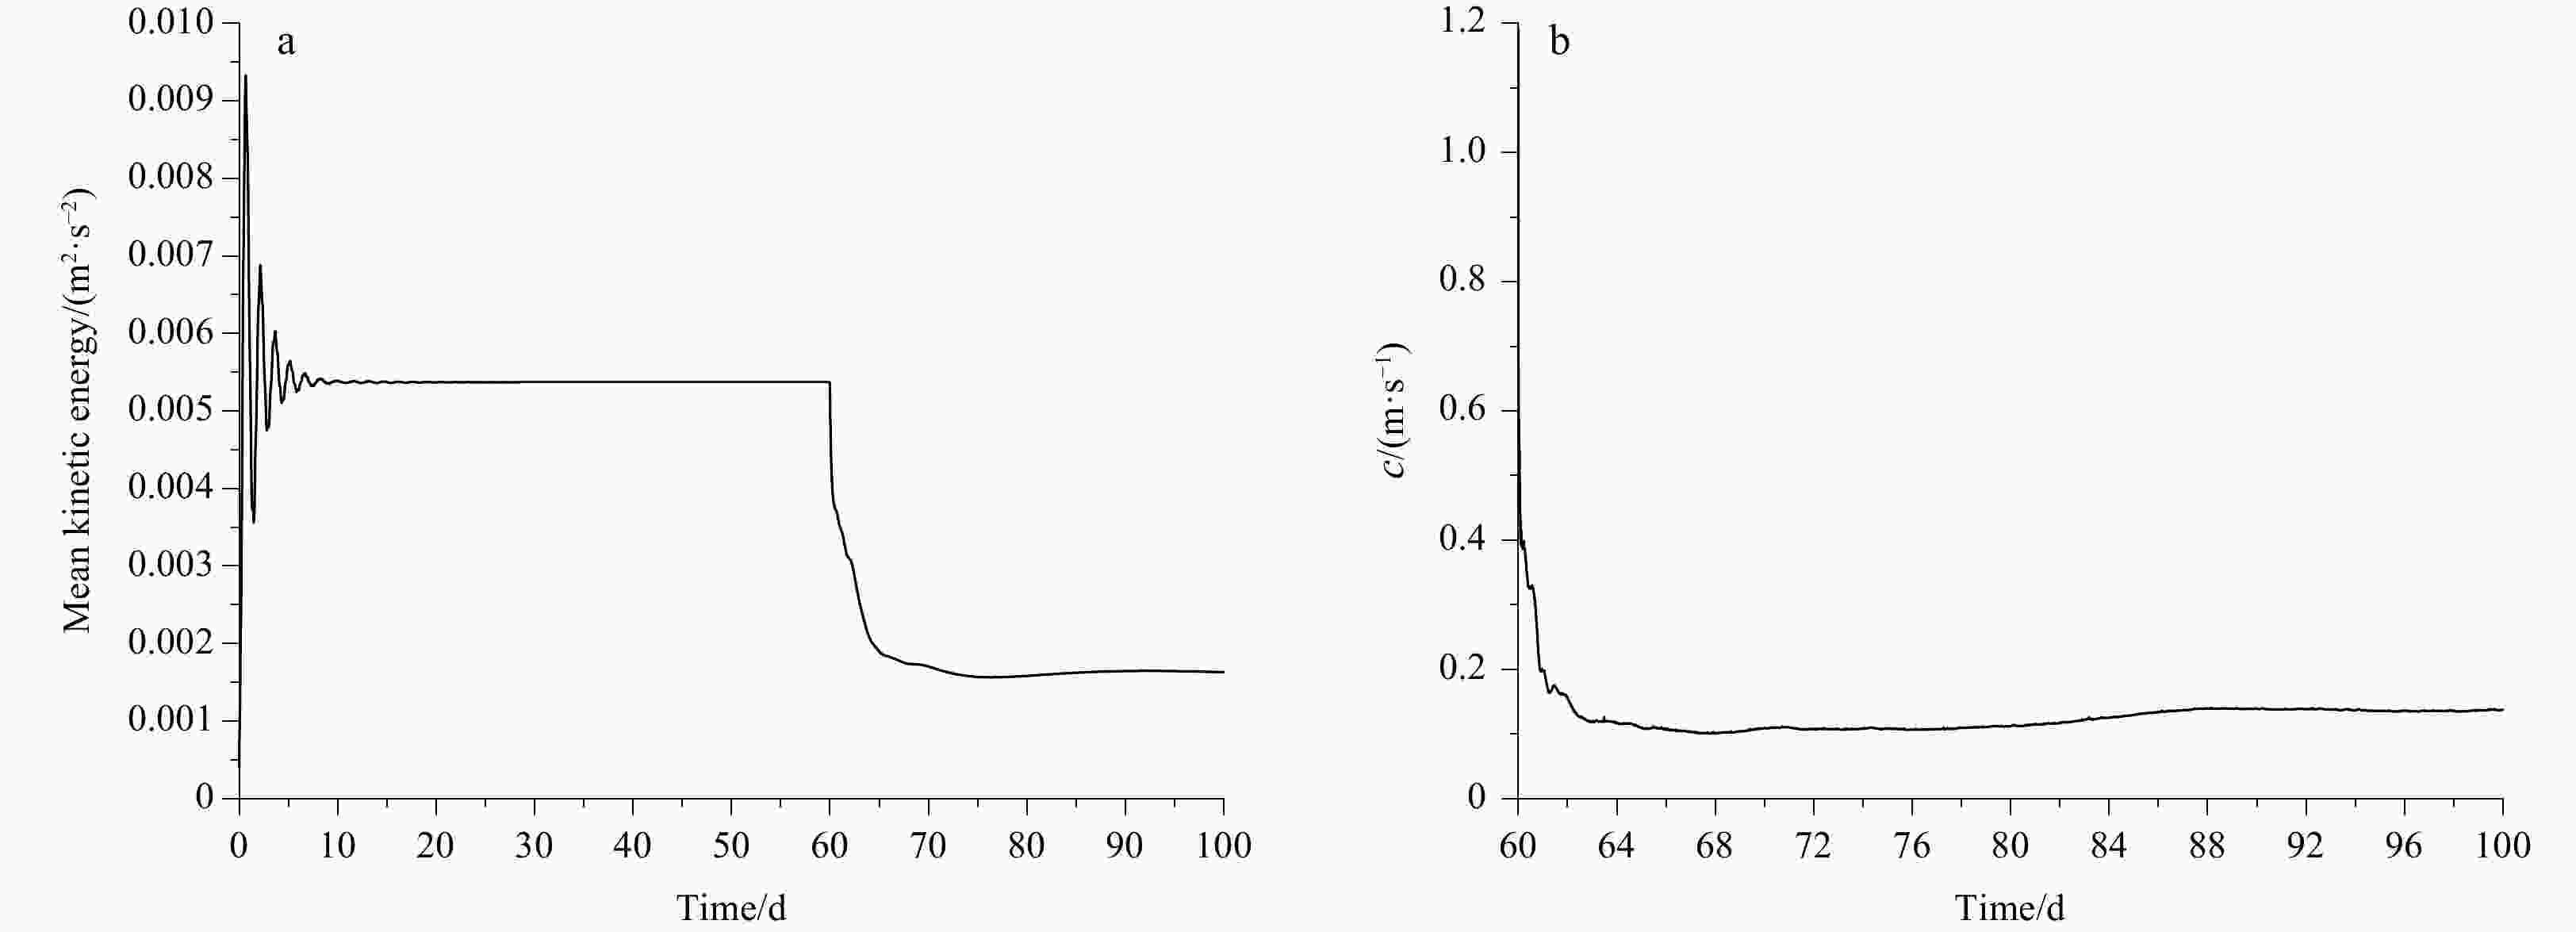
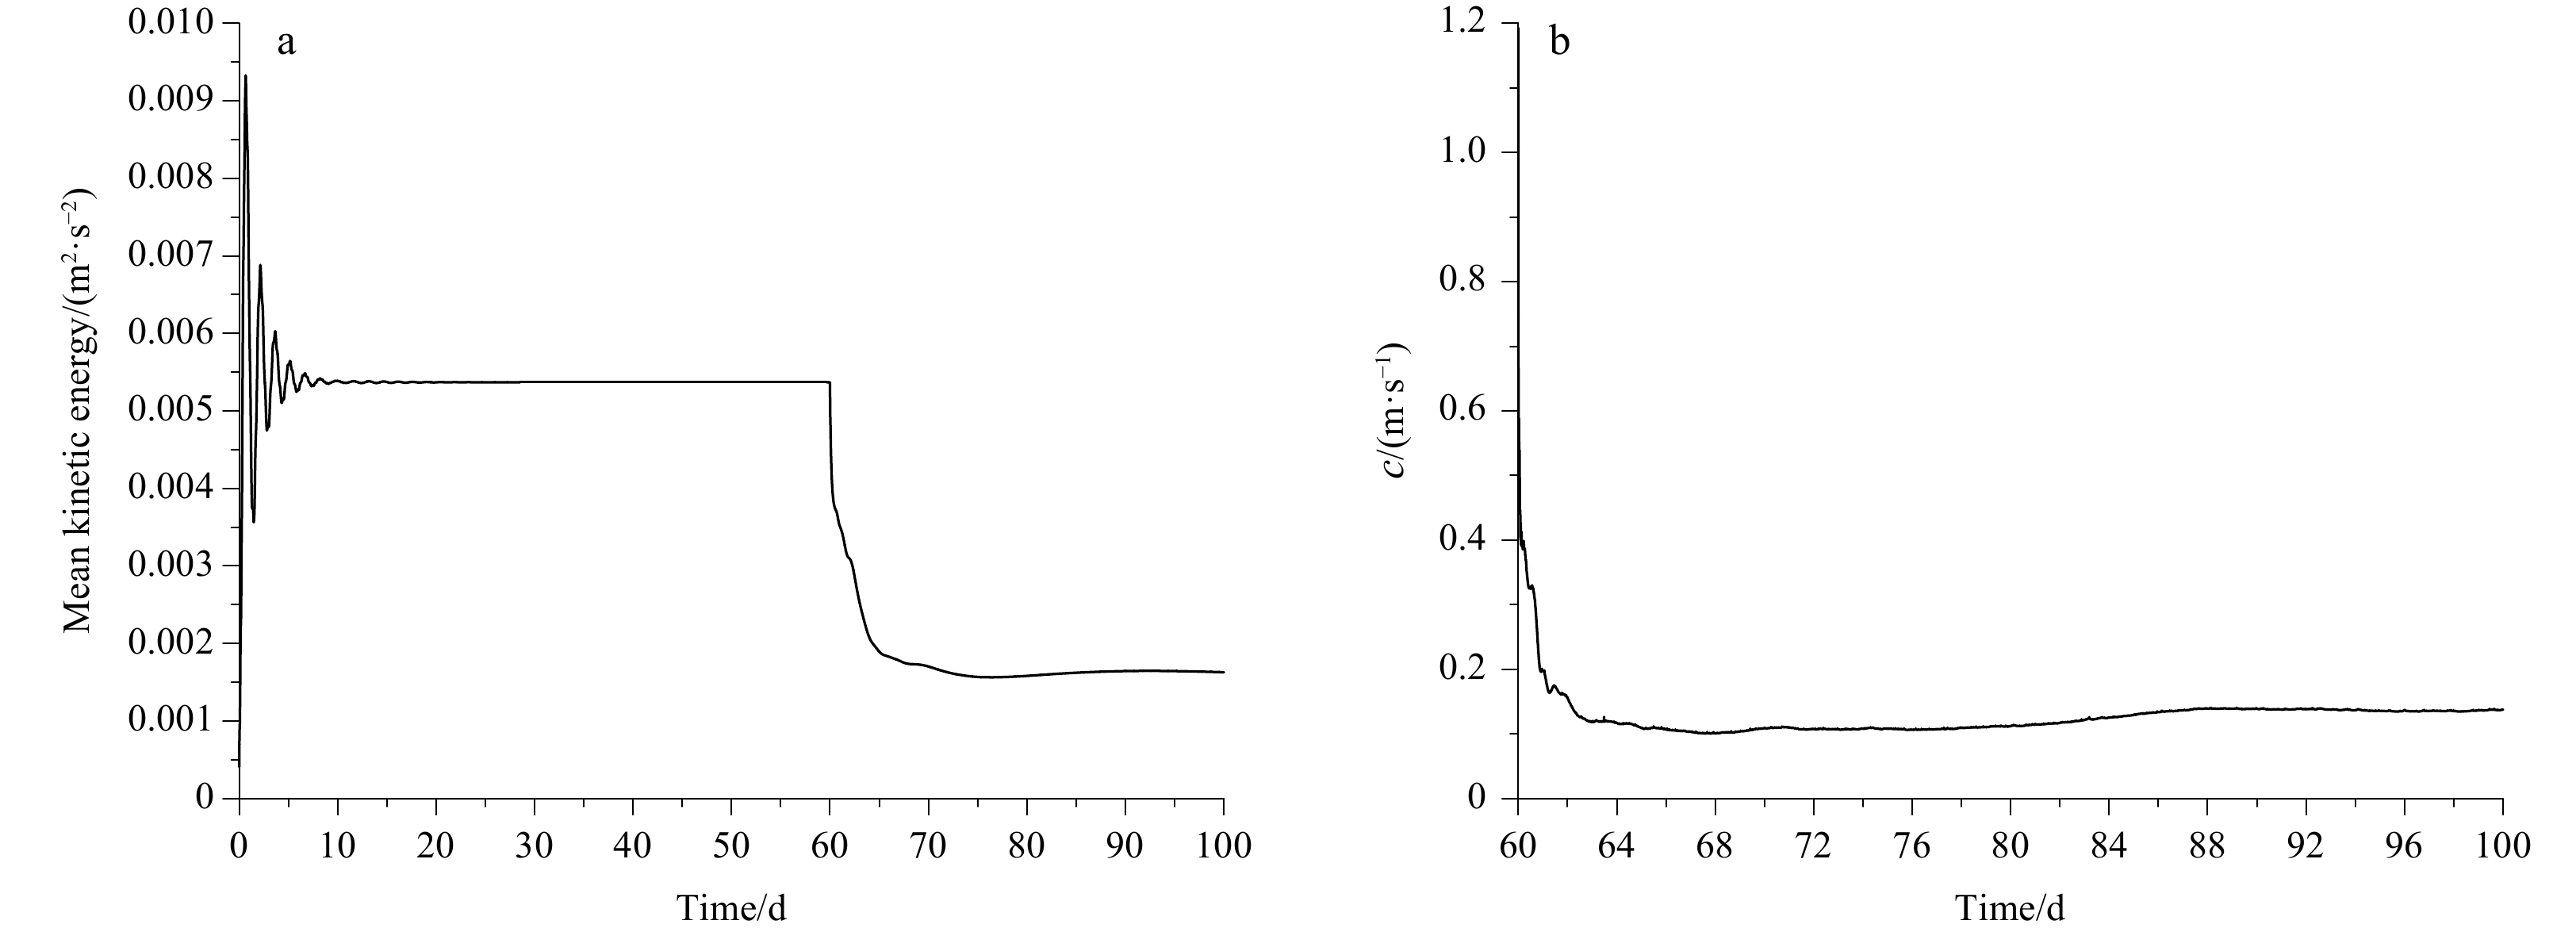
Figure 8. Volume-averaged kinetic energy (a) and phase speed of density (b) as a function of time.
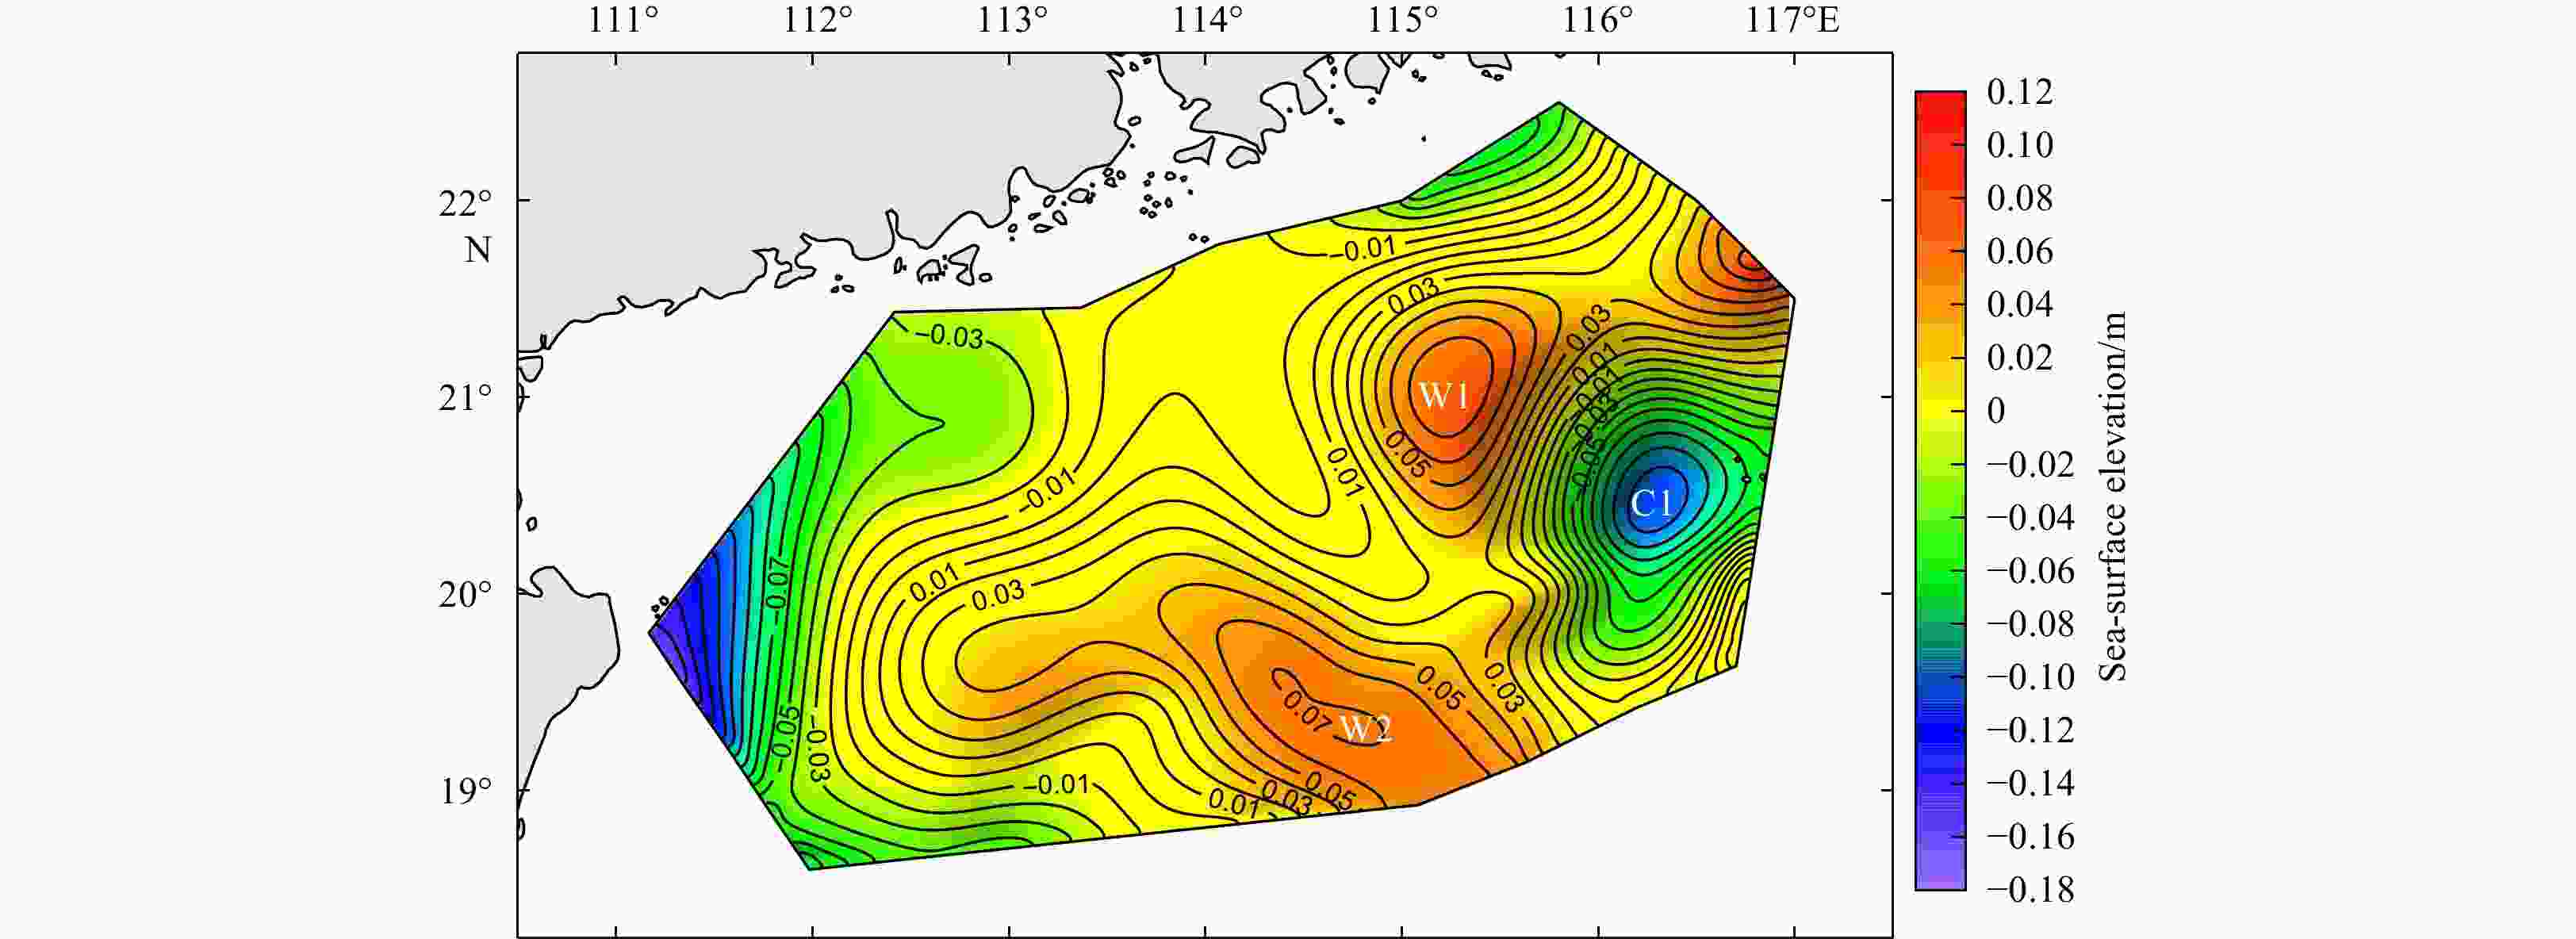
Figure 9. Sea-surface elevations (m) from the semi-diagnostic calculation. “W1” and “W2” indicate two anticyclonic eddies, and “C1” indicates the cold eddy.
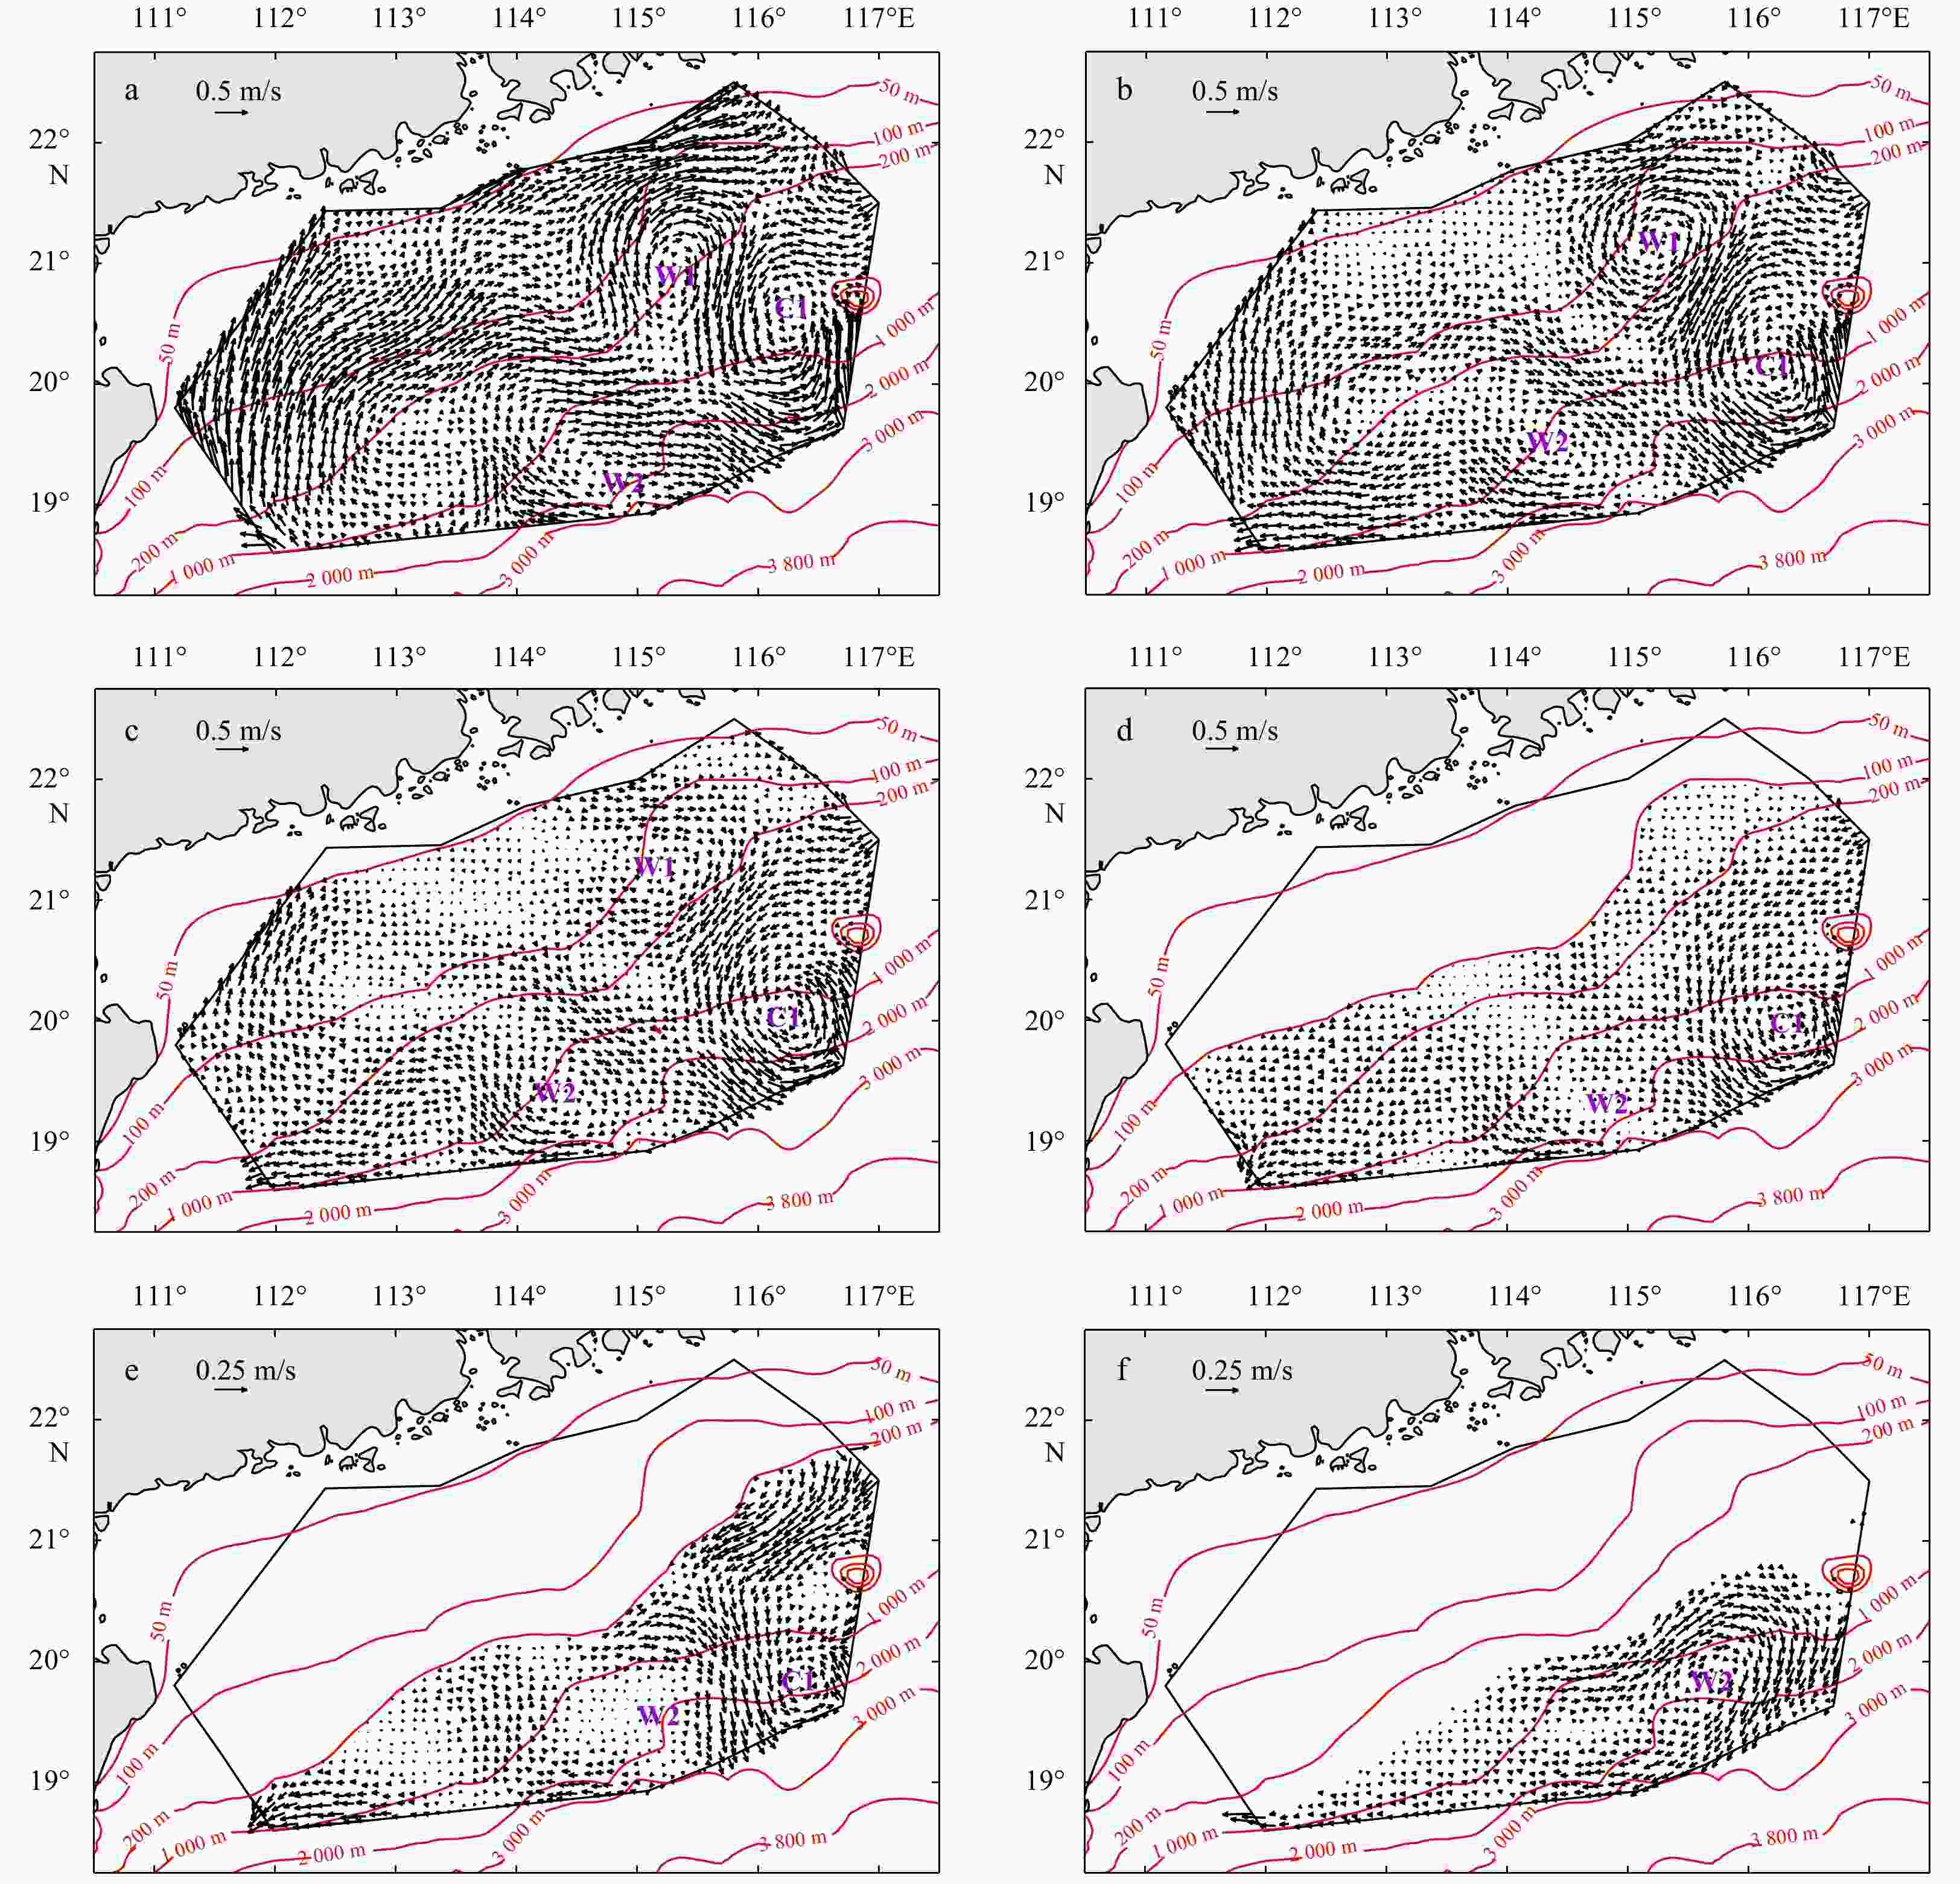
Figure 10. Distributions of horizontal velocity from the semi-diagnostic calculation at surface (a), 25 m (b), 50 m (c), 100 m (d), 200 m (e), and 400 m (f). Red contours indicate isobaths, “W1” and “W2” indicate two anticyclonic eddies, and “C1” indicates the cold eddy.

Figure 11. Distribution of stream function and volume transport (106 m3/s) from the semi-diagnostic calculation. Red contours indicate isobaths, and “D” indicates the Dongsha Islands.
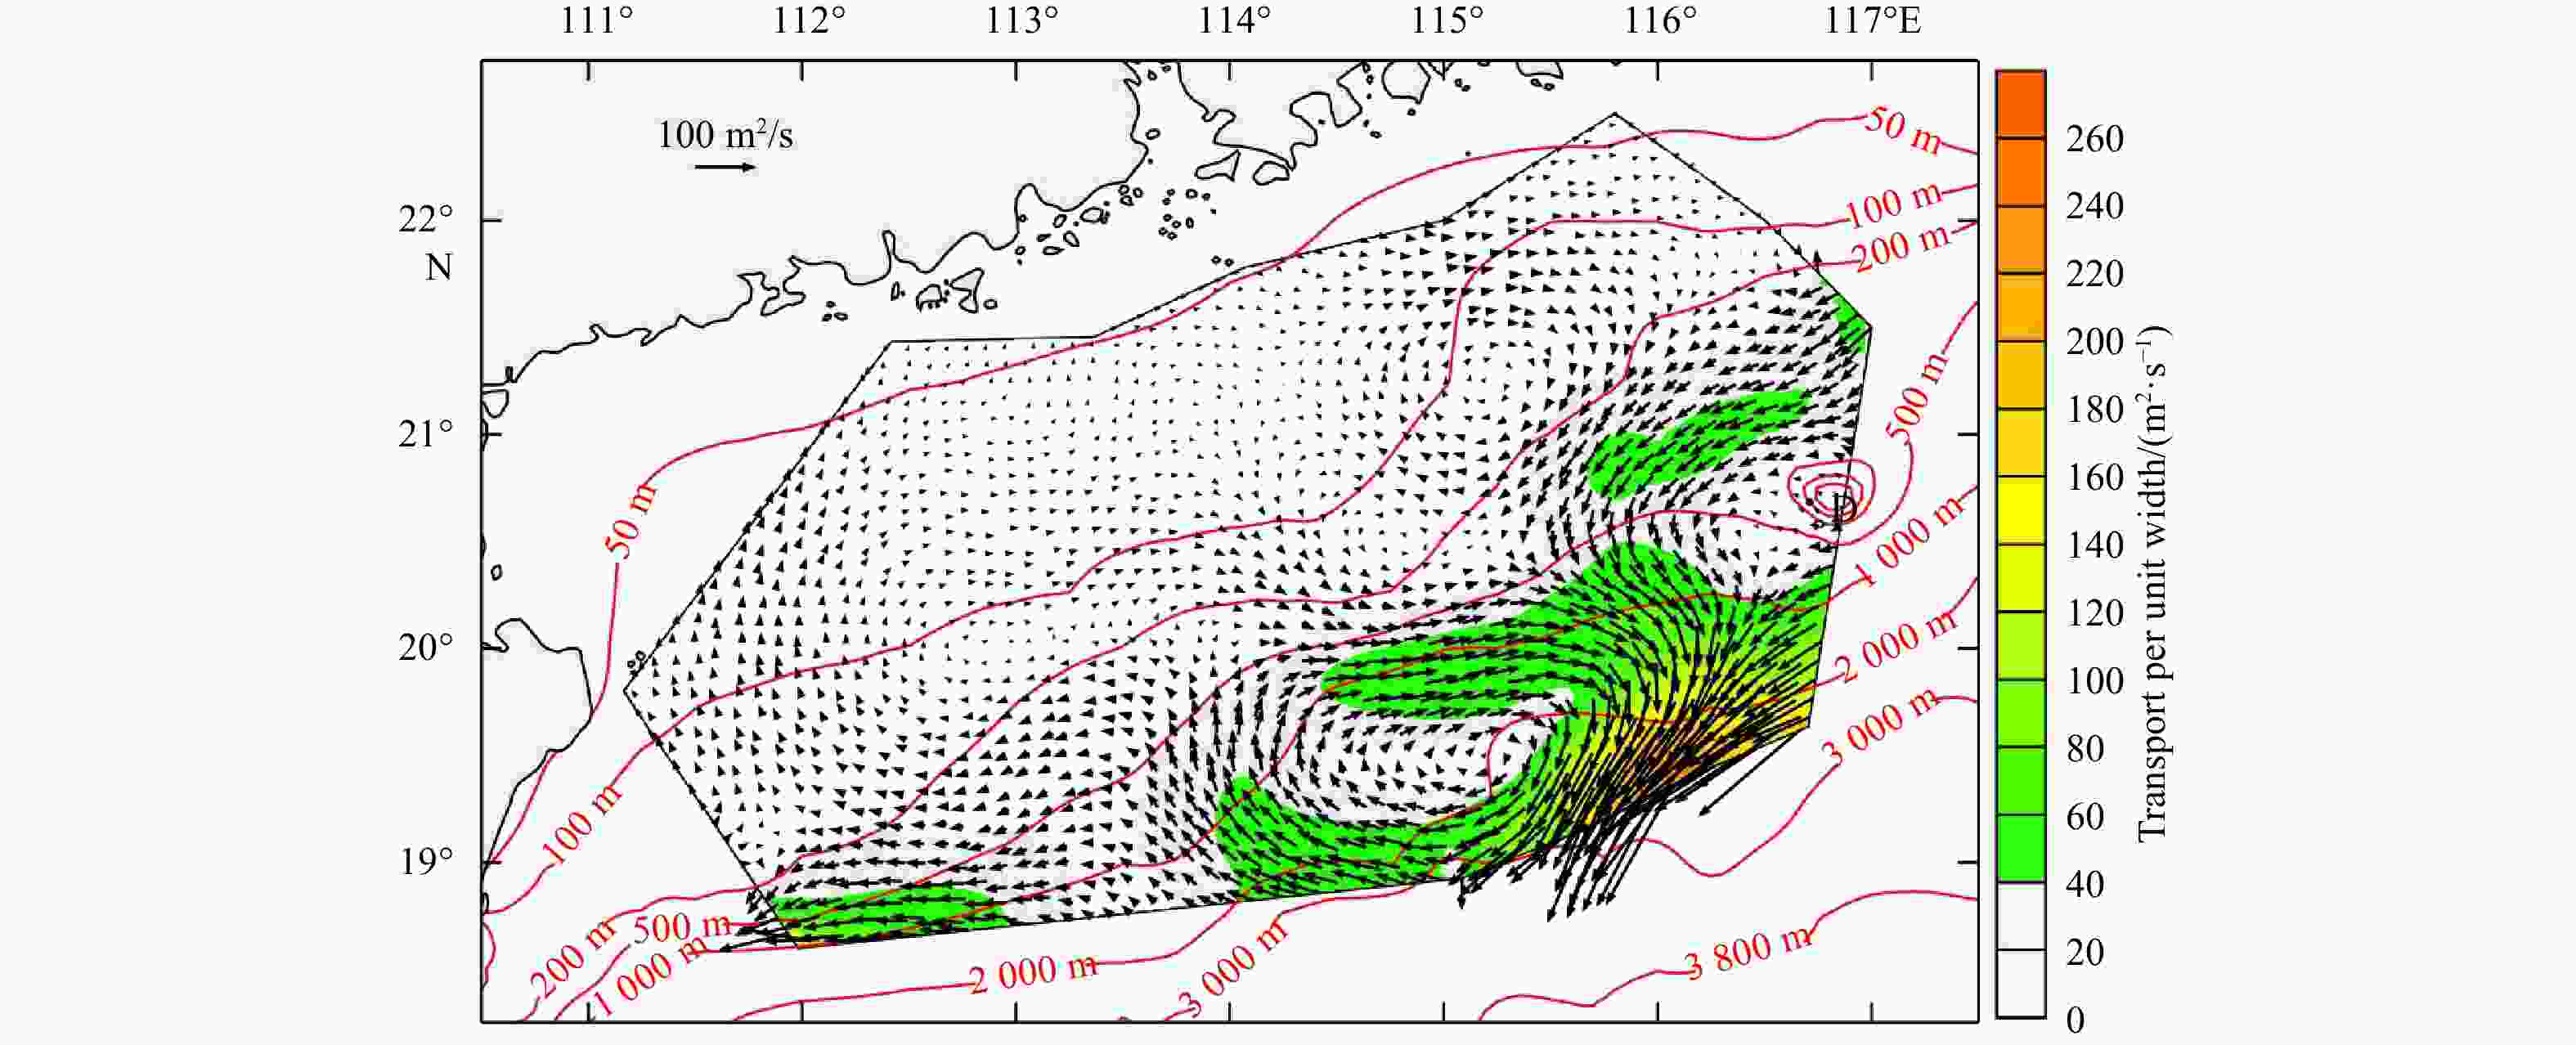
Figure 12. Transport per unit width (m2/s) for the semi-diagnostic calculation. Red contours indicate isobaths, and “D” indicates the Dongsha Islands.
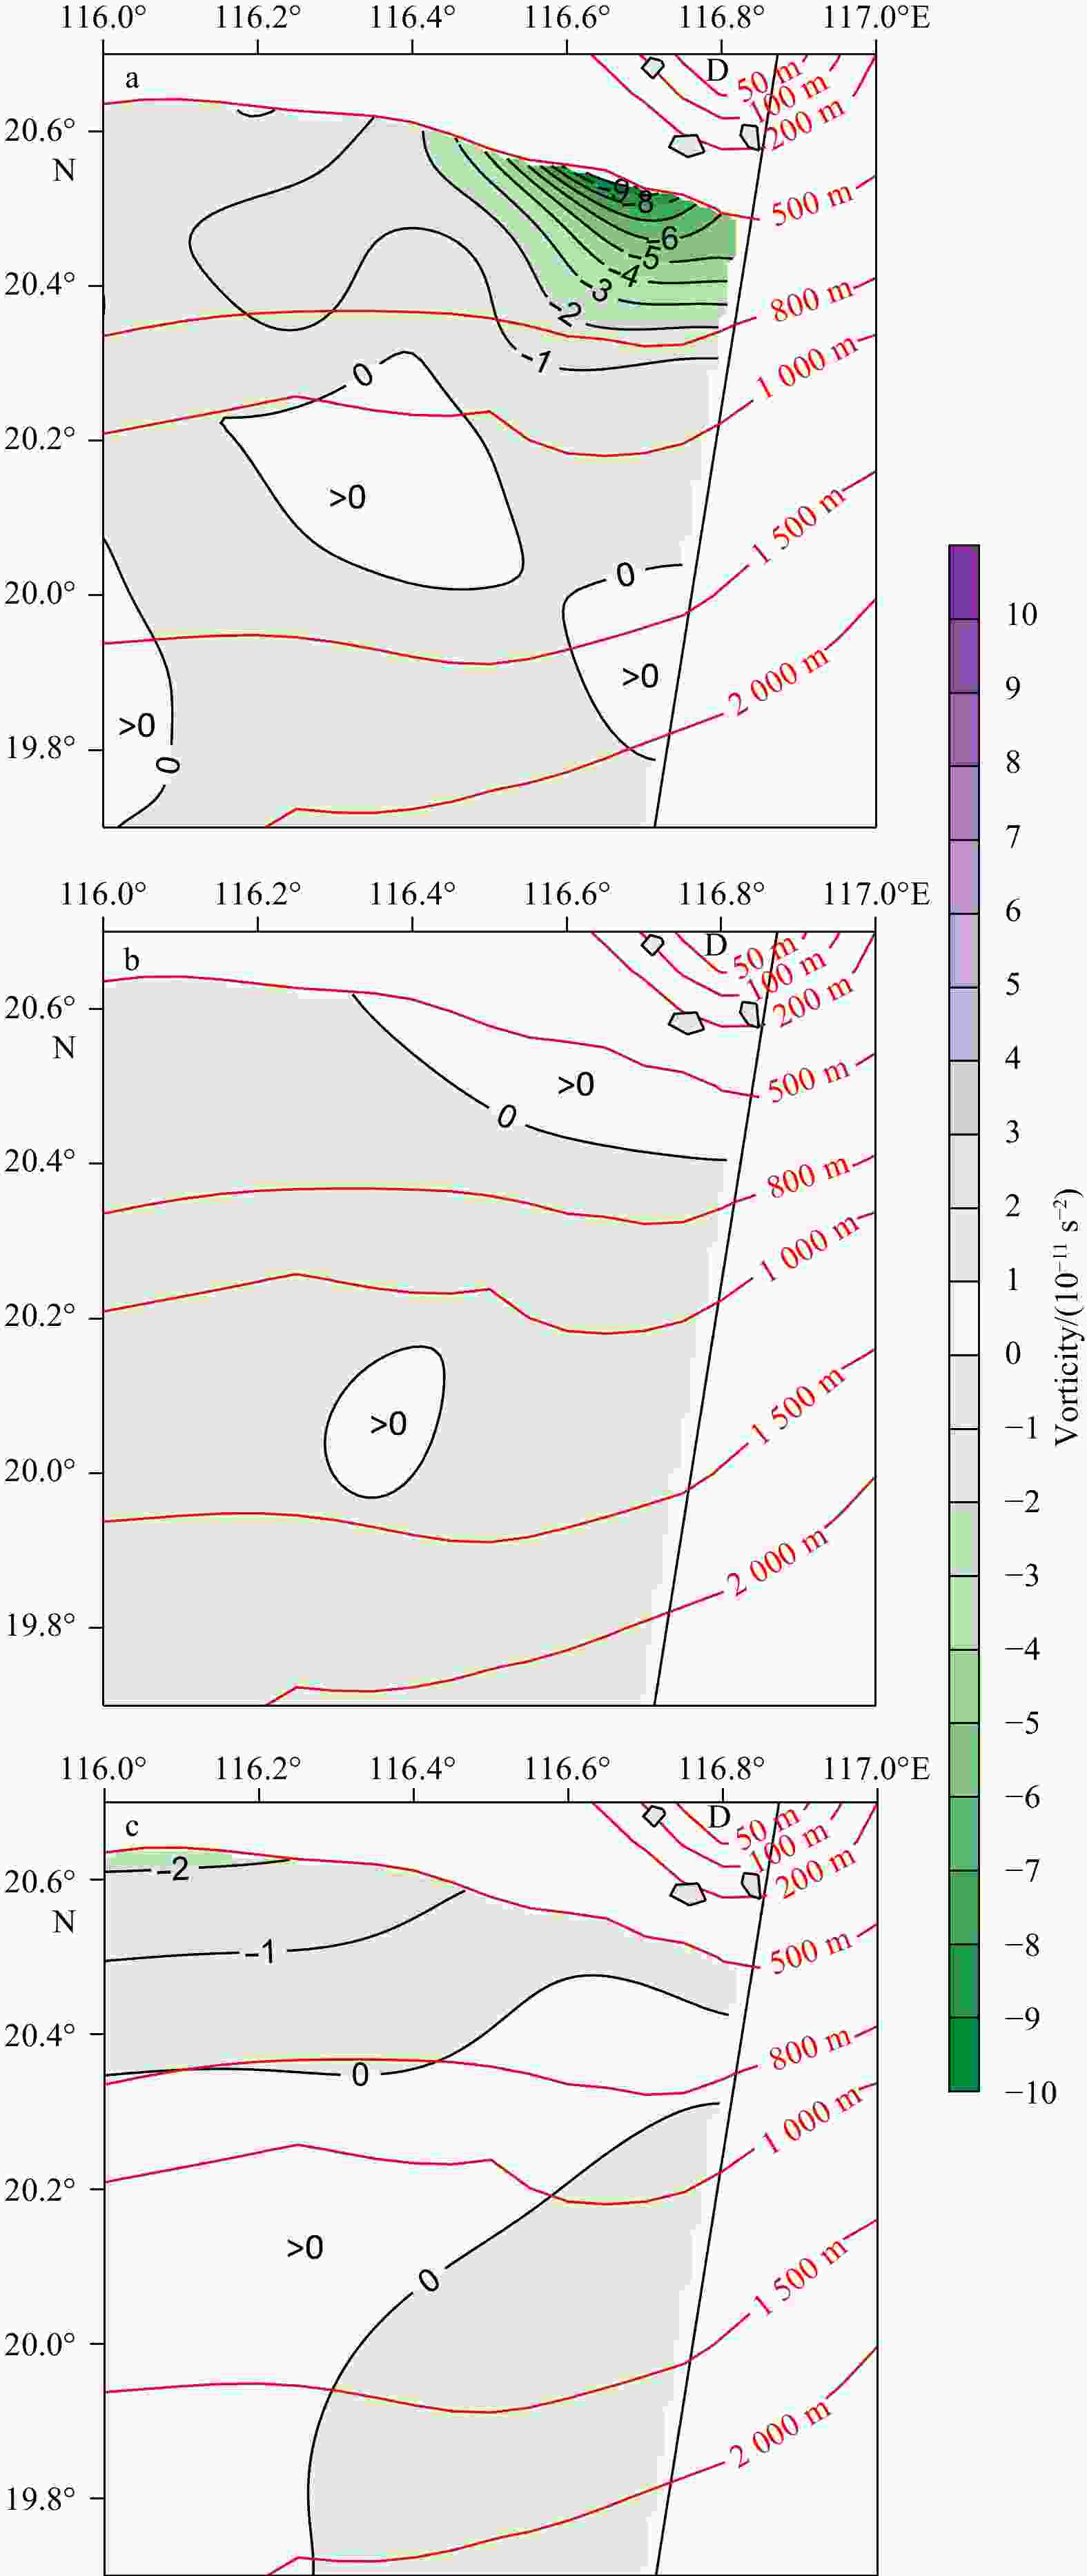
Figure 13. Distributions of vorticity terms (s−2) near the Dongsha Islands during the early summer of 2015 from the semi-diagnostic calculation. Term I (JEBAR) (a), Term II (b), and Term III (c) on the right-hand side of Eq. (11). Red contours indicate isobaths, and “D” indicates the Dongsha Islands.
-
[1] Adcroft A, Hill C, Marshall J. 1997. Representation of topography by shaved cells in a height coordinate ocean model. Monthly Weather Review, 125(9): 2293–2315. doi: 10.1175/1520-0493(1997)125<2293:ROTBSC>2.0.CO;2 [2] Amante C, Eakins B W. 2009. ETOPO1 1 Arc-minute global relief model: procedures, data sources and analysis. NOAA technical memorandum NESDIS NGDC-24. Colorado: National Geophysical Data Center, 19. http://dx.doi.org/10.7289/V5C8276M [3] Bryden H L. 1973. New polynomials for thermal expansion, adiabatic temperature gradient and potential temperature of sea water. Deep Sea Research and Oceanographic Abstracts, 20(4): 401–408. doi: 10.1016/0011-7471(73)90063-6 [4] Cai Shuqun, Liu Hailong, Li Wei, et al. 2005. Application of LICOM to the numerical study of the water exchange between the South China Sea and its adjacent oceans. Acta Oceanologica Sinica, 24(4): 10–19 [5] Cai Shuqun, Su Jilan, Gan Zijun, et al. 2002. The numerical study of the South China Sea upper circulation characteristics and its dynamic mechanism, in winter. Continental Shelf Research, 22(15): 2247–2264. doi: 10.1016/S0278-4343(02)00073-0 [6] Chen Gengxin, Gan Jianping, Xie Qiang, et al. 2012. Eddy heat and salt transports in the South China Sea and their seasonal modulations. Journal of Geophysical Research: Ocean, 117(C5): C05021 [7] Chen H W, Liu C T, Matsuno T, et al. 2016. Temporal variations of volume transport through the Taiwan Strait, as identified by three-year measurements. Continental Shelf Research, 114: 41–53. doi: 10.1016/j.csr.2015.12.010 [8] Chow C H, Hu J H, Centurioni L R, et al. 2008. Mesoscale Dongsha cyclonic eddy in the northern South China Sea by drifter and satellite observations. Journal of Geophysical Research: Oceans, 113(C4): C04018. doi: 10.1029/2007JC004542 [9] Chow C H, Liu Qinyu. 2012. Eddy effects on sea surface temperature and sea surface wind in the continental slope region of the northern South China Sea. Geophysical Research Letters, 39(2): L02601 [10] Danilov S, Kivman G, Schröter J. 2004. A finite-element ocean model: principles and evaluation. Ocean Modelling, 6(2): 125–150. doi: 10.1016/S1463-5003(02)00063-X [11] Danilov S, Kivman G, Schröter J. 2005. Evaluation of an eddy-permitting finite-element ocean model in the North Atlantic. Ocean Modelling, 10(1–2): 35–49. doi: 10.1016/j.ocemod.2004.07.006 [12] Dee D P, Uppala S M, Simmons A J, et al. 2011. The ERA-Interim reanalysis: configuration and performance of the data assimilation system. Quarterly Journal of the Royal Meteorological Society, 137(656): 553–597. doi: 10.1002/qj.828 [13] Fang Guohong, Fang Wendong, Fang Yue, et al. 1998. A survey of studies on the South China Sea upper ocean circulation. Acta Oceanographica Taiwan, 37(1): 1–16 [14] Fang Guohong, Wang Yonggang, Wei Zexun, et al. 2009. Interocean circulation and heat and freshwater budgets of the South China Sea based on a numerical model. Dynamics of Atmospheres and Oceans, 47(1–3): 55–72. doi: 10.1016/j.dynatmoce.2008.09.003 [15] Fang Guohong, Wei Zexun, Choi B H, et al. 2003. Interbasin freshwater, heat and salt transport through the boundaries of the East and South China Seas from a variable-grid global ocean circulation model. Science in China Series D: Earth Sciences, 46(2): 149–161. doi: 10.1360/03yd9014 [16] Fix G J. 1975. Finite element models for ocean circulation problems. SIAM Journal on Applied Mathematics, 29(3): 371–387. doi: 10.1137/0129031 [17] Gan Jianping, Li H, Curchitser E N, et al. 2006. Modeling South China Sea circulation: Response to seasonal forcing regimes. Journal of Geophysical Research: Oceans, 111(C6): C06034. doi: 10.1029/2005jc003298 [18] Guan Bingxian. 1985. Some features of the temporal and spatial distributions of the “counter-wind” current in northern South China Sea in winter. Oceanologia et Limnologia Sinica (in Chinese), 16(6): 429–438 [19] Guo Zhongxin, Yang Tianhong, Qiu Dezhong. 1985. The South China Sea Warm Current and the SW-ward current on its right side in winter. Journal of Tropical Oceanography (in Chinese), 4(1): 1–9 [20] He Yinghui, Cai Shuqun, Wang Dongxiao, et al. 2015. A model study of Luzon cold eddies in the northern South China Sea. Deep Sea Research Part I: Oceanographic Research Papers, 97: 107–123. doi: 10.1016/j.dsr.2014.12.007 [21] Hedstrom K S. 1997. User’s manual for an S-Coordinate Primitive Equation Ocean Circulation Model (SCRUM) version 3.0 (Technical Report 97-10). New Brunswick: Institute of Marine and Coastal Sciences, Rutgers University [22] Hsueh Y. 2000. The Kuroshio in the East China Sea. Journal of Marine Systems, 24(1–2): 131–139. doi: 10.1016/S0924-7963(99)00083-4 [23] Jackett D R, McDougall T J. 1995. Minimal adjustment of hydrographic profiles to achieve static stability. Journal of Atmospheric and Oceanic Technology, 12(2): 381–389. doi: 10.1175/1520-0426(1995)012<0381:MAOHPT>2.0.CO;2 [24] Large W G, McWilliams J C, Doney S C. 1994. Oceanic vertical mixing: A review and a model with a nonlocal boundary layer parameterization. Reviews of Geophysics, 32(4): 363–403. doi: 10.1029/94RG01872 [25] Li Ruixiang, Chen Changsheng, Xia Huayong, et al. 2014. Observed wintertime tidal and subtidal currents over the continental shelf in the northern South China Sea. Journal of Geophysical Research: Oceans, 119(8): 5289–5310. doi: 10.1002/2014JC009931 [26] Liao Guahong, Yuan Yaochu, Xu Xiaohua. 2007. Diagnostic calculation of the circulation in the South China Sea during summer 1998. Journal of Oceanography, 63(2): 161–178. doi: 10.1007/s10872-007-0019-4 [27] Liu Yonggang, Yuan Yaochu, Su Jilan, et al. 2000. Circulation in the South China Sea in summer of 1998. Chinese Science Bulletin, 45(18): 1648–1655. doi: 10.1007/BF02898979 [28] Marchesiello P, McWilliams J C, Shchepetkin A. 2001. Open boundary conditions for long-term integration of regional oceanic models. Ocean Modelling, 3(1–2): 1–20. doi: 10.1016/S1463-5003(00)00013-5 [29] Mertz G, Wright D G. 1992. Interpretations of the JEBAR Term. Journal of Physical Oceanography, 22(3): 301–305. doi: 10.1175/1520-0485(1992)022<0301:IOTJT>2.0.CO;2 [30] Nan Feng, Xue Huijie, Xiu Peng, et al. 2011. Oceanic eddy formation and propagation southwest of Taiwan. Journal of Geophysical Research: Oceans, 116(C12): C12045. doi: 10.1029/2011JC007386 [31] Pacanowski R C, Philander S G H. 1981. Parameterization of vertical mixing in numerical models of tropical oceans. Journal of Physical Oceanography, 11(11): 1443–1451. doi: 10.1175/1520-0485(1981)011<1443:POVMIN>2.0.CO;2 [32] Qu Tangdong. 2000. Upper-layer circulation in the South China Sea. Journal of Physical Oceanography, 30(6): 1450–1460. doi: 10.1175/1520-0485(2000)030<1450:ULCITS>2.0.CO;2 [33] Qu Tangdong, Kim Y Y, Yaremchuk M, et al. 2004. Can Luzon strait transport play a role in conveying the impact of ENSO to the South China Sea?. Journal of Climate, 17(18): 3644–3657. doi: 10.1175/1520-0442(2004)017<3644:CLSTPA>2.0.CO;2 [34] Sarkisyan, A S, Demin Y L. 1983. A semidiagnostic method of sea currents calculation. In: Large Scale Oceanographic Experiments in the World Climate Research Programme. Tokyo, Japan: WMO-ICSU Joint Scientific Committee, 201–214 [35] Shu Yeqiang, Chen Ju, Yao Jinglong, et al. 2014. Effects of the Pearl River plume on the vertical structure of coastal currents in the Northern South China Sea during summer 2008. Ocean Dynamics, 64(12): 1743–1752. doi: 10.1007/s10236-014-0779-5 [36] Su Jilan. 2004. Overview of the South China Sea circulation and its influence on the coastal physical oceanography outside the Pearl River Estuary. Continental Shelf Research, 24(16): 1745–1760. doi: 10.1016/j.csr.2004.06.005 [37] Tseng Y H, Shen Maolin, Jan Sen, et al. 2012. Validation of the Kuroshio current system in the dual-domain Pacific Ocean model framework. Progress in Oceanography, 105: 102–124. doi: 10.1016/j.pocean.2012.04.003 [38] Wang Guihua, Chen Dake, Su Jilan. 2006. Generation and life cycle of the dipole in the South China Sea summer circulation. Journal of Geophysical Research, 111(C6): C06002. doi: 10.1029/2005JC003314 [39] Wang Qiang, Danilov S, Hellmer H, et al. 2010a. Overflow dynamics and bottom water formation in the western Ross Sea: influence of tides. Journal of Geophysical Research: Oceans, 115(C10): C10054. doi: 10.1029/2010jc006189 [40] Wang Qiang, Danilov S, Schröter J. 2008a. Comparison of overflow simulations on different vertical grids using the finite element ocean circulation model. Ocean Modelling, 20(4): 313–335. doi: 10.1016/j.ocemod.2007.10.005 [41] Wang Qiang, Danilov S, Schröter J, et al. 2008b. Finite element ocean circulation model based on triangular prismatic elements, with application in studying the effect of topography representation. Journal of Geophysical Research: Oceans, 113(C5): C05015. doi: 10.1029/2007JC004482 [42] Wang Dongxiao, Hong Bo, Gan Jianping, et al. 2010b. Numerical investigation on propulsion of the counter-wind current in the northern South China Sea in winter. Deep Sea Research Part I: Oceanographic Research Papers, 57(10): 1206–1221. doi: 10.1016/j.dsr.2010.06.007 [43] Wang Huiqun, Yuan Yaochu. 2001. Three dimensional diagnostic, semidiagnostic and prognostic calculations of current in the East China Sea in April of 1994. Acta Oceanologica Sinica, 20(1): 15–28 [44] Wang Huiqun, Yuan Yaochu, Guan Weibing, et al. 2004. Circulation in the South China Sea during summer 2000 as obtained from observations and a generalized topography-following ocean model. Journal of Geophysical Research: Oceans, 109(C7): C07007. doi: 10.1029/2003JC002134 [45] Wang Huiqun, Yuan Yaochu, Guan Weibing, et al. 2012. Circulation around Luzon strait in September as inferred from CTD, Argos and Argo measurements and a generalized topography-following ocean model. Atmosphere-Ocean, 50(S1): 40–58. doi: 10.1080/07055900.2012.741563 [46] Wang Dongxiao, Wang Qiang, Zhou Weidong, et al. 2013. An analysis of the current deflection around Dongsha Islands in the northern South China Sea. Journal of Geophysical Research: Oceans, 118(1): 490–501. doi: 10.1029/2012JC008429 [47] Wang Qiang, Wang Yinxia, Zhou Weidong, et al. 2015. Dynamic of the upper cross-isobath’s flow on the northern South China Sea in summer. Aquatic Ecosystem Health & Management, 18(4): 357–366. doi: 10.1080/14634988.2015.1112124 [48] Wang Qiang, Zeng Lili, Chen Ju, et al. 2020. The linkage of Kuroshio intrusion and mesoscale eddy variability in the northern South China Sea: Subsurface speed maximum. Geophysical Research Letters, 47(11): e2020GL087034. doi: 10.1029/2020GL087034 [49] Yan Tong, Qi Yiquan, Jing Zhiyou. 2015. A numerical study on the responses of the South China Sea upper circulation to different climatological wind products. Journal of Tropical Oceanography (in Chinese), 34(4): 1–11 [50] Yang Yikai, Wang Dongxiao, Wang Qiang, et al. 2019. Eddy-induced transport of saline Kuroshio water into the northern South China Sea. Journal of Geophysical Research: Oceans, 124(9): 6673–6687. doi: 10.1029/2018JC014847 [51] Yuan Yaochu, Kaneko A, Su Jilan, et al. 1998. The Kuroshio East of Taiwan and in the East China Sea and the Currents East of Ryukyu Islands during Early Summer of 1996. Journal of Oceanography, 54(3): 217–226. doi: 10.1007/BF02751697 [52] Yuan Yaochu, Liao Guanghong, Guan Weibing, et al. 2008. The circulation in the upper and middle layers of the Luzon Strait during spring 2002. Journal of Geophysical Research: Oceans, 113(C6): C06004. doi: 10.1029/2007JC004546 [53] Yuan Yaochu, Liao Guanghong, Kaneko A, et al. 2012. Currents in the Luzon Strait obtained from moored ADCP observations and a diagnostic calculation of circulation in spring 2008. Dynamics of Atmospheres and Oceans, 58: 20–43. doi: 10.1016/j.dynatmoce.2012.07.002 [54] Yuan Yaochu, Liao Guanghong, Xu Xiaohua. 2007. Three dimensional diagnostic modeling study of the South China Sea circulation before onset of summer monsoon in 1998. Journal of Oceanography, 63(1): 77–100. doi: 10.1007/s10872-007-0007-8 [55] Yuan Yaochu, Liao Guanghong, Yang Chenghao. 2009. A diagnostic calculation of the circulation in the upper and middle layers of the Luzon Strait and the northern South China Sea during March 1992. Dynamics of Atmospheres and Oceans, 47(1–3): 86–113. doi: 10.1016/j.dynatmoce.2008.10.005 [56] Yuan Yaochu, Liao Guanghong, Yang Chenghao, et al. 2014. Summer Kuroshio Intrusion through the Luzon Strait confirmed from observations and a diagnostic model in summer 2009. Progress in Oceanography, 121: 44–59. doi: 10.1016/j.pocean.2013.10.003 [57] Yuan Yaochu, Su Jilan, Pan Ziqin. 1992. Volume and heat transports of the Kuroshio in the East China Sea in 1989. La mer, 20: 251–262 [58] Yuan Yaochu, Zhu Xiaohua, Zhou Feng. 2015. Progress of studies in China from July 2010 to May 2015 on the influence of the Kuroshio on neighboring Chinese seas and the Ryukyu Current. Acta Oceanologica Sinica, 34(12): 1–10. doi: 10.1007/s13131-015-0771-z [59] Zhao Huanting. 1990. Evolution of the Pearl River Estuary (in Chinese). Beijing: China Ocean Press, 357 -

 下载:
下载:


 点击查看大图

计量
- 文章访问数: 408
- HTML全文浏览量: 156
- PDF下载量: 21
- 被引次数: 0

