

Possible triggering relationship of six Mw > 6 earthquakes in 2018–2019 at Philippine archipelago
-
Abstract: Philippine archipelago (PA) has strong background seismicity, but there is no systematic study of earthquake triggering in this region. There are six earthquakes (Mw > 6) occurred between 2018/12/29 and 2019/09/29 in PA, which provides an excellent opportunity to investigate the triggering relationship among these events. We calculate the static Coulomb stress changes of the first five events, and find that the local seismicity after the 2018/12/29 Mw 7.0 earthquake is mostly associated with positive Coulomb stress changes, including the 2019/05/31 Mw 6.1 event, suggesting a possible triggering relationship. However, we cannot rule out the dynamic triggering mechanism, due to increased microseismicity in both positive and negative stress change regions, and an incomplete local catalog, especially right after the first Mw 7.0 mainshock. The dynamic stresses from these Mw > 6 events are large enough (from 5 kPa to 3532 kPa) to trigger subsequent events, but a lack of seismicity and waveform evidence does not support delayed dynamic triggering among these events, even the shortest time interval is less than 24 hours. In the past 45 years, the released seismic energy shows certain peaks every 5–10 years. However, earthquakes with Mw > 6.0 were relatively infrequent between 2004 and 2018 at PA. Hence, it is possible that several regions are relatively late in their earthquake cycles, which would enhance their susceptibility of being triggered by earthquakes at nearby and regional distances.
-
Key words:
- static triggering /
- dynamic triggering /
- seismicity /
- ETAS model /
- Philippine archipelago
-
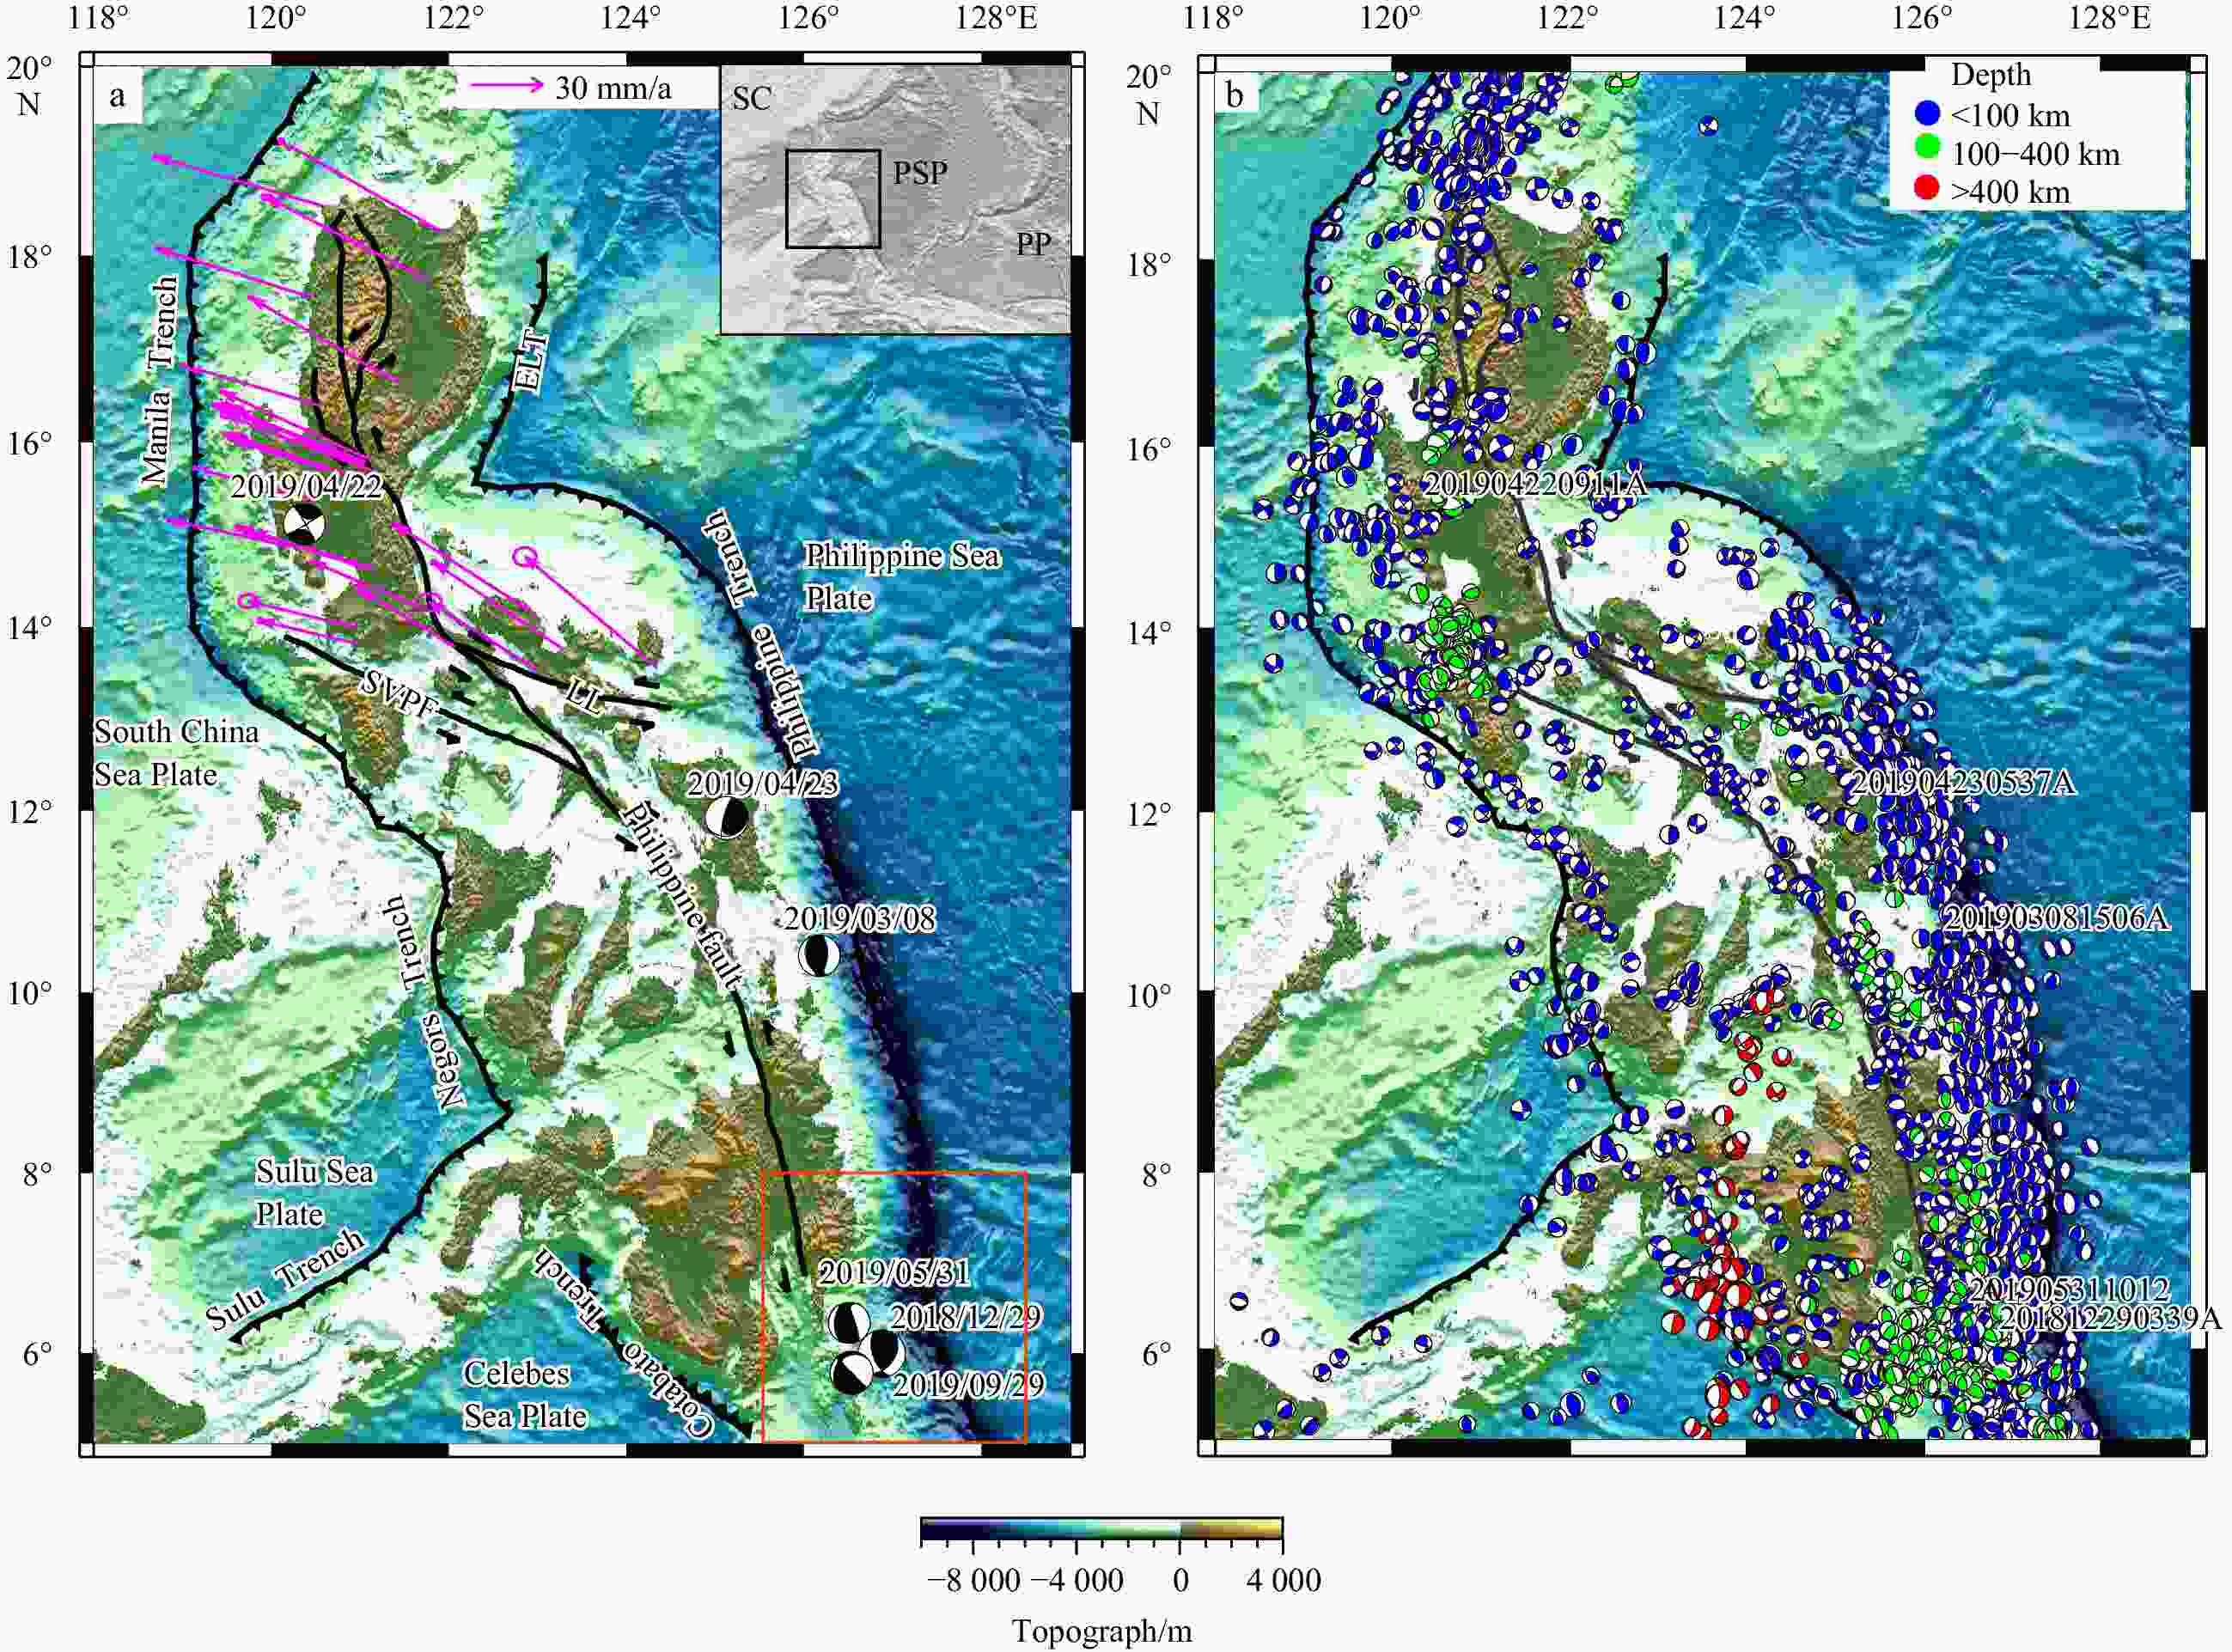
Figure 1. The tectonic background (a) and focal mechanisms of earthquakes (b) at Philippines archipelago (PA). The purple lines and circles indicate the GPS velocity and errors, with respect to the Eurasian Plate. The velocity ranges from 4.9 cm/a to 8.5 cm/a (Yu et al., 2013). The main tectonic features are modified from Aurelio et al. (2017), and Wu et al. (2017). The focal mechanism of the six earthquakes and others (1976–2019) are obtained from the GCMT catalog. The red box in a marks the zoom-in region plotted in Fig. 2. LL: Legaspi Lineament; SVPF: Verde Passage Fault-Sibuyan Sea Fault; SC: South China; PSP: Philippine Sea Plate; PP: Pacific Plate.
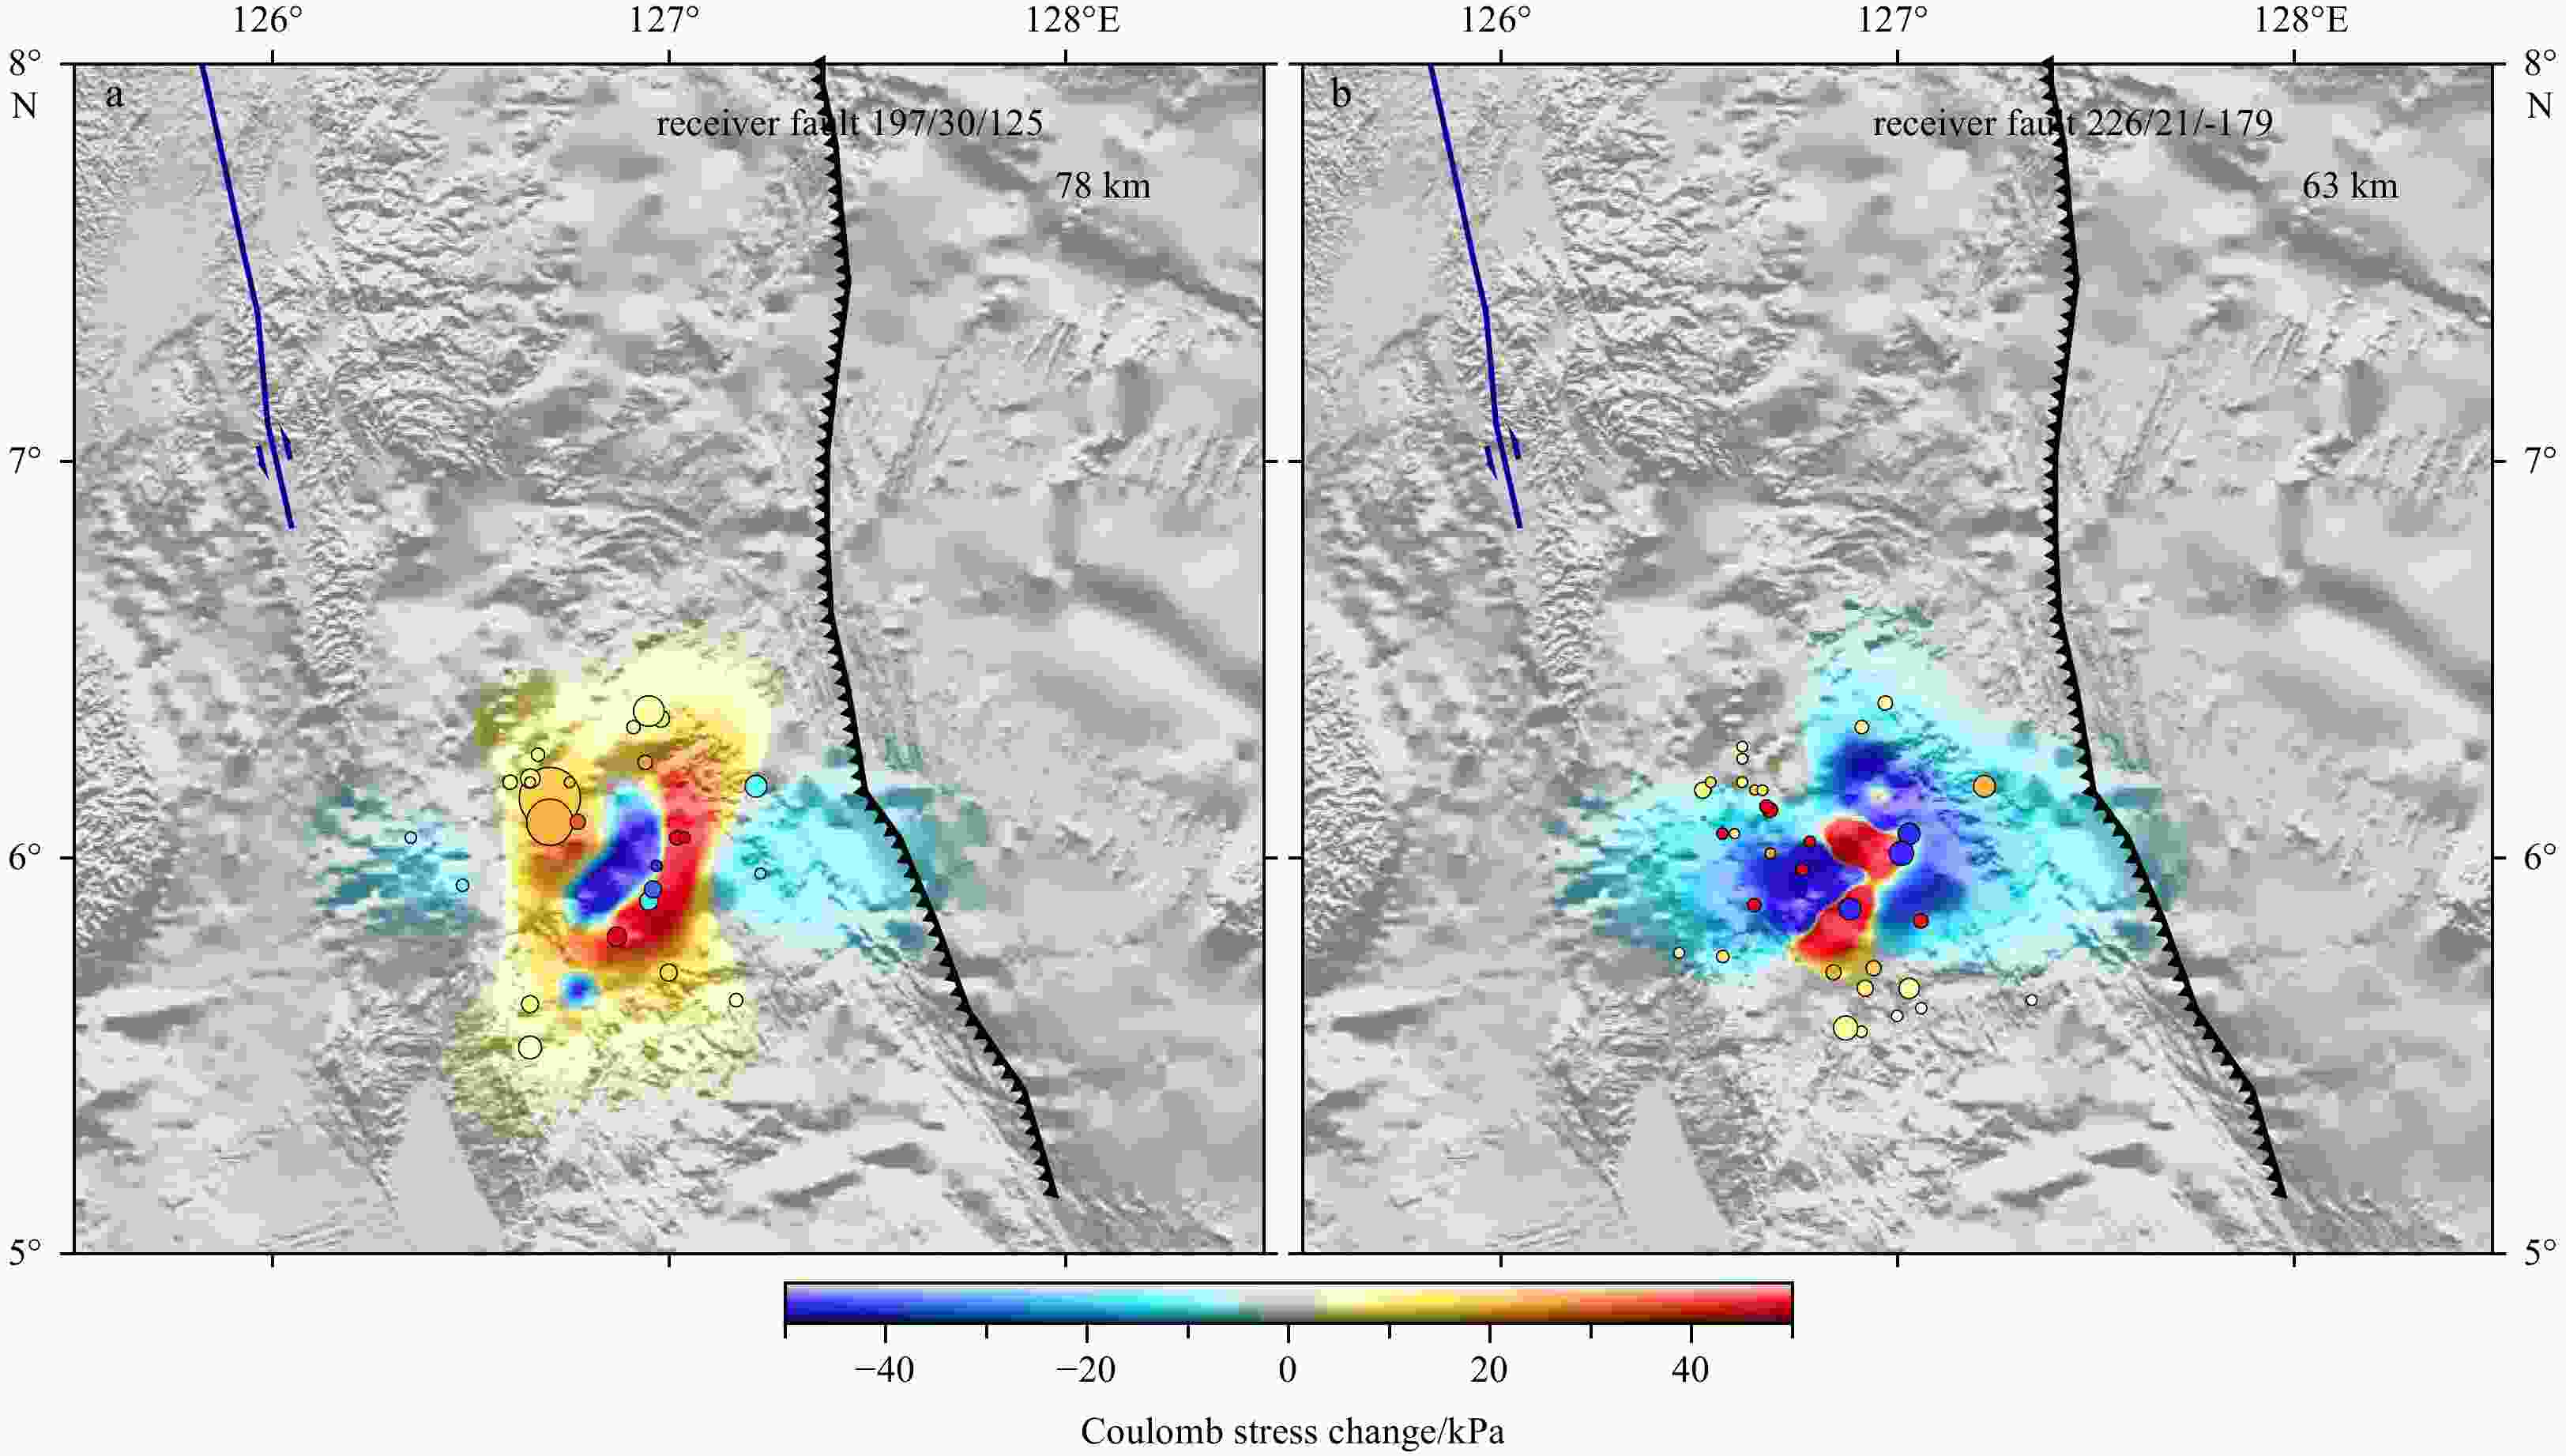
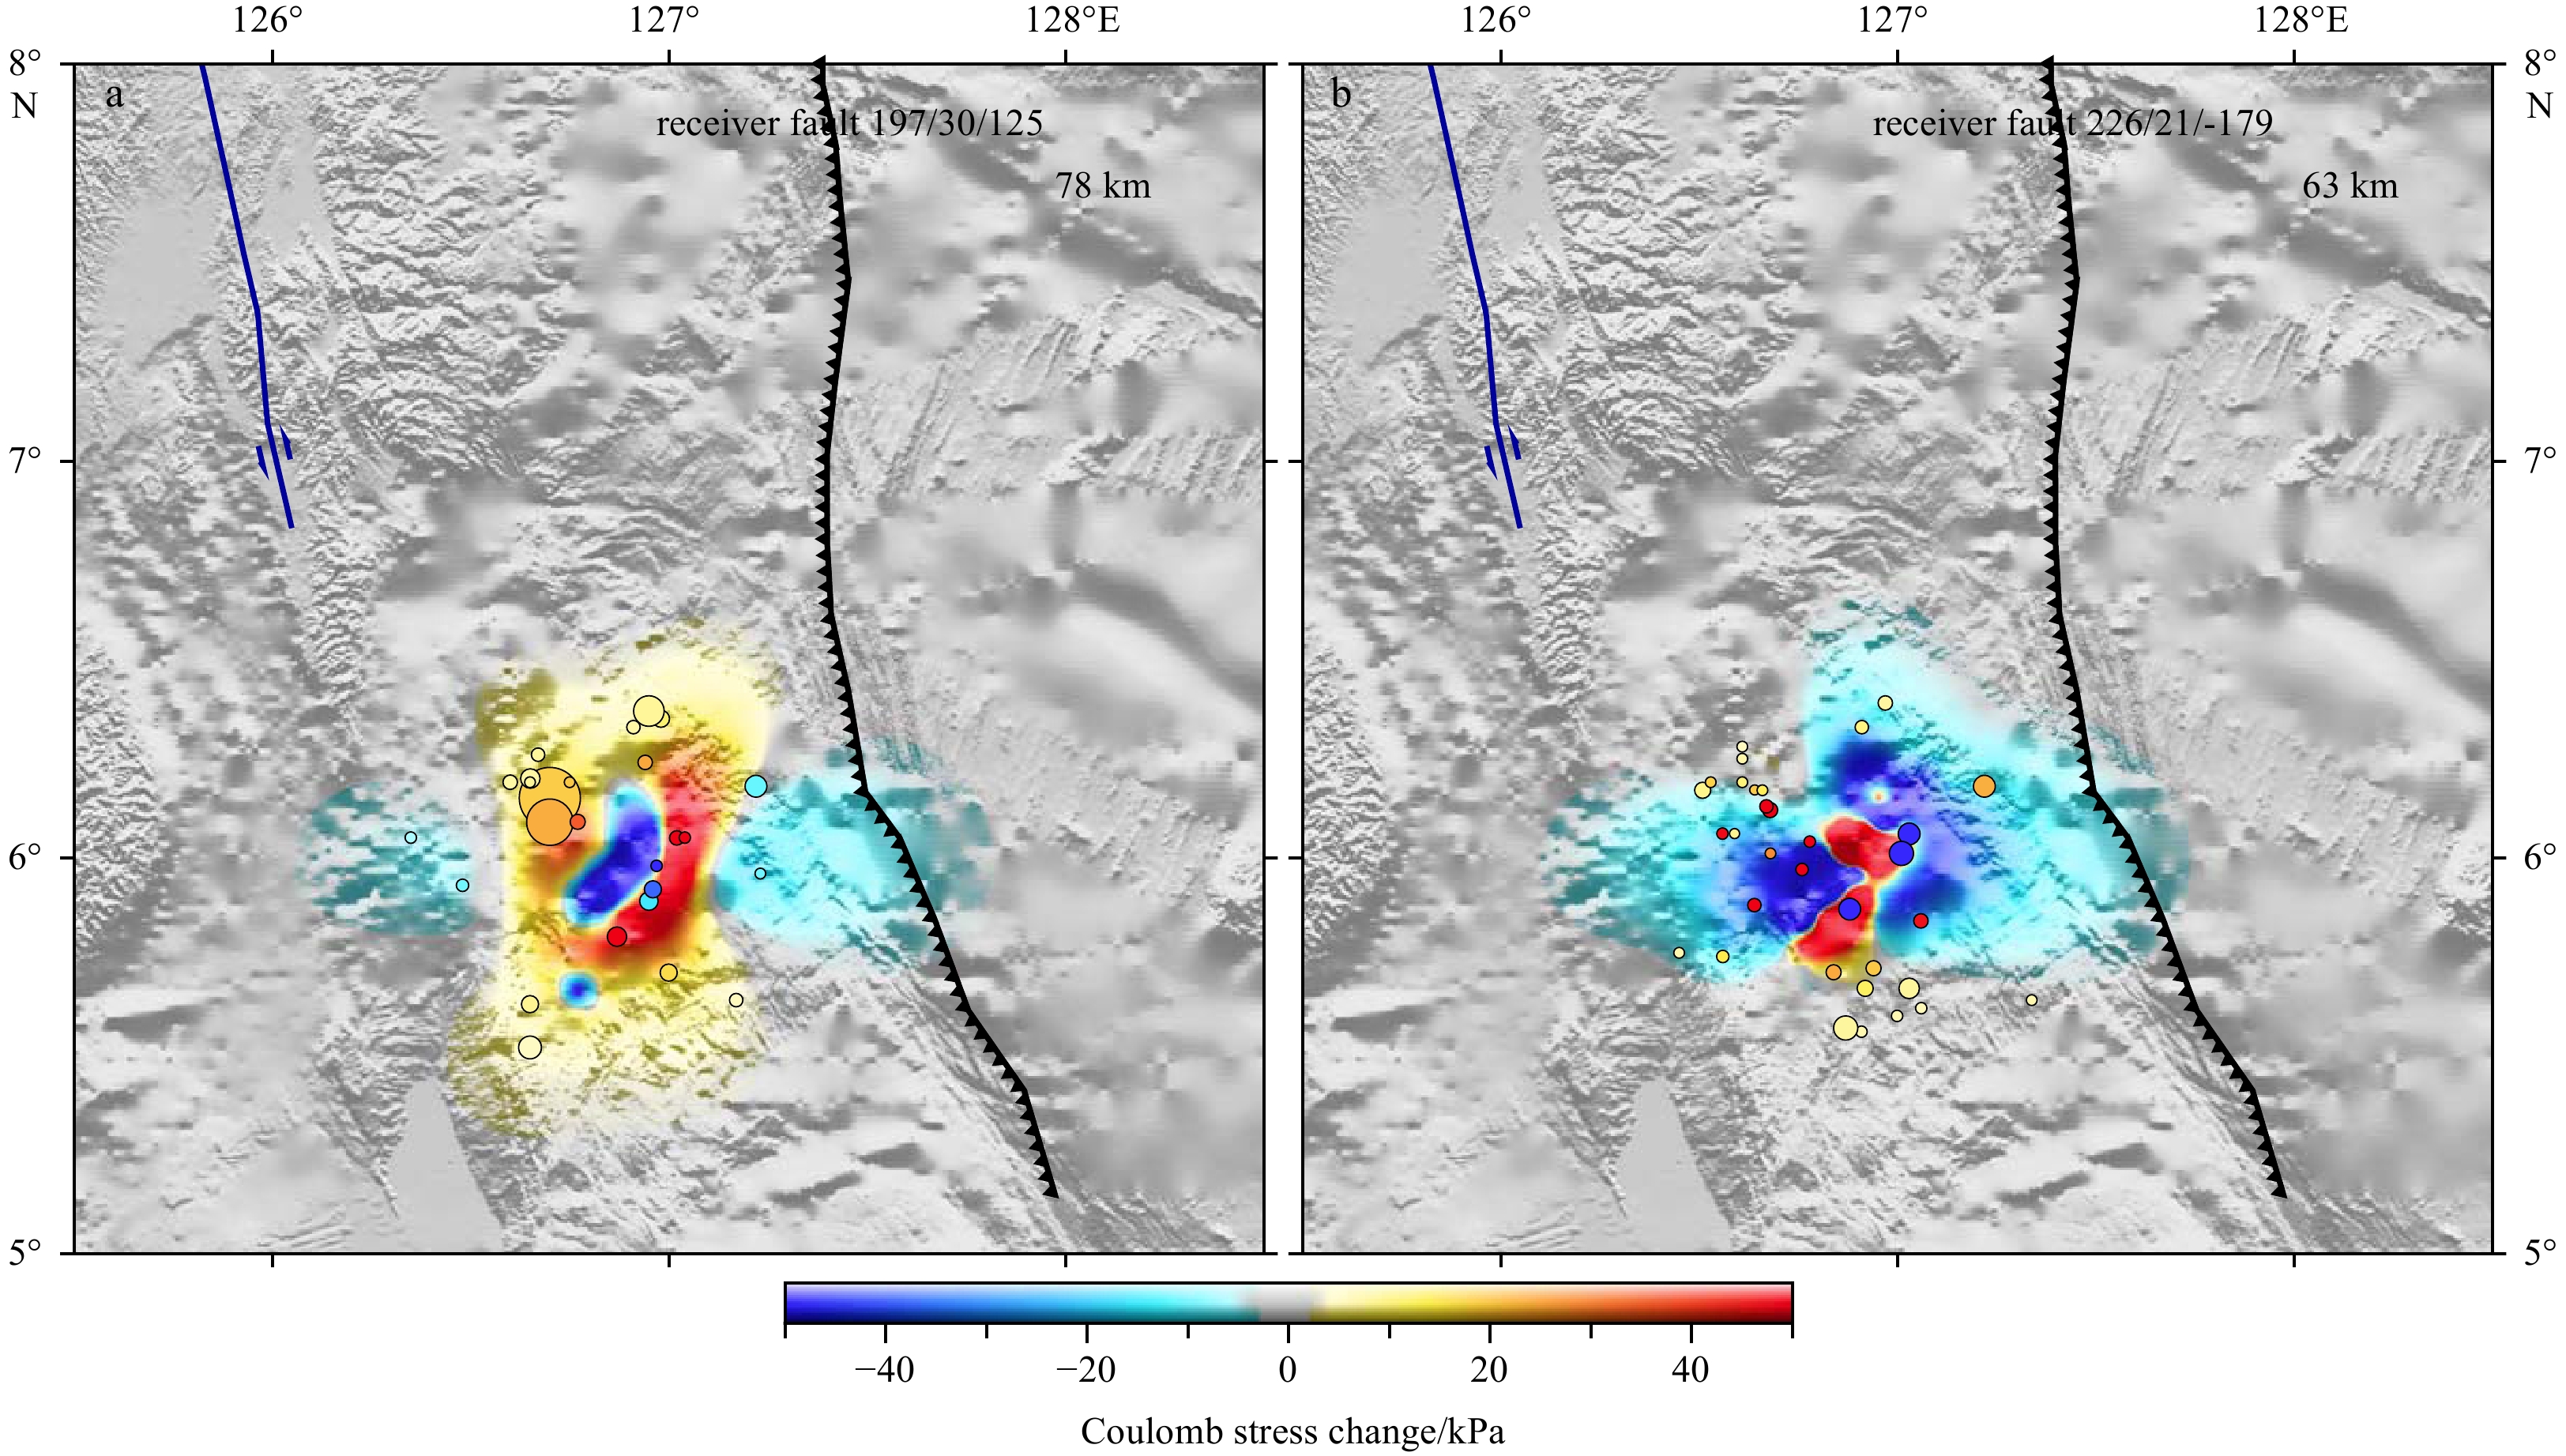
Figure 2. Coulomb stress changes generated by the first event (2018/12/29, Mw 7.0). The source fault model is based on the finite slip model from USGS website (
https://earthquake.usgs.gov/earthquakes/eventpage/us2000iyta/finite-fault ). The Coulomb stress changes are computed at depth of 78 km and 63 km, receiver fault mechanism was set to be the fifth event (a, c, and e: 2019/05/31, Mw 6.1) and the sixth event (b, d, and f: 2019/09/29, Mw 6.2). Solid circles show the local events (Mw ≥ 3.5) with Coulomb stress change$\Delta {\sigma }_{{\rm{c}}}$ ≥ 5 kPa, within different depth range ±10 km.
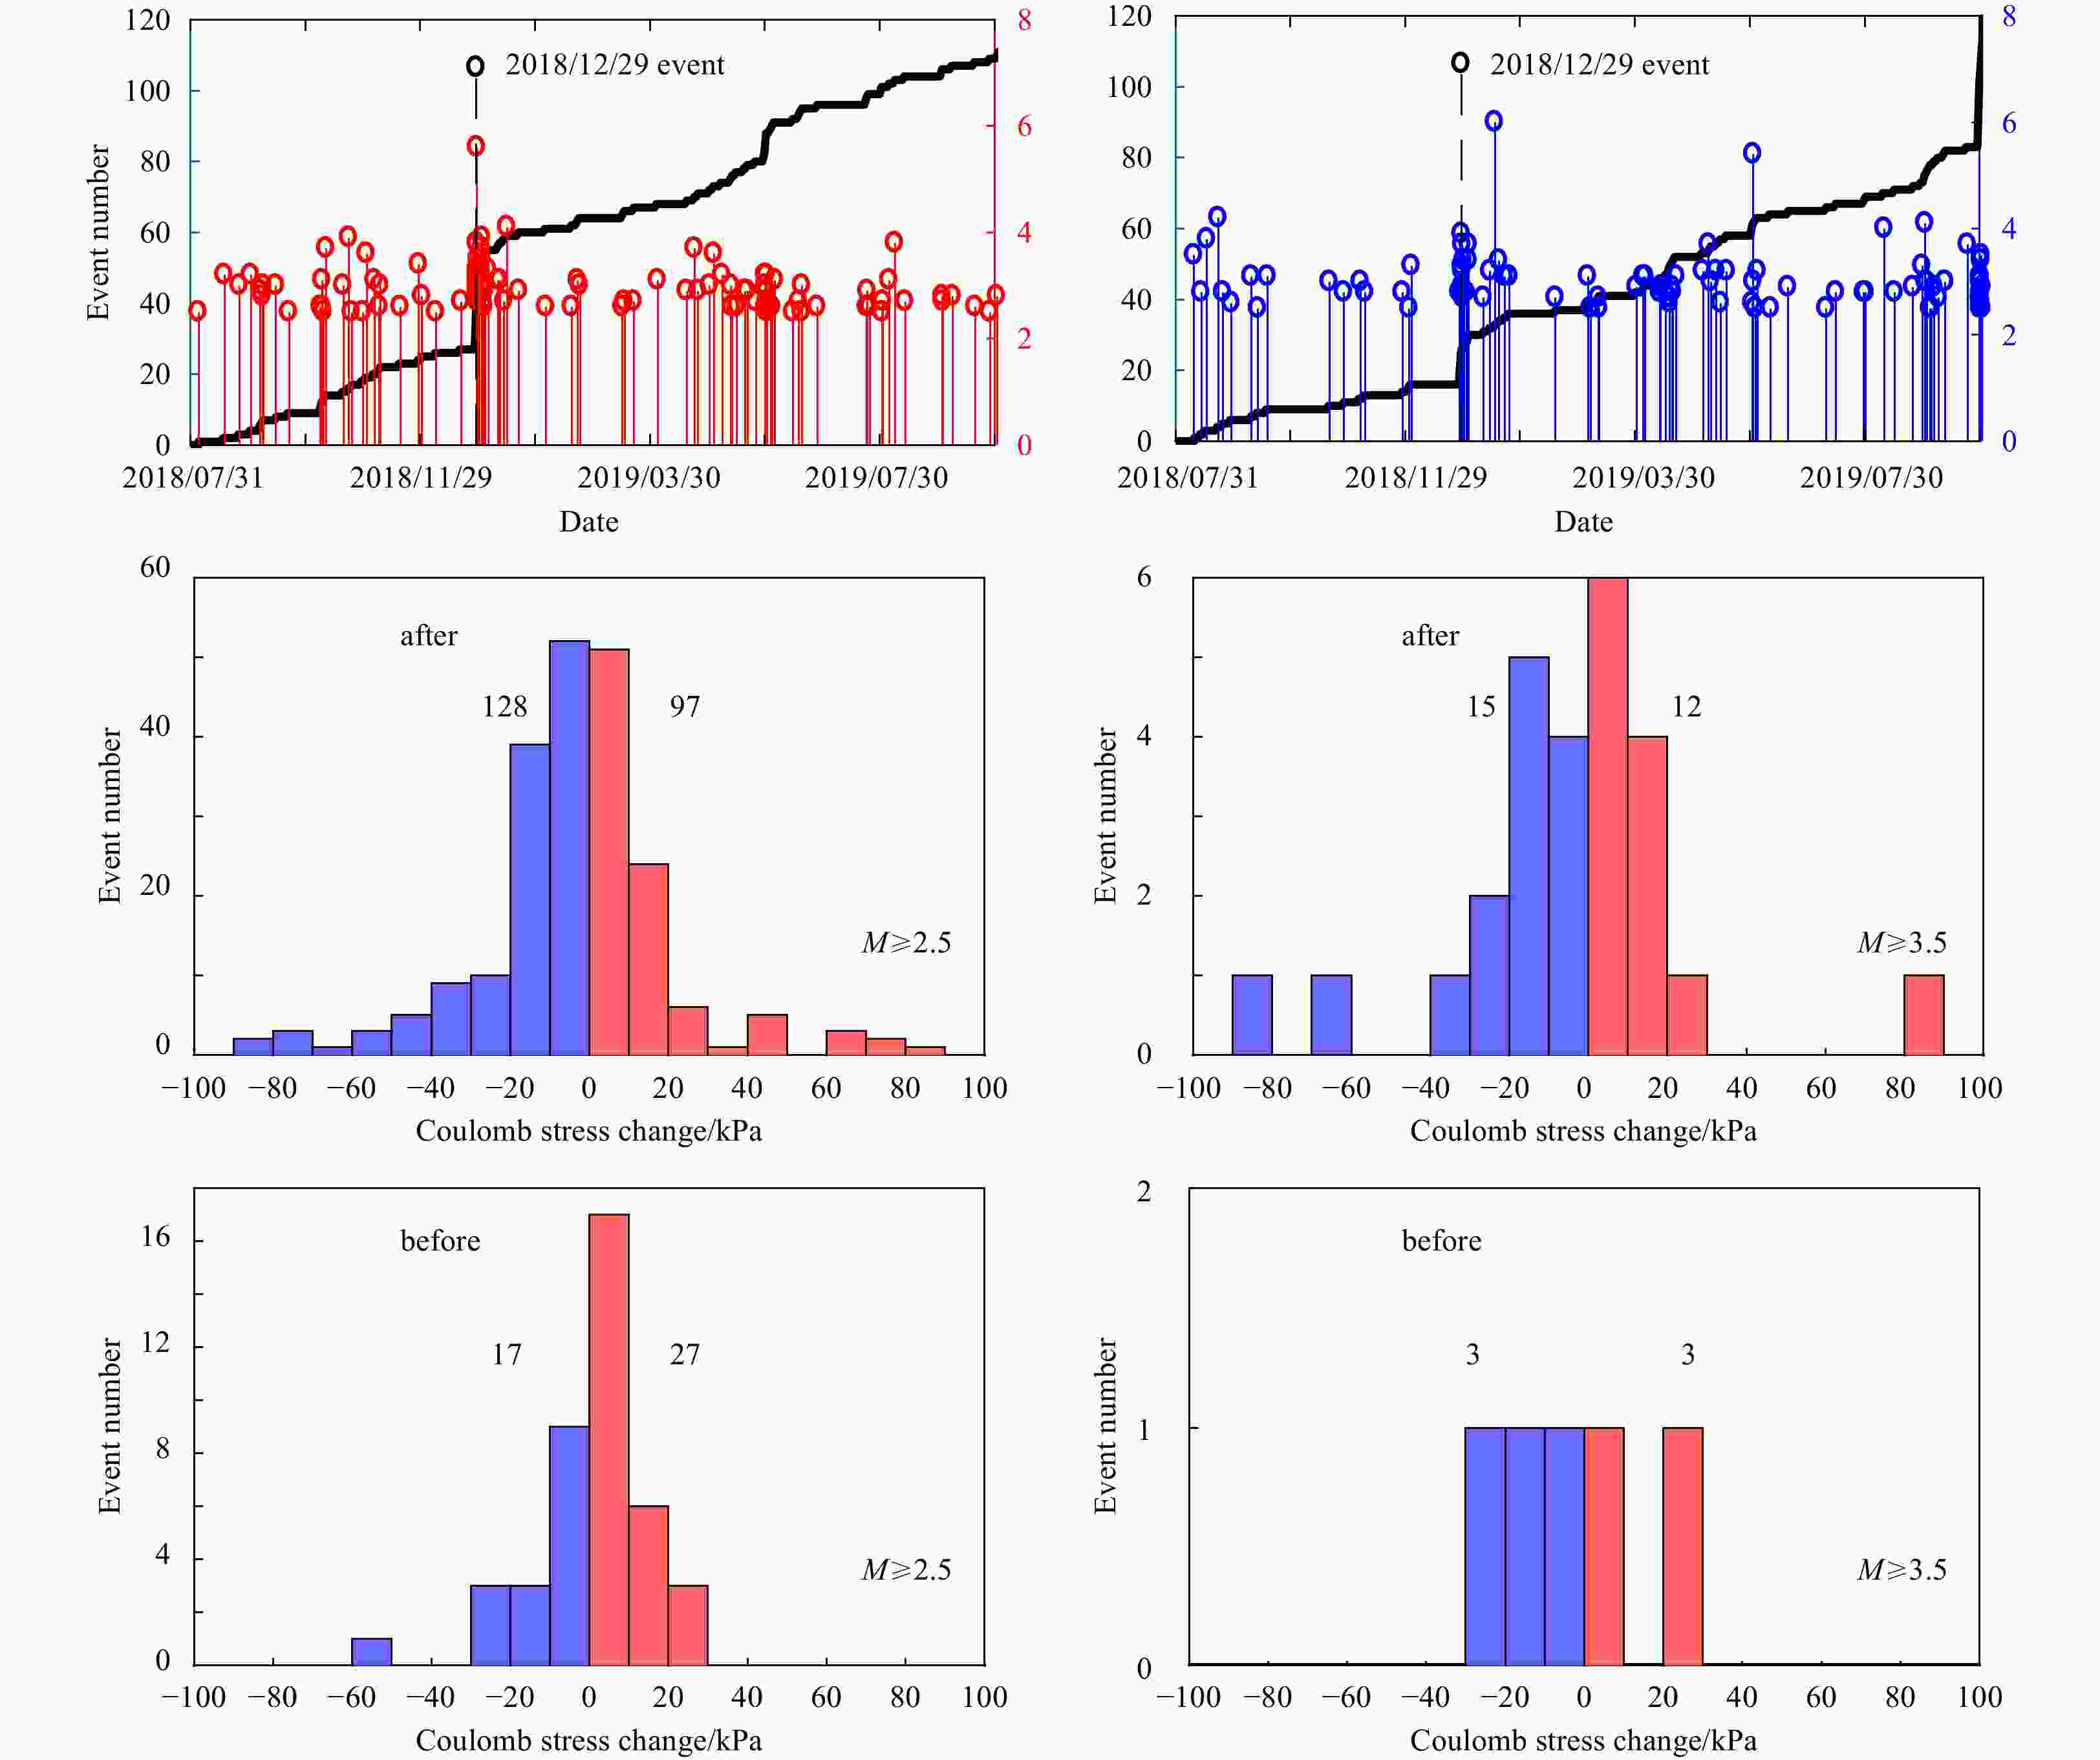
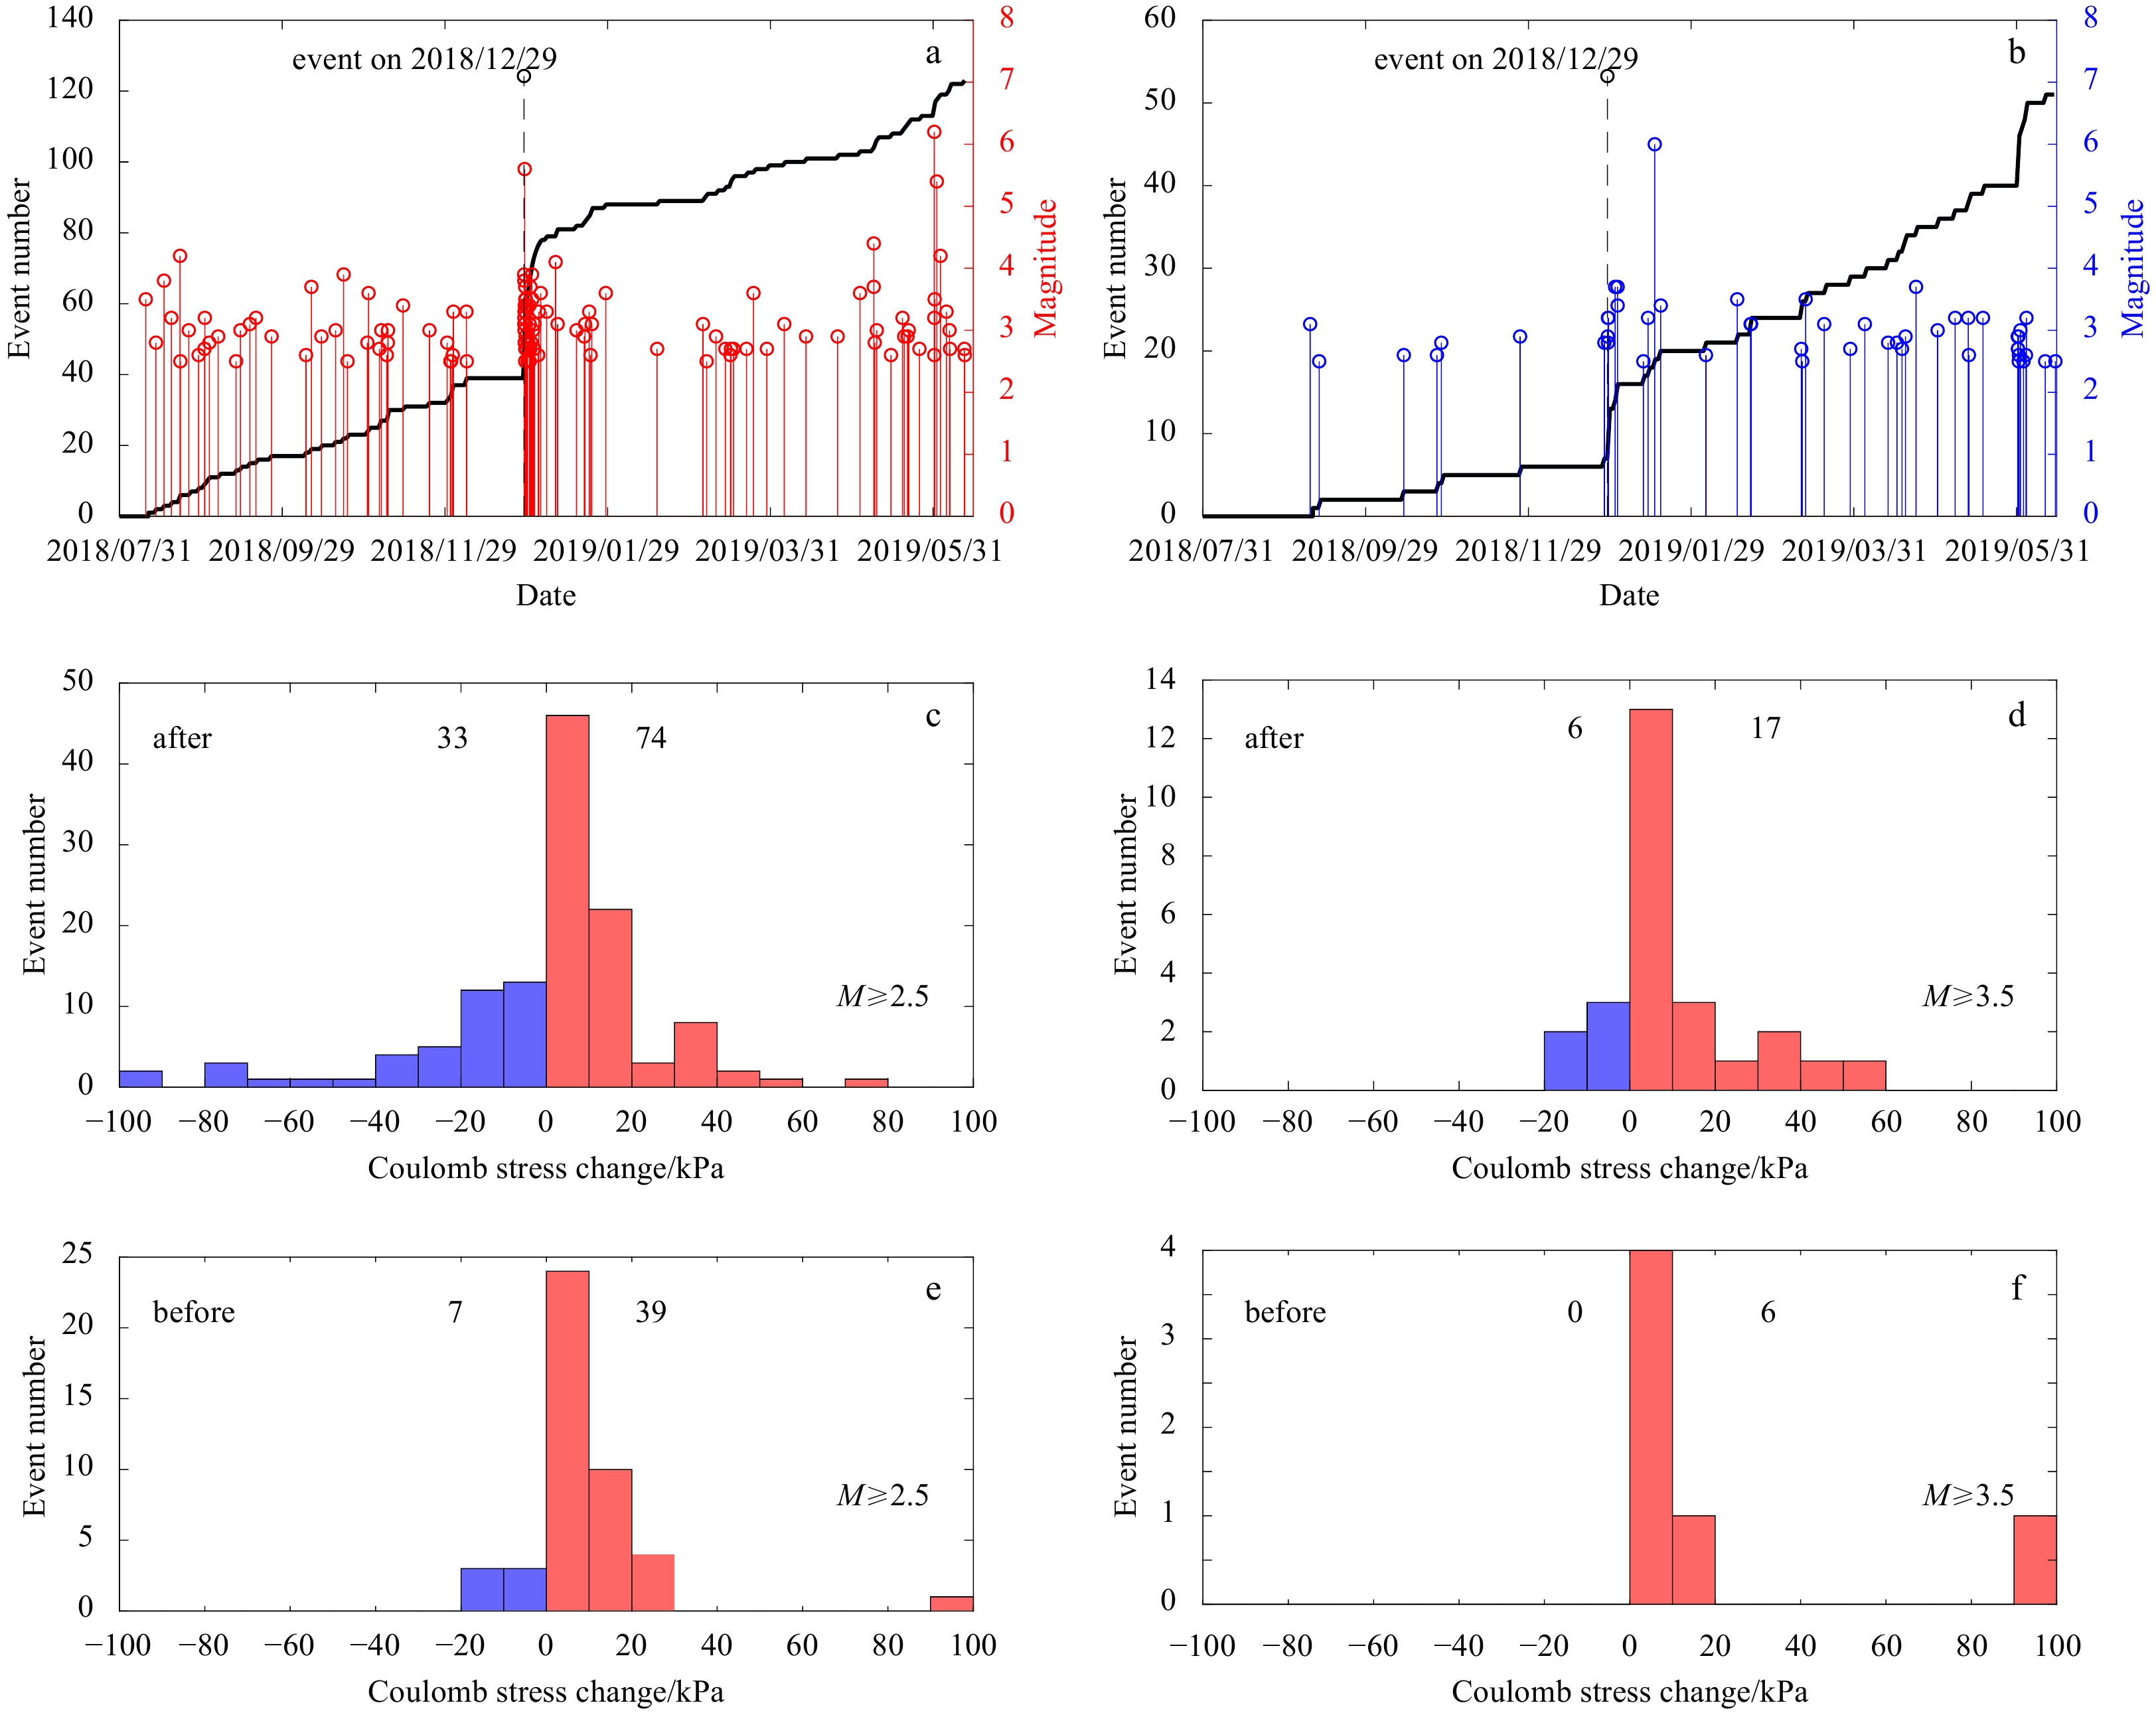
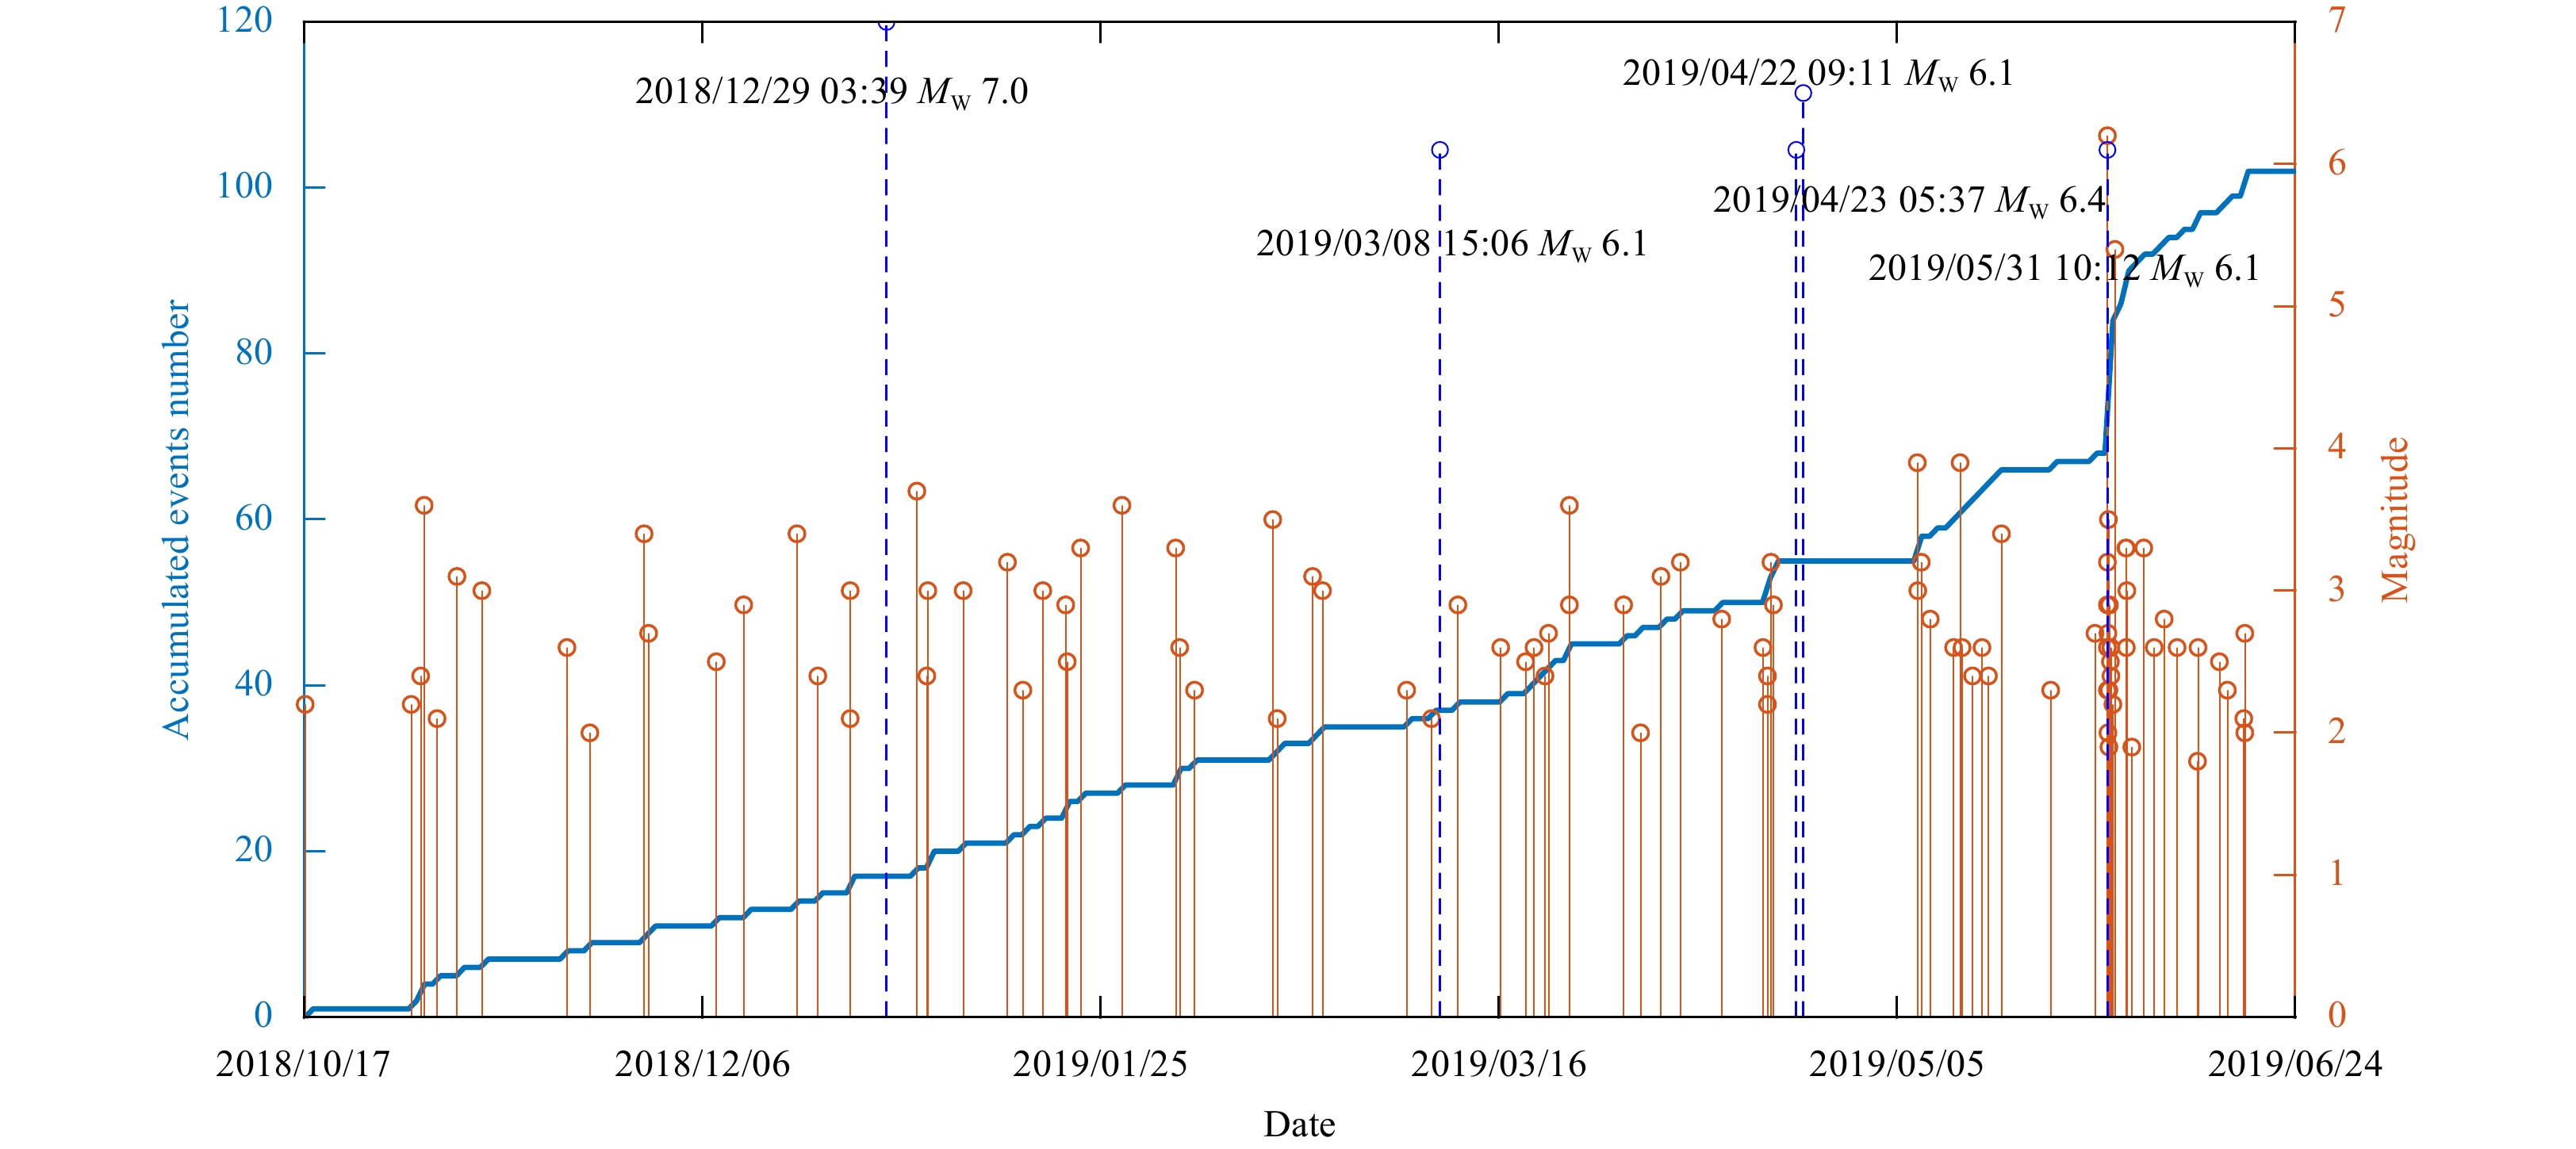
Figure 3. The event distributions and their relationship with Coulomb stress changes of the first event at the regions plotted in Fig. 2. Receiver fault of these local events are set the same as the fifth event (2019/05/31, Mw 6.1). a, b. Accumulated event number (left y-axis) and magnitude distributions (right y-axis) during 2018/07/31 to 2019/06/15, associated with positive Coulomb stress changes (a) and negative Coulomb stress changes (b); c, d. blue and red bars show the histogram of negative and positive Coulomb stress changes respectively; c. histogram of the Mw ≥ 2.5 earthquakes during 2018/12/29 to 2019/05/31; d. Histogram of the Mw ≥ 3.5 earthquakes during 2018/12/29 to 2019/05/31; e. histogram of Mw ≥ 2.5 events during 2018/07/31 to 2018/12/29; and f. histogram of Mw ≥ 3.5 events during 2018/07/31 to 2018/12/29. The numbers indicate the total count during these periods, and only events with stress change ≥ 5 kPa are counted. For example, number 6 in f indicates six events during 2018/12/29 to 2019/05/31 at the region with stress change ≥ 5 kPa. Some events may be missing in the histograms due to the scale of the x-axis.
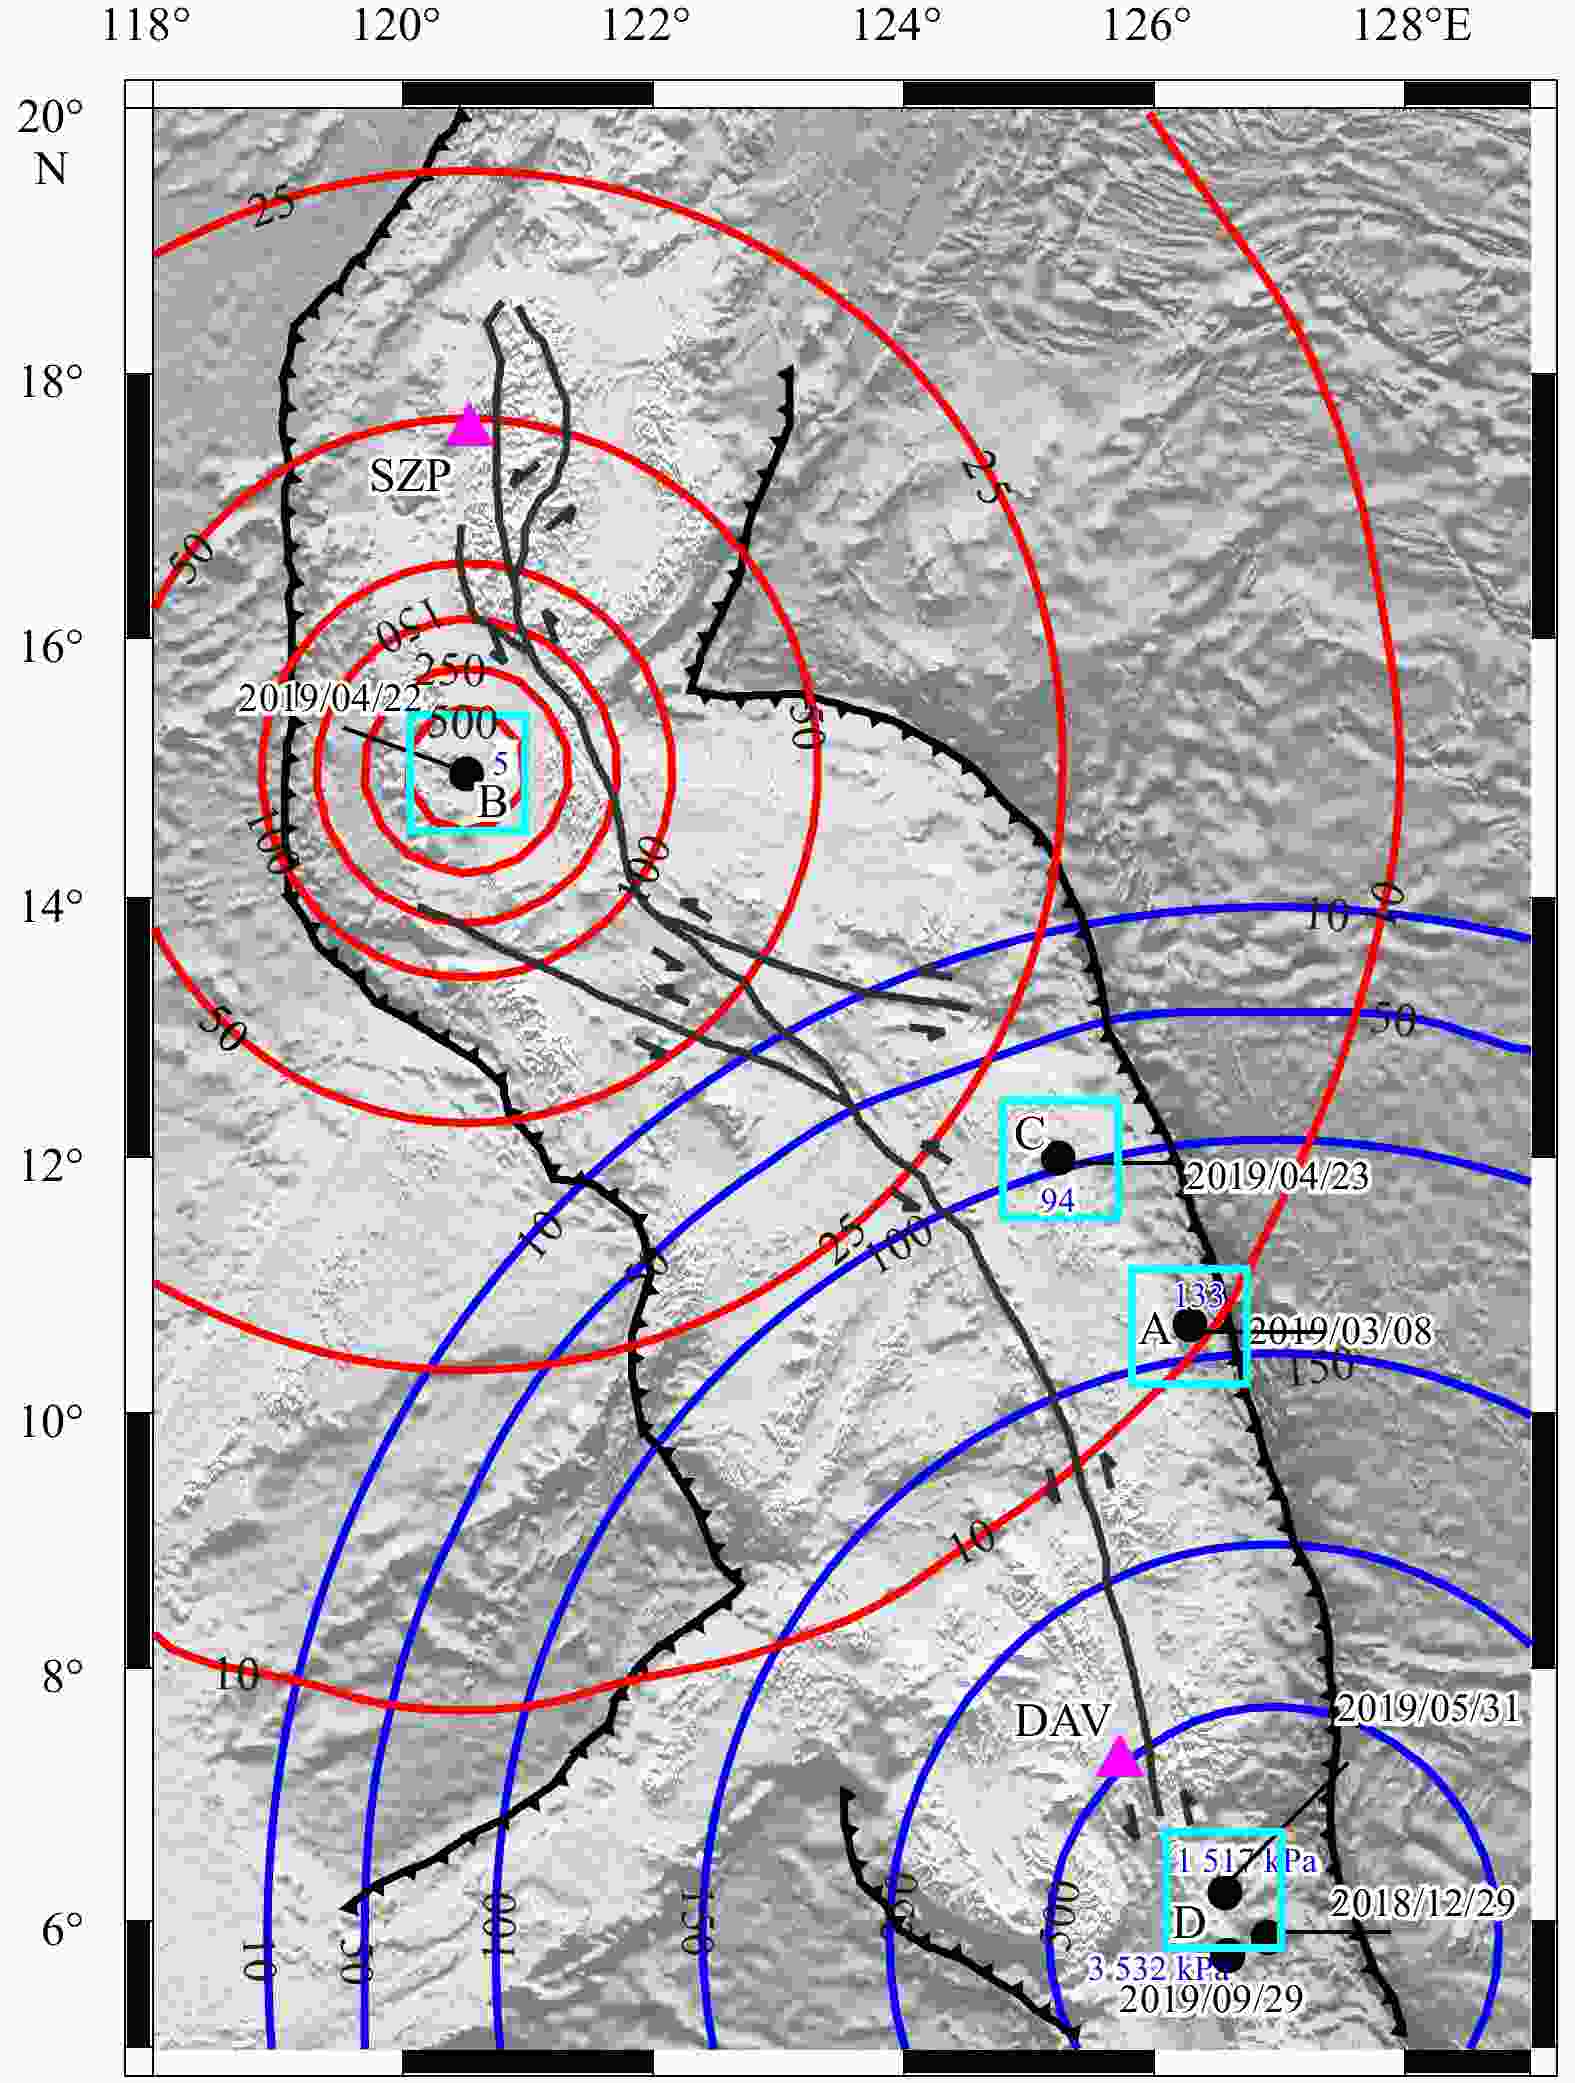
Figure 4. The dynamic stress (in unit of kPa) generated by the event on 2018/12/29 (blue line) and 2019/04/22 (red line). The stress values are marked on the contours. Regions A, B, C, and D are squares with 1°×1° size, and temporal distribution of seismicity within these regions are further plotted in Fig. 5. The locations of two seismic stations (RM.SZP and IU.DAV) are marked, and the corresponding waveforms are plotted in Fig. 6.
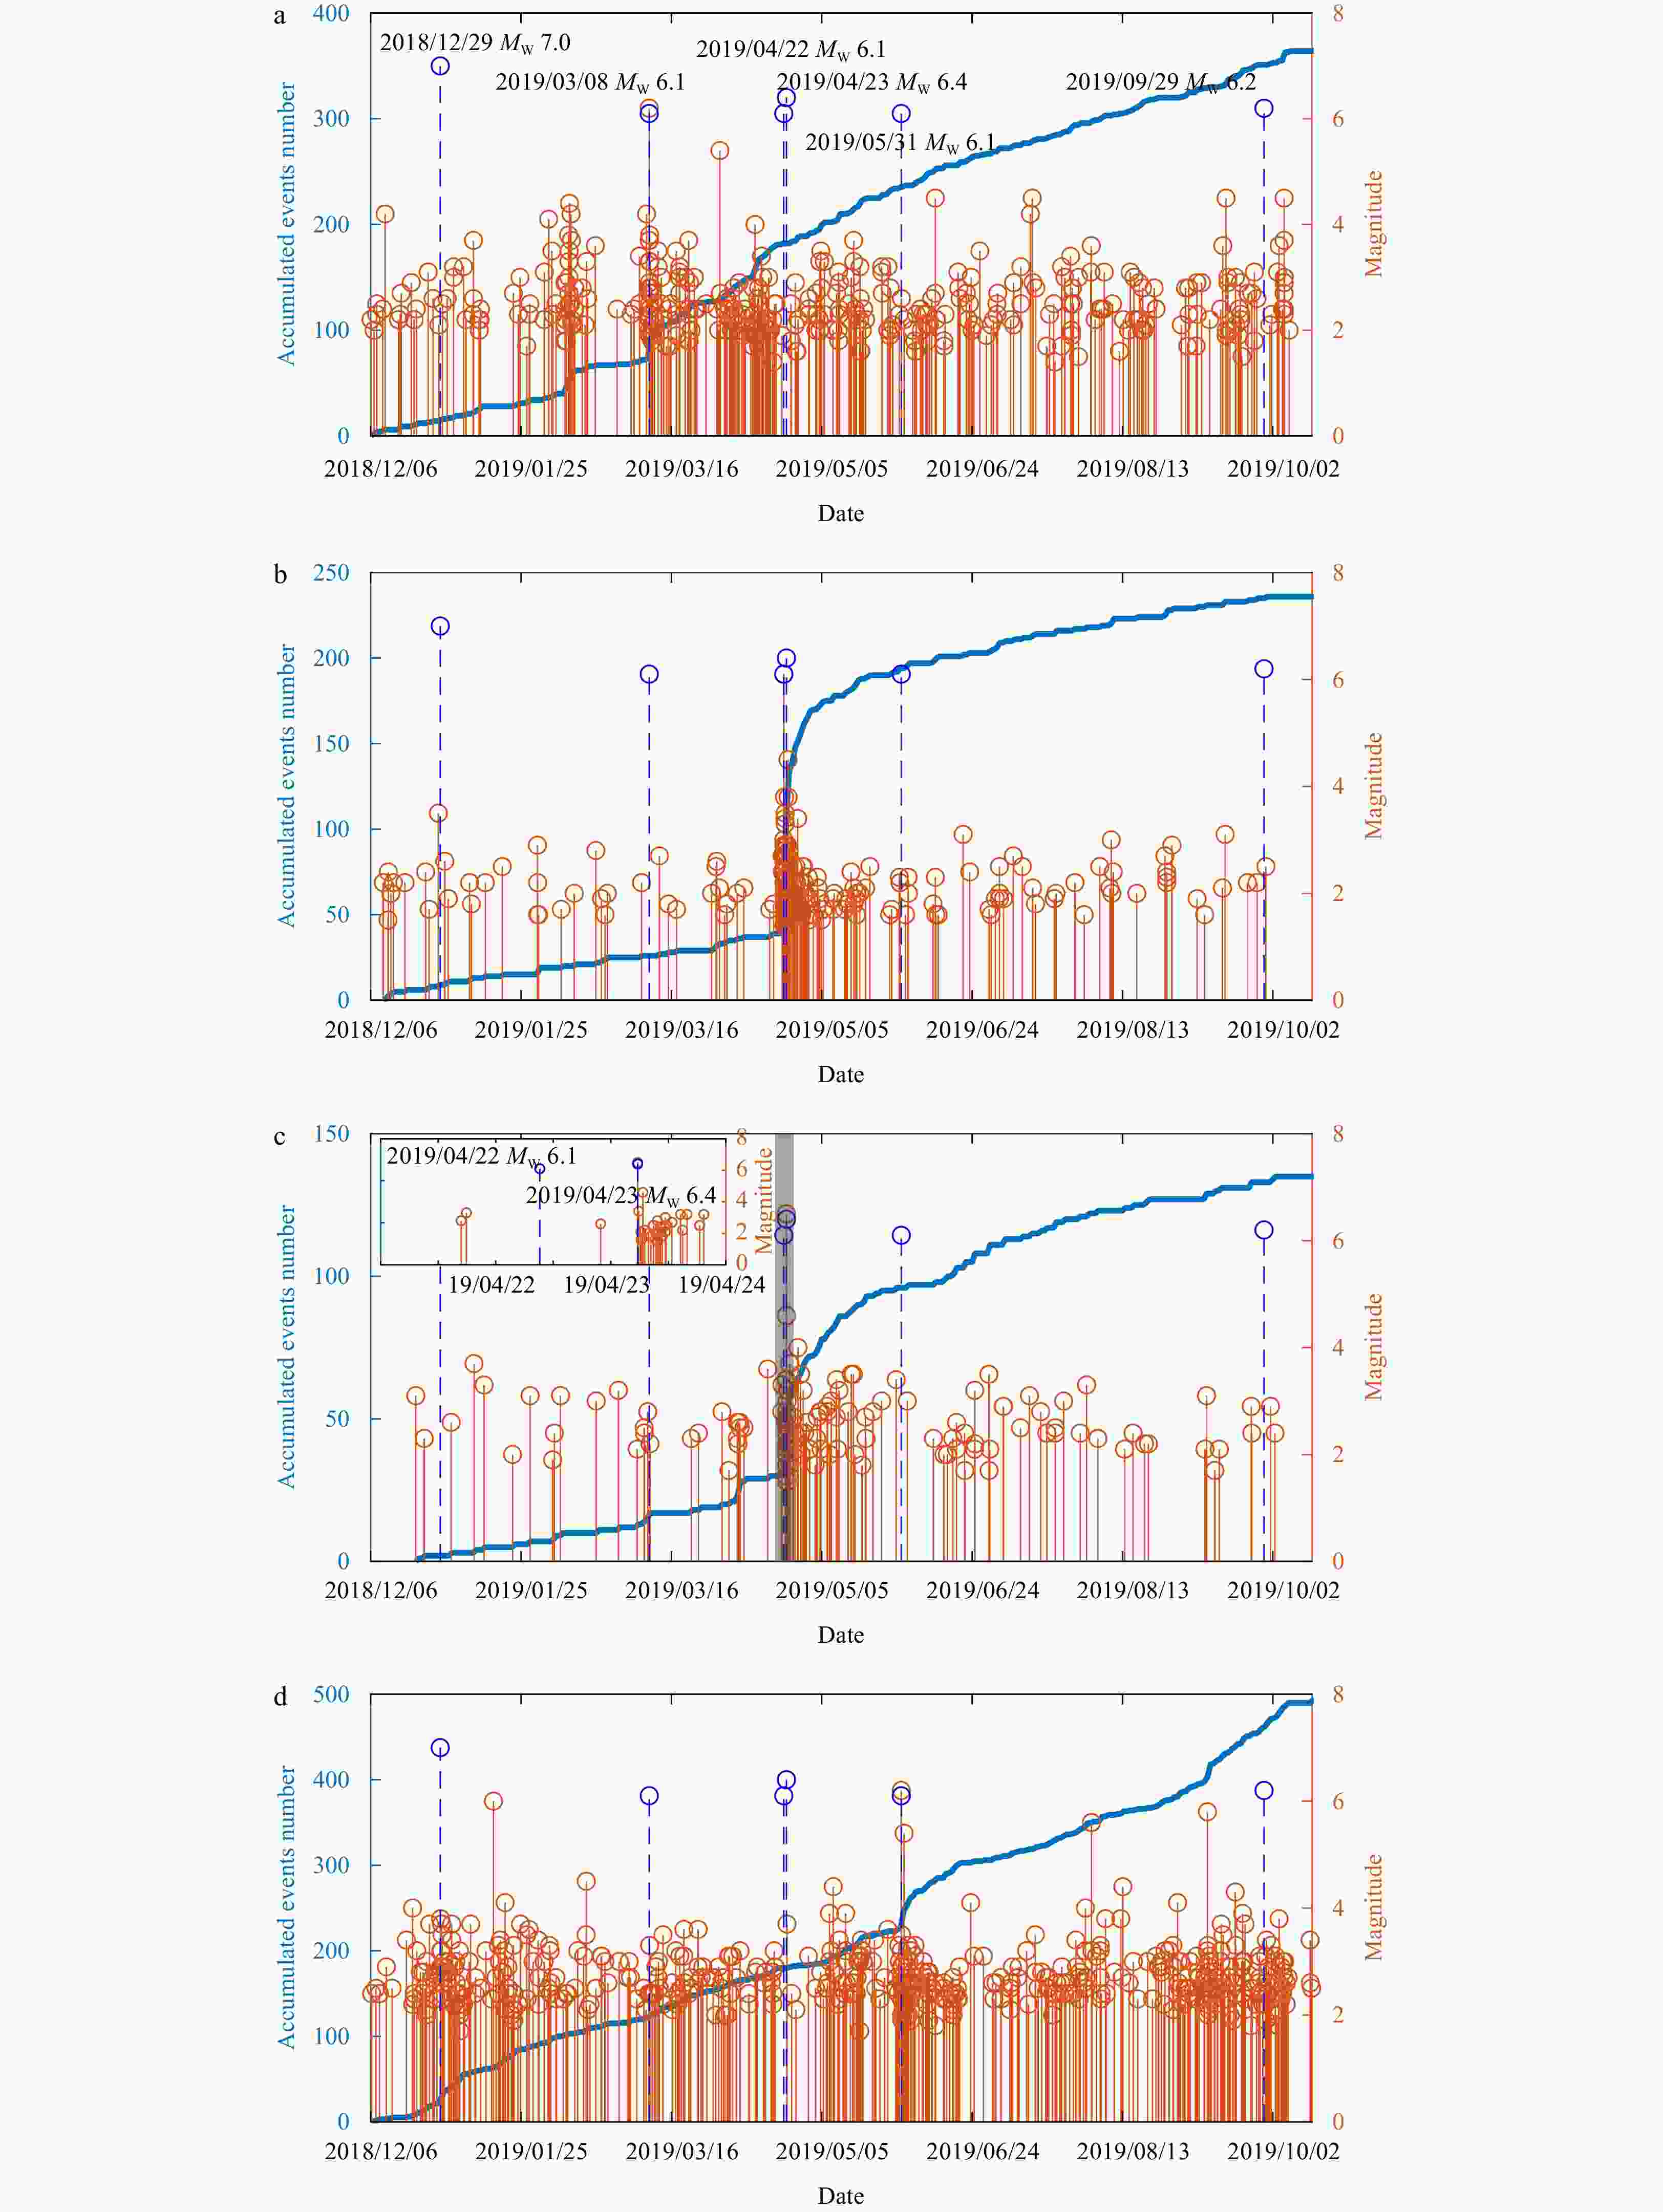
Figure 5. The local seismicity at Regions A, B, C and D as marked in Fig. 4. The left axis is the accumulated events number and the right axis is the magnitude. The occurrence time of the first five earthquakes is marked as dashed blue lines. The insert map of c shows the detailed seismicity between 2019/04/21 to 2019/04/24 (shaded region).
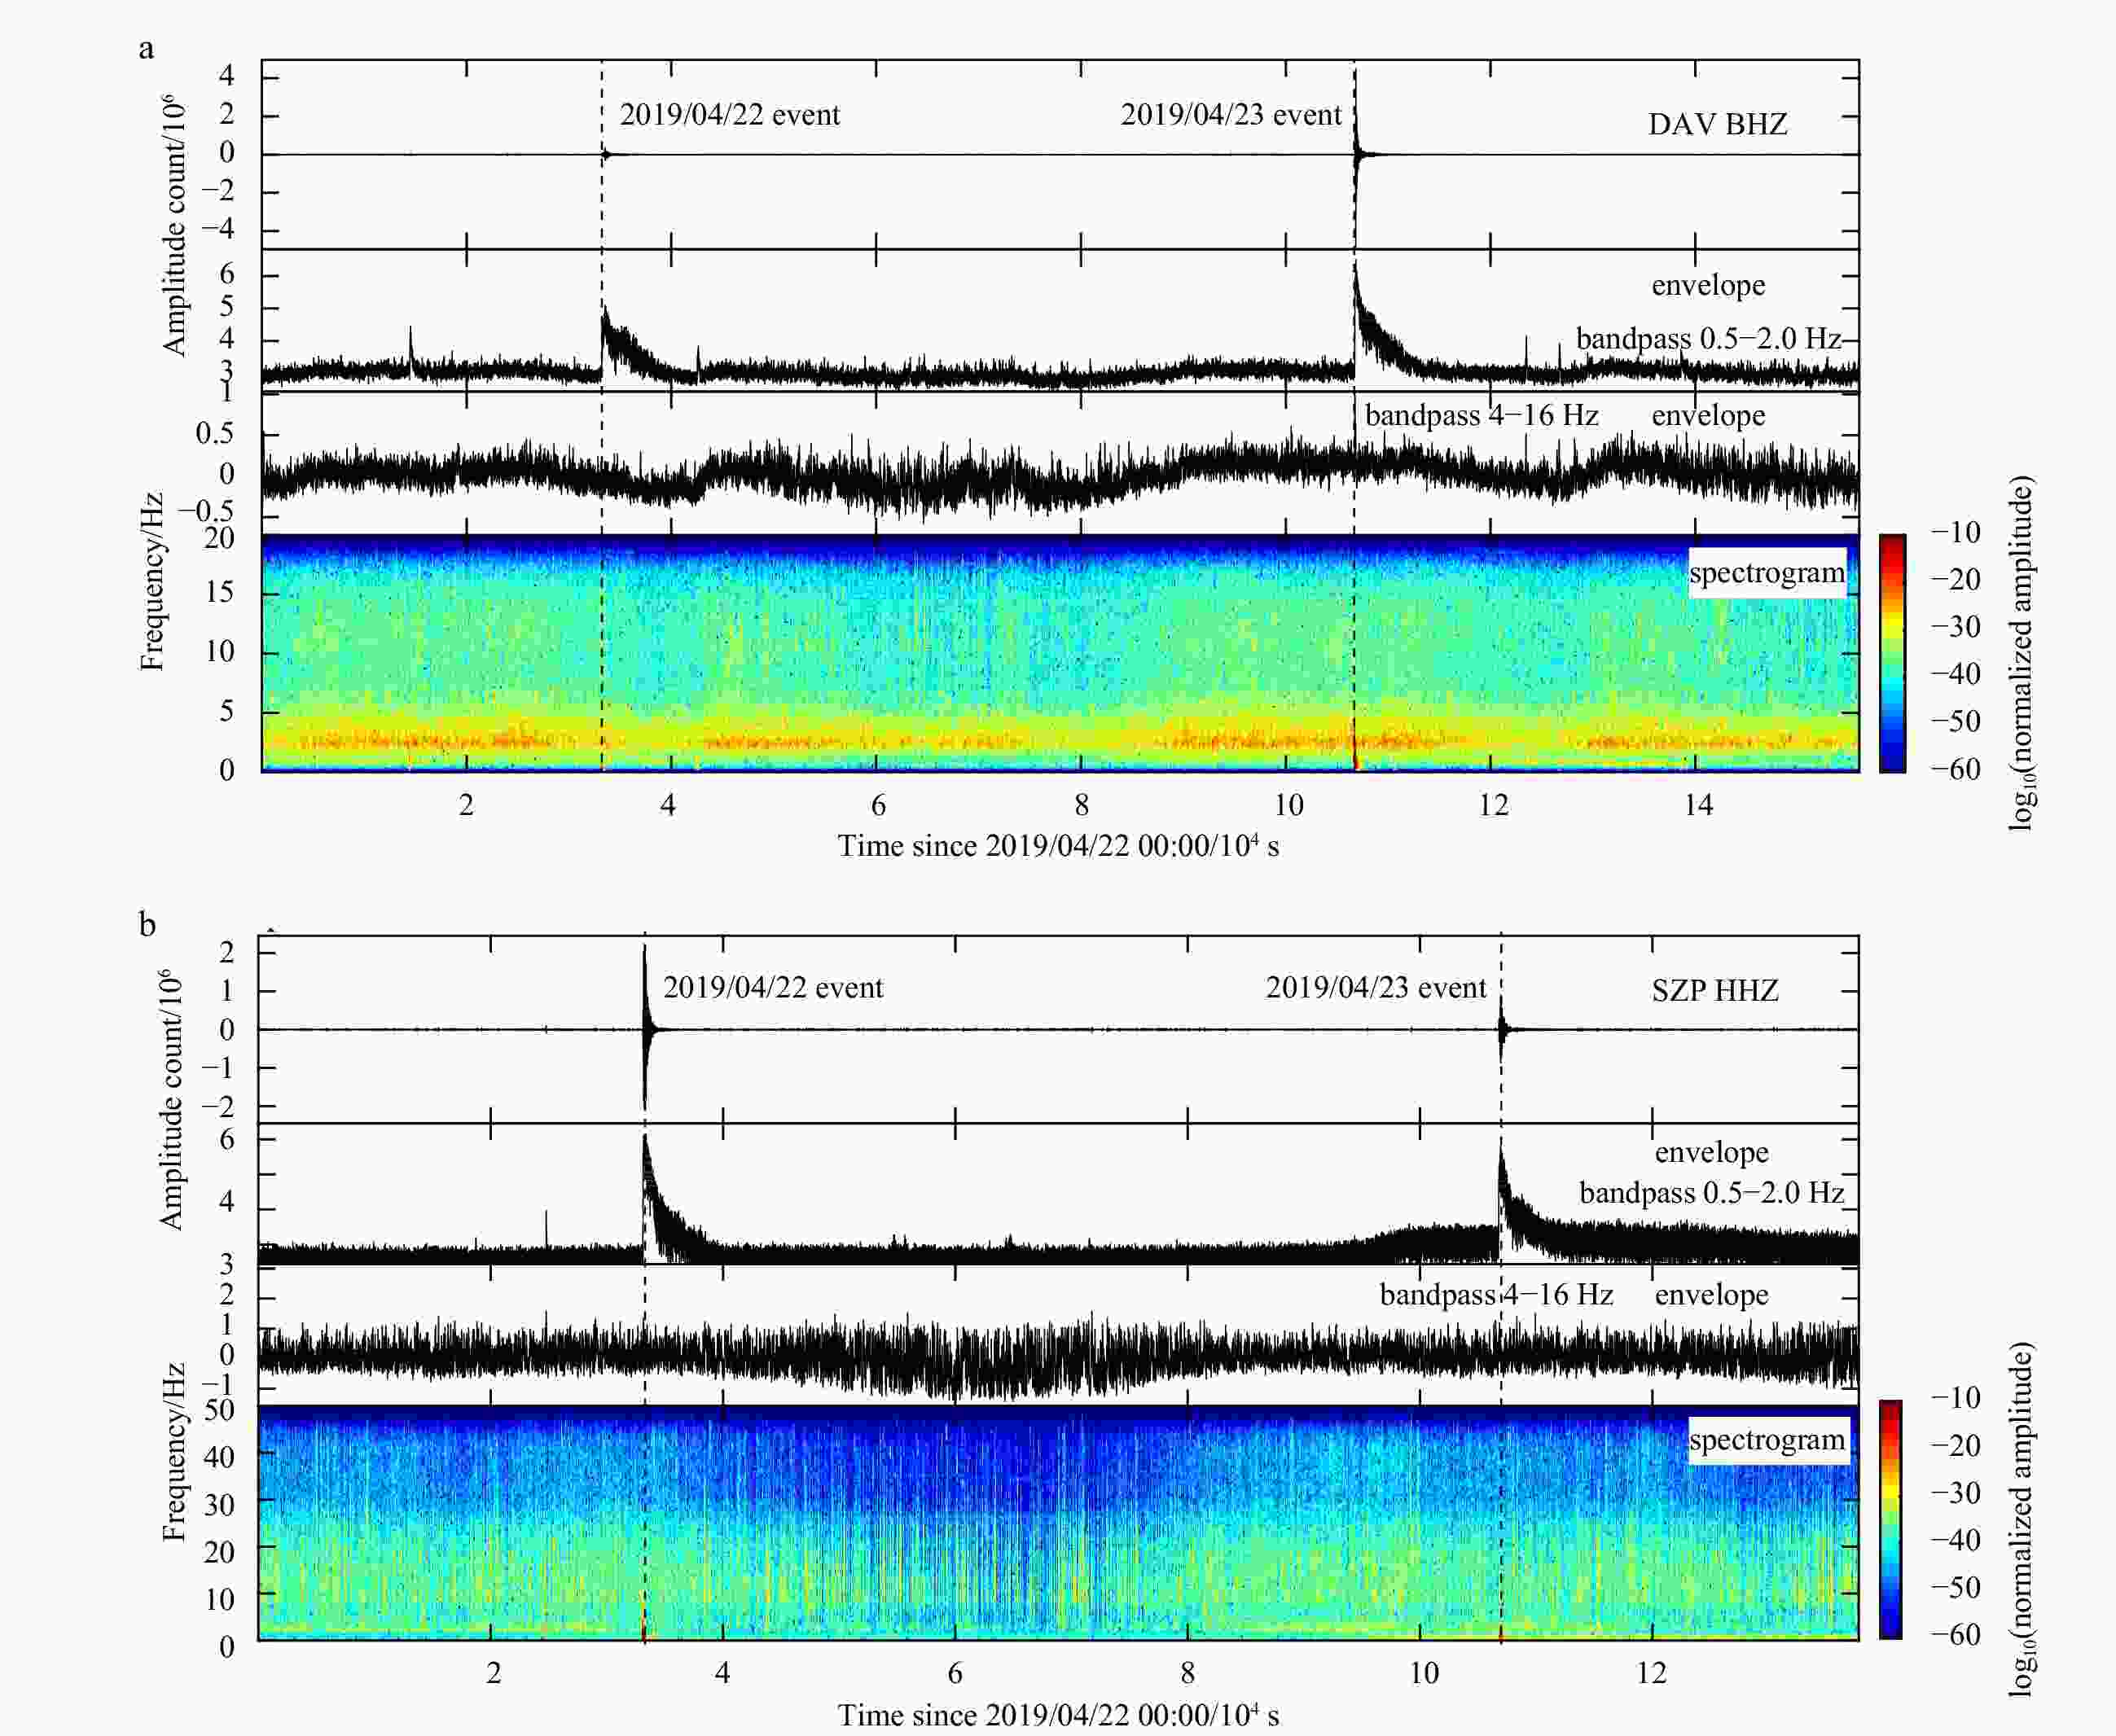
Figure 6. The seismogram, band-passed envelopes (0.5–2.0 Hz, 4–16 Hz) and spectrogram of seismic data recorded at Stations IU.DAV (a) and RM.SZP (b). Their corresponding locations are marked in Fig. 4.
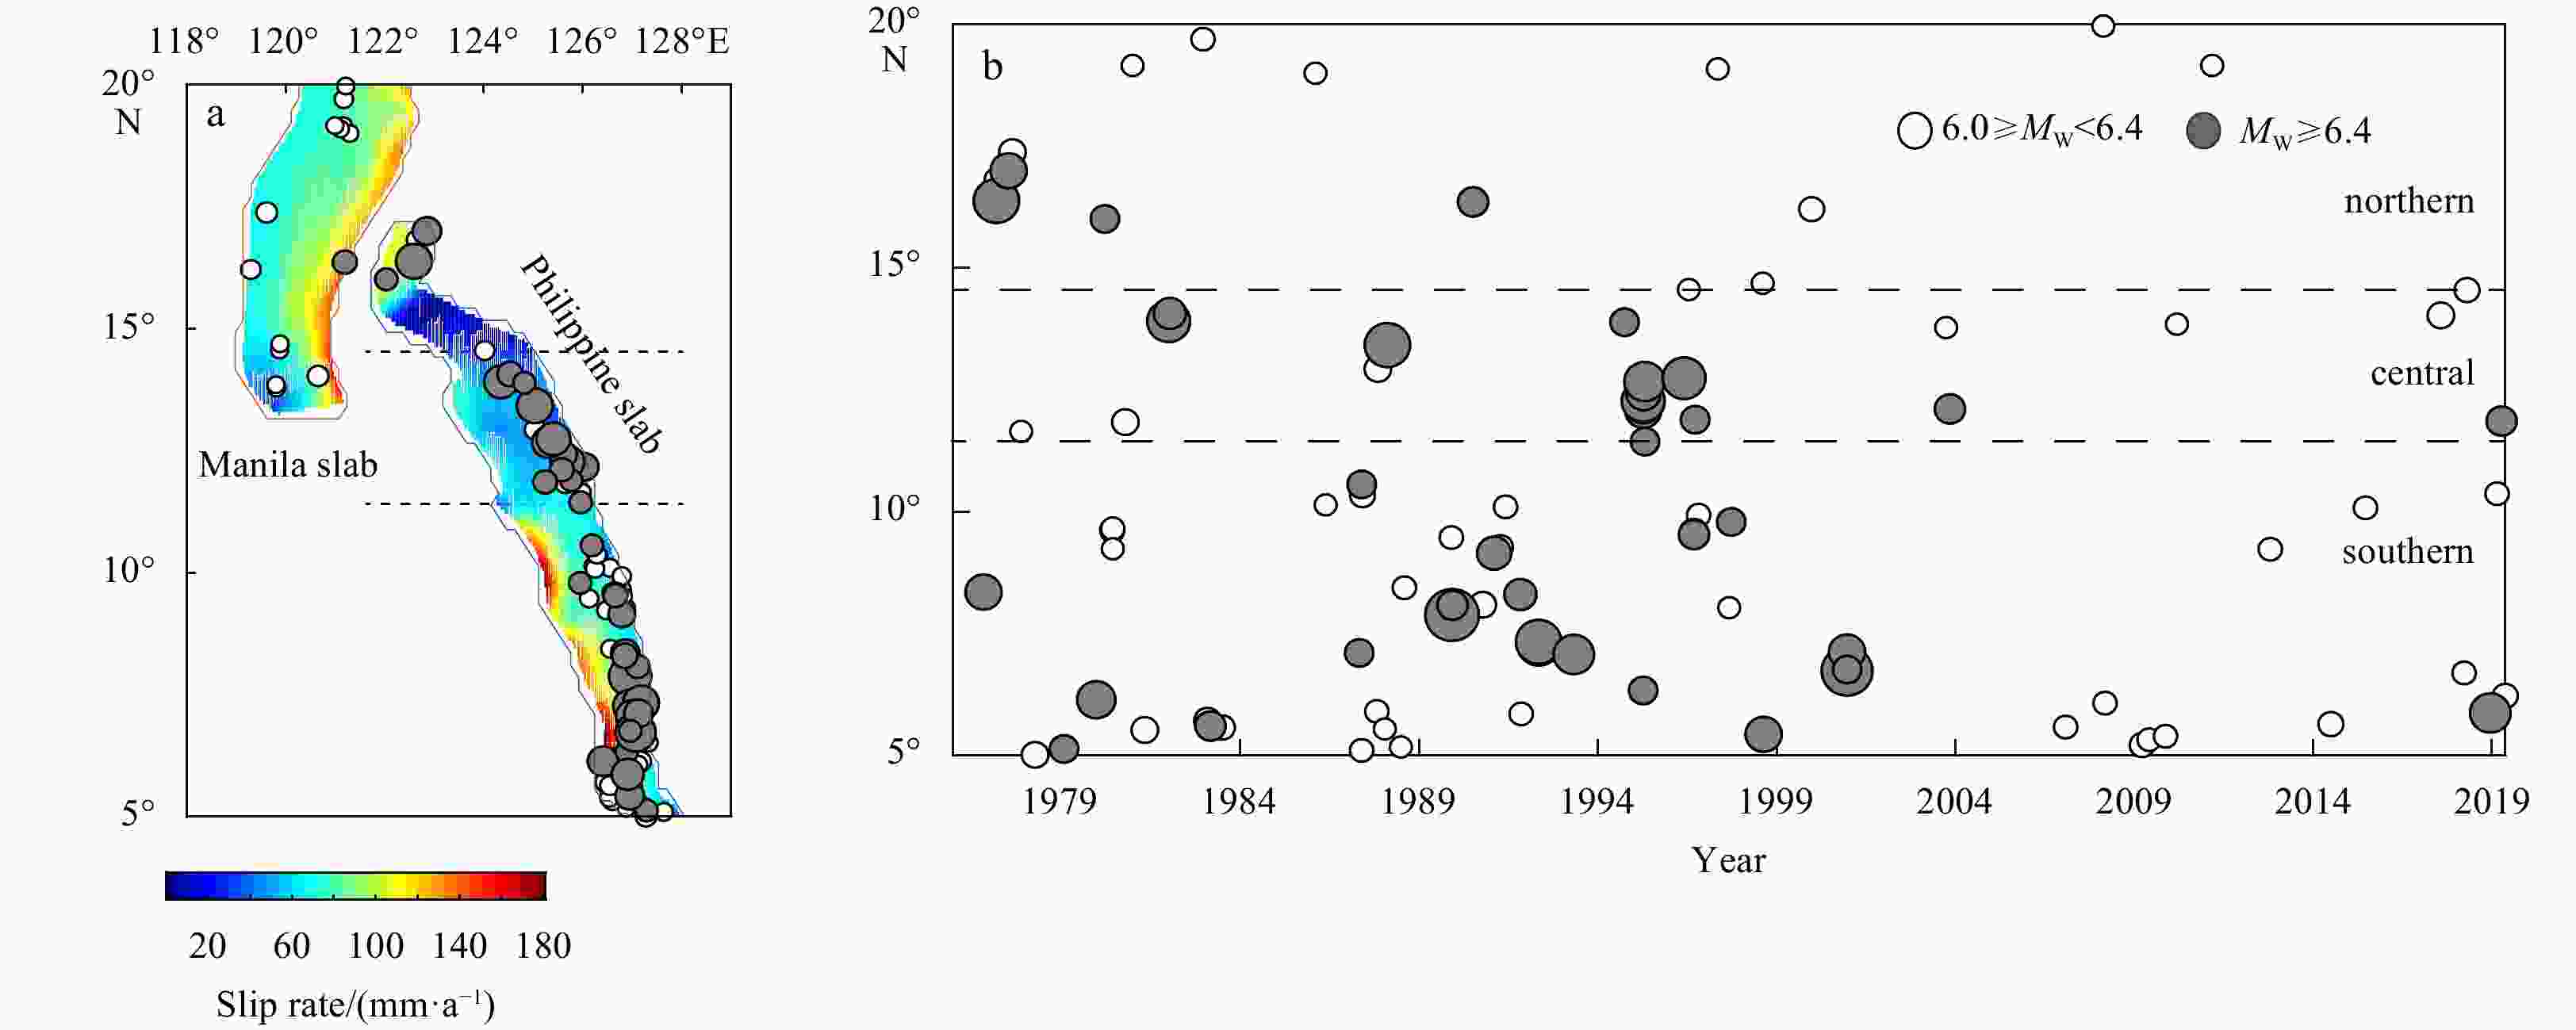
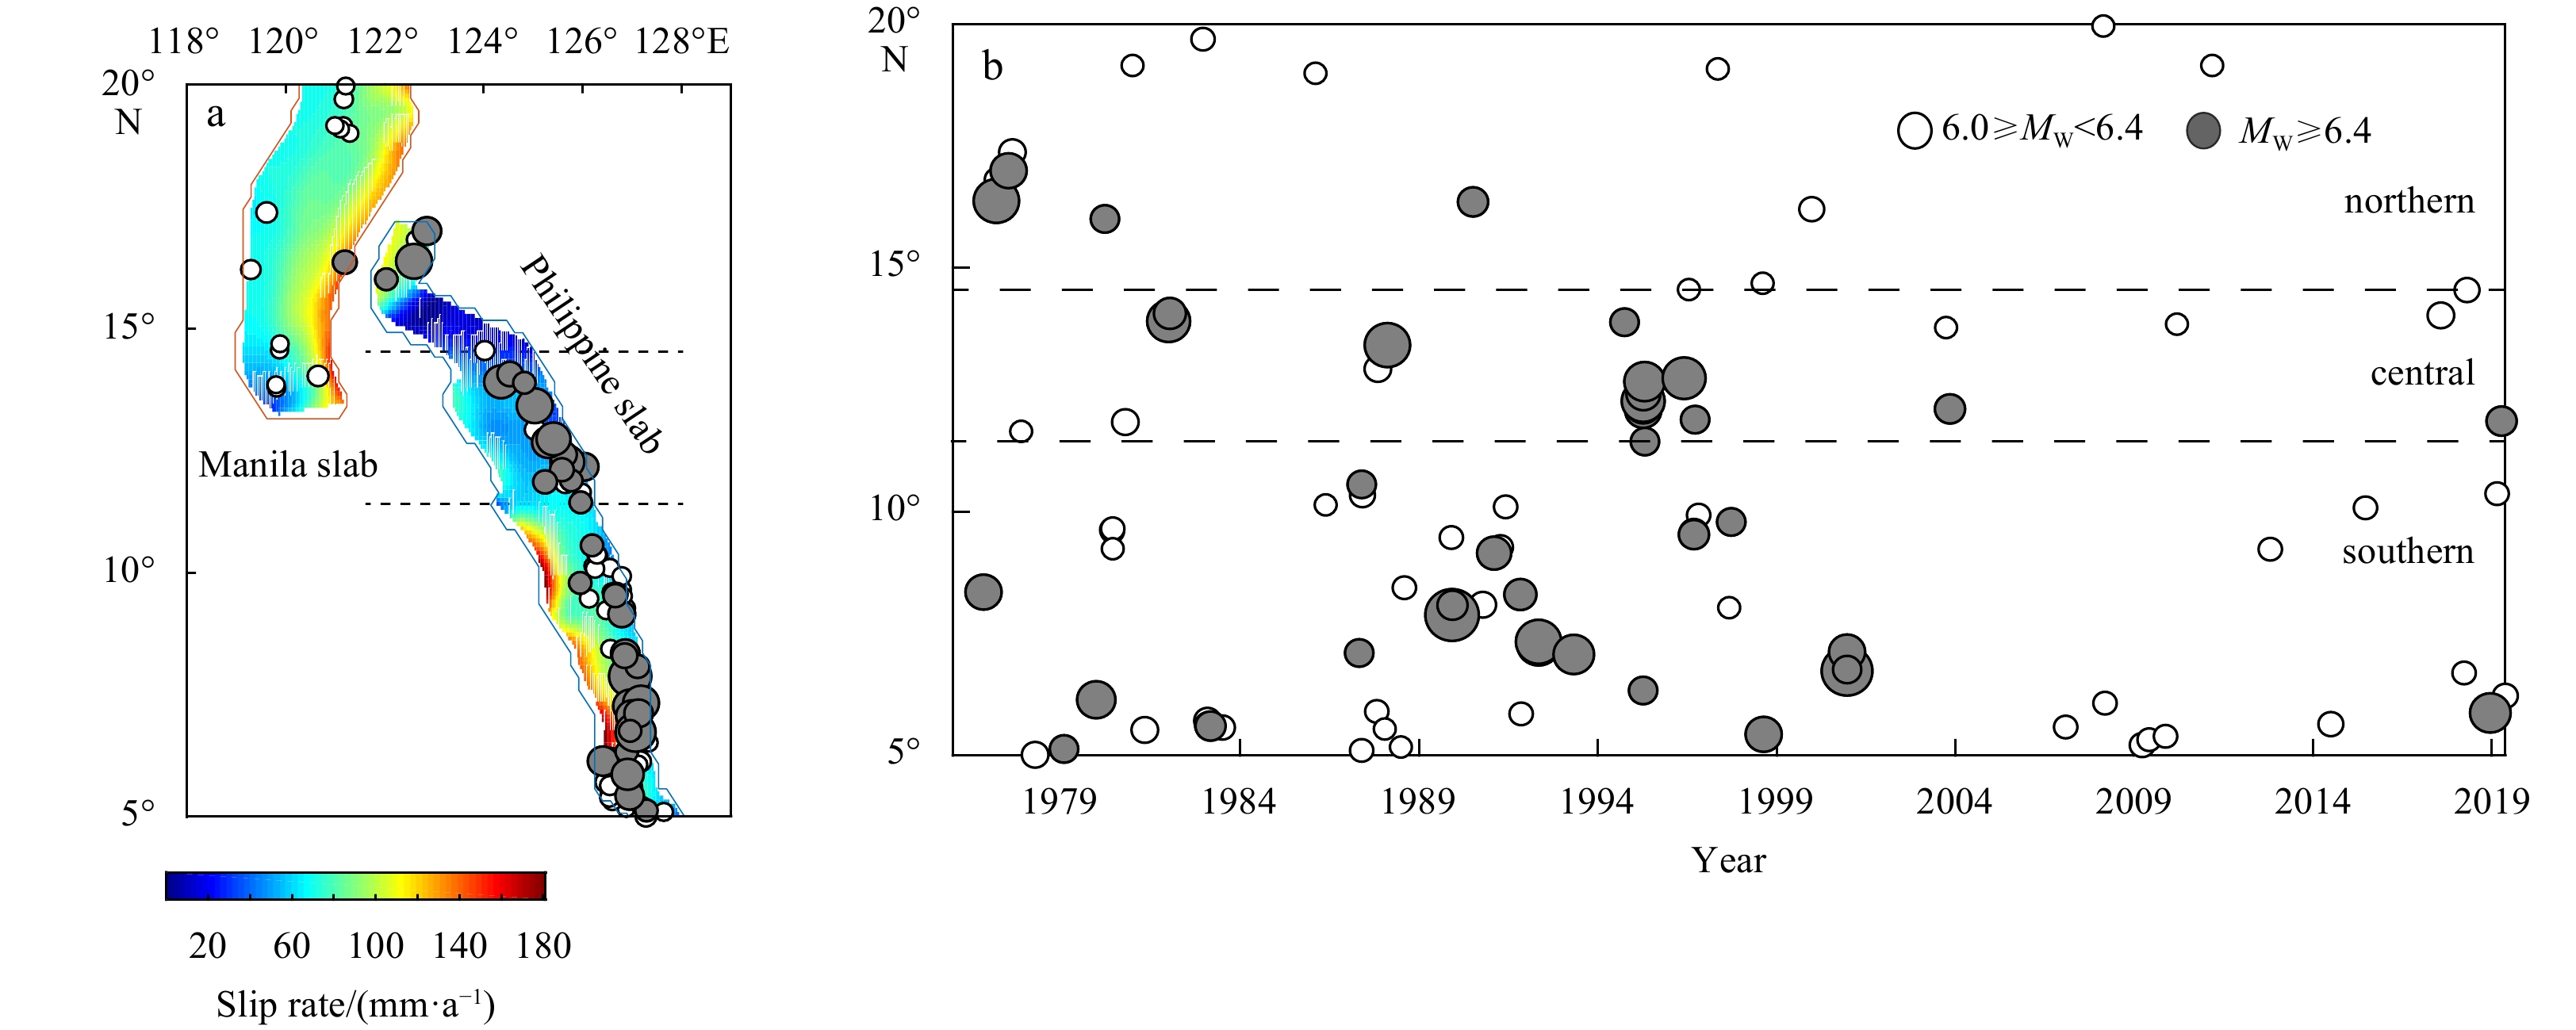
Figure 7. The slip rate estimated from GPS velocity (a) and the distribution of thrust events listed in the GCMT catalog during 1976/01/01 to 2019/12/31 along the Manila and Philippine slabs (b). The Philippine slab can be divided into three sections (southern, central, and northern) according to the slip rate.

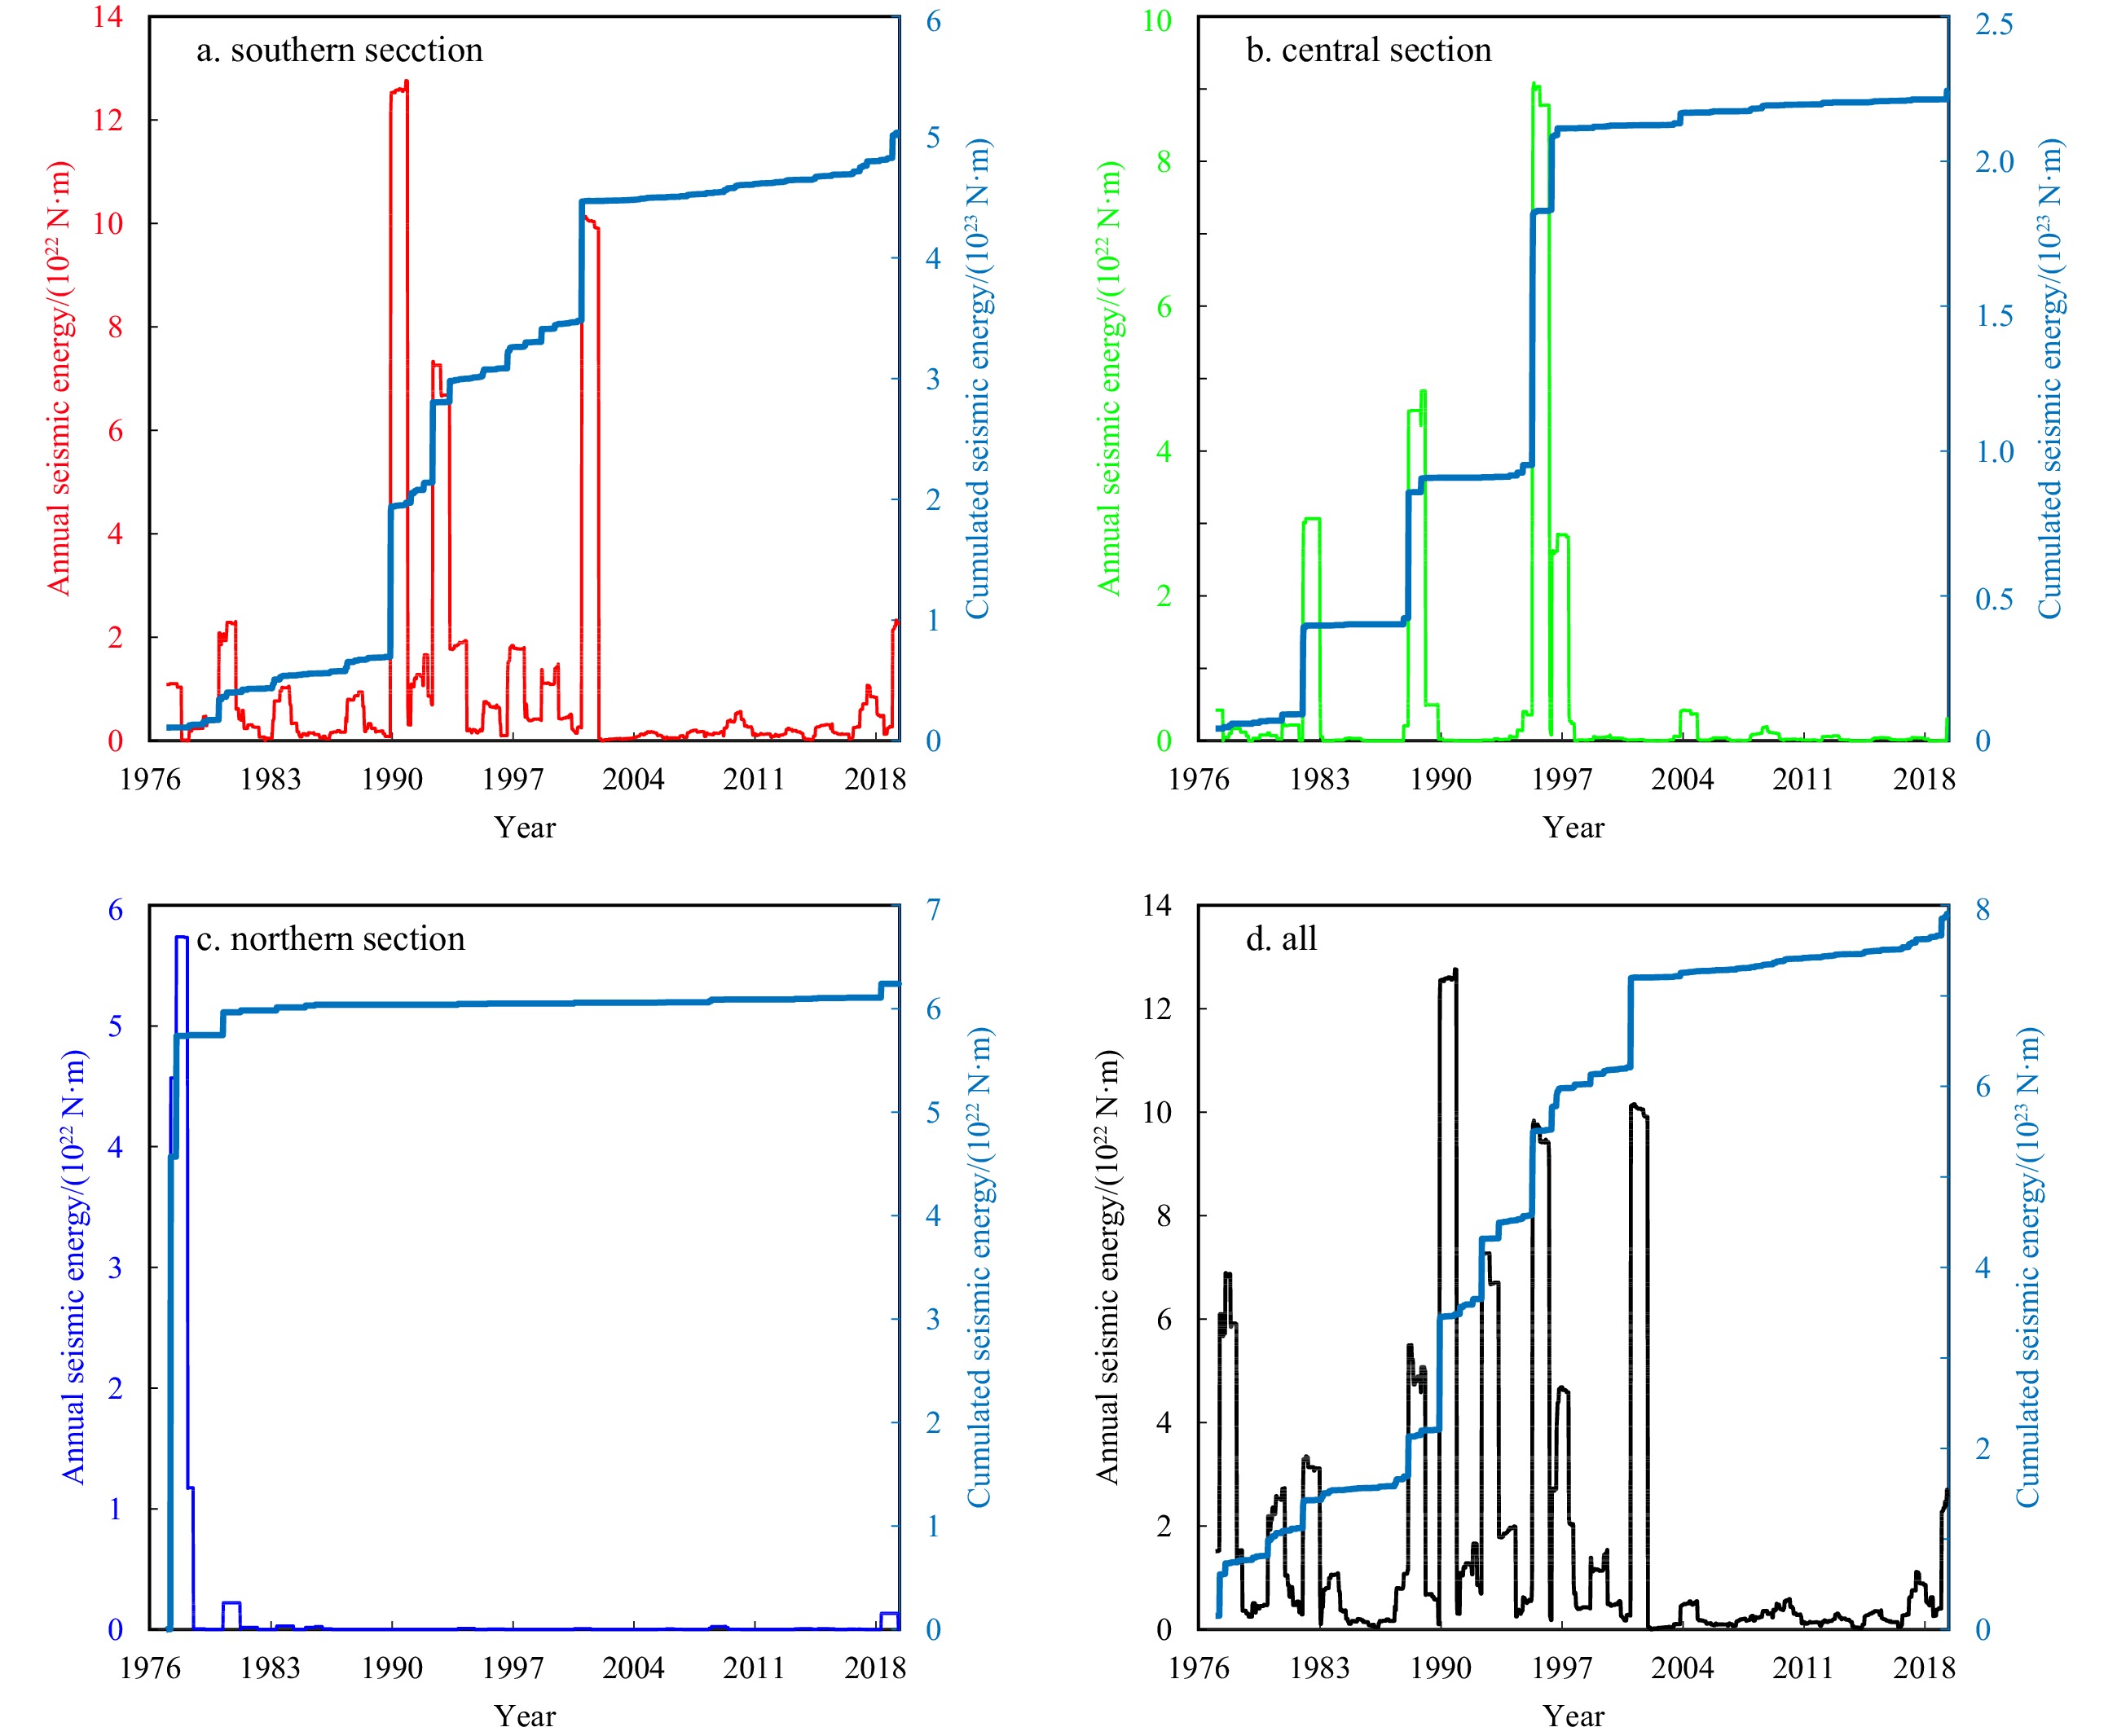
Figure 8. The annual and cumulative seismic energy during 1976/01/01 to 2019/12/31 at the southern section of Philippine slab (5.0°–11.5°N) (a), the central section of Philippine slab (11.5°–14.5°N) (b), the northern section of Philippine slab (14.5°–20.0°N) (c), and all sections (d). The detailed division of Philippine slab is marked in Fig. 7.
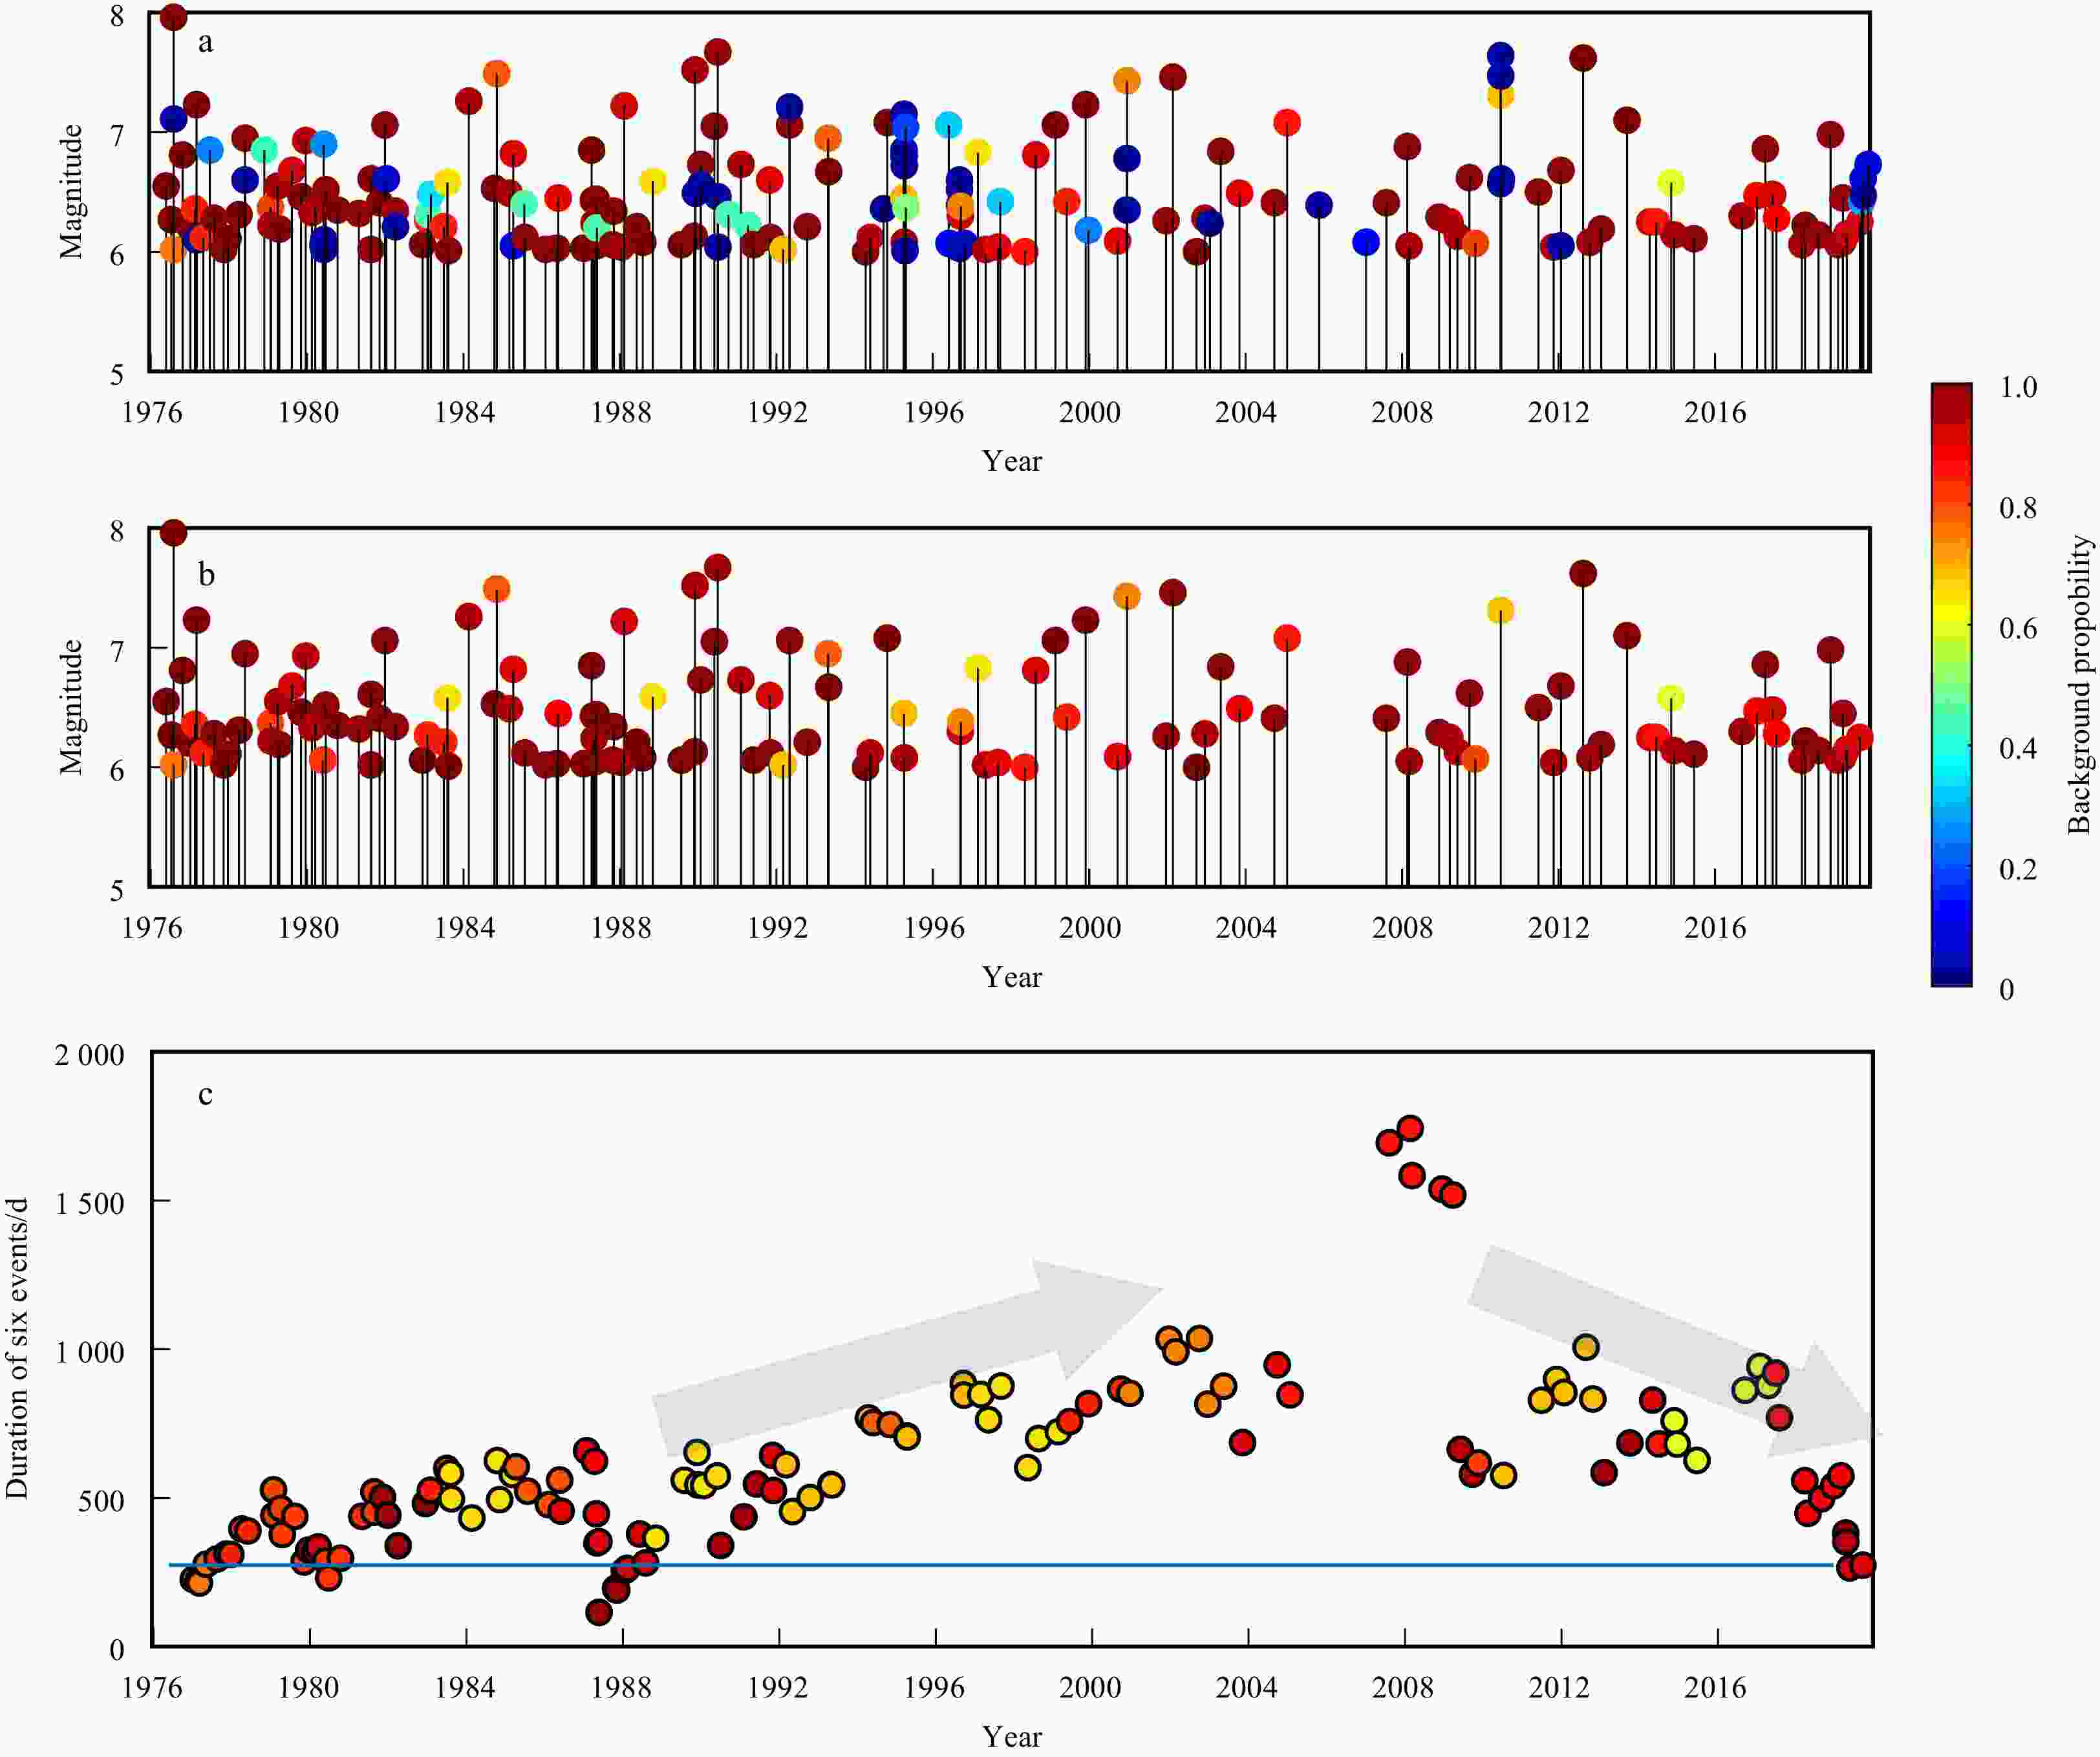
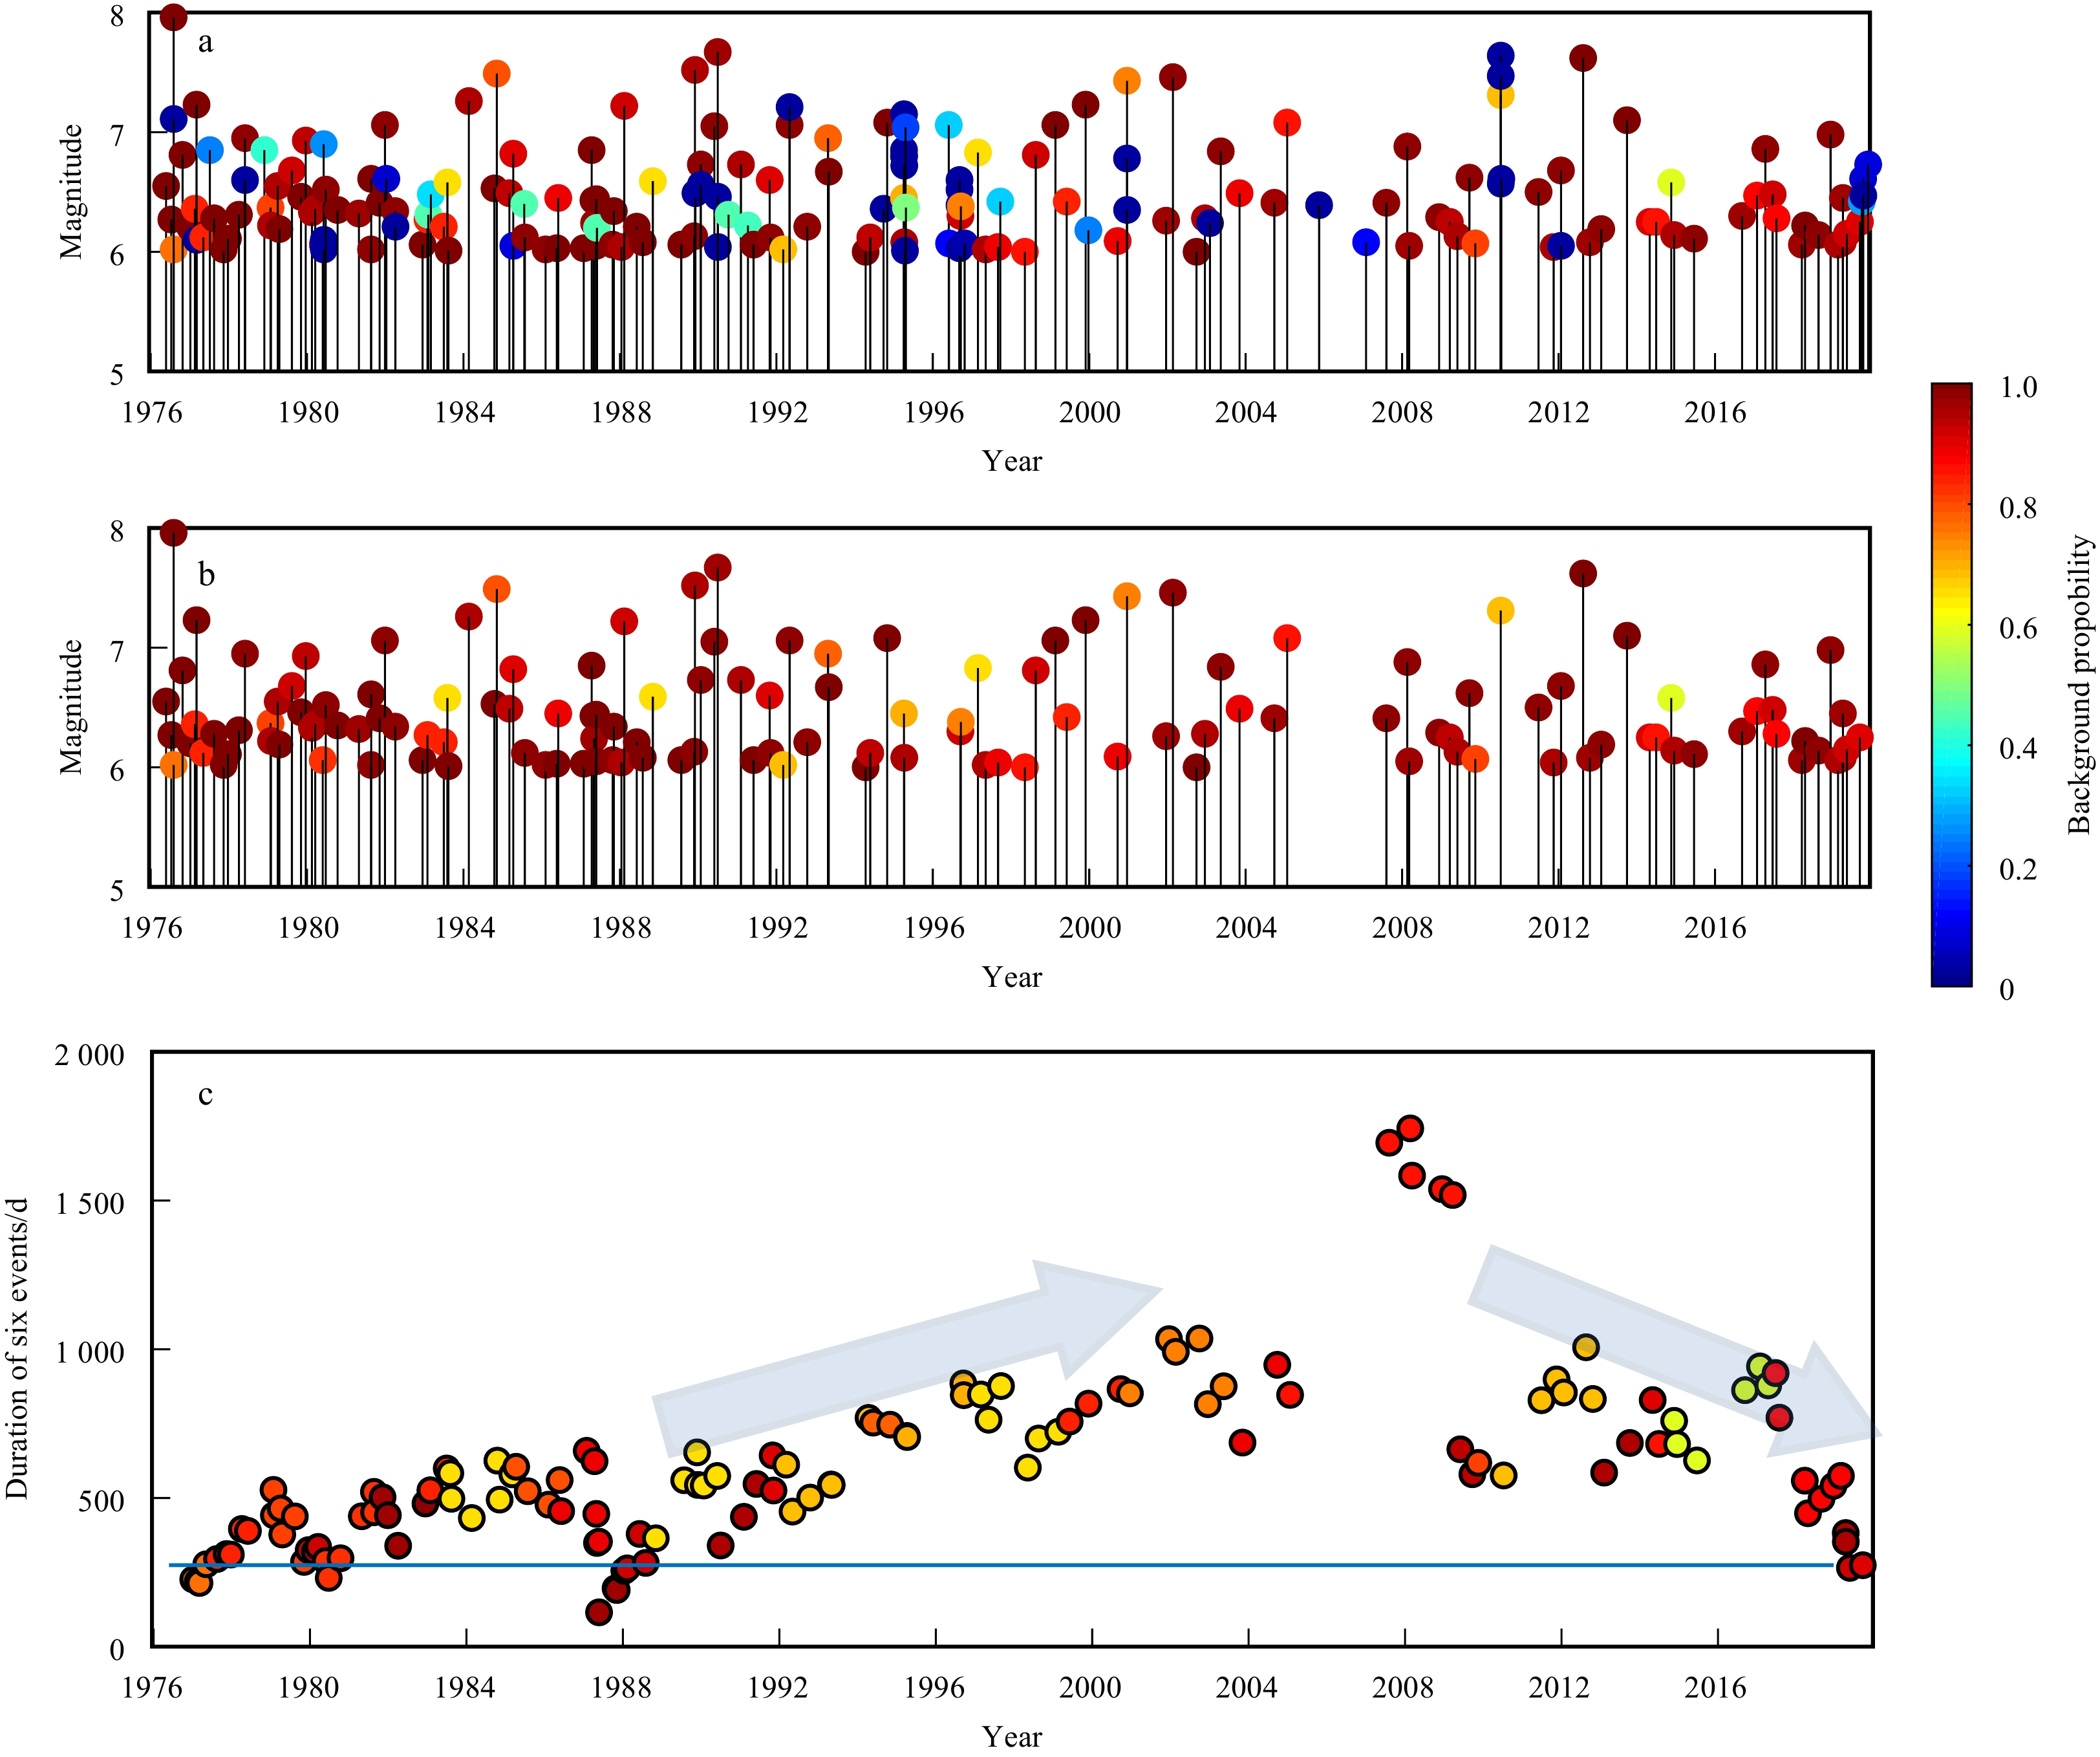
Figure 9. The probability of background seismicity from the space-time ETAS model. a. The background probability of Mw > 6 events along the PA from 1976/01/01 to 2019/12/31 based on the GCMT catalog; b. the events with background probability Pb ≥ 0.5; and c. the duration of six adjacent Mw > 6 events with background probability Pb ≥ 0.5. The probability value represents the lowest one of the 6 adjacent events. The solid line mark the duration of 274 d for the recent six Mw > 6 events. The two arrows indicate the trend of the duration of 6 high probability adjacent events.
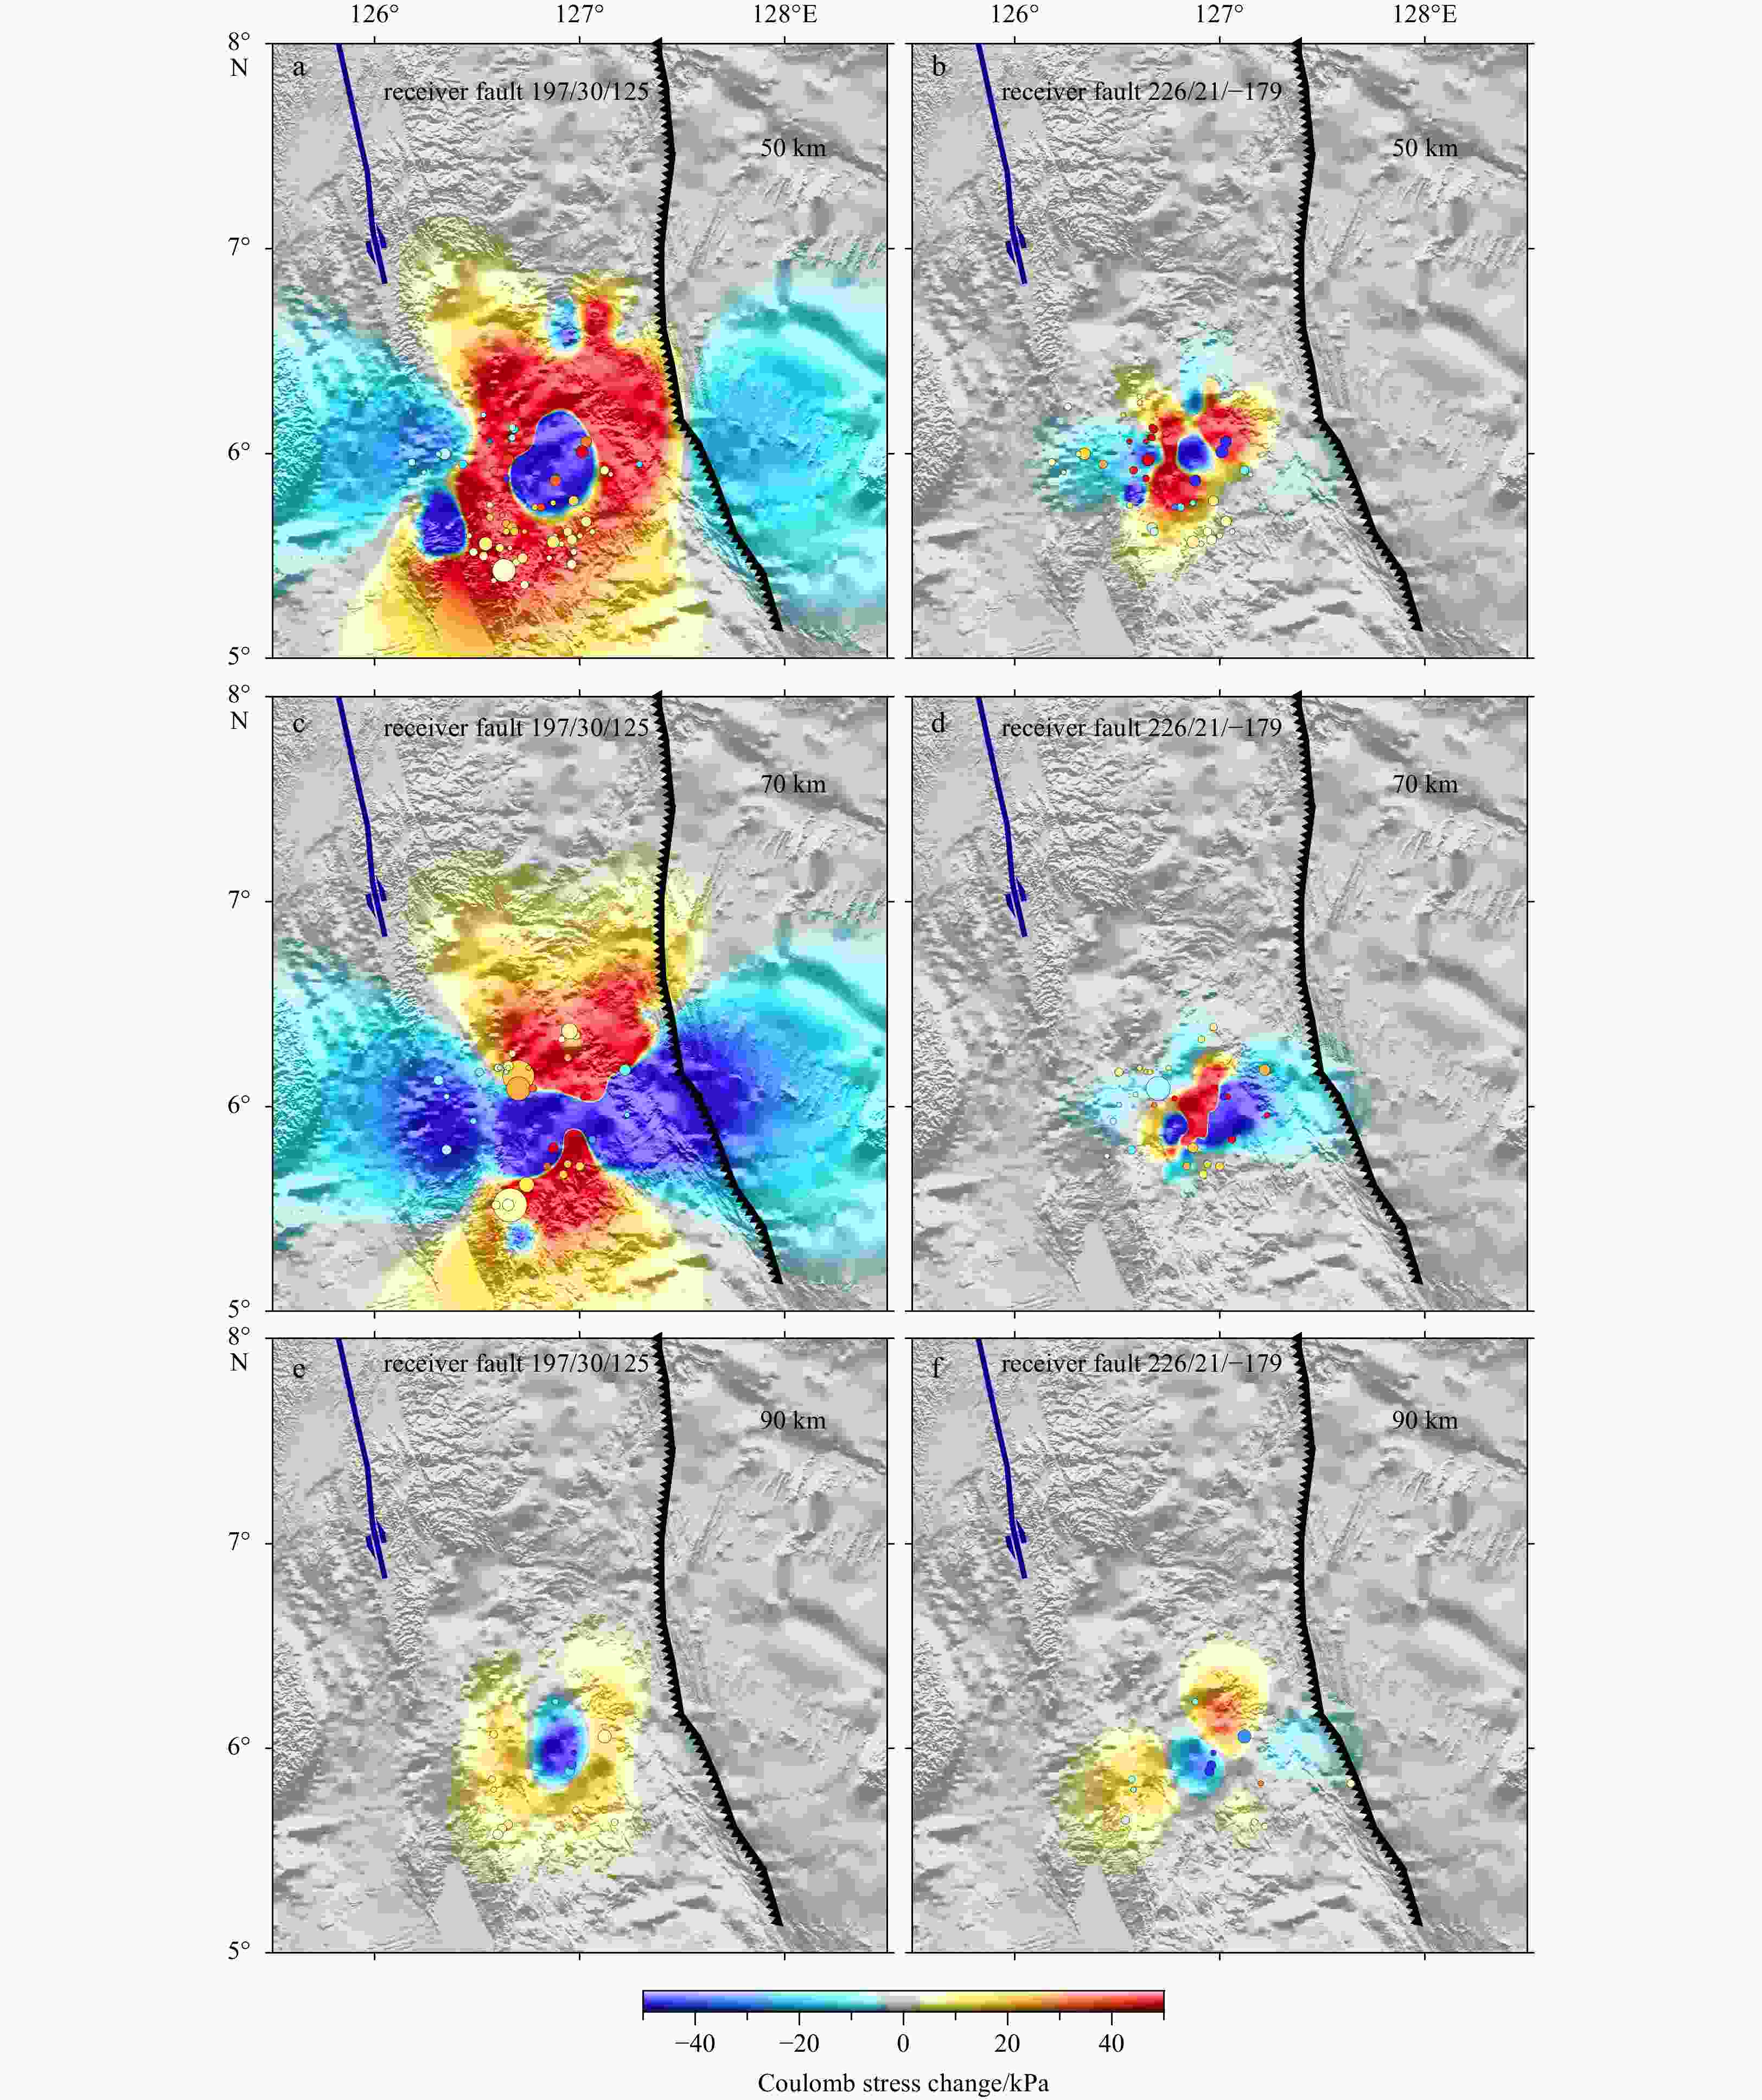
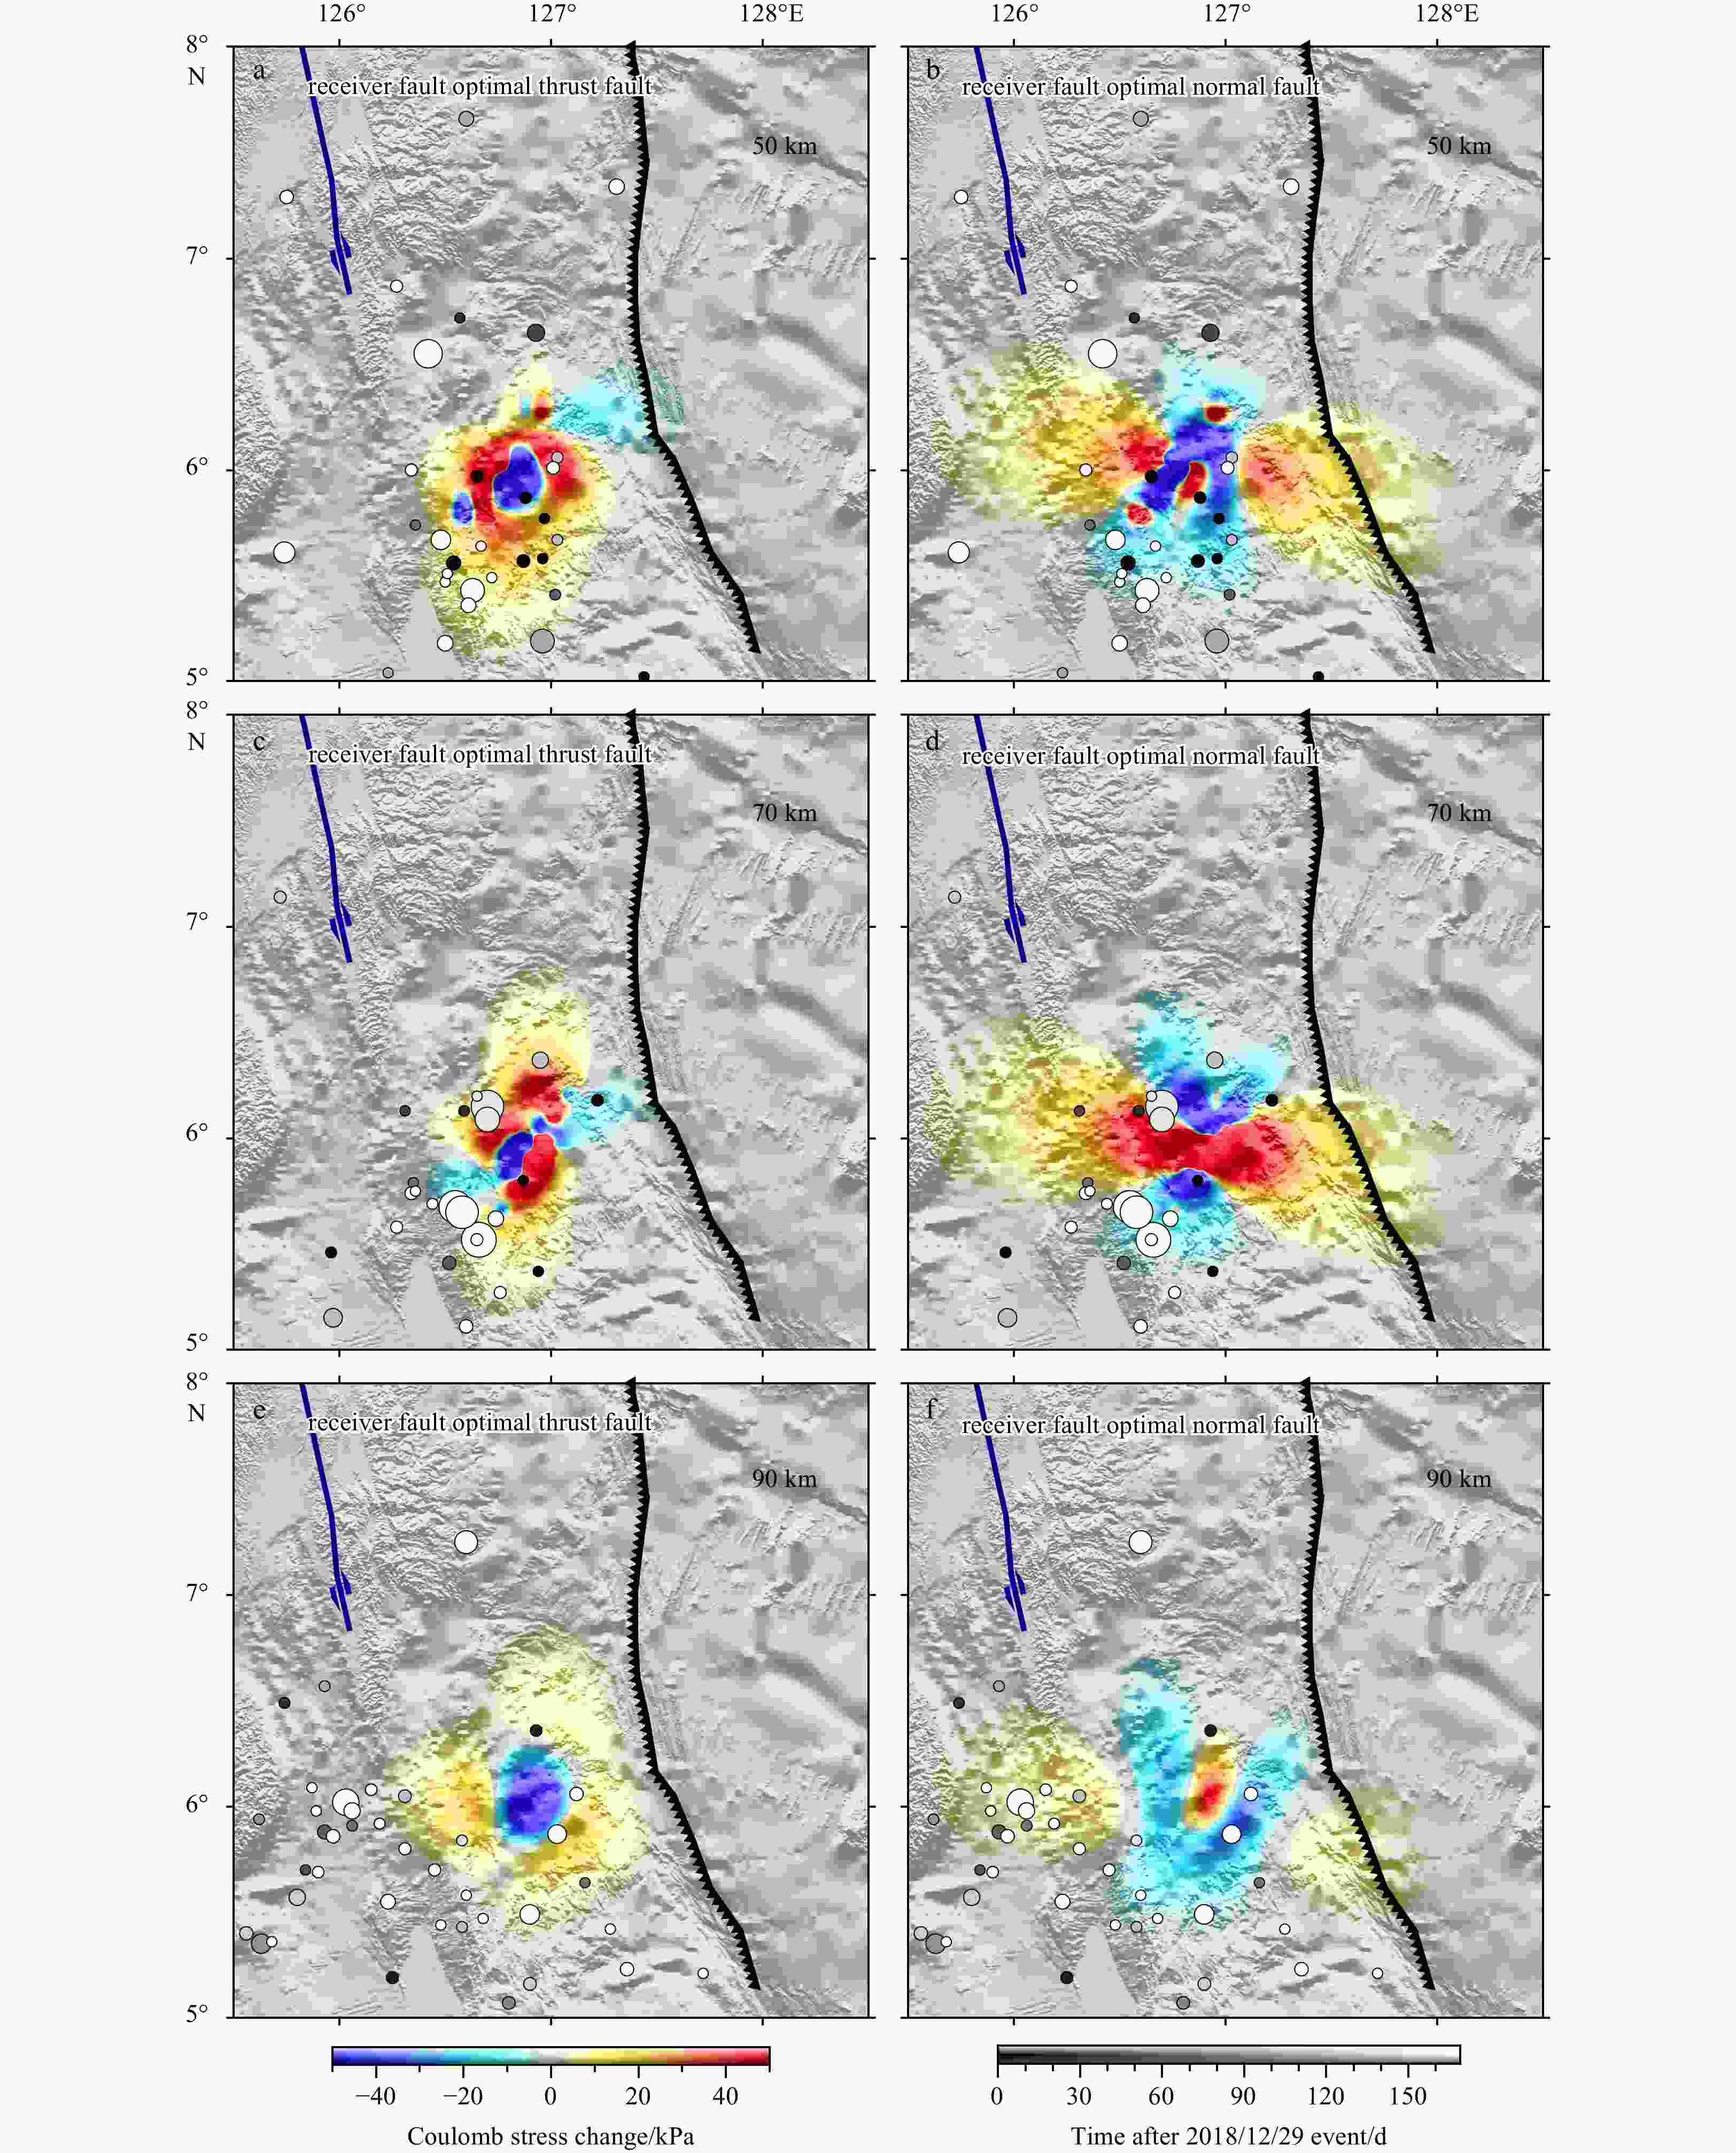
A1. Coulomb stress changes generated by the first event (2018/12/29, Mw 7.0). The source fault model is based on the finite slip model from USGS website (
https://earthquake.usgs.gov/earthquakes/eventpage/us2000iyta/finite-fault ). The Coulomb stress changes are computed at depth of 50 km, 70 km and 90 km, receiver fault mechanism was set to be the fifth event (a, c, and e: 2019/05/31, Mw 6.1) and the sixth event (b, d, and f: 2019/09/29, Mw 6.2). Solid circles show the local events (Mw ≥ 3.5) with Coulomb stress change$\Delta {\sigma }_{{\rm{c}}}$ ≥ 5 kPa, within different depth range (a and b: 40–60 km; c and d: 60–80 km; e and f: 80–100 km). Mechanism of the local events was assumed to be the same as the fifth event (a, c, and e: 2019/05/31, Mw 6.1) and the sixth event (b, d, and f: 2019/09/29, Mw 6.2).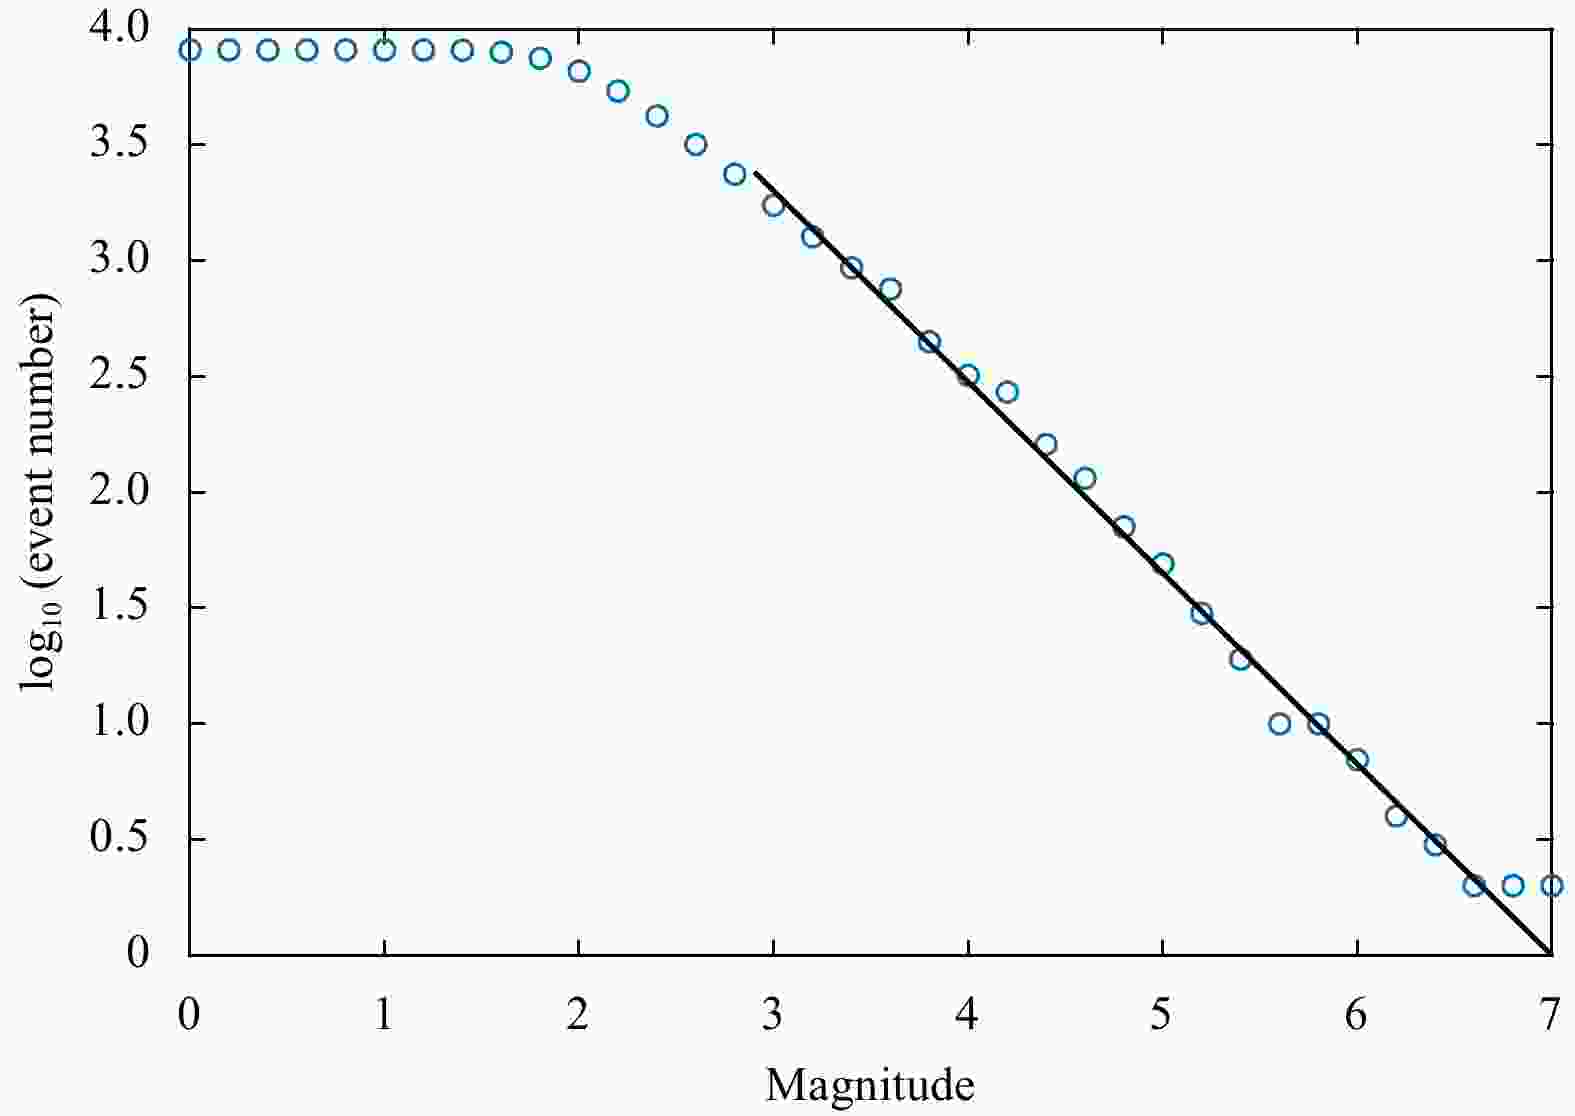
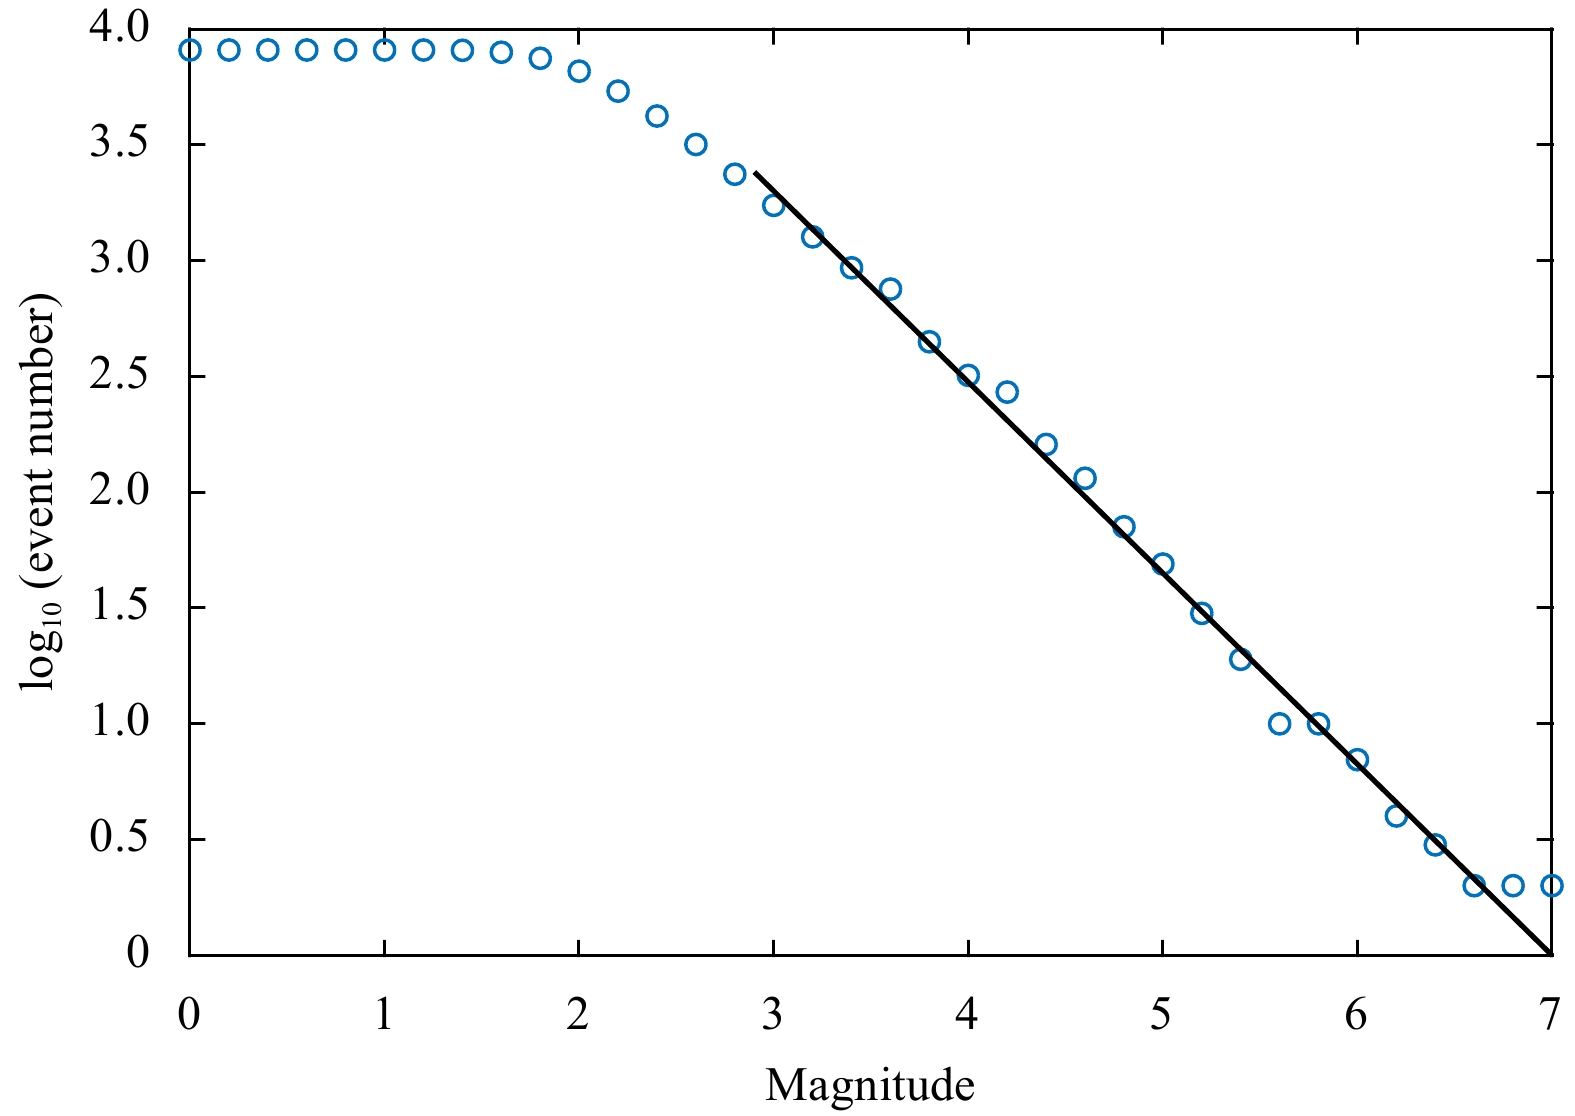
A2. Number of earthquakes versus magnitude of events in the local catalog during 2018/08/01 to 2019/06/15. Blue circles are the raw data, and black line is fitted flowing the Gutenberg-Richter law.
A3. The event distributions and their relationship with Coulomb stress changes of the first event at the regions plotted in Fig. 2. Receiver fault of these local events are set the same as the sixth event (2019/09/29, Mw 6.2). a, b. Accumulated event number (left y-axis) and magnitude distributions (right y-axis) during 2018/07/31 to 2019/09/29, associated with positive Coulomb stress changes (a) and negative Coulomb stress changes (b); c, d. Blue and red bars show the histogram of negative and positive Coulomb stress changes respectively; c. Histogram of the Mw ≥ 2.5 earthquakes during 2018/12/29 to 2019/09/29; d. Histogram of the Mw ≥ 3.5 earthquakes during 2018/12/29 to 2019/09/29; e. Histogram of Mw ≥ 2.5 events during 2018/07/31 to 2018/12/29; and f. Histogram of Mw ≥ 3.5 events during 2018/07/31 to 2018/12/29. The numbers indicate the total count during these periods, and only events with stress change ≥ 5 kPa are counted.
A4. Coulomb stress changes generated by the first event (2018/12/29, Mw 7.0). The source fault model is based on the finite slip model from USGS website (
https://earthquake.usgs.gov/earthquakes/eventpage/us2000iyta/finite-fault ). The Coulomb stress changes are computed at depth of 50 km, 70 km and 90 km, receiver fault mechanism was set to be the optimal thrust fault (a, c, and e) and optimal normal fault (b, d, and f). Solid circles show the local events within different depth range ±10 km.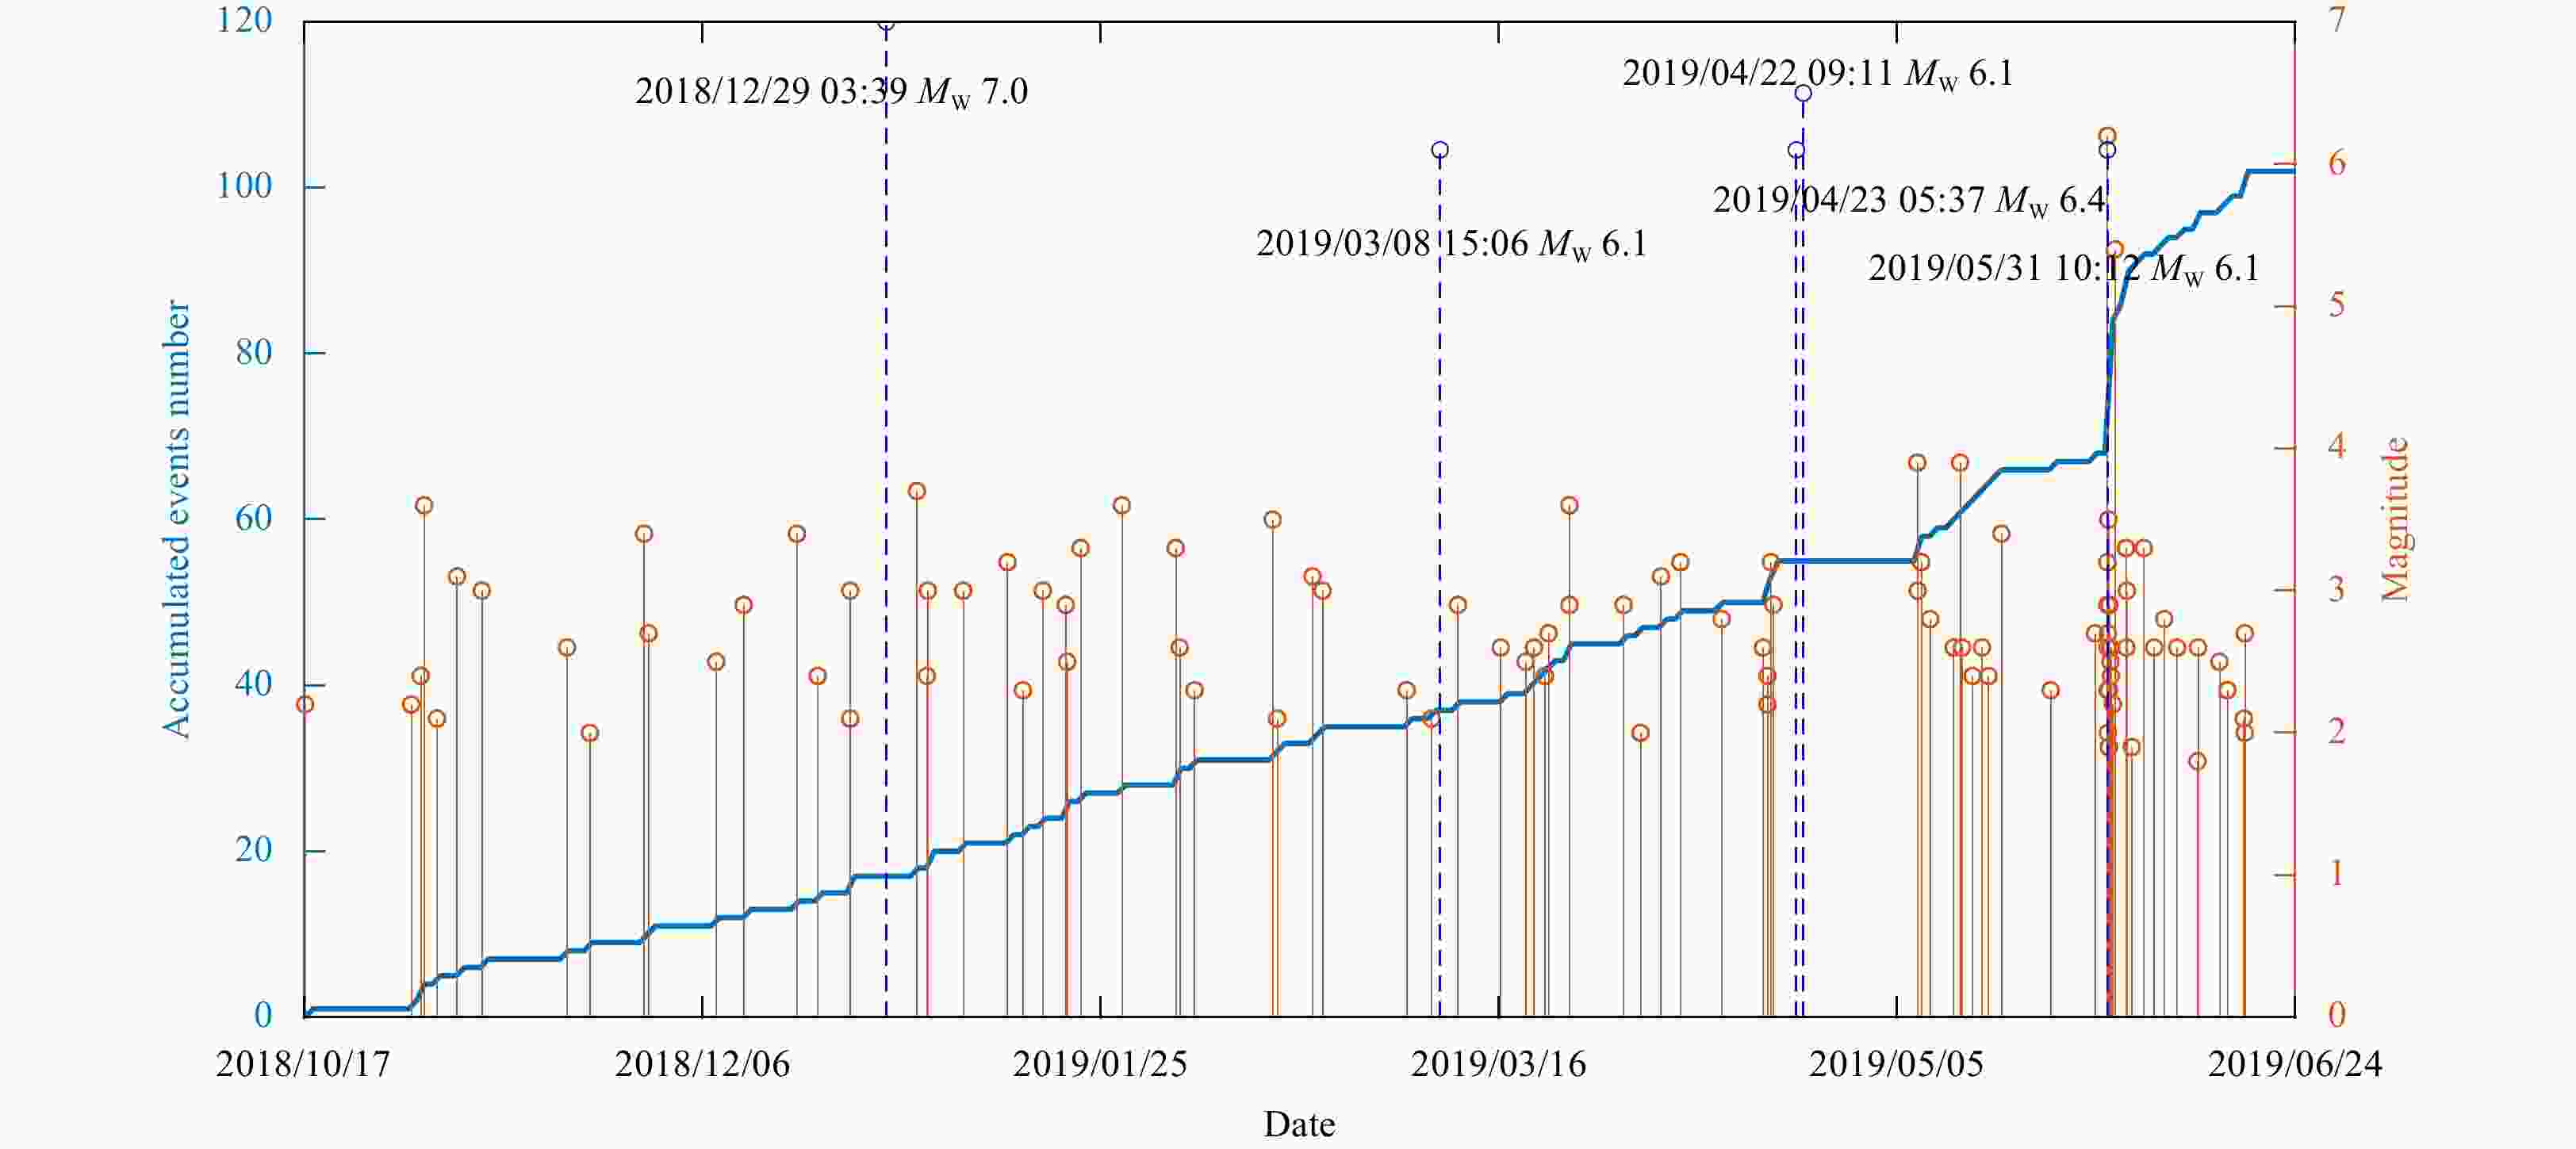
A5. The local seismicity at the 0.5°×0.5° square with the center of the 2019/05/31 event. No instant seismicity increase is observed after 2018/12/29 at this region. The occurrence time of the five earthquakes is marked with dashed blue lines.
Table 1. The detailed information of these six earthquakes based on GCMT catalog
No. Date Latitude1) Longitude1) Depth1)/km Mw Str1/dip1/rake1/(°)2) Str2/dip2/rake2/(°) 1 2018/12/29 5.48°N 127.05°E 60 7.0 34/46/134 160/59/55 2 2019/03/08 10.37°N 126.13°E 17 6.1 160/36/69 5/57/104 3 2019/04/22 15.02°N 120.34°E 10 6.1 329/86/–3 59/87/–176 4 2019/04/23 11.79°N 125.37°E 61 6.4 70/21/144 194/78/73 5 2019/05/31 6.15°N 126.70°E 78 6.1 197/30/125 338/66/72 6 2019/09/29 5.52°N 126.66°E 63 6.2 226/21/–179 135/90/–69 Notes: 1) Earthquake location refers to the local catalog. 2)Primary fault geometry used in Coulomb stress change calculation.  下载: 导出CSV
Table 2. Static Coulomb stress change of each event to the subsequent events
Source fault Static Coulomb stress change on each receiver fault/kPa No. Date 2019/03/08 2019/04/22 2019/04/23 2019/05/31 2019/09/29 1 2018/12/29 < 0.1 < 0.1 < 0.1 19 1 2 2019/03/08 / < 0.1 < 0.1 < 0.1 < 0.1 3 2019/04/22 / / < 0.1 < 0.1 < 0.1 4 2019/04/23 / / / < 0.1 < 0.1 5 2019/05/31 / / / / 0.4 6 2019/09/29 / / / / / Note: Bold numbers indicate the static Coulomb stress change ≥ 1 kPa.
下载: 导出CSV
Table 3. Dynamic stress change of each event to the subsequent events
Source fault Dynamic stress change on each receiver faults/kPa No. Date 2019/03/08 2019/04/22 2019/04/23 2019/05/31 2019/09/29 1 2018/12/29 133 5 94 1 517 3 532 2 2019/03/08 / 1 99 28 24 3 2019/04/22 / / 18 1 1 4 2019/04/23 / / / 34 30 5 2019/05/31 / / / / 329 6 2019/09/29 / / / / / Note: Bold numbers indicate the dynamic stress change ≥ 300 kPa
下载: 导出CSV
-
[1] Aiken C, Peng Zhigang. 2014. Dynamic triggering of microearthquakes in three geothermal/volcanic regions of California. Journal of Geophysical Research: Solid Earth, 119(9): 6992–7009. doi: 10.1002/2014JB011218 [2] Aki K, Richard P G. 2002. Quantitative Seismology. 2nd ed. Sausalito, CA: University Science Books [3] Anderson J G, Brune J N, Louie J N, et al. 1994. Seismicity in the western Great Basin apparently triggered by the Landers, California, earthquake, 28 June 1992. Bulletin of the Seismological Society of America, 84(3): 863–891 [4] Aurelio M A. 2000. Shear partitioning in the Philippines: Constraints from Philippine fault and global positioning system data. Island Arc, 9(4): 584–597. doi: 10.1046/j.1440-1738.2000.00304.x [5] Aurelio M A, Dianala J D B, Taguibao K J L, et al. 2017. Seismotectonics of the 6 February 2012 MW 6.7 Negros Earthquake, central Philippines. Journal of Asian Earth Sciences, 142: 93–108. doi: 10.1016/j.jseaes.2016.12.018 [6] Bach C, Hainzl S. 2012. Improving empirical aftershock modeling based on additional source information. Journal of Geophysical Research: Solid Earth, 117(B4): B04312. doi: 10.1029/2011JB008901 [7] Bansal A R, Yao Dongdong, Peng Zhigang, et al. 2016. Isolated regions of remote triggering in South/Southeast Asia following the 2012 MW 8.6 Indian Ocean earthquake. Geophysical Research Letters, 43(20): 10654–10662. doi: 10.1002/2016GL069955 [8] Belardinelli M E, Bizzarri A, Cocco M. 2003. Earthquake triggering by static and dynamic stress changes. Journal of Geophysical Research: Solid Earth, 108(B3): 2135 [9] Brodsky E E, Prejean S G. 2005. New constraints on mechanisms of remotely triggered seismicity at Long Valley Caldera. Journal of Geophysical Research: Solid Earth, 110(B4): B04302. doi: 10.1029/2004JB003211 [10] Castro A F P, Dougherty S L, Harrington R M, et al. 2019. Delayed dynamic triggering of disposal-induced earthquakes observed by a dense array in Northern Oklahoma. Journal of Geophysical Research: Solid Earth, 124(4): 3766–3781. doi: 10.1029/2018JB017150 [11] Chen Pofei, Olavere E A, Wang Chenwei, et al. 2015. Seismotectonics of Mindoro, Philippines. Tectonophysics, 640–641: 70–79 [12] Ekström G, Nettles M, Dziewoński A M. 2012. The global CMT project 2004–2010: Centroid-moment tensors for 13, 017 earthquakes. Physics of the Earth and Planetary Interiors, 200–201: 1–9. doi: 10.1016/j.pepi.2012.04.002 [13] Enescu B, Mori J, Miyazawa M. 2007. Quantifying early aftershock activity of the 2004 mid-Niigata Prefecture earthquake (MW6.6). Journal of Geophysical Research: Solid Earth, 112(B4): B04310 [14] Enescu B, Shimojo K, Opris A, et al. 2016. Remote triggering of seismicity at Japanese volcanoes following the 2016 M7.3 Kumamoto earthquake. Earth, Planets and Space, 68: 165. doi: 10.1186/s40623-016-0539-5 [15] Fan Jianke, Zhao Dapeng. 2019. P-wave anisotropic tomography of the central and southern Philippines. Physics of the Earth and Planetary Interiors, 286: 154–164. doi: 10.1016/j.pepi.2018.12.001 [16] Freed A M. 2005. Earthquake triggering by static, dynamic, and postseismic stress transfer. Annual Review of Earth and Planetary Sciences, 33: 335–367. doi: 10.1146/annurev.earth.33.092203.122505 [17] Ghosh A, Vidale J E, Peng Zhigang, et al. 2009. Complex nonvolcanic tremor near Parkfield, California, triggered by the great 2004 Sumatra earthquake. Journal of Geophysical Research: Solid Earth, 114(12 [18] Gomberg J, Beeler N M, Blanpied M L, et al. 1998. Earthquake triggering by transient and static deformations. Journal of Geophysical Research: Solid Earth, 103(B10): 24411–24426. doi: 10.1029/98JB01125 [19] Guilhem A, Peng Zhigang, Nadeau R M. 2010. High-frequency identification of non-volcanic tremor triggered by regional earthquakes. Geophysical Research Letters, 37(16): L16309. doi: 10.1029/2010GL044660 [20] Hayes G P, Moore G L, Portner D E, et al. 2018. Slab2, a comprehensive subduction zone geometry model. Science, 362(6410): 58–61. doi: 10.1126/science.aat4723 [21] Johnson C W, Bürgmann R. 2016. Delayed dynamic triggering: Local seismicity leading up to three remote M≥6 aftershocks of the 11 April 2012 M8.6 Indian Ocean earthquake. Journal of Geophysical Research: Solid Earth, 121(1): 134–151. doi: 10.1002/2015JB012243 [22] Hill D P, Prejean S G. 2015. 4.11-Dynamic triggering. Treatise on Geophysics, 4: 273–304 [23] Kilb D. 2003. A strong correlation between induced peak dynamic Coulomb stress change from the 1992 M7.3 Landers, California, earthquake and the hypocenter of the 1999 M7.1 Hector Mine, California, earthquake. Journal of Geophysical Research: Solid Earth, 108(B1): ESE 3-1–ESE 3-7. doi: 10.1029/2001JB000678 [24] King G C P, Deves M H. 2015. Fault interaction, earthquake stress changes, and the evolution of seismicity. Treatise on Geophysics, 4: 225–255 [25] King G C P, Stein R S, Lin Jian. 1994. Static stress changes and the triggering of earthquakes. Bulletin of the Seismological Society of America, 84(3): 935–953 [26] Lei Xinglin, Xie Chaodi, Fu Bihong. 2011. Remotely triggered seismicity in Yunnan, southwestern China, following the 2004 Mw 9.3 Sumatra earthquake. Journal of Geophysical Research: Solid Earth, 116(B8): B08303. doi: 10.1029/2011JB008245 [27] Li Lu, Wang Baoshan, Peng Zhigang, et al. 2019. Dynamic triggering of microseismicity in Southwest China following the 2004 Sumatra and 2012 Indian Ocean Earthquakes. Journal of Asian Earth Sciences, 176: 129–140. doi: 10.1016/j.jseaes.2019.02.010 [28] Lin Jian, Stein R S. 2004. Stress triggering in thrust and subduction earthquakes and stress interaction between the southern San Andreas and nearby thrust and strike-slip faults. Journal of Geophysical Research: Solid Earth, 109(B2): B02303 [29] Lin Jingyi, Wu Wennan, Lo C L. 2015. Megathrust earthquake potential of the Manila subduction system: revealed by the seismic moment tensor element Mrr. Terrestrial, Atmospheric and Oceanic Sciences, 26(6): 619–630. doi: 10.3319/TAO.2013.04.29.01(TC) [30] Meng Xiaofeng, Peng Zhigang. 2014. Seismicity rate changes in the Salton Sea Geothermal Field and the San Jacinto Fault Zone after the 2010 Mw 7.2 El Mayor-Cucapah earthquake. Geophysical Journal International, 197(3): 1750–1762. doi: 10.1093/gji/ggu085 [31] Meng Xiaofeng, Peng Zhigang, Hardebeck J L. 2013. Seismicity around Parkfield correlates with static shear stress changes following the 2003 MW6.5 San Simeon earthquake. Journal of Geophysical Research: Solid Earth, 118(7): 3576–3591. doi: 10.1002/jgrb.50271 [32] Müller R D, Sdrolias M, Gaina C, et al. 2008. Age, spreading rates, and spreading asymmetry of the world's ocean crust. Geochemistry, Geophysics, Geosystems, 9(4): Q04006 [33] Ogata Y. 1988. Statistical models for earthquake occurrences and residual analysis for point processes. Journal of the American Statistical Association, 83(401): 9–27. doi: 10.1080/01621459.1988.10478560 [34] Orlecka-Sikora B. 2010. The role of static stress transfer in mining induced seismic events occurrence, a case study of the Rudna mine in the Legnica-Glogow Copper District in Poland. Geophysical Journal International, 182(2): 1087–1095. doi: 10.1111/j.1365-246X.2010.04672.x [35] Pankow K L, Kilb D. 2020. Going beyond rate changes as the sole indicator for dynamic triggering of earthquakes. Scientific Reports, 10: 4120. doi: 10.1038/s41598-020-60988-2 [36] Papadopoulos G A. 2002. The Athens, Greece, earthquake (MS 5.9) of 7 September 1999: an event triggered by the Izmit, Turkey, 17 August 1999 earthquake?. Bulletin of the Seismological Society of America, 92(1): 312–321. doi: 10.1785/0120000805 [37] Parsons T, Velasco A. 2011. Absence of remotely triggered large earthquakes beyond the mainshock region. Nature Geoscience, 4: 312–316. doi: 10.1038/ngeo1110 [38] Peng Zhigang, Fry B, Chao K, et al. 2018. Remote triggering of microearthquakes and tremor in New Zealand following the 2016 MW 7.8 Kaikōura earthquake. Bulletin of the Seismological Society of America, 108(3B): 1784–1793. doi: 10.1785/0120170327 [39] Peng Zhigang, Gomberg J. 2010. An integrated perspective of the continuum between earthquakes and slow-slip phenomena. Nature Geoscience, 3: 599–607. doi: 10.1038/ngeo940 [40] Peng Zhigang, Shelly D R, Ellsworth W L. 2015. Delayed dynamic triggering of deep tremor along the Parkfield-Cholame section of the San Andreas Fault following the 2014 M6.0 South Napa earthquake. Geophysical Research Letters, 42(19): 7916–7922. doi: 10.1002/2015GL065277 [41] Peng Zhigang, Vidale J E, Ishii M, et al. 2007. Seismicity rate immediately before and after main shock rupture from high-frequency waveforms in Japan. Journal of Geophysical Research: Solid Earth, 112: B03306. doi: 10.1029/2006JB004386 [42] Peng Zhigang, Zhao Peng. 2009. Migration of early aftershocks following the 2004 Parkfield earthquake. Nature Geoscience, 2: 877–881. doi: 10.1038/ngeo697 [43] Pollitz F, Stein R, Sevilgen V, et al. 2012. The 11 April 2012 east Indian Ocean earthquake triggered large aftershocks worldwide. Nature, 490: 250–253. doi: 10.1038/nature11ence504 [44] Qiu Qiang, Li Linlin, Hsu Y J, et al. 2019. Revised earthquake sources along Manila trench for tsunami hazard assessment in the South China Sea. Natural Hazards and Earth System Sciences, 19(7): 1565–1583. doi: 10.5194/nhess-19-1565-2019 [45] Reverso T, Steacy S, Marsan D. 2018. A hybrid ETAS-Coulomb approach to forecast spatiotemporal aftershock rates. Journal of Geophysical Research: Solid Earth, 123(11): 9750–9763. doi: 10.1029/2017JB015108 [46] Richter C F. 1958. Elementary Seismology. San Francisco: W H Freeman and Co Bailey Bros & Swinfen Ltd [47] Ringenbach J C, Pinet N, Stéphan J F, et al. 1993. Structural variety and tectonic evolution of strike-slip basins related to the Philippine Fault System, northern Luzon, Philippines. Tectonics, 12(1): 187–203. doi: 10.1029/92TC01968 [48] Ross Z E, Trugman D T, Hauksson E, et al. 2019. Searching for hidden earthquakes in Southern California. Science, 364(6442): 767–771. doi: 10.1126/science.aaw6888 [49] Sepúlveda I, Liu P L F, Grigoriu M. 2019. Probabilistic tsunami hazard assessment in South China Sea with consideration of uncertain earthquake characteristics. Journal of Geophysical Research: Solid Earth, 124(1): 658–688. doi: 10.1029/2018JB016620 [50] Shearer P M. 1999. Introduction to Seismology. Cambridge: Cambridge University Press [51] Shelly D R, Johnson K M. 2011. Tremor reveals stress shadowing, deep postseismic creep, and depth-dependent slip recurrence on the lower-crustal San Andreas fault near Parkfield. Geophysical Research Letters, 38(13 [52] Smoczyk G M, Hayes G P, Hamburger M W, et al. 2013. Seismicity of the earth 1900–2012 Philippine Sea plate and vicinity. USGS Open-File Report: 2010-1083-M. Reston, VA, USA: U.S. Geological Survey [53] Steacy S, Gerstenberger M, Williams C, et al. 2014. A new hybrid Coulomb/statistical model for forecasting aftershock rates. Geophysical Journal International, 196(2): 918–923. doi: 10.1093/gji/ggt404 [54] Toda S, Stein R S, Beroza G C, et al. 2012. Aftershocks halted by static stress shadows. Nature Geoscience, 5(6): 410–413. doi: 10.1038/ngeo1465 [55] Toda S, Stein R S, Richards-Dinger K, et al. 2005. Forecasting the evolution of seismicity in southern California: Animations built on earthquake stress transfer. Journal of Geophysical Research: Solid Earth, 110(B5): B05S16. doi: 10.1029/2004JB003415 [56] Toda S, Stein R S, Sevilgen V, et al. 2011. Coulomb 3.3 Graphic-rich deformation and stress-change software for earthquake, tectonic, and volcano research and teaching-user guide. Open-File Report 2011-1060. Reston, VA, USA: U S Geological Survey, doi: 10.3133/ofr20111060 [57] Van Der Elst N J, Brodsky E E. 2010. Connecting near-field and far-field earthquake triggering to dynamic strain. Journal of Geophysical Research: Solid Earth, 115(B7): B07311. doi: 10.1029/2009JB006681 [58] Wallace L M, Kaneko Y, Hreinsdóttir S, et al. 2017. Large-scale dynamic triggering of shallow slow slip enhanced by overlying sedimentary wedge. Nature Geoscience, 10(10): 765–770. doi: 10.1038/ngeo3021 [59] Walter J I, Meng Xiaofeng, Peng Zhigang, et al. 2015. Far-field triggering of foreshocks near the nucleation zone of the 5 September 2012 (MW 7.6) Nicoya Peninsula, Costa Rica earthquake. Earth and Planetary Science Letters, 431: 75–86. doi: 10.1016/j.jpgl.2015.09.017 [60] Wang Wejun, Meng Xiaofeng, Peng Zhigang, et al. 2015. Increasing background seismicity and dynamic triggering behaviors with nearby mining activities around Fangshan Pluton in Beijing, China. Journal of Geophysical Research: Solid Earth, 120(8): 5624–5638. doi: 10.1002/2015JB012235 [61] Wessel P, Smith W H F. 1998. New, improved version of generic mapping tools released. Eos, Transactions American Geophysical Union, 79(47): 579. doi: 10.1029/98EO00426 [62] West M, Sánchez J J, McNutt S R. 2005. Periodically triggered seismicity at mount Wrangell, Alaska, after the Sumatra earthquake. Science, 308(5725): 1144–1146. doi: 10.1126/science.1112462 [63] Wiemer S, Wyss M. 2000. Minimum magnitude of completeness in earthquake catalogs: examples from Alaska, the Western United States, and Japan. Bulletin of the Seismological Society of America, 90(4): 859–869. doi: 10.1785/0119990114 [64] Woessner J, Wiemer S. 2005. Assessing the quality of earthquake catalogues: estimating the magnitude of completeness and its uncertainty. Bulletin of the Seismological Society of America, 95(2): 684–698. doi: 10.1785/0120040007 [65] Wu Wennan, Lo C L, Lin Jingyi. 2017. Spatial variations of the crustal stress field in the Philippine region from inversion of earthquake focal mechanisms and their tectonic implications. Journal of Asian Earth Sciences, 142: 109–118. doi: 10.1016/j.jseaes.2017.01.036 [66] Wu Jing, Peng Zhigang, Wang Weijun, et al. 2012. Comparisons of dynamic triggering near Beijing, China following recent large earthquakes in Sumatra. Geophysical Research Letters, 39(21): L21310 [67] Yang Yinghui, Tsai M C, Hu J C, et al. 2018. Coseismic slip deficit of the 2017 MW 6.5 Ormoc earthquake that occurred along a creeping segment and geothermal field of the Philippine Fault. Geophysical Research Letters, 45(6): 2659–2668. doi: 10.1002/2017GL076417 [68] Yao Dongdong, Peng Zhigang, Meng Xiaofeng. 2015. Systematical search for remotely triggered earthquakes in Tibetan Plateau following the 2004 M 9.0 Sumatra and 2005 M 8.6 Nias earthquakes. Geophysical Journal International, 201(2): 543–551. doi: 10.1093/gji/ggv037 [69] Yu S B, Hsu Y J, Bacolcol T, et al. 2013. Present-day crustal deformation along the Philippine Fault in Luzon, Philippines. Journal of Asian Earth Sciences, 65: 64–74. doi: 10.1016/j.jseaes.2010.12.007 [70] Zhuang Jiacang, Ogata Y, Vere-Jones D. 2002. Stochastic declustering of space-time earthquake occurrences. Journal of the American Statistical Association, 97(458): 369–380. doi: 10.1198/016214502760046925 [71] Zhuang Jiacang, Ogata Y, Vere-Jones D. 2004. Analyzing earthquake clustering features by using stochastic reconstruction. Journal of Geophysical Research: Solid Earth, 109(B5): B05301 -


 点击查看大图

计量
- 文章访问数: 808
- HTML全文浏览量: 269
- PDF下载量: 34
- 被引次数: 0

