

Parentage determination of black sea bream (Acanthopagrus schlegelii) for stock enhancement: effectiveness and loss of genetic variation
-
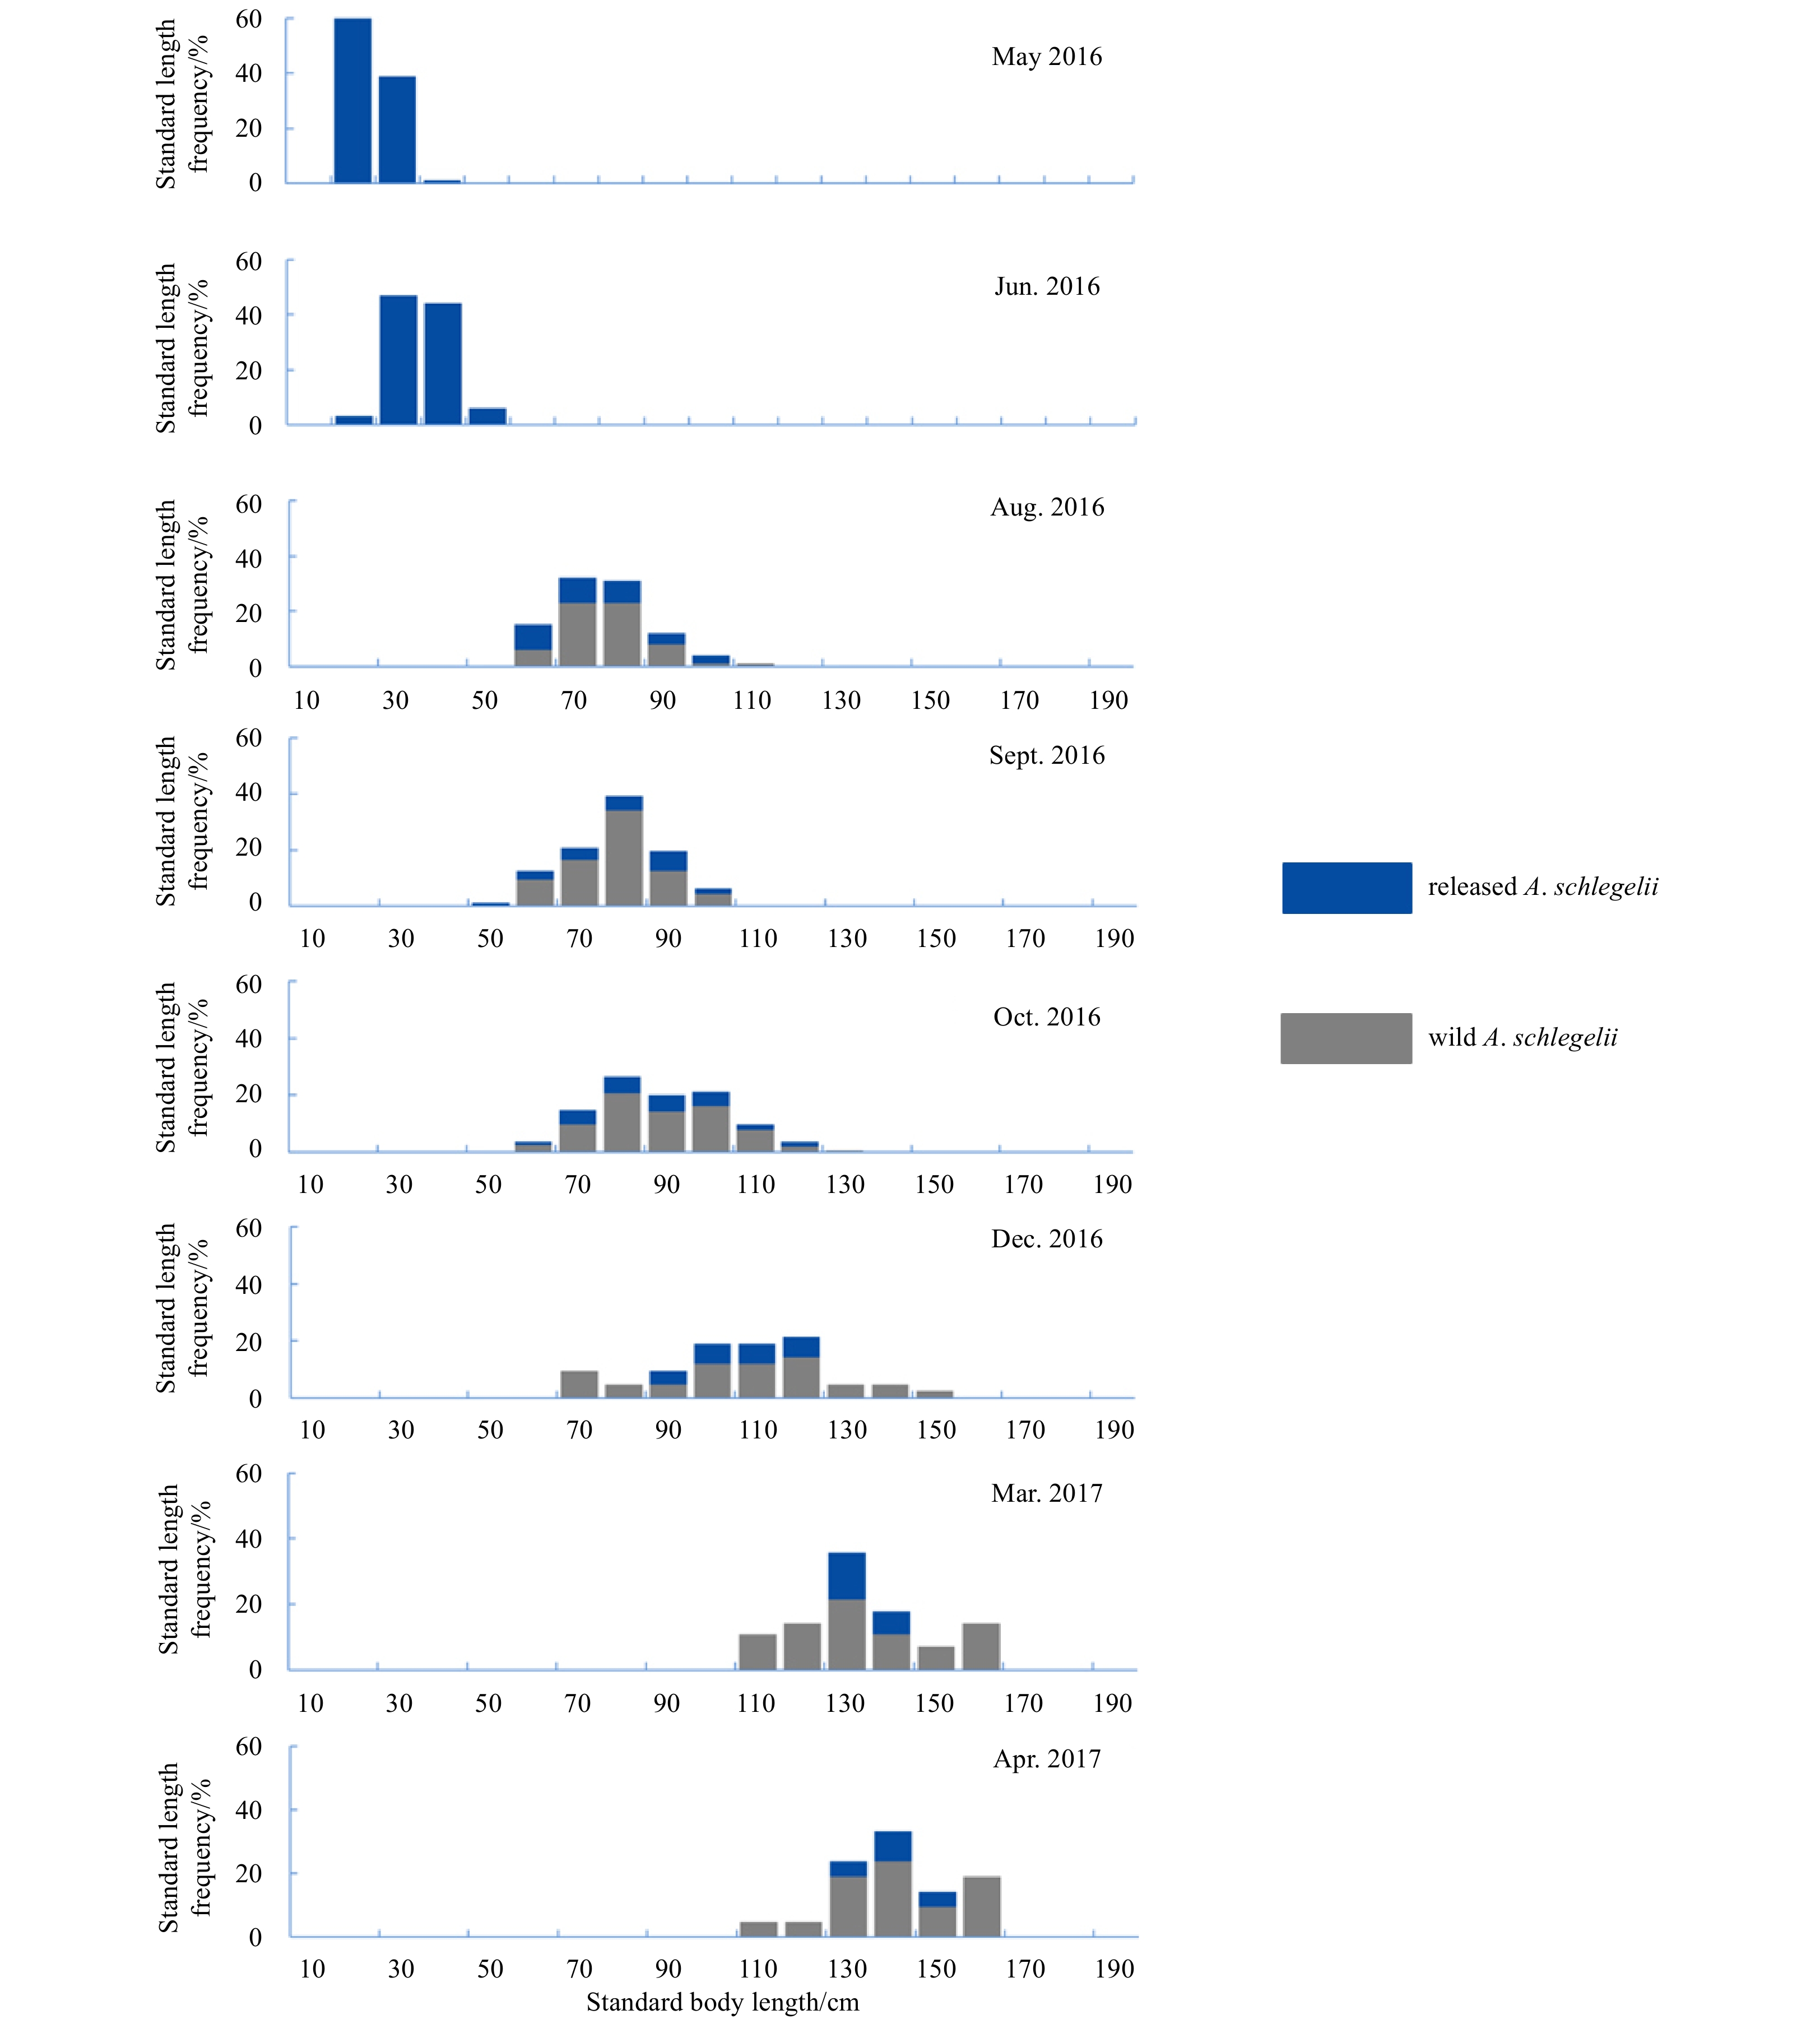
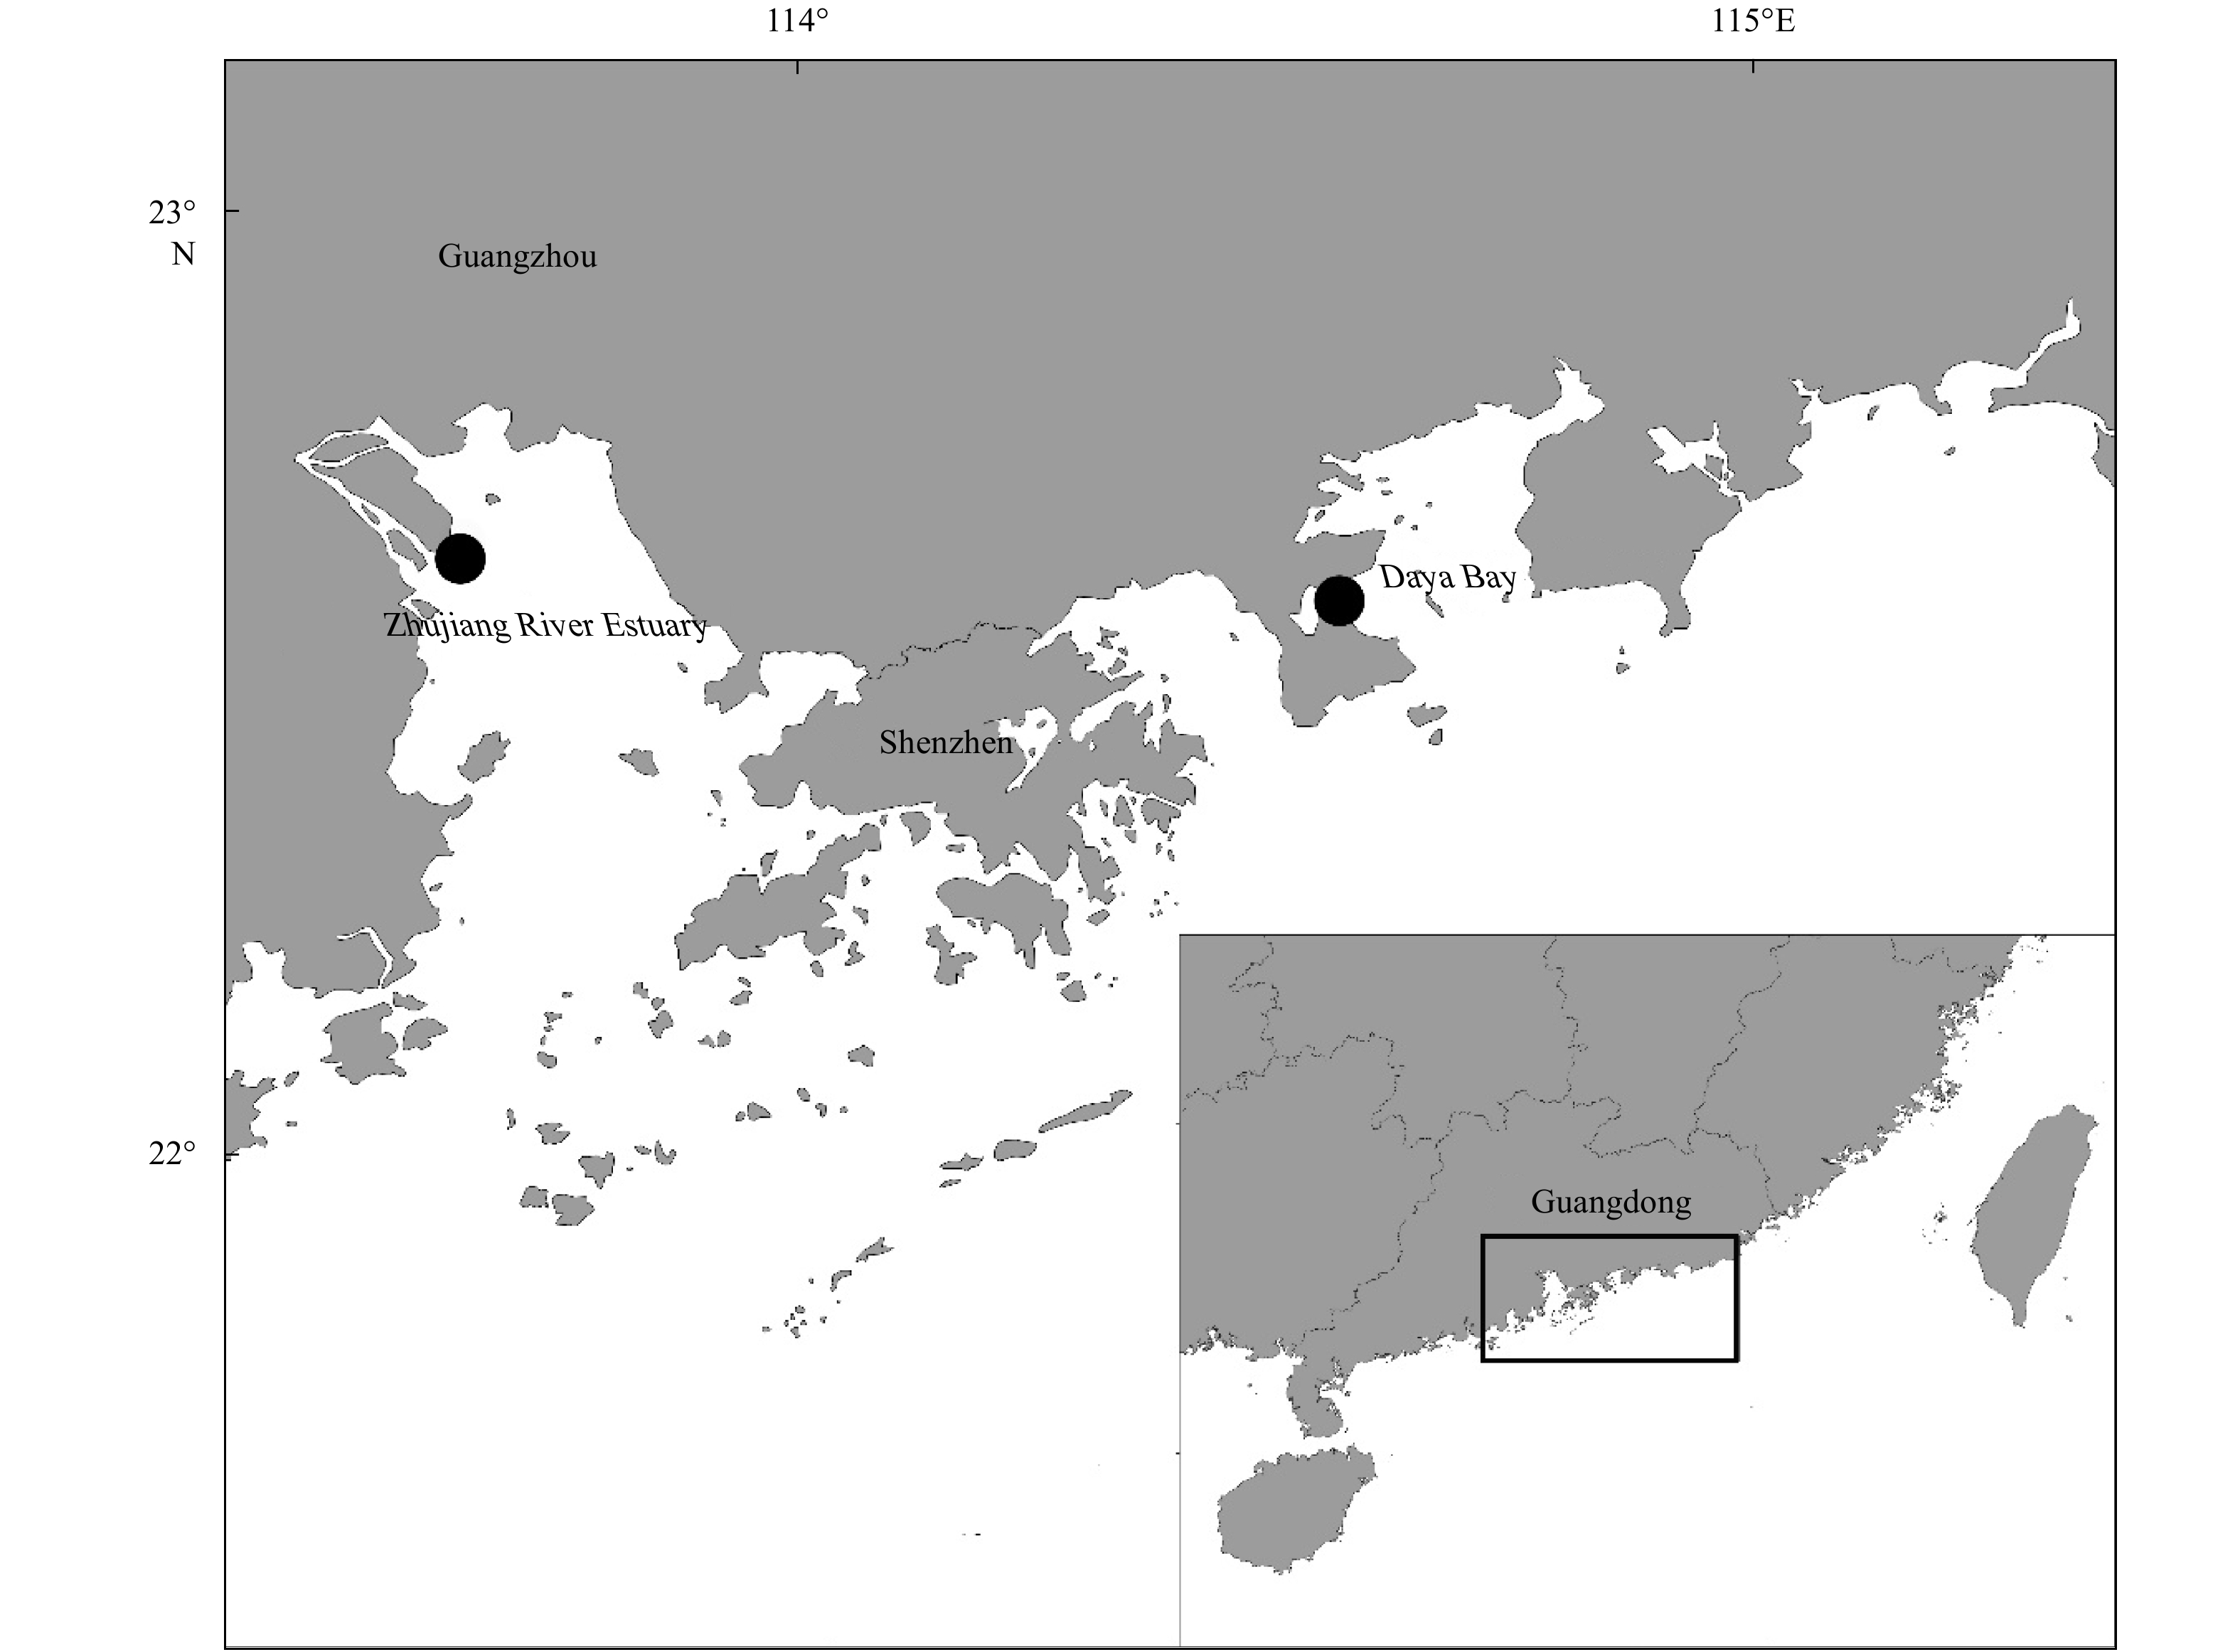
Abstract: The stock enhancement programs for black sea bream Acanthopagrus schlegelii have been conducted in China for a few years. However, little information has been reported concerning the effectiveness and genetic effect of black sea bream stock enhancement. In order to detect the contribution of released individuals in Zhujiang River Estuary (ZRE) and Daya Bay (DB), six microsatellite markers were used to identify the hatchery-released individuals. In addition, this pedigree of hatchery populations (broodfish and hatchery-released offspring) was traced to detect the number of effective parents (Ne), the inbreeding coefficient and the decrease of genetic variability in the reproduction. The pedigree reconstruction showed that at least 69 (out of 93) broodfish had offspring. The estimated Ne was 54.8, consequently the inbreeding coefficient was 0.91%. The genetic diversity of hatchery-released offspring was lower than that in that of broodfish (heterozygosity alleles, 0.727–0.774), some alleles (number of alleles, 61–69) and genetic variance were lost during reproduction. It was observed that wild samples had higher levels of genetic diversity compared with hatchery populations as well as recaptured samples in releasing area. A total of 128 hatchery-released black sea bream were identified among 487 recaptured samples in ZRE, while a total of 15 samples were identified among 96 samples in DB. In summary, there was a high survival of released fish. Nevertheless, the results provided evidence to consider a loss of genetic variation in hatchery-released stock and a negative genetic effect of the stock enhancement.
-
Table 1. Information about the releasing
Releasing date (yy/mm/dd) Releasing site Releasing number Body length/mm Body weight/g 2015/05/22 ZRE 73 000 30.43 0.71 2015/06/29 ZRE 17 000 40.42 2.02 2015/06/29 DB 18 000 40.42 2.02 2015/07/29 DB 5 500 80.78 17.97 Note: ZRE, Zhujiang River Esturay; DB, Daya Bay.  下载: 导出CSV
Table 2. Sample information of A. schlegelii
Recapture time (yy/mm/dd) Recapture site Number of total samples Number of genotyped individuals 2015/08/16–2015/08/24 ZRE 172 96 2015/08/03–2015/08/26 DB 123 96 2015/09/04 ZRE 103 97 2015/10/01 ZRE 203 203 2015/12/01 ZRE 42 42 2016/03 ZRE 28 28 2016/04 ZRE 21 21 Total – 692 583 Note: ZRE, Zhujiang River Esturay; DB, Daya Bay; –, no data.
下载: 导出CSV
Table 3. Parameters of microsatellite loci in identification of hatchery-released individuals and parentage assignments
Locus Mean Combine NE-PP Asca1 Asca3 Asca6 Asca4 Asca16 Asca17 Parentage assignments NE-PP 0.577 0.088 0.398 0.251 0.077 0.101 – 0.000 03 PIC 0.426 0.867 0.576 0.742 0.878 0.857 0.724 – Identification of hatchery-released individuals NE-PP 0.339 0.066 0.251 0.208 0.148 0.079 – 0.000 013 PIC 0.639 0.886 0.69 0.775 0.808 0.877 0.779 – Note: PIC, polymorphic information content; NE-PP, average non-exclusion probability for a candidate parent pair.
下载: 导出CSV
Table 4. The quantity and percentage of released-recaptured A. schlegelii in samples
Recapture date (yy/mm/dd) Recapture site Number of genotyped individuals Number of released-recaptured fish Rate/% 2015/08/16–2015/08/24 ZRE 96 33 34.4 2015/08/03–2015/08/26 DB 96 15 15.6 2015/09/04 ZRE 97 21 21.6 2015/10/01 ZRE 203 53 26.1 2015/12/01 ZRE 42 11 26.2 2016/03 ZRE 28 6 21.4 2016/04 ZRE 21 4 19.0 Total – 583 143 24.5
下载: 导出CSV
Table 5. Genetic variability in broodfish, hatchery-released fish, and recaptured fish
n A AR HE Ho I Fis HWE Broodfish 93 69 11.108 0.774 0.754 1.882 0.027 NS Hatchery-released fish 141 61 9.285 0.727 0.758 1.706 –0.046 – WZRE 359 115 15.119 0.820 0.743 2.139 0.096 – RZRE 487 115 14.469 0.803 0.740 2.071 0.083 – WDB 81 59 9.755 0.733 0.787 1.628 –0.117 – RDB 96 59 9.461 0.724 0.780 1.605 –0.113 – Note: RZRE, recaptured fish in the Zhujiang River Estuary; WZRE, wild fish in recaptured fish in the Zhujiang River Estuary; RDB, recaptured fish in the Daya Bay; and WDB, wild fish in recaptured fish in the Daya Bay. A, number of alleles; AR, allele richness; HE, heterozygosity alleles; I, Shannon index; HWE, deviations from Hardy-Weinberg equilibrium; n, sample size; Ho, observed heterozygosity; Fis, fixation index; NS, P < 0.05; *P < 0.05; –, no data.
下载: 导出CSV
Table 6. Estimates of FST (below diagonal) and genetic distance (above diagonal) value
Broodstock Hatchery-reared fish WZRE RZRE WDB RDB Broodstock – 0.026 0.081 0.061 0.105 0.097 Hatchery-released fish 0.004* – 0.097 0.074 0.118 0.108 WZRE 0.025* 0.034* – 0.003 0.138 0.132 RZRE 0.015* 0.022* 0.001* – 0.120 0.113 WDB 0.039* 0.049* 0.041 0.034* – 0.002 RDB 0.035* 0.044* 0.040* 0.032* –0.005 – Note: RZRE, recaptured fish in the Zhujiang River Estuary; WZRE, wild fish in recaptured fish in the Zhujiang River Estuary; RDB, recaptured fish in the Daya Bay; and WDB, wild fish in recaptured fish in the Daya Bay. *P < 0.05; –, no data.
下载: 导出CSV
-
[1] Allendorf F W, Phelps S R. 1980. Loss of genetic variation in a hatchery stock of cutthroat trout. Transactions of the American Fisheries Society, 109(5): 537–543. doi: 10.1577/1548-8659(1980)109<537:LOGVIA>2.0.CO;2 [2] Bell J D, Leber K M, Blankenship H L, et al. 2008. A new era for restocking, stock enhancement and sea ranching of coastal fisheries resources. Reviews in Fisheries Science, 16(1–3): 1–9. doi: 10.1080/10641260701776951 [3] Borrell Y J, Alvarez J, Blanco G, et al. 2011. A parentage study using microsatellite loci in a pilot project for aquaculture of the European anchovy Engraulis encrasicolus L. Aquaculture, 310(3–4): 305–311. doi: 10.1016/j.aquaculture.2010.10.025 [4] Campton D E. 1995. Genetic effects of hatchery fish on wild populations of Pacific salmon and steelhead: what do we really know?. Transactions of the American Fisheries Society, 15: 337–353 [5] Cheng Weiwei, Wang Dengqiang, Wei Qiwei, et al. 2014. Effect of restocking enkancement of Chinese sucker in the middle and upper reaches of Yangtze River based on microsatellite loci. Journal of Fishery Sciences of China (in Chinese), 21(3): 574–580 [6] Escalante M A, García-De-León F J, Dillman C B, et al. 2014. Genetic introgression of cultured rainbow trout in the Mexican native trout complex. Conservation Genetics, 15(5): 1063–1071. doi: 10.1007/s10592-014-0599-7 [7] FAO. 2016. The State of World Fisheries and Aquaculture 2016. Rome: Food and Agriculture Organization of the United Nations, 5–6 [8] Franklin I R. 1980. Evolutionary change in small populations. In: Soule M J, Wilcox B A, eds. Conservation Biology: an Evolutionary-Ecological Perspective. Sunderland: Sinauer Associates, 135–149 [9] Gall G A E. 1987. Inbreeding. In: Ryman N, Utter F, eds. Population Genetics & Fishery Management. Seattle, WA: University Washington Press, 47–87 [10] Gonzalez E B, Aritaki M, Sakurai S, et al. 2013. Inference of potential genetic risks associated with large-scale releases of red sea bream in Kanagawa Prefecture, Japan based on nuclear and mitochondrial DNA analysis. Marine Biotechnology, 15(2): 206–220. doi: 10.1007/s10126-012-9479-7 [11] Gonzalez E B, Nagasawa K, Umino T. 2008. Stock enhancement program for black sea bream (Acanthopagrus schlegelii) in Hiroshima Bay: monitoring the genetic effects. Aquaculture, 276(1–4): 36–43. doi: 10.1016/j.aquaculture.2008.02.004 [12] Gonzalez E B, Taniguchi N, Umino T. 2010. Can ordinary single-day egg collection increase the effective population size in broodstock management programs? Breeder-offspring assignment in black sea bream (Acanthopagrus schlegelii) through two-hourly intervals. Aquaculture, 308: S12–S19. doi: 10.1016/j.aquaculture.2010.06.031 [13] Hamasaki K, Toriya S, Shishidou H, et al. 2010. Genetic effects of hatchery fish on wild populations in red sea bream Pagrus major (Perciformes, Sparidae) inferred from a partial sequence of mitochondrial DNA. Journal of Fish Biology, 77(9): 2123–2136. doi: 10.1111/j.1095-8649.2010.02826.x [14] Hara M, Sekino M. 2003. Efficient detection of parentage in a cultured Japanese flounder Paralichthys olivaceus using microsatellite DNA marker. Aquaculture, 217(1–4): 107–114. doi: 10.1016/S0044-8486(02)00069-8 [15] Hedgecock D, Coykendall K. 2007. Genetic risks of marine hatchery enhancement: The good, the bad, and the unknown. In: Bert T M, ed. Ecological and Genetic Implications of Aquaculture Activities. Dordrecht: Springer Press, 85–101 [16] Hedgecock D, Sly F. 1990. Genetic drift and effective population sizes of hatchery-propagated stocks of the Pacific oyster, Crassostrea gigas. Aquaculture, 88(1): 21–38. doi: 10.1016/0044-8486(90)90316-F [17] Iguchi K I, Watanabe K, Nishida M. 1999. Reduced mitochondrial DNA variation in hatchery populations of ayu (Plecoglossus altivelis) cultured for multiple generations. Aquaculture, 178(3–4): 235–243. doi: 10.1016/S0044-8486(99)00133-7 [18] Jenkins W E, Denson M R, Bridgham C B, et al. 2004. Year-class component, growth, and movement of juvenile red drum stocked seasonally in a South Carolina estuary. North American Journal of Fisheries Management, 24(2): 636–647. doi: 10.1577/M02-166.1 [19] Jeong D S, Gonzalez E B, Morishima K, et al. 2007. Parentage assignment of stocked black sea bream Acanthopagrus schlegelii in Hiroshima Bay using microsatellite DNA markers. Fisheries Science, 73(4): 823–830. doi: 10.1111/j.1444-2906.2007.01402.x [20] Jeong D S, Umino T, Kuroda K, et al. 2003. Genetic divergence and population structure of black sea bream Acanthopagrus schlegeli inferred from microsatellite analysis. Fisheries Science, 69(5): 896–902. doi: 10.1046/j.1444-2906.2003.00705.x [21] Kalinowski S T, Taper M L, Marshall T C. 2007. Revising how the computer program CERVUS accommodates genotyping error increases success in paternity assignment. Molecular Ecology, 16(5): 1099–1106. doi: 10.1111/j.1365-294X.2007.03089.x [22] Karlsson S, Saillant E, Bumguardner B W, et al. 2008. Genetic identification of hatchery-released red drum in Texas bays and estuaries. North American Journal of Fisheries Management, 28(4): 1294–1304. doi: 10.1577/M07-181.1 [23] Lin Jin, Chen Tao, Chen Lin, et al. 2001. The techniques of Sparus marocephalus tagged and released in Daya Bay. Journal of Fisheries of China (in Chinese), 25(1): 79–83 [24] Marshall T C, Slate J, Kruuk L E B, et al. 1998. Statistical confidence for likelihood-based paternity inference in natural populations. Molecular Ecology, 7(5): 639–655. doi: 10.1046/j.1365-294x.1998.00374.x [25] Meffe G K. 1986. Conservation genetics and the management of endangered fishes. Fisheries, 11(1): 14–23. doi: 10.1577/1548-8446(1986)011<0014:CGATMO>2.0.CO;2 [26] Molony B W, Lenanton R, Jackson G, et al. 2003. Stock enhancement as a fisheries management tool. Reviews in Fish Biology and Fisheries, 13(4): 409–432. doi: 10.1007/s11160-004-1886-z [27] Nei M. 1978. Estimation of average heterozygosity and genetic distance from a small number of individuals. Genetics, 89(3): 583–590. doi: 10.1093/genetics/89.3.583 [28] Perez-Enriquez R, Takagi M, Taniguchi N. 1999. Genetic variability and pedigree tracing of a hatchery-reared stock of red sea bream (Pagrus major) used for stock enhancement, based on microsatellite DNA markers. Aquaculture, 173(1–4): 413–423. doi: 10.1016/S0044-8486(98)00469-4 [29] Raymond M, Rousset F. 1995. GENEPOP (Version 1.2): population genetic software for exact tests and ecumenicism. Journal of Heredity, 86(3): 248–249. doi: 10.1093/oxfordjournals.jhered.a111573 [30] Rice W R. 1989. Analyzing tables of statistical tests. Evolution, 43(1): 223–225. doi: 10.1111/j.1558-5646.1989.tb04220.x [31] Sekino M, Hara M, Taniguchi N. 2002. Loss of microsatellite and mitochondrial DNA variation in hatchery strains of Japanese flounder Paralichthys olivaceus. Aquaculture, 213(1–4): 101–122. doi: 10.1016/S0044-8486(01)00885-7 [32] Sekino M, Saitoh K, Yamada T, et al. 2005. Genetic tagging of released Japanese flounder (Paralichthys olivaceus) based on polymorphic DNA markers. Aquaculture, 244(1-4): 49–61. doi: 10.1016/j.aquaculture.2004.11.006 [33] Smith P J, Conroy A M. 1992. Loss of genetic variation in hatchery-produced abalone, Haliotis iris. New Zealand Journal of Marine and Freshwater Research, 26(1): 81–85. doi: 10.1080/00288330.1992.9516503 [34] Støttrup J G, Sparrevohn C R, Modin J, et al. 2002. The use of releases of reared fish to enhance natural populations: a case study on turbot Psetta maxima (Linné, 1758). Fisheries Research, 59(1–2): 161–180. doi: 10.1016/S0165-7836(01)00413-1 [35] Taniguchi N, Sumantadinata K, Iyama S. 1983. Genetic change in the first and second generations of hatchery stock of black seabream. Aquaculture, 35: 309–320. doi: 10.1016/0044-8486(83)90103-5 [36] Van Oosterhout C, Hutchinson W F, Wills D P M, et al. 2004. MICRO-CHECKER: software for identifying and correcting genotyping errors in microsatellite data. Molecular Ecology Notes, 4(3): 535–538. doi: 10.1111/j.1471-8286.2004.00684.x [37] Waples R S. 1999. Dispelling some myths about hatcheries. Fisheries, 24(2): 12–21. doi: 10.1577/1548-8446(1999)024<0012:DSMAH>2.0.CO;2 [38] Zhong Xiaming, Ni Jindi, Tang Jianhua, et al. 1998. Artificial reproduction and stock enhancement of Acanthopagrus schlegelii. Journal of Aquaculture (in Chinese), (5): 28–29 -


 点击查看大图
计量
- 文章访问数: 326
- HTML全文浏览量: 111
- PDF下载量: 18
- 被引次数: 0

