

Geochemical characteristics and genesis of the elements in ferromanganese nodules from the Northwest Pacific
-
Abstract: To explore the geochemical characteristics and genesis of the elements in ferromanganese nodules from the Northwest Pacific, this study analyses the mineral composition, elemental content, occurrence phase and genetic mechanisms of samples by X-ray diffraction (XRD), inductively coupled plasma‒optical emission spectrometry (ICP-OES), inductively coupled plasma‒mass spectrometry (ICP-MS) and phase analysis methods. The results show that ferromanganese nodules are mainly hydrogenetic, and Mn/Fe ratio ranges from 0.95 to 2.05. The major minerals are vernadite (δ-MnO2) and amorphous ferric oxyhydroxide (FeOOH), and the secondary minerals include todorokite, birnessite, quartz and plagioclase. Ferromanganese nodules contain high contents of Co (0.24%~0.42%), Cu (0.23%~0.73%), Ni (0.33%~0.86%) and rare earth elements (REEs,
1192 µg/g~1990 µg/g), which have positive Ce and negative Y anomalies but no Eu anomaly. A cluster analysis suggests that the elements in ferromanganese nodules can be divided into three groups: hydrogenetic components, including Fe, Ti, Zr, P, Pb, Co, Ba, Sr, V and REEs; diagenetic components, including Mn, Ni, Mg, Zn and Cu; and detrital components, including Al, Na, K and Ca. According to chemical leaching, ferromanganese nodules can be divided into four phases: Na, Ca, Mg and Sr are mainly enriched in the carbonate phase; Mn, Co, Ni and Ba are mainly enriched in the Mn-oxide phase; Fe, P, Ti, Cu, Pb, V, Zn, Zr and REEs are mainly enriched in the Fe-oxide phase; and Al and K are mainly enriched in the residual phase. A combination of the two different methods reveal selective enrichment of metal elements from seawater by ferromanganese nodules, featuring multisource mineralization. Moreover, through ion exchange and adsorption, approximately 71.2% of REEs are enriched in the Fe-oxide phase, 15.4% in the Mn-oxide phase and 12.4% in the residual phase, while REE contents in the carbonate phase are relatively low. In addition, under the oxic conditions of seawater, the oxidation of soluble Ce3+ to insoluble CeO2 together with Fe-Mn minerals results in Ce enrichment in ferromanganese nodules. This study provides a reference for the metallogenesis of ferromanganese nodules from the Northwest Pacific.-
Key words:
- Northwest Pacific /
- ferromanganese nodules /
- REEs /
- occurrence phase /
- genesis
-
1. Introduction
Ferromanganese nodules are marine authigenic sedimentary minerals that are mainly distributed in deep-sea basins with water depths of
4000 ~6500 m (Hein et al., 2013, 2020; Hein and Koschinsky, 2014; Kuhn et al., 2017; Yang et al., 2024). Ferromanganese nodules are mainly composed of Fe and Mn oxides, with the cores including biological shells, fish teeth and volcanic debris, etc., and also contain trace metals with important economic values, such as Co, Ni, Cu and rare earth elements (REEs) (Nakamura et al., 2024; Shen et al., 2024; Zhong et al., 2021; Zhang et al., 2023). According to the material source and growth environment, ferromanganese nodules can be divided into three types: hydrogenetic, hydrothermal and diagenetic (Halbach et al., 1981; Bau et al., 2014; Josso et al., 2017). The first two are mainly formed by the precipitation of metal elements in the bottom seawater, while the latter is mainly formed by the migration of metal elements in the pore water of the sediment. Some of the hydrogenetic nodules have diagenetic microlayers, and diagenetic nodules also have hydrogenetic microlayers (Cheng et al., 2023a; Wu et al., 2023; Heller et al., 2018). The microlaminae of ferromanganese nodules differ between hydrogenetic and diagenetic nodules, which reflects the changes in redox environment of the bottom water (Hein et al., 2013; Wegorzewski and Kuhn, 2014; Guan et al., 2019). Usually, hydrogenetic nodules are formed on the oxic surface of sediments with a low Mn/Fe ratio (Mn/Fe<2.5) and vernadite (δ-MnO2) and amorphous ferric oxyhydroxide (FeOOH) as the major minerals. Diagenetic nodules are formed in suboxic sediments with a high Mn/Fe ratio (Mn/Fe>5) and 10 Å manganate minerals (todorokite, busselite, etc.) or 7 Å manganate minerals (birnessite, etc.) as the major minerals. There are also mixed types of hydrogenetic and diagenetic nodules (2.5<Mn/Fe<5) (Kuhn et al., 2017; Reykhard and Shulga, 2019; Hein et al., 2020). Moreover, the contents of Mn, Fe, Co, Ni, Cu and REEs in different types of ferromanganese nodules are also obviously different (Guan et al., 2017; Menendez, et al., 2019; Cheng et al., 2023b; Ren et al., 2023). For example, hydrogenetic nodules from the Northwest Pacific and Cook Islands Exclusive Economic Zone (EEZ) are rich in Fe, Co and Ce and poor in Ni and Cu (Hein et al., 2012, 2015; Deng et al., 2022; Ren et al., 2022; Luo et al., 2023); Diagenetic nodules from the Clarion-Clipperton Zone (CCZ) in the Northeast Pacific and Central Indian Ocean Basin (CIOB) are rich in Mn, Cu and Ni and poor in Co and Ce (Hein and Koschinsky, 2014; Cao et al., 2017; Fu and Wen, 2020; Li et al., 2020; Ren et al., 2021); Hydrothermal nodules from the Peru Basin in the southeast Pacific are rich in Mn and Fe but poor in Co and REEs (Chen and Owen, 1989; Wu et al., 2023; Knaack et al., 2023).Different types of nodules are different in source and enrichment mechanisms of metal elements in different mineral phases (Li et al., 2009; Zhong et al., 2017b). Therefore, it is necessary to analyse the occurrence phase of ferromanganese nodules to effectively reveal their elemental sources and genetic mechanisms. Usually, elements occur in the adsorbate state, carbonate phase, Mn-oxide phase, Fe-oxyhydroxide phase and residual phase (Koschinsky and Halbach, 1995; Koschinsky and Hein, 2003; Khanchuk et al., 2015; Mikhailik et al., 2017; Surya et al., 2020). More specifically, alkali and alkaline earth metals are enriched in the adsorbate and carbonate phases, and REEs are mainly present in Mn oxide (δ-MnO2) and amorphous Fe oxyhydroxide (FeOOH) (Bau and Koschinsky, 2009; Jiang et al., 2011; Mohwinkel et al., 2014; Liang et al., 2024). Based on chemical leaching, Bai et al. (2004) found that REEs of ferromanganese crusts from the Pacific were mainly present in the Fe-oxide phase, with only a small fraction in the Mn-oxide phase, which indicates that REE enrichment was controlled by the Fe-mineral phase (goethite or amorphous FeOOH). Ren et al. (2019) studied ferromanganese nodules from the South China Sea and western Pacific by laser ablation-inductively coupled plasma-mass spectrometry (LA-ICPMS) and chemical leaching methods, and their results showed that the partitioning of REEs in the Fe- and Mn-mineral phases varied among different areas and their enrichment was controlled by vernadite and amorphous FeOOH. Cheng et al. (2023b) proposed that REE contents of ferromanganese nodules were very low in Fe mineral phases of goethite and FeOOH and Mn mineral phases of todorokite and busselite, but were mainly enriched in hydrogenetic δ-MnO2 mineral phase.
Ferromanganese nodule in the Northwest Pacific Basin is hydrogenetic nodule. Compared with diagenetic and hydrothermal nodules, hydrogenetic nodule has higher Co and REE contents with important economic value (Hein et al., 2013, 2020; Ren et al., 2022, 2023). At present, there are few ferromanganese nodule investigation stations in this region, the research work is very limited, and the resource potential is unclear. Although previous studies have been carried out on the element content, mineral composition and genetic characteristics of ferromanganese nodules from the Northwest Pacific, the occurrence phase and enrichment mechanism of elements remain unclear. In this study, ferromanganese nodule samples from the Northwest Pacific Basin were chosen to investigate their mineral composition, elemental content, occurrence phase and genetic mechanisms. This study provides a reference for the metallogenesis of ferromanganese nodules from the Northwest Pacific.
2. Geological setting
The Magellan, Marcus-Wake and Marshall Seamounts are located in the Northwest Pacific. These seamounts are the oldest hot spots of intraplate magmatism, formed between 120 Ma and 90 Ma and drifted northwestward to their present location as the Pacific Plate expanded (Koppers et al., 2003; Müller et al., 2008; Ren et al., 2016). The research area is located in an intermontane basin near the Magellan Seamounts and Marcus-Wake Seamounts in the Northwest Pacific, with a water depth of
5000 ~6500 m (Deng et al., 2019). The Northwest Pacific Basin is an area with low primary production and low inputs of terrigenous materials. The sediments are mainly pelagic clay with a thickness of 0~40 m and a sedimentation rate of 0.8~1.0 mm/ka (Luo et al., 2023). In addition, the Lower Circumpolar Deep Water (LCDW) rich in oxygen and low in temperature and salinity, which flows through the study area, provides a suitable environment for the occurrence of ferromanganese nodules (Kawabe et al., 2003). Ferromanganese nodules found in the study area are located on the surface of pelagic clay sediments (Machida et al., 2016).3. Materials and methods
3.1 Sample collection and description
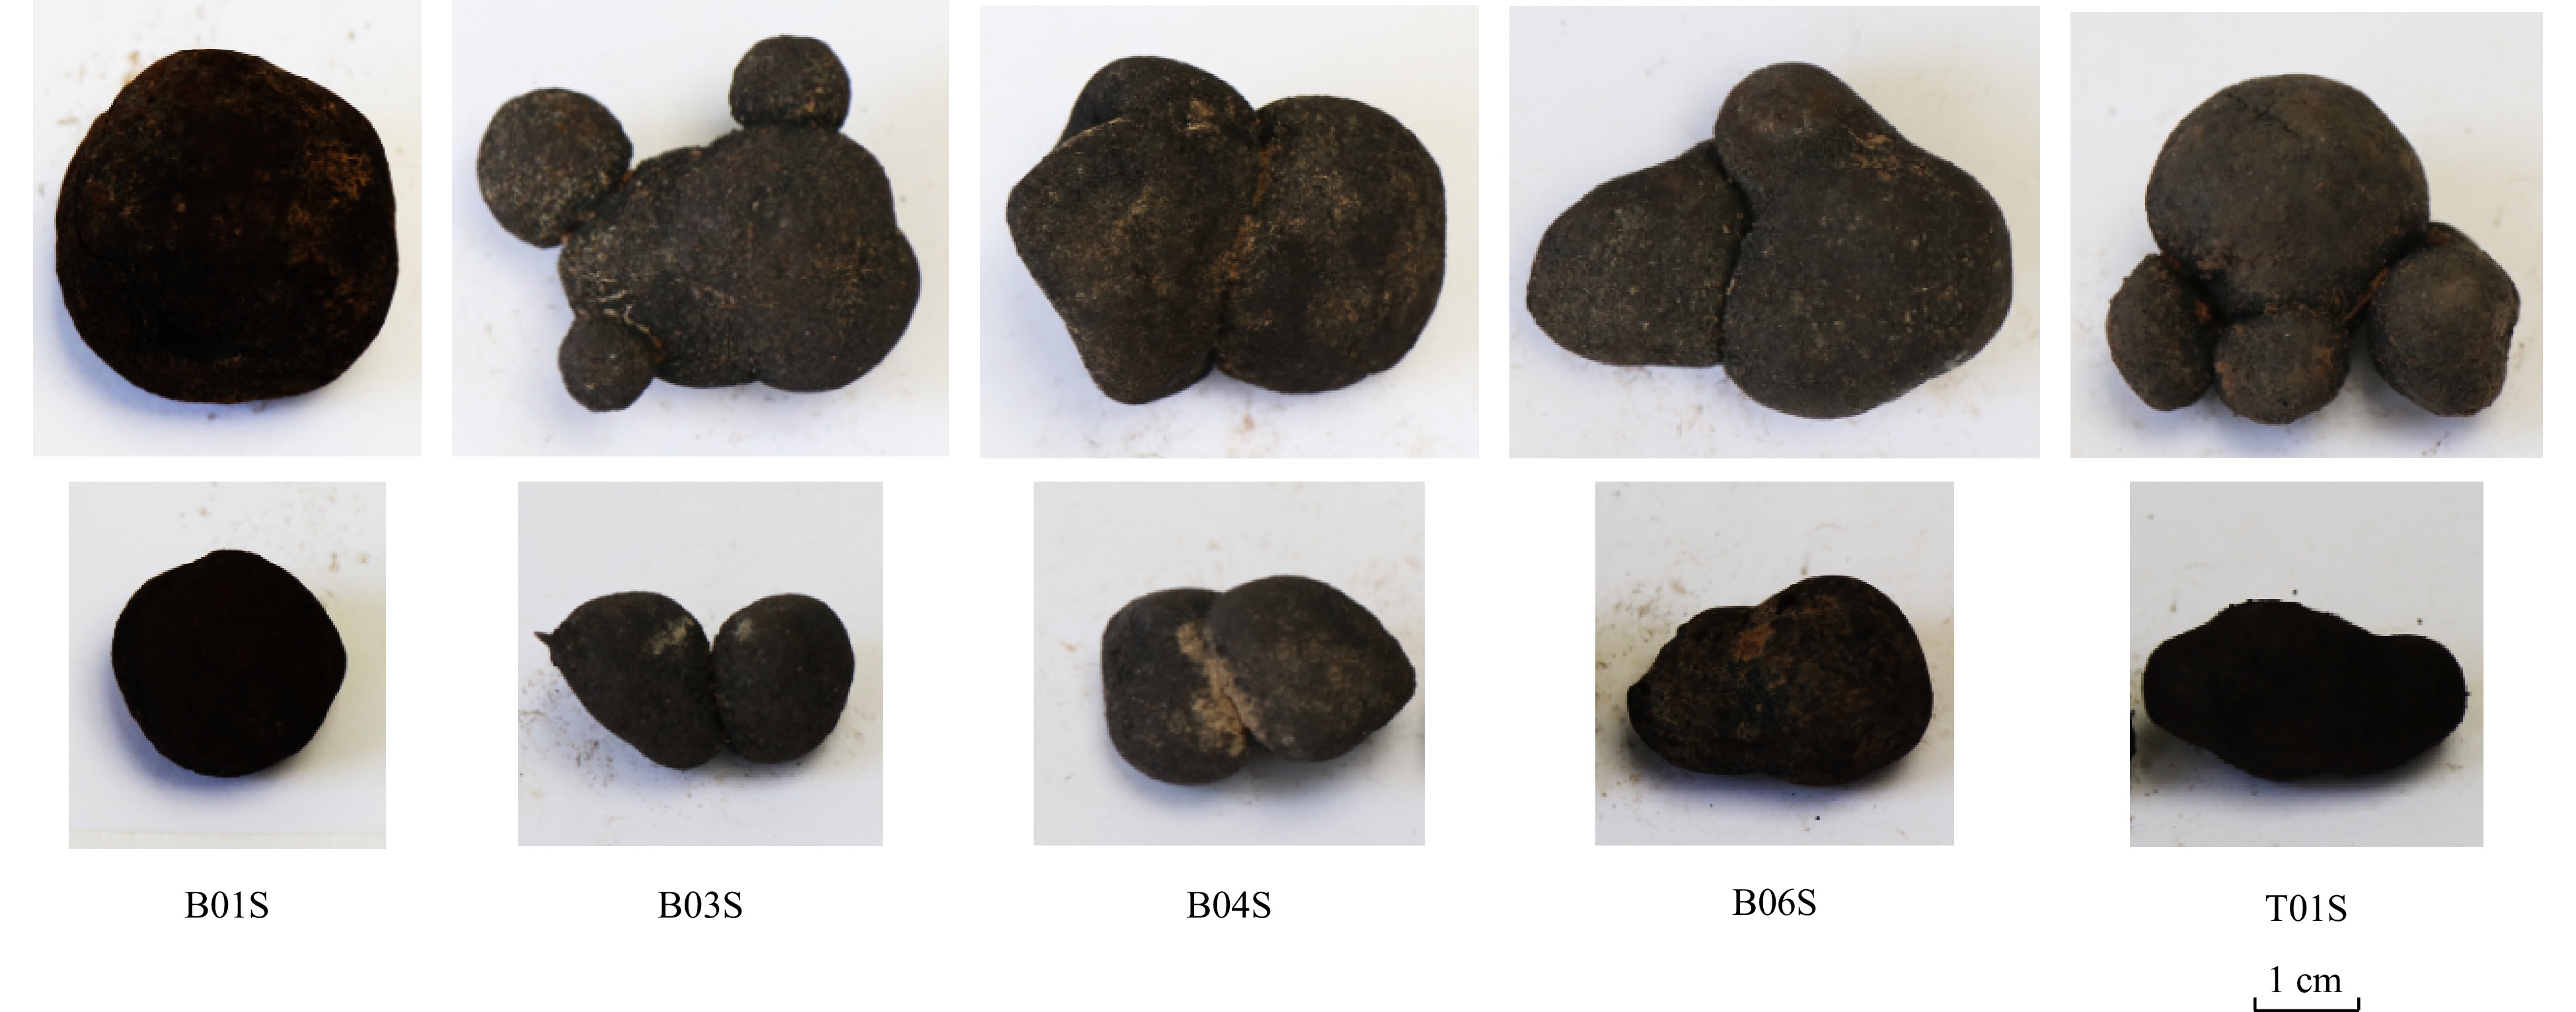
Ferromanganese nodule samples from the Northwest Pacific were collected during the Day 67-I expedition of Xiangyanghong 01. Samples were collected by dredging or boxing, and the sampling locations are shown in Fig. 1. Ferromanganese nodule samples were retrieved at 5 stations, namely, B01, B03, B04, B06 and T01. The samples were black, oolitic on the surface, and had no cores or biological traces on their surface. Sample B01 contains spherical nodules with diameters of 2×2 cm and 3×3 cm, and Samples B03, B04, B06 and T01 contain conjunctive nodules with diameters of 4×3 cm and 3×2 cm. Sample descriptions and photos are shown in Table 1 and Fig. 2, respectively. After drying, the samples were ground to 200 mesh by an agate mortar and then placed in a clean sample bag for later treatments.
 Figure 1. Location of ferromanganese nodule samples.Table 1. Description of ferromanganese nodule samples
Station Longitude/°E Latitude/°N Number Type Diameter/cm Water depth/m Sampling B01 153.695282 17.807557 B01M Middle spherical nodules 3×3 5694 boxing B01S Small spherical nodules 2×2 5694 boxing B03 155.464373 17.640543 B03M Middle conjunctive nodules 4×3 5698 boxing B03S Small conjunctive nodules 3×2 5698 boxing B04 159.093026 16.549205 B04M Middle conjunctive nodules 4×3 5790 boxing B04S Small conjunctive nodules 3×2 5790 boxing B06 161.702904 20.310552 B06M Middle conjunctive nodules 4×3 5140 boxing B06S Small conjunctive nodules 3×2 5140 boxing T01 155.492477 17.656095 T01M Middle conjunctive nodules 4×3 5689 dredging T01S Small conjunctive nodules 3×2 5689 dredging | Show Table DownLoad:
CSV
DownLoad:
CSV
 Figure 2. Photograph of the ferromanganese nodule samples.
3.2 Major and trace element analytical methods
50.00(±0.50) mg of samples were weighed into a sample liner. Then, 1 ml of nitric acid, hydrochloric acid and hydrofluoric acid, respectively, were added to the samples, which were then placed in a sealed steel sleeve and heated in an oven at 190°C for 48 h. After cooling, the samples were heated on an electric heating plate at 150°C to dryness. After addition of 3 ml of 30% (v/v) hydrochloric acid solution and 0.5 ml of 1 µg/g rhodium internal standard solution, the samples were then put in a sealed steel sleeve to heat once again in an oven at 150°C for 8 h. After cooling, 2% (v/v) nitric acid solution was added to a volume to 50 ml for measurement. Major elements were determined by ICP‒OES (Thermo Fisher, USA, iCAP7000), and REEs were determined by ICP-MS (Thermo Fisher, USA, iCAPRQ) at the Key Laboratory of Marine Geology and Metallogeny, First Institute of Oceanography, Ministry of Natural Resources. The standard materials GBW07295 and GBW07296 were used to check data quality of the analysis, with relative errors of the elements less than 5%, and the recoveries between 90% and 110%.
3.3 Chemical leaching method
According to the chemical leaching method proposed by Koschinsky et al. (Koschinsky and Halbach, 1995; Koschinsky and Hein, 2003), four phases of the samples were sequentially extracted at the Key Laboratory of Marine Geology and Metallogeny, First Institute of Oceanography, Ministry of Natural Resources. In brief, 1 g of samples was put in a 200 ml reaction bottle, mixed with the leaching reagent, and shaken at room temperature. The leaching solution was centrifuged for analysis. The residue was washed twice with Milli-Q water and then transferred to the next leaching step. The experimental steps were as follows. Leach 1 (L1): exchangeable ions and carbonate phase (referred to as the carbonate phase) was extracted with 30 ml of 1 mol/L acetic acid solution (pH=2.5); Leach 2 (L2): Mn oxide phase was extracted with 175 ml of 0.1 mol/L hydroxylamine hydrochloride solution (pH=3.7); Leach 3 (L3): Fe oxide phase was extracted with 175 ml of 0.2 mol/L ammonium oxalate solution (pH=3.5); Leach 4 (L4): major and trace elements in residual phase were analysed according to the methods in Method 3.2. During the experiment, the relative deviations were less than 5%. The acetic acid, hydroxylamine hydrochloride, oxalic acid and ammonium oxalate used in the experiment were all of superior purity; the nitric acid and hydrofluoric acid were all obtained by secondary azeotropic distillation; and the water was secondary deionized water.
3.4 Mineral identification method
The mineral identification of the samples was performed by XRD (Nippon Science Corporation, Japan, D/MAX2500HB+/PC) at the Key Laboratory of Marine Geology and Metallogeny, First Institute of Oceanography, Ministry of Natural Resources. The scanning range was 3~75°, the step size was 0.02°, the scanning speed was 2°/min, the voltage was 40 kV, the current was 80 mA, and a Cu rake was used. XRD data were obtained using Jade 6.0 software.
4. Results
4.1 Mineralogical characteristics
The XRD patterns of ferromanganese nodules from the Northwest Pacific are shown in Fig. 3. The major Mn minerals are vernadite (V, δ-MnO2) with small amounts of todorokite (T) and birnessite (B). Vernadite is a hydrogenic oxide formed under strongly oxic conditions (Hein et al., 2000; Wegorzewski and Kuhn, 2014; Guan et al., 2019), indicating that the ferromanganese nodules are mainly hydrogenetic. However, todorokite generally forms under suboxic conditions (Hein et al., 2013; Yin et al., 2019; Cheng et al., 2023b), indicating that the ferromanganese nodules are affected by early diagenesis to some extent. Moreover, no diffraction peak of crystalline Fe mineral is detected in ferromanganese nodule samples, combined with the chemical leaching results of extracted reactive Fe in the following text, it can be inferred that the ferromanganese nodules contain a large amount of amorphous ferric oxyhydroxide (FeOOH). In addition, ferromanganese nodules contain small amounts of detrital minerals, including quartz (Q) and plagioclase (Pl), indicating that the ferromanganese nodules are affected by terrigenous inputs (Cui et al., 2012; Ren et al., 2023).
 Figure 3. X-ray diffraction patterns of ferromanganese nodules V-Vernadite, T-todorokite, B-birnessite, Q-quartz, and Pl-plagioclase.
4.2 Major and trace element characteristics
The major and trace element contents of ferromanganese nodules from the Northwest Pacific are shown in Table 2. The results show that Mn and Fe have the highest contents among the major elements, with Mn ranging from 16.55% to 24.94% and Fe ranging from 12.19% to 17.40%. And then, Al, Ca, Mg, Na and Ti contents range from 0.64% to 3.67%. K, P, Co, Cu, Ni, Ba, Sr and Pb contents range from 0.07% to 0.86%. Finally, V, Zn and Zr contents range from 420 µg/g to 905 µg/g. Mn/Fe and Ca/P ratios range from 0.95 to 2.05 and from 5.60 to 9.59, respectively. According to the previous studies (Ren et al., 2016), Ca/P ratio of phosphatized crusts in the Pacific is less than 2, the ferromanganese nodules in the study area are not affected by phosphatization.
Table 2. Major and trace element contents of ferromanganese nodulesElement Unit Spherical nodules Conjunctive nodules B01M B01S Average B06M B06S B03M B03S T01M T01S B04M B04S Average Mn % 16.55 17.36 16.96 20.99 20.44 21.26 23.22 21.99 23.19 18.79 24.94 21.85 Fe % 17.40 16.78 17.09 15.37 15.14 13.49 12.35 14.19 13.01 12.29 12.19 13.50 Al % 2.91 3.37 3.14 2.45 2.58 2.68 2.64 2.83 2.96 3.67 2.86 2.83 Ca % 1.58 1.60 1.59 1.74 1.79 1.68 1.56 1.70 1.67 2.07 1.62 1.73 K % 0.66 0.67 0.66 0.74 0.75 0.67 0.69 0.72 0.73 0.81 0.78 0.74 Mg % 1.24 1.41 1.32 1.55 1.45 1.62 1.81 1.74 1.91 1.48 1.89 1.68 Na % 1.50 1.55 1.53 1.70 1.73 1.69 1.69 1.81 1.84 2.12 1.83 1.80 P % 0.28 0.29 0.28 0.28 0.27 0.26 0.22 0.26 0.24 0.22 0.22 0.25 Ti % 1.38 1.33 1.35 1.05 1.08 0.87 0.73 0.87 0.75 0.71 0.64 0.84 Co % 0.37 0.35 0.36 0.42 0.41 0.32 0.28 0.33 0.29 0.24 0.26 0.32 Cu % 0.23 0.30 0.27 0.32 0.30 0.47 0.59 0.55 0.59 0.53 0.73 0.51 Ni % 0.33 0.38 0.36 0.62 0.55 0.68 0.84 0.71 0.83 0.58 0.86 0.71 Ba % 0.12 0.12 0.12 0.14 0.14 0.12 0.11 0.12 0.12 0.10 0.10 0.12 Sr % 0.09 0.09 0.09 0.10 0.10 0.08 0.07 0.09 0.08 0.08 0.07 0.08 Pb % 0.12 0.11 0.11 0.10 0.10 0.10 0.10 0.09 0.09 0.09 0.08 0.10 V µg/g 498 458 478 529 530 473 456 494 480 432 474 483 Zn µg/g 505 553 529 654 599 697 844 697 820 624 905 730 Zr µg/g 681 657 669 639 637 524 463 508 473 465 420 516 Mn/Fe - 0.95 1.03 0.99 1.37 1.35 1.58 1.88 1.55 1.78 1.53 2.05 1.63 Ca/P - 5.68 5.60 5.64 6.13 6.59 6.42 7.00 6.50 6.84 9.59 7.23 7.04 La µg/g 201 170 186 203 193 179 156 156 140 139 143 164 Ce µg/g 1216 1017 1117 1154 1150 877 713 779 648 656 597 822 Pr µg/g 44.0 40.6 42.3 48.8 48.5 42.5 36.2 39.9 36.8 32.9 34.2 40.0 Nd µg/g 182 160 171 191 188 165 143 161 144 130 137 158 Sm µg/g 39.5 34.3 36.9 41.8 40.0 35.7 31.9 34.6 31.3 29.8 31.7 34.6 Eu µg/g 9.44 8.22 8.83 9.62 9.35 8.78 7.85 8.28 7.42 7.29 7.62 8.28 Gd µg/g 44.1 38.8 41.4 43.1 42.4 40.2 35.3 37.3 33.2 33.1 34.8 37.4 Tb µg/g 6.82 5.95 6.38 6.65 6.46 6.22 5.57 5.84 5.33 5.24 5.55 5.86 Dy µg/g 42.7 36.7 40.0 39.0 38.1 38.4 33.9 34.9 31.6 32.3 34.0 35.3 Ho µg/g 8.26 7.27 7.77 7.40 7.25 7.37 6.43 6.74 6.22 6.30 6.67 6.80 Er µg/g 23.3 21.3 22.3 21.2 21.2 20.9 18.5 19.5 17.7 17.7 18.9 19.4 Tm µg/g 3.45 3.06 3.25 3.01 2.92 3.06 2.68 2.81 2.50 2.52 2.78 2.79 Yb µg/g 24.0 21.2 22.6 21.1 19.9 20.9 18.2 19.5 17.3 17.4 19.2 19.2 Lu µg/g 3.53 3.26 3.40 3.16 3.02 3.17 2.73 2.88 2.58 2.64 2.84 2.88 Y µg/g 141 147 144 142 137 126 109 135 122 105 116 124 REEs µg/g 1990 1716 1853 1935 1907 1575 1320 1444 1246 1218 1192 1480 LREE µg/g 1693 1431 1562 1648 1629 1308 1088 1179 1007 995 950 1226 HREE µg/g 297 285 291 287 278 266 232 265 239 223 241 254 LREE/HREE – 5.69 5.03 5.36 5.75 5.86 4.91 4.69 4.45 4.22 4.47 3.94 4.78 Y/Ho – 17.1 20.2 18.7 19.2 18.9 17.1 16.9 20.1 19.7 16.8 17.4 18.3 δCe – 2.81 2.67 2.74 2.53 2.59 2.19 2.06 2.15 1.97 2.11 1.86 2.18 δEu – 0.99 0.98 0.99 0.99 0.99 1.01 1.02 1.01 1.01 1.01 1.00 1.01 δY – 0.68 0.82 0.75 0.76 0.75 0.68 0.67 0.80 0.79 0.67 0.70 0.73 Note: LREEs=La+Ce+Pr+Nd+Sm+Eu, HREEs=Gd+Tb+Dy+Ho+Er+Tm+Yb+Lu+Y, δCe=2CeN/(LaN+PrN), δEu=2EuN/(SmN+GdN), δY=2YN/(DyN+HoN), and LaN, CeN, PrN, SmN, EuN, GdN, YN, DyN and HoN are normalized to North American shale (NASC). NASC data are from Wang et al. (1989). | Show TableDownLoad:
CSV
The ferromanganese nodules are enriched in REEs (Table 2), with their contents ranging from
1192 µg/g to 1990 µg/g. Among the REEs, Ce has the highest contents ranging from 597 µg/g to1216 µg/g, and accounting for approximately 50% of the total REEs. The contents of light rare earth element (LREE) and heavy rare earth element (HREE) range from 590 μg/g to1693 μg/g and from 223 μg/g to 297 μg/g, respectively, with LREE/HREE ratios ranging from 2.95 to 5.80, indicating that LREE contents are higher than those of HREEs. The δCe values (δCe=2CeN/(LaN+PrN), where CeN, LaN and PrN are contents normalized to the respective contents in the North American shale, NASC) range from 1.86 to 2.81 (δCe>1), suggesting a positive Ce anomaly. The δEu values (δEu=2EuN/(SmN+GdN), where EuN, SmN and GdN are contents normalized to the respective contents in the NASC) range from 0.98 to 1.02 (δEu≈1), suggesting no Eu anomaly. The δY values (δY=2YN/(DyN+HoN), where YN, DyN and HoN are contents normalized to the respective contents in the NASC) range from 0.67 to 0.82 (δY<1), suggesting a negative Y anomaly. The Y/Ho ratios range from 16.8 to 20.2. According to the previous studies (He et al., 2011), the Y/Ho ratio of non-phosphatized crusts in the Pacific ranges from 17 to 22, so ferromanganese nodules in the study area are not affected by phosphatization.In addition, the sizes with diameters of 2×2 cm, 3×3 cm, 3×2 cm and 4×3 cm have no obvious effect on the element contents, while the types of spherical nodules and conjunctive nodules have an effect on the element contents. For example, Fe and REE contents of spherical nodules are higher than those of conjunctive nodules, and Mn, Cu, Ni and Zn contents of conjunctive nodules are higher than those of spherical nodules. There are some differences in the element contents between spherical nodules and conjunctive nodules, which may be related to the differences of redox environment and material source.
The element contents of ferromanganese nodules in the study area are compared with those of other oceanic nodules, oceanic crust, continental crust and the Earth’s crust to characterize their relative enrichments. The element enrichment coefficients are shown in Fig. 4. The studied nodules are enriched in Fe, Ti, Co, Pb and REEs compared to the nodules in Clarion-Clipperton Zone (CCZ), Peru Basin and Central Indian Ocean Basins, enriched in Cu, Ni and Zn compared to the nodules in Cook Islands Exclusive Economic Zone (EEZ), South China Sea and Philippine Sea. Meanwhile, the studied nodules are enriched in Mn, Co, Cu, Ni, Pb, Zn and REEs in comparison with oceanic crust, continental crust and Earth’s crust.
 Figure 4. Element enrichment coefficients of ferromanganese nodules and other samples: Nodule data sources: CCZ, Peru Basin and Central Indian Ocean Basin (Hein et al., 2013), Cook Islands EEZ (Hein et al., 2015), South China Sea (Yin et al., 2019), Philippine Sea (Zhou et al., 2022), oceanic crust and continental crust (Li, 1984), Earth’s crust (Li, 1976).
5. Discussion
5.1 Origin of the ferromanganese nodules
At present, the genetic classification of ferromanganese nodules using elemental geochemical characteristics has been widely recognized. Halbach et al. (1981) proposed a triangle diagram based on Mn, Fe, Co and Ni+Cu to classify the origin types by analysing a large number of nodule and crust samples in the Pacific. Since it is difficult to distinguish diagenetic origin or hydrothermal origin from triangle diagrams, Bau et al. (2014) proposed the use of rare earth element indices (such as δCe, the Y/Ho ratio and Nd content) to classify the origin types by analysing nodule and crust samples from different sea areas around the world. Therefore, according to the Fe-(Co+Cu+Ni)×10-Mn ternary diagram proposed by Bonatti et al. (1972) and the (Cu+Ni)×15- (Zr+Y+Ce)×100- (Fe+Mn)/4 ternary diagram proposed by Josso et al. (2017), the origin of ferromanganese nodules can be distinguished. The results show that (Fig. 5) most of the sample points are located in the hydrogenetic zone, and a few are located in the transition zone between hydrogenetic and diagenetic processes, indicating that the ferromanganese nodules in the study area are mainly hydrogenetic and less affected by diagenesis. Moreover, according to the δCe-Nd and δCe-YN/HoN correlation diagram proposed by Bau et al. (2014), the origin of ferromanganese nodules can also be distinguished. The results show that (Fig. 6) the sample points are all located in the hydrogenetic zone (Nd>100 µg/g, δCe>1 and YN/HoN<1), indicating that the ferromanganese nodules in the study area are mainly hydrogenetic. Moreover, according to submarine photography, the ferromanganese nodules are located below the carbonate compensation depth (CCD) with a water depth greater than
5100 m, and combined with the oxygen-rich metallogenic conditions, low temperature and low sedimentation rate in the study area (Kawabe et al., 2003; Ren et al., 2022; Luo et al., 2023), the ferromanganese nodules are mainly hydrogenetic. Figure 5. Ternary diagram of ferromanganese nodules: a. Fe-(Co+Cu+Ni)×10-Mn; b. (Cu+Ni)×15-(Zr+Y+Ce)×100- (Fe+Mn)/4. Nodule data sources: CCZ (Reykhard and Shulga, 2019), Peru Basin (Hein et al., 2013), Central Indian Ocean Basin (Sensarma et al., 2021), Cook Islands EEZ (Hein et al., 2015), South China Sea (Zhong et al., 2017a), Philippine Sea (Zhou et al., 2022), non-phosphatized and phosphatized crusts (Gao et al., 2022).
 Figure 6. Elemental correlation diagram of ferromanganese nodules: a. δCe vs Nd, b. δCe vs YN/HoN. δCe=2CeN/(LaN+PrN), LaN, CeN, PrN, YN and HoN are normalized to the NASC. NASC data are from Wang et al. (1989). Nodule data sources: CCZ (Reykhard and Shulga, 2019), Peru Basin (Hein et al., 2013), Central Indian Ocean Basin (Sensarma et al., 2021), Cook Islands EEZ (Hein et al., 2015), South China Sea (Zhong et al., 2017a), Philippine Sea (Zhou et al., 2022), non-phosphatized and phosphatized crusts (Gao et al., 2022).
NASC-normalized REE distribution patterns of ferromanganese nodules from the Northwest Pacific are shown in Fig. 7. The results show that the nodules in the study area, as well as the nodules in the Cook Islands EEZ, South China Sea, Philippine Sea and the crusts in the Northwest Pacific, have positive Ce and negative Y anomalies. However, the nodules in the CCZ, Peru Basin and Central Indian Ocean Basin have weak or no Ce anomaly. Moreover, the REE pattern of the studied nodules shows a mirror relationship with that of seawater, indicating that the REEs of ferromanganese nodules are mainly from seawater (Ren et al., 2022, 2024).
 Figure 7. NASC-normalized REE distribution patterns of ferromanganese nodules: REE data of seawater are multiplied by 106. NASC and seawater data are from Wang et al. (1989), and the phosphate rock data are from this study. Nodule data sources: CCZ, Peru Basin and Central Indian Ocean Basin (Hein et al., 2013), Cook Islands EEZ (Hein et al., 2015), South China Sea (Yin et al., 2019), Philippine Sea (Zhou et al., 2022), non-phosphatized crusts (Gao et al., 2023), phosphatized crusts (Gao et al., 2022),
5.2 Elemental correlation of ferromanganese nodules
To reveal the material source of ferromanganese nodules from the Northwest Pacific, elemental correlation analysis are applied, and the correlation coefficient matrix is shown in Table 3. The results show that Mn is positively correlated with Mg, Cu, Ni and Zn but negatively with Fe, P, Al, Ti, Pb, Zr and REEs. Fe is positively correlated with P, Ti, Co, Ba, Sr, Pb, V, Zr and REEs but negatively with Na, K, Mg, Cu, Ni and Zn. Al is positively correlated with Ca, K and Na but negatively with Mn, Co, Ba, Sr and V. Therefore, Mn, Mg, Cu, Ni and Zn are mainly related to Mn mineral phases, Fe, P, Ti, Co, Ba, Sr, Pb, V, Zr and REEs are mainly related to Fe mineral phases, and Al, Ca, K and Na are mainly related to Al mineral phases. Mineral phases are the main factor controlling the difference of selective enrichment.
Table 3. Elemental correlation coefficient matrix of ferromanganese nodulesElement Mn Fe Ca P Al Na K Mg Ti Co Cu Ni Ba Sr Pb V Zn Zr REEs Mn 1 Fe –0.763* 1 Ca –0.186 –0.296 1 P –0.632* 0.930** –0.249 1 Al –0.448 –0.064 0.467 –0.200 1 Na 0.350 –0.755* 0.797** –0.708* 0.423 1 K 0.344 –0.567 0.734* –0.562 0.261 0.866** 1 Mg 0.947** –0.782** –0.202 –0.663* –0.236 0.390 0.276 1 Ti –0.813** 0.989** –0.286 0.904** –0.009 –0.767** –0.599 –0.827** 1 Co –0.393 0.789** –0.187 0.872** –0.539 –0.624 –0.357 –0.546 0.747* 1 Cu 0.826** –0.908** 0.025 –0.874** 0.082 0.611 0.453 0.891** –0.927** –0.827** 1 Ni 0.971** –0.867** –0.081 –0.745* –0.319 0.470 0.364 0.966** –0.903** –0.538 0.888** 1 Ba –0.235 0.670* –0.141 0.791** –0.585 –0.498 –0.247 –0.377 0.611 0.965** –0.709* –0.378 1 Sr –0.362 0.643* 0.127 0.770** –0.417 –0.332 –0.083 –0.516 0.600 0.936** –0.760* –0.484 0.950** 1 Pb –0.768** 0.791** –0.315 0.717* –0.081 –0.775** –0.778** –0.777** 0.848** 0.580 –0.838** –0.780** 0.396 0.395 1 V 0.021 0.484 –0.175 0.581 –0.745* –0.391 –0.082 –0.186 0.397 0.858** –0.484 –0.151 0.917** 0.827** 0.161 1 Zn 0.954** –0.820** –0.234 –0.756* –0.262 0.357 0.302 0.960** –0.845** –0.594 0.905** 0.964** –0.466 –0.599 –0.750* –0.228 1 Zr –0.757* 0.959** –0.163 0.927** –0.155 –0.700* –0.484 –0.828** 0.961** 0.878** –0.979** –0.857** 0.765** 0.779** 0.807** 0.563 –0.846** 1 REEs –0.622 0.886** –0.179 0.886** –0.382 –0.701* –0.459 –0.765** 0.876** 0.939** –0.939** –0.742* 0.833** 0.830** 0.768** 0.709* –0.759* 0.960** 1 Note: Elemental correlation coefficient is simple pearson (n=10). ** marked P=99%, * marked P=95%. | Show TableDownLoad:
CSV
To determine the material source of ferromanganese nodules, the principal component analysis is performed, and the results are shown in Table 4. According to the KMO and Bartlett sphericity tests, the elemental data meet the requirements of the principal component analysis. The results show that there are three main factors with eigenvalues greater than 1 and the cumulative variance contribution of the three main factors is 95.5%. In main factor F1, Fe, Ti, Zr, Pb and P have positive correlations and are of hydrogenetic origin, and Mn, Ni, Zn, Mg and Cu have negative correlations and are of diagenetic origin. In main factor F2, V, Ba, Sr, Co and REEs have positive correlations and are of hydrogenetic origin, and Al and Na have negative correlations and are of detrital origin. In main factor F3, Ca, K and Na have positive correlations and are of detrital origin.
Table 4. Principal component analysis of ferromanganese nodulesElement Main factor F1 F2 F3 Mn –0.995 0.0570 0.0170 Ni –0.984 –0.102 0.0800 Zn –0.967 –0.206 – 0.0530 Mg –0.958 –0.150 – 0.0200 Cu –0.850 –0.474 0.173 Ti 0.835 0.339 –0.398 Zr 0.790 0.541 –0.265 Fe 0.788 0.418 –0.381 Pb 0.762 0.138 –0.539 P 0.674 0.570 –0.338 V 0.0270 0.974 – 0.0750 Ba 0.287 0.935 –0.118 Sr 0.423 0.881 0.116 Co 0.444 0.867 –0.211 Al 0.424 –0.746 0.393 REEs 0.658 0.682 –0.270 Ca 0.192 – 0.0870 0.950 K –0.322 – 0.0290 0.895 Na –0.362 –0.323 0.865 Eigenvalue 8.86 5.71 3.57 Variance/% 46.6 30.1 18.8 Accumulative
variance/%46.6 76.7 95.5 | Show TableDownLoad:
CSV
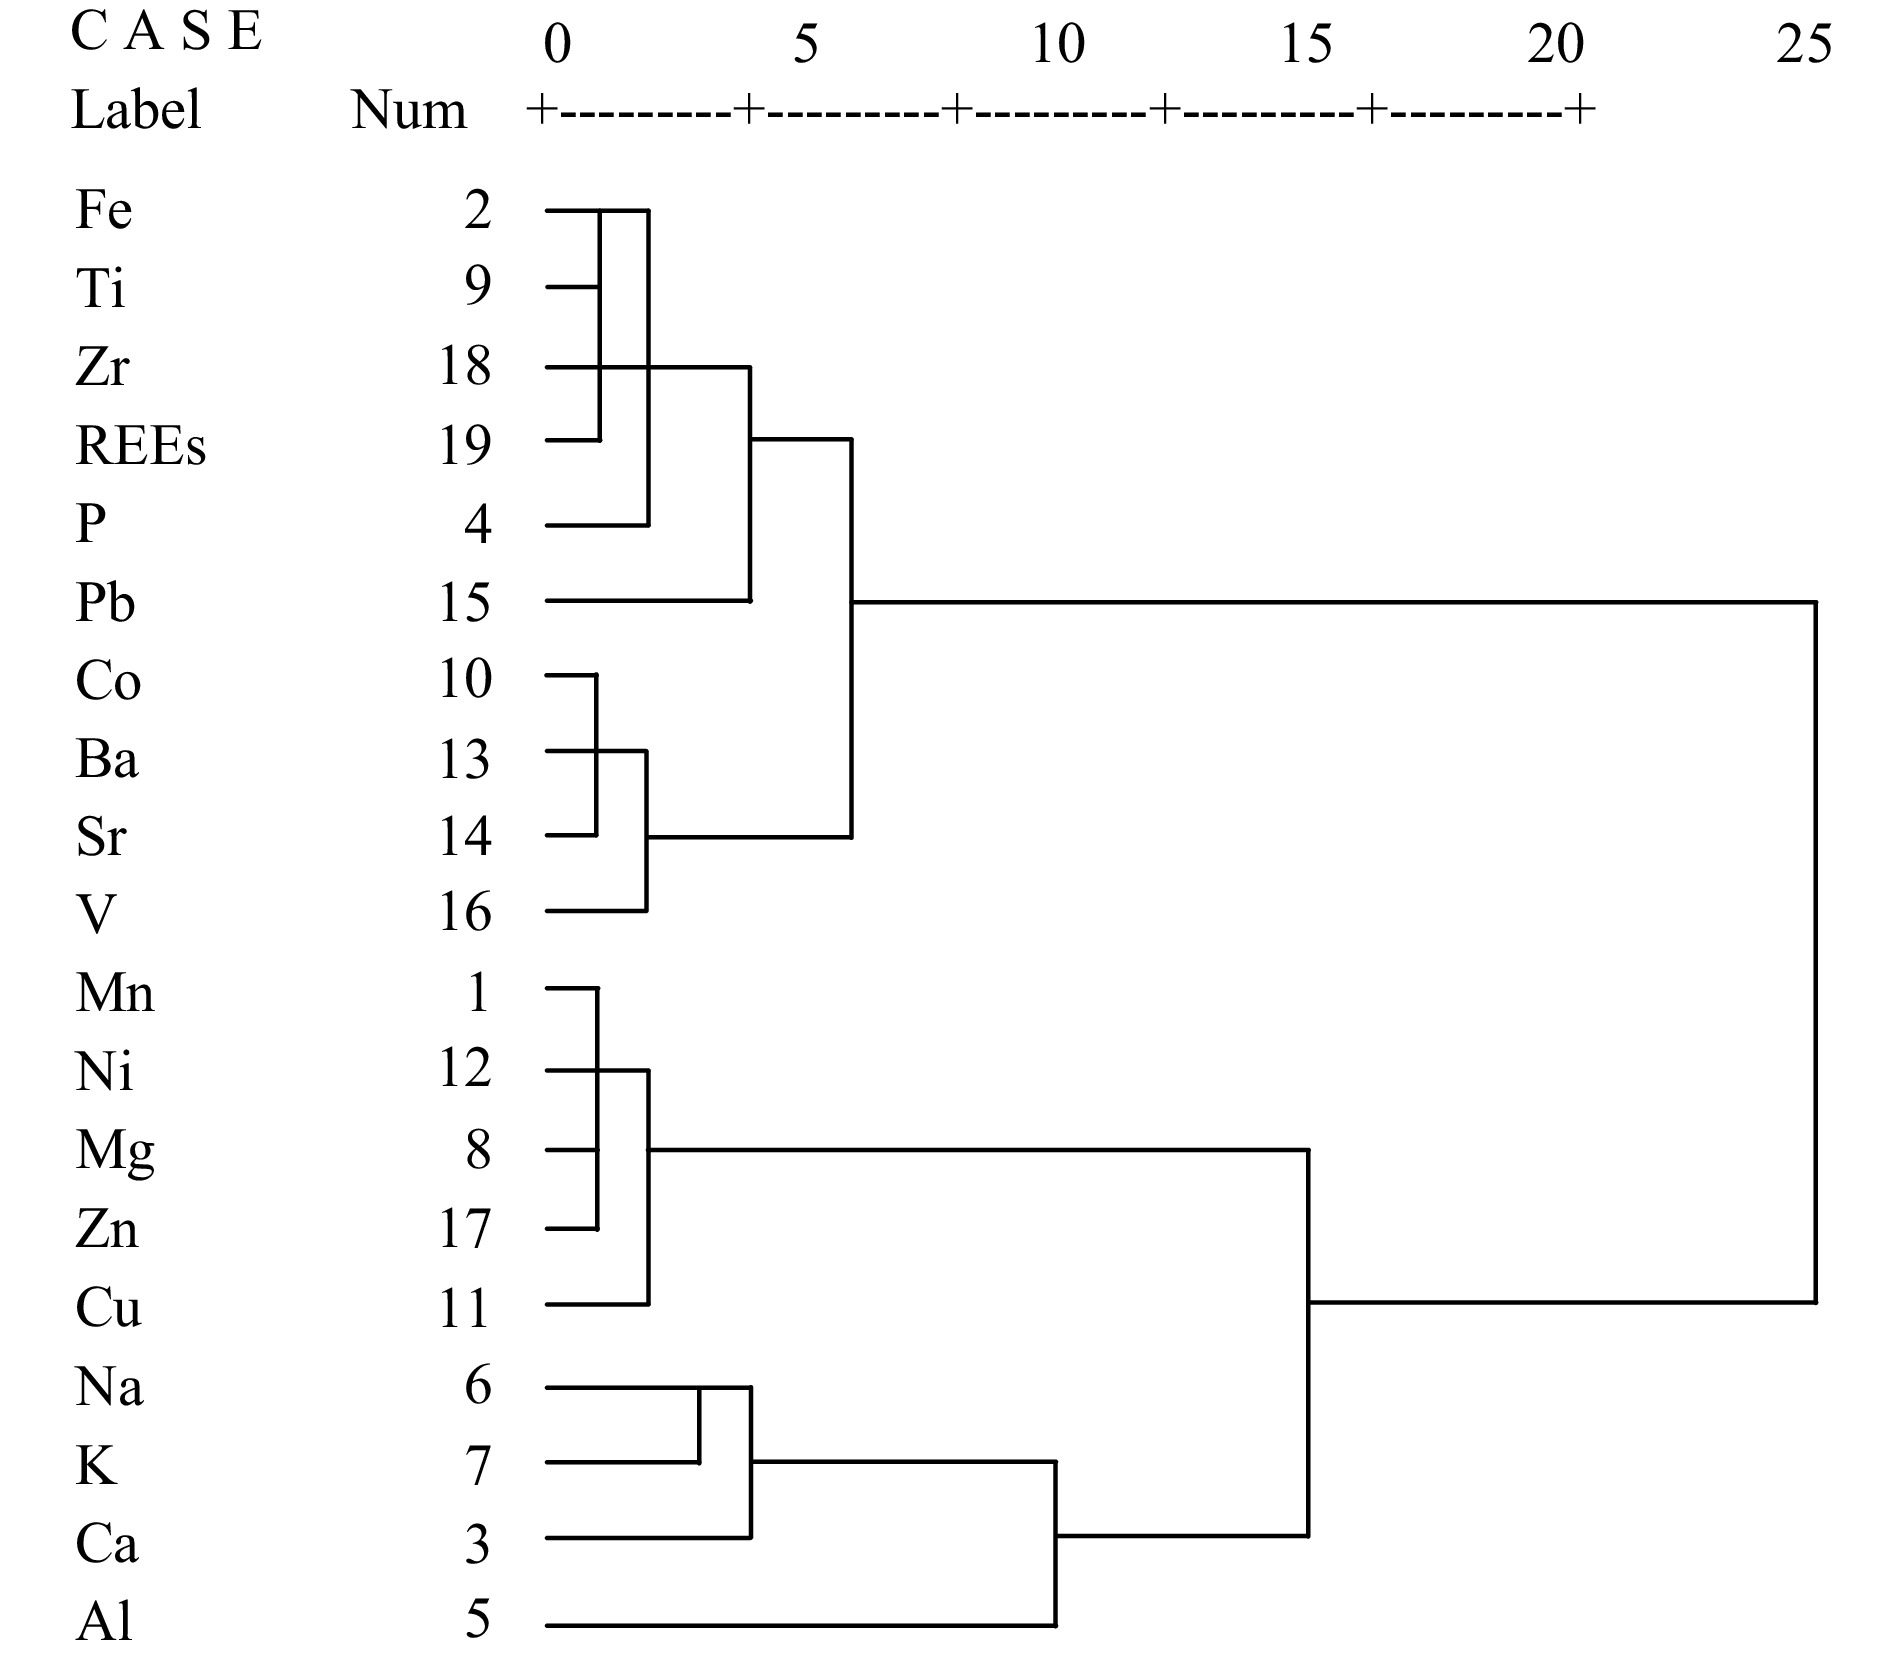
To further determine material source of the ferromanganese nodules, a cluster analysis of the elements is performed, and the cluster combination diagram is shown in Fig. 8. According to the mineral phases of ferromanganese nodules, the elements can be categorized into three groups at a distance of 15 related to Fe, Mn and Al mineral phases, respectively. In ferromanganese nodules, the elements of Fe, Ti, Zr, P, Pb, Co, Ba, Sr, V and REEs, which are related to Fe mineral phase, are of hydrogenetic source. The elements of Mn, Ni, Mg, Zn and Cu, which are related to Mn mineral phase, are of diagenetic source. The elements of Al, Na, K and Ca, which are related to Al mineral phase, are of detrital source. Therefore, the element sources of ferromanganese nodules can be divided into three types: hydrogenetic, diagenetic and detrital, which indicates that ferromanganese nodules have undergone a very complex mineralization process, showing the characteristics of multisource mineralization (Ren et al., 2022, 2024; Luo et al., 2023).
 Figure 8. Cluster combination diagram of the elements in ferromanganese nodules.
5.3 Occurrence phase of ferromanganese nodules
5.3.1 Elemental occurrence characteristics
Using the chemical leaching method, ferromanganese nodules can be divided into four phases: the adsorbed cation and carbonate phase (collectively called carbonate phase hereafter), Mn-oxide phase, Fe-oxide phase and residual phase. The results of elemental occurrence phases in ferromanganese nodules from the Northwest Pacific are shown in Table 5 and Fig. 9. Na, K, Ca, Mg and Sr are mainly enriched in the carbonate phase, with their percentages of 80.7%, 65.3%, 47.0% and 55.0%, respectively, but K is much less enriched. Mn, Co, Ni and Ba are mainly enriched in the Mn-oxide phase, with their percentages of 96.8%, 84.1%, 78.9% and 54.8%, respectively, but Ca, K, Mg, Cu, Sr, V, Zn and REEs are much less enriched. Fe, P, Ti, Cu, Pb, V, Zn, Zr and REEs are mainly enriched in the Fe-oxide phase, with their percentages of 84.6%, 93.6%, 84.9%, 66.0%, 97%, 68.4%, 51.8%, 93.0% and 71.2%, respectively, but Al, Co, Ni and Ba are much less enriched. Al and K are mainly enriched in the residual phase, with their percentages of 51.6% and 45.4%, respectively, but Fe, Ca, Mg, Na, Ti, Ba and REEs are much less enriched. Moreover, REE enrichment in the different phases follows the order of Fe-oxide phase > Mn-oxide phase > residual phase > carbonate phase. Approximately 71.2% of REEs are enriched in the Fe oxide phase, 15.4% in the Mn-oxide phase and 12.4% in the residual phase. REE contents in the carbonate phase are low, with a phase enrichment ratio of 1.01%. The phase results of ferromanganese nodules are basically consistent with those of ferromanganese crusts from the Northwest Pacific (Gao et al., 2023).
Table 5. Results of elemental occurrence phases in ferromanganese nodulesNumber Phase Mn
%Fe
%Al
%Ca
%K
%Mg
%Na
%P
%Ti
%Co
%Cu
µg/gNi
µg/gBa
µg/gSr
µg/gPb
µg/gV
µg/gZn
µg/gZr
µg/gREEs
µg/gB01M Carbonate phase 0.002 0.01 0.14 1.41 0.22 1.02 1.62 0.002 0.0002 0.0001 75.48 41.76 7.61 411 0.06 0.0001 32.68 0.16 12.77 Mn-Oxide phase 16.41 0.45 0.001 0.41 0.22 0.58 0.05 0.0001 0.001 0.29 255 2386 590 354 0.96 115 124 0.0001 290 Fe-Oxide phase 0.61 15.44 2.58 0.03 0.01 0.10 0.001 0.59 1.83 0.06 2089 1014 510 8.20 1155 358 335 657 1413 Residual phase 0.03 2.21 2.82 0.35 0.32 0.40 0.32 0.06 0.33 0.002 101 49.27 154 46.36 30.94 37.67 29.37 49.75 270 B01S Carbonate phase 0.01 0.01 0.24 1.45 0.23 1.13 1.65 0.002 0.0003 0.0001 141 86.15 8.19 463 0.03 0.14 51.64 0.11 15.36 Mn-Oxide phase 16.92 0.52 0.002 0.31 0.19 0.64 0.05 0.0001 0.001 0.28 532 2827 558 282 1.19 98.05 155 0.0001 236 Fe-Oxide phase 0.61 14.23 3.00 0.09 0.05 0.11 0.04 0.57 1.70 0.06 2224 814 443 30.48 855 311 305 533 1251 Residual phase 0.05 3.10 2.79 0.30 0.31 0.37 0.33 0.08 0.45 0.002 168 34.17 240 41.60 75.06 46.37 42.35 64.95 116 B06M Carbonate phase 0.002 0.004 0.09 1.40 0.23 1.16 1.65 0.001 0.0002 0.0001 106 75.91 9.50 465 0.02 0.08 51.37 0.0001 14.57 Mn-Oxide phase 18.64 0.62 0.0001 0.38 0.13 0.65 0.02 0.0001 0.0004 0.32 691 4480 828 292 1.71 122 223 0.0001 301 Fe-Oxide phase 0.61 12.51 1.60 0.01 0.02 0.06 0.01 0.54 1.32 0.04 2058 854 358 8.45 1105 323 283 503 1170 Residual phase 0.02 1.49 1.69 0.16 0.28 0.21 0.29 0.03 0.21 0.001 75.37 23.29 85.62 21.66 41.10 26.10 25.56 34.32 168 B06S Carbonate phase 0.002 0.01 0.10 1.46 0.22 1.16 1.65 0.001 0.0003 0.0001 117 93.89 8.52 481 0.02 0.0001 54.56 0.0001 15.42 Mn-Oxide phase 18.94 0.59 0.001 0.38 0.15 0.59 0.03 0.0001 0.0004 0.33 609 4071 821 318 4.52 119 198 0.0001 314 Fe-Oxide phase 0.66 13.23 1.60 0.02 0.02 0.05 0.01 0.55 1.46 0.05 2140 925 417 9.95 1142 356 289 547 1216 Residual phase 0.02 1.57 2.15 0.24 0.32 0.26 0.37 0.03 0.22 0.001 77.49 21.49 101 32.20 37.68 25.80 25.80 35.65 222 B03M Carbonate phase 0.003 0.01 0.12 1.41 0.17 1.12 1.65 0.002 0.0002 0.0001 139 79.6 4.97 399 0.06 0.0001 51.83 0.23 15.01 Mn-Oxide phase 20.52 0.52 0.0005 0.43 0.20 1.03 0.03 0.0002 0.001 0.25 1328 5221 745 296 1.36 127 243 0.0001 226 Fe-Oxide phase 0.72 13.14 2.21 0.01 0.0001 0.08 0.001 0.60 1.30 0.05 3471 1283 375 10.49 1187 339 374 522 1123 Residual phase 0.01 1.29 2.47 0.30 0.34 0.33 0.34 0.02 0.15 0.001 74.96 27.19 102 35.21 16.87 21.38 22.69 25.17 47.96 B03S Carbonate phase 0.004 0.005 0.13 1.30 0.14 1.15 1.77 0.002 0.0002 0.0001 132 78.79 3.24 357 0.06 0.0001 52.87 0.19 14.20 Mn-Oxide phase 22.25 0.46 0.0003 0.44 0.24 1.26 0.03 0.002 0.001 0.22 2069 6242 717 278 0.99 120 292 0.0001 172 Fe-Oxide phase 0.64 11.69 2.24 0.01 0.0001 0.09 0.002 0.50 1.03 0.05 3818 1636 323 8.58 1036 324 453 448 983 Residual phase 0.01 1.37 2.45 0.23 0.37 0.36 0.29 0.02 0.16 0.001 83.01 46.38 83.08 27.53 16.04 23.44 25.82 27.85 29.04 T01M Carbonate phase 0.004 0.01 0.15 1.43 0.22 1.22 1.83 0.002 0.0003 0.0001 226 97.90 7.43 446 0.02 0.0001 69.05 0.0001 16.67 Mn-Oxide phase 20.38 0.64 0.001 0.35 0.17 0.89 0.03 0.002 0.0004 0.26 1782 5316 655 252 1.25 118 247 0.0001 223 Fe-Oxide phase 0.59 12.21 2.14 0.02 0.02 0.07 0.01 0.53 1.17 0.03 3122 1004 418 10.03 895 316 308 427 1062 Residual phase 0.01 1.26 2.00 0.25 0.28 0.26 0.29 0.02 0.16 0.001 87.54 35.72 88.19 27.61 13.05 19.63 22.23 23.30 27.09 T01S Carbonate phase 0.004 0.004 0.13 1.25 0.18 1.19 1.80 0.002 0.0002 0.0001 155 80.28 4.91 375 0.01 0.0001 55.15 0.04 13.18 Mn-Oxide phase 20.71 0.61 0.0004 0.37 0.18 1.08 0.02 0.003 0.0004 0.22 2180 6139 702 239 1.49 124 303 0.0001 198 Fe-Oxide phase 0.55 10.55 2.13 0.02 0.01 0.07 0.01 0.48 0.94 0.03 2997 1054 315 8.15 807 281 345 383 871 Residual phase 0.01 1.27 2.26 0.25 0.32 0.31 0.30 0.02 0.16 0.001 96.06 57.14 69.34 28.25 12.31 20.66 24.72 24.48 25.06 B04M Carbonate phase 0.01 0.004 0.13 1.18 0.16 0.96 1.67 0.002 0.0002 0.0001 198 88.95 3.45 335 0.03 0.0001 61.14 0.17 14.87 Mn-Oxide phase 17.68 0.71 0.001 0.31 0.23 0.86 0.04 0.001 0.0005 0.20 1844 4634 434 221 1.72 130 253 0.04 231 Fe-Oxide phase 0.58 10.44 1.87 0.02 0.01 0.07 0.001 0.45 0.94 0.03 3151 818 408 10.27 884 270 256 421 829 Residual phase 0.02 1.96 3.58 1.16 0.49 0.41 0.96 0.04 0.21 0.002 178 63.38 184 127 24.64 30.16 32.76 45.93 26.61 B04S Carbonate phase 0.005 0.01 0.16 1.36 0.14 1.11 1.78 0.002 0.0002 0.0001 172 96.28 2.46 337 0.05 0.0001 63.00 0.18 16.32 Mn-Oxide phase 23.31 0.51 0.0002 0.41 0.31 1.31 0.04 0.003 0.001 0.20 2962 6258 479 261 0.90 124 317 0.0001 145 Fe-Oxide phase 0.58 10.96 2.36 0.02 0.01 0.09 0.001 0.48 0.85 0.05 4245 1609 489 9.19 929 320 454 396 853 Residual phase 0.01 1.51 2.54 0.20 0.38 0.38 0.28 0.02 0.18 0.002 127 105 119 27.17 18.70 25.82 30.45 32.46 26.31 | Show TableDownLoad:
CSV
 Figure 9. Elemental occurrence phases of ferromanganese nodules.
The ferromanganese nodules in the study area are mainly hydrogenetic, and the elements come from seawater. Na, K, Ca, Mg and Sr in seawater mainly exist as free cations and enter carbonate minerals of ferromanganese nodules through ion exchange or adsorption (Byrne, 2002; Bai et al., 2004). According to the above phase analysis, almost all of the Mn (96.6%) is from the Mn-oxide phase, and most of the Fe (84.6%) is from the Fe-oxide phase. Marine Fe-Mn oxides are authigenic components that selectively enrich metals from seawater (Ren et al., 2022, 2024). The main Mn mineral is vernadite (δ-MnO2), which has negative surface charges; the main Fe mineral is amorphous ferric oxyhydroxide (FeOOH), which has low positive charges (Koschinsky and Halbach, 1995; Koschinsky and Hein, 2003). According to the colloidal adsorption theory, positively charged ions and complexes in seawater are adsorbed to δ-MnO2, and negatively charged or uncharged ions and complexes are adsorbed to FeOOH. Moreover, δ-MnO2 and FeOOH have large specific surface areas and strong adsorption capacities (Koschinsky and Hein, 2003; Zhong et al., 2017b). Mn, Co, Ni and Ba, which occur mainly as free cations, are selectively adsorbed to δ-MnO2; Fe, P, Ti, Cu, Pb, V, Zn, Zr and REEs, which occur mainly as anionic complexes, are selectively adsorbed to FeOOH. Meanwhile, the residual phase is mainly composed of silico-aluminate detrital minerals and clay minerals, and is derived mainly from terrigenous detrital materials, which is usually enriched in Al and K. In addition, based on the distributions of elements in seawater and at the water-sediment interface, Ren et al. (2024) propose a new two-stage model for nodule metallogenesis. Stage I is the initial enrichment of trace elements by the sinking of ferromanganese hydroxide colloids, which regulate the distributions of scavenged-type elements in the water column. Stage II is the top-down migration of trace elements dominated by bioparticle cycling, which promotes the re-enrichment of trace elements by ferromanganese hydroxides at the water-sediment interface. So the enrichment mechanism of elements in ferromanganese nodules needs to be further studied.
5.3.2 REE patterns of the occurrence phase
REEs have unique geochemical properties, and their contents, characteristic parameters and distribution patterns play important roles in revealing their source and growth environment. For example, δCe and δEu are important indicators of the redox environment, and the YN/HoN ratio is an important parameter for tracing mineralization (Zhong et al., 2017a, 2017b). The REE distribution patterns in the four occurrence phases of ferromanganese nodules are shown in Fig. 10. Although the REE contents of each sample are different, the REE patterns in the same phase are basically similar, and the characteristic parameters (such as δCe and δY) and variation trends are also relatively similar, indicating that the mineralization processes controlling REE enrichment in ferromanganese nodules were basically similar.
 Figure 10. REE patterns in the four occurrence phases of the ferromanganese nodules
The REE contents in carbonate phase range from 12.8 µg/g to 16.7 µg/g with a relatively low phase enrichment ratio of 1.01%. The water depth of ferromanganese nodules in this study area is more than
5100 m, below the carbonate compensation depth (CCD) of4400 m, where carbonate is almost completely dissolved (Xu et al., 2008). Therefore, the REE contents in carbonate phase are very low. In addition, δCe ranges from 0.03 to 0.06 (δCe<1), with a negative Ce anomaly, and δY ranges from 1.08 to 1.23 (δY>1), with a positive Y anomaly. These REE patterns are similar to those in seawater, indicating that the carbonates inherit the REE pattern of seawater and thus the REEs mainly come from seawater (Zhong et al., 2017b). The REE contents in Mn-oxide phase range from 145 µg/g to 314 µg/g with a phase enrichment ratio of 15.4%. δCe ranges from 1.33 to 1.94 (δCe>1), with a positive Ce anomaly, and δY ranges from 1.42 to 1.96 (δY>1), with a positive Y anomaly. Ferromanganese nodules in the study area are mainly hydrogenetic and form in an oxic environment (Koschinsky and Hein, 2003; Hein et al., 2020). As a result, soluble Ce3+ is oxidized to insoluble Ce4+ under the oxic conditions of seawater, leading to the formation of CeO2 precipitates together with Fe-Mn minerals, which results in approximately 14.8% of Ce to be enriched in the Mn-oxide phase and a positive Ce anomaly due to Ce fractionation from other REEs.The REE contents in Fe-oxide phase range from 829 µg/g to
1413 µg/g, with a relatively high percentage of 71.2%, indicating relatively high selective enrichment of REEs in the Fe-oxide phase. δCe ranges from 2.12 to 3.10 (δCe>1), with a positive Ce anomaly, and δY ranges from 0.46 to 0.67 (δY<1), with a negative Y anomaly. Under the oxic conditions of seawater (Koschinsky and Hein, 2003; Hein et al., 2020), soluble Ce3+ is oxidized to insoluble Ce4+, leading to the formation of CeO2 precipitate together with Fe-Mn minerals, which results in an enrichment of approximately 71.8% of Ce in the Fe-oxide phase and a positive Ce anomaly. Unlike Ce, Y cannot undergo redox reactions in ferromanganese nodules, and Y readily desorbs from ferric oxyhydroxide, leading to Y fractionatation from other REEs with a negative Y anomaly (Huang et al., 2021). The REE contents in residual phase range from 130 µg/g to 270 µg/g with a phase enrichment ratio of 12.4%. δCe ranges from 1.97 to 2.75 (δCe>1), with a positive Ce anomaly, and δY ranges from 0.57 to 0.83 (δY<1), with a negative Y anomaly. The REE patterns in residual phase are different from those in terrigenous sediments. The difference may be related to the differences of redox environment and material source (Zhong et al., 2017b), but further study is needed.6. Conclusions
The mineral compositions, geochemical characteristics, occurrence phases and genetic mechanisms of ferromanganese nodule samples from the Northwest Pacific are studied.
(1) The ferromanganese nodules are mainly hydrogenetic, with the major minerals being vernadite (δ-MnO2) and amorphous ferric oxyhydroxide (FeOOH), and the secondary minerals including todorokite, birnessite, quartz and plagioclase. Mn and Fe contents are greater than those of other elements, Co, Cu, Ni and REEs are enriched in ferromanganese nodules, and the REE distribution patterns show positive Ce and negative Y anomalies but no Eu anomaly.
(2) According to the cluster analysis method, the elements of ferromanganese nodules can be classified into three groups: hydrogenetic components, including Fe, Ti, Zr, P, Pb, Co, Ba, Sr, V and REEs; diagenetic components, including Mn, Ni, Mg, Zn and Cu; and detrital components, including Al, Na, K and Ca. Using the chemical leaching, ferromanganese nodules can be divided into four phases: carbonate phase enriched in Na, Ca, Mg and Sr; Mn-oxide phase enriched in Mn, Co, Ni and Ba; Fe-oxide phase enriched in Fe, P, Ti, Cu, Pb, V, Zn, Zr and REEs; and residual phase enriched in Al and K. Therefore, the difference between the two methods reflects the selective enrichment of metal elements by ferromanganese nodules from seawater, featuring multisource mineralization.
(3) Through ion exchange and adsorption, the REEs of ferromanganese nodules are mainly enriched in the Fe-oxide phase, which is followed by the Mn-oxide phase and residual phase. However, the REE contents in the carbonate phase are relatively low. Under the oxic seawater conditions, the oxidation of soluble Ce3+ to insoluble CeO2 together with Fe-Mn minerals is expected to result in Ce enrichment in ferromanganese nodules.
-
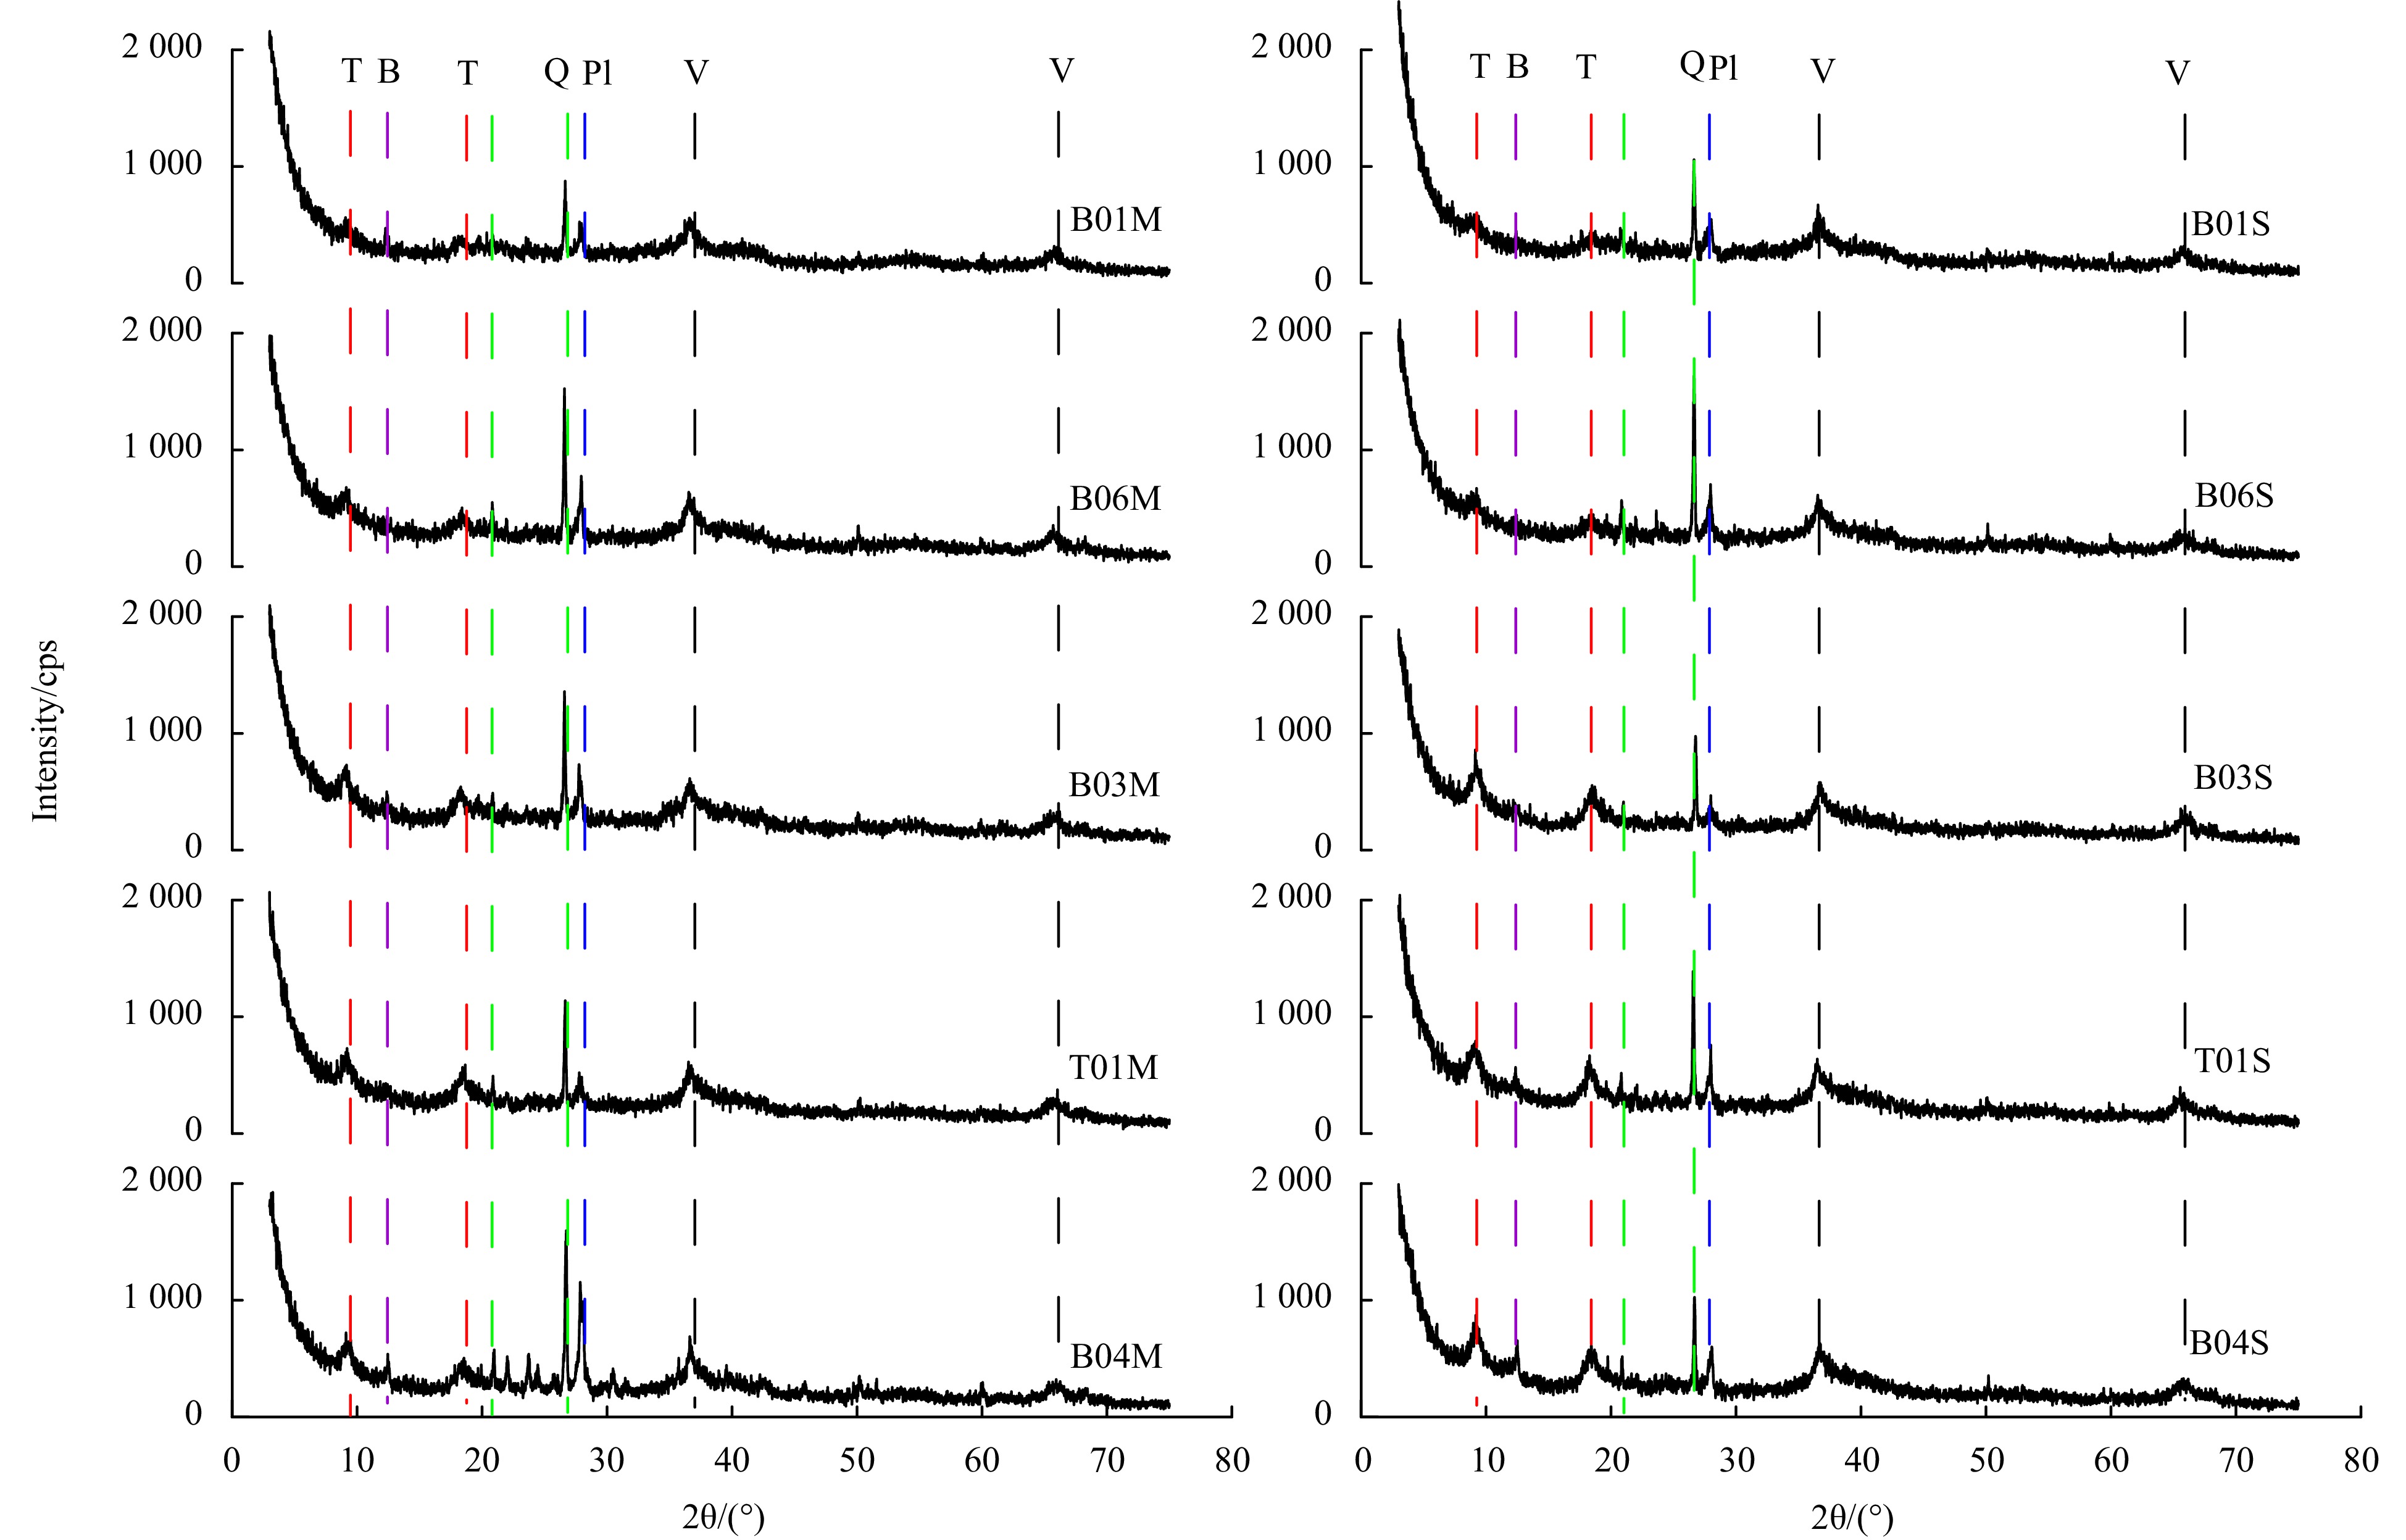
Figure 3. X-ray diffraction patterns of ferromanganese nodules V-Vernadite, T-todorokite, B-birnessite, Q-quartz, and Pl-plagioclase.
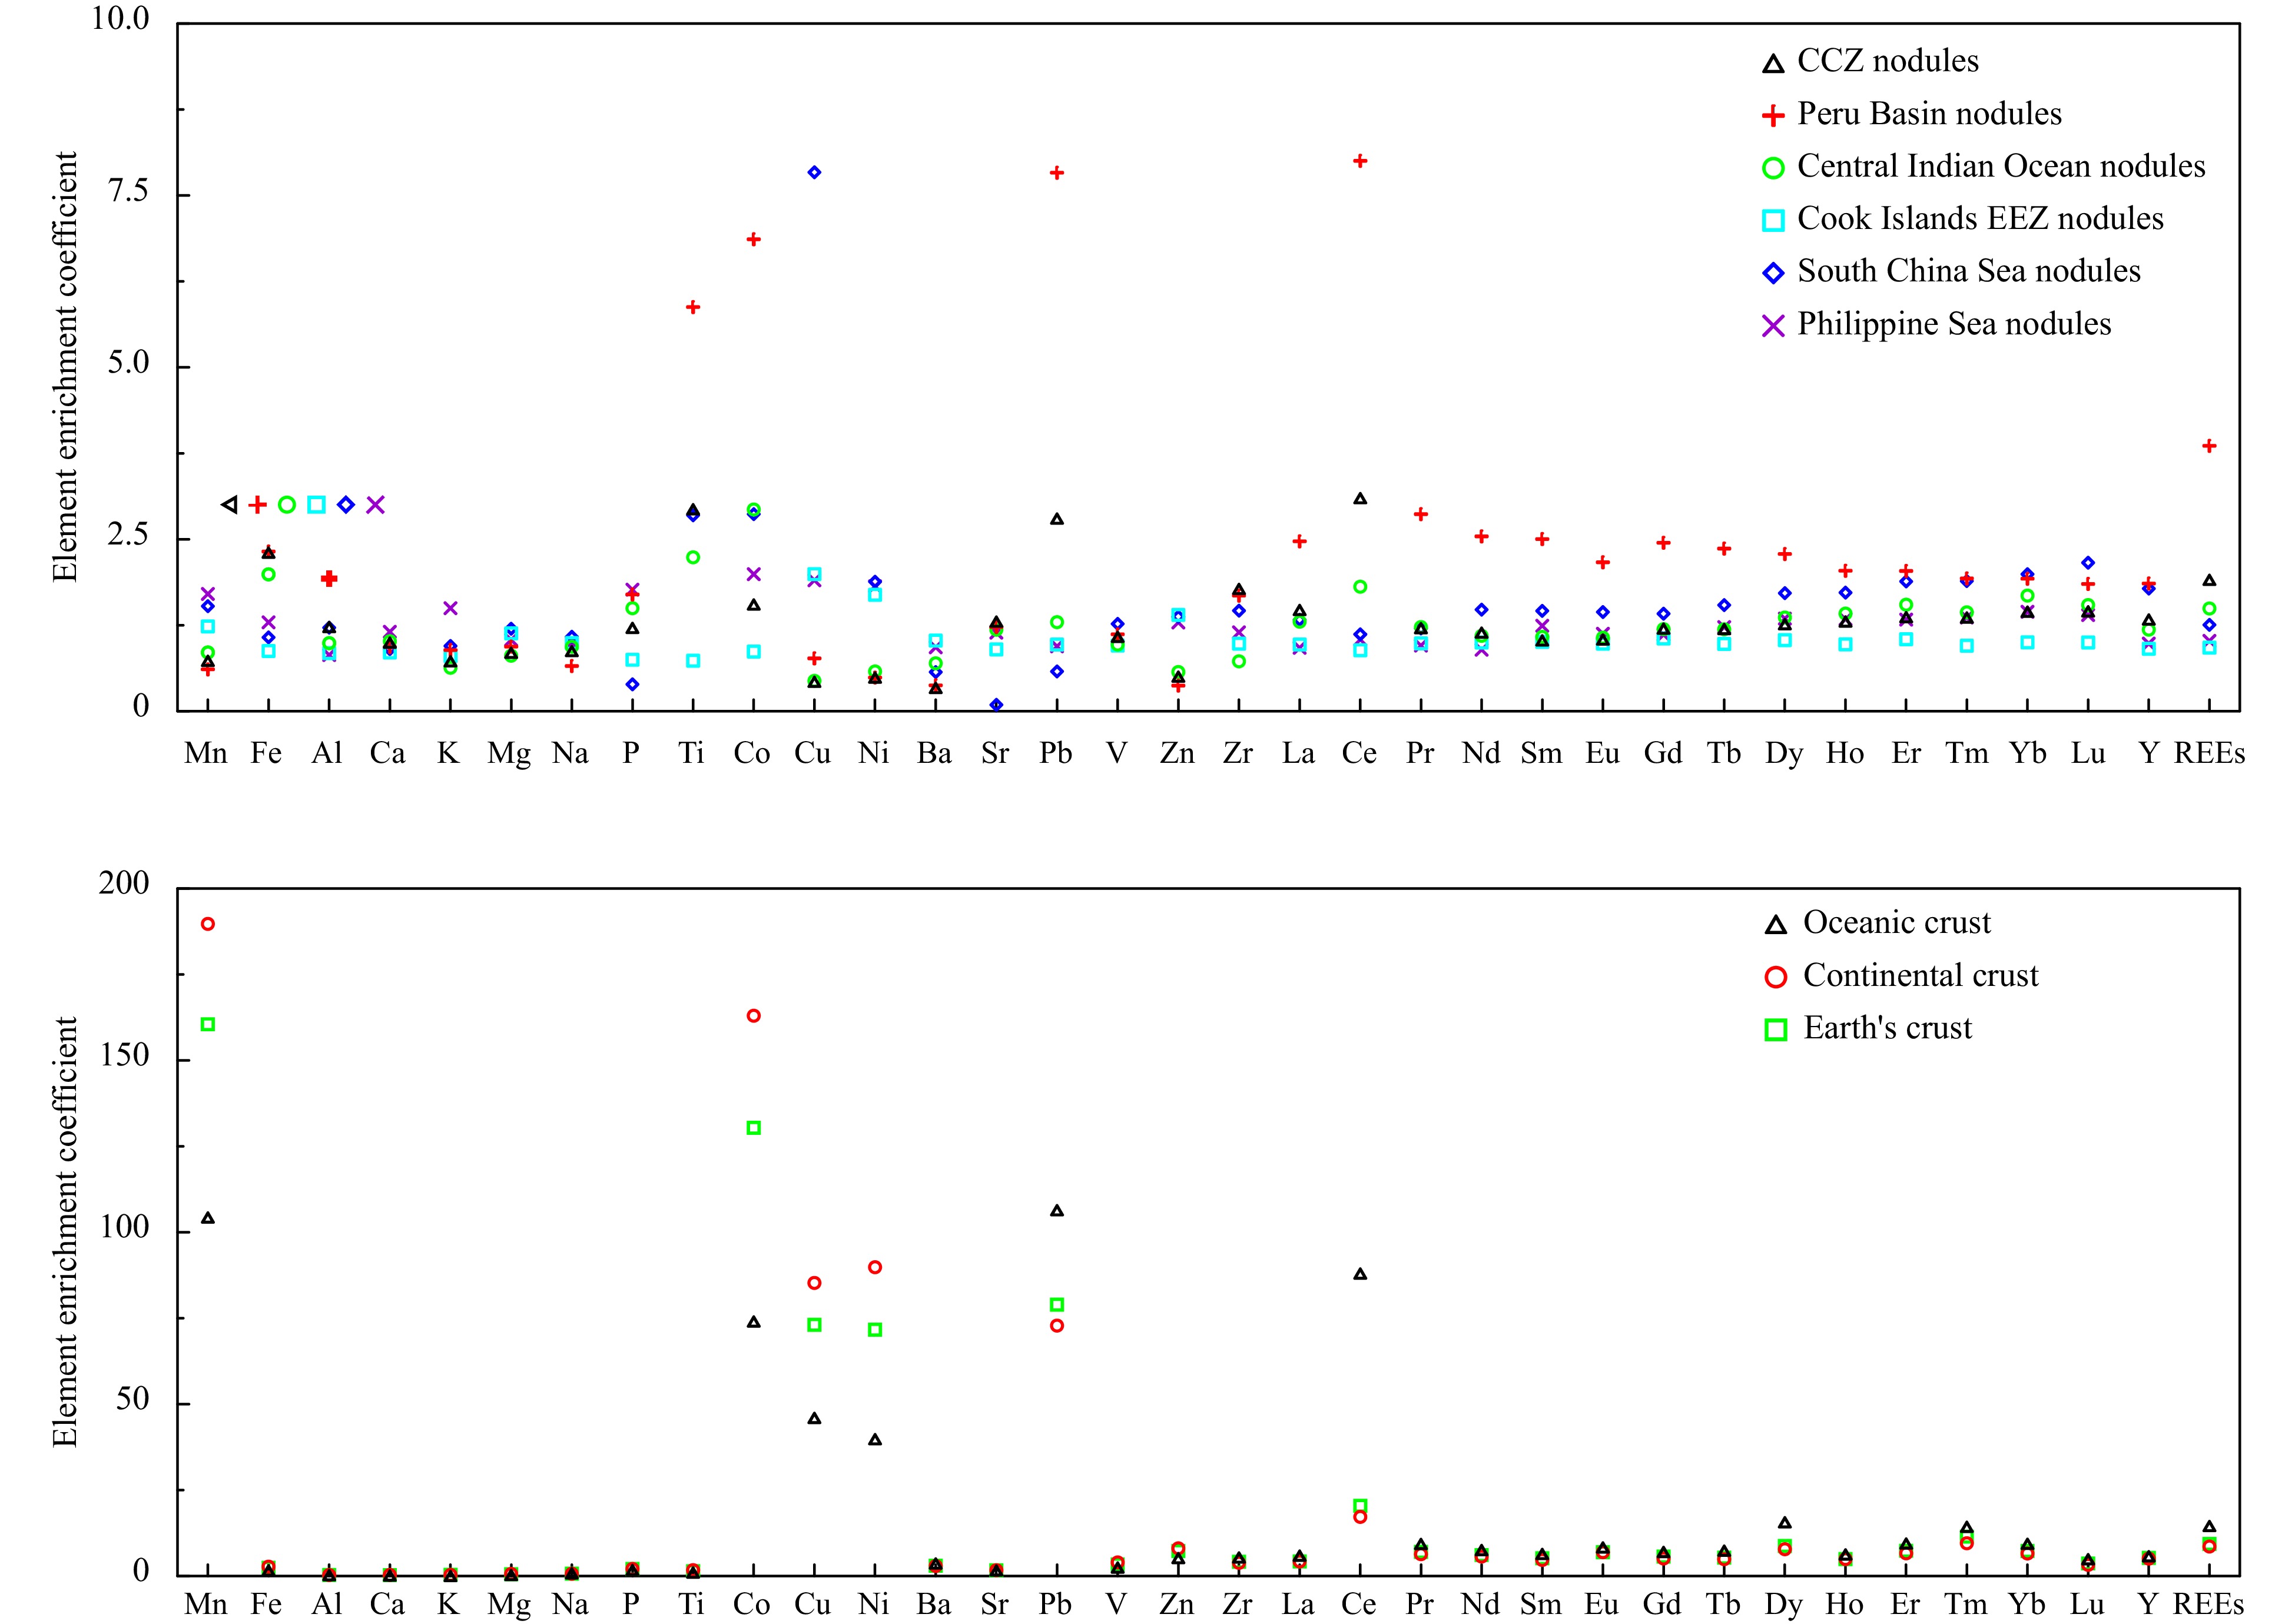
Figure 4. Element enrichment coefficients of ferromanganese nodules and other samples: Nodule data sources: CCZ, Peru Basin and Central Indian Ocean Basin (Hein et al., 2013), Cook Islands EEZ (Hein et al., 2015), South China Sea (Yin et al., 2019), Philippine Sea (Zhou et al., 2022), oceanic crust and continental crust (Li, 1984), Earth’s crust (Li, 1976).
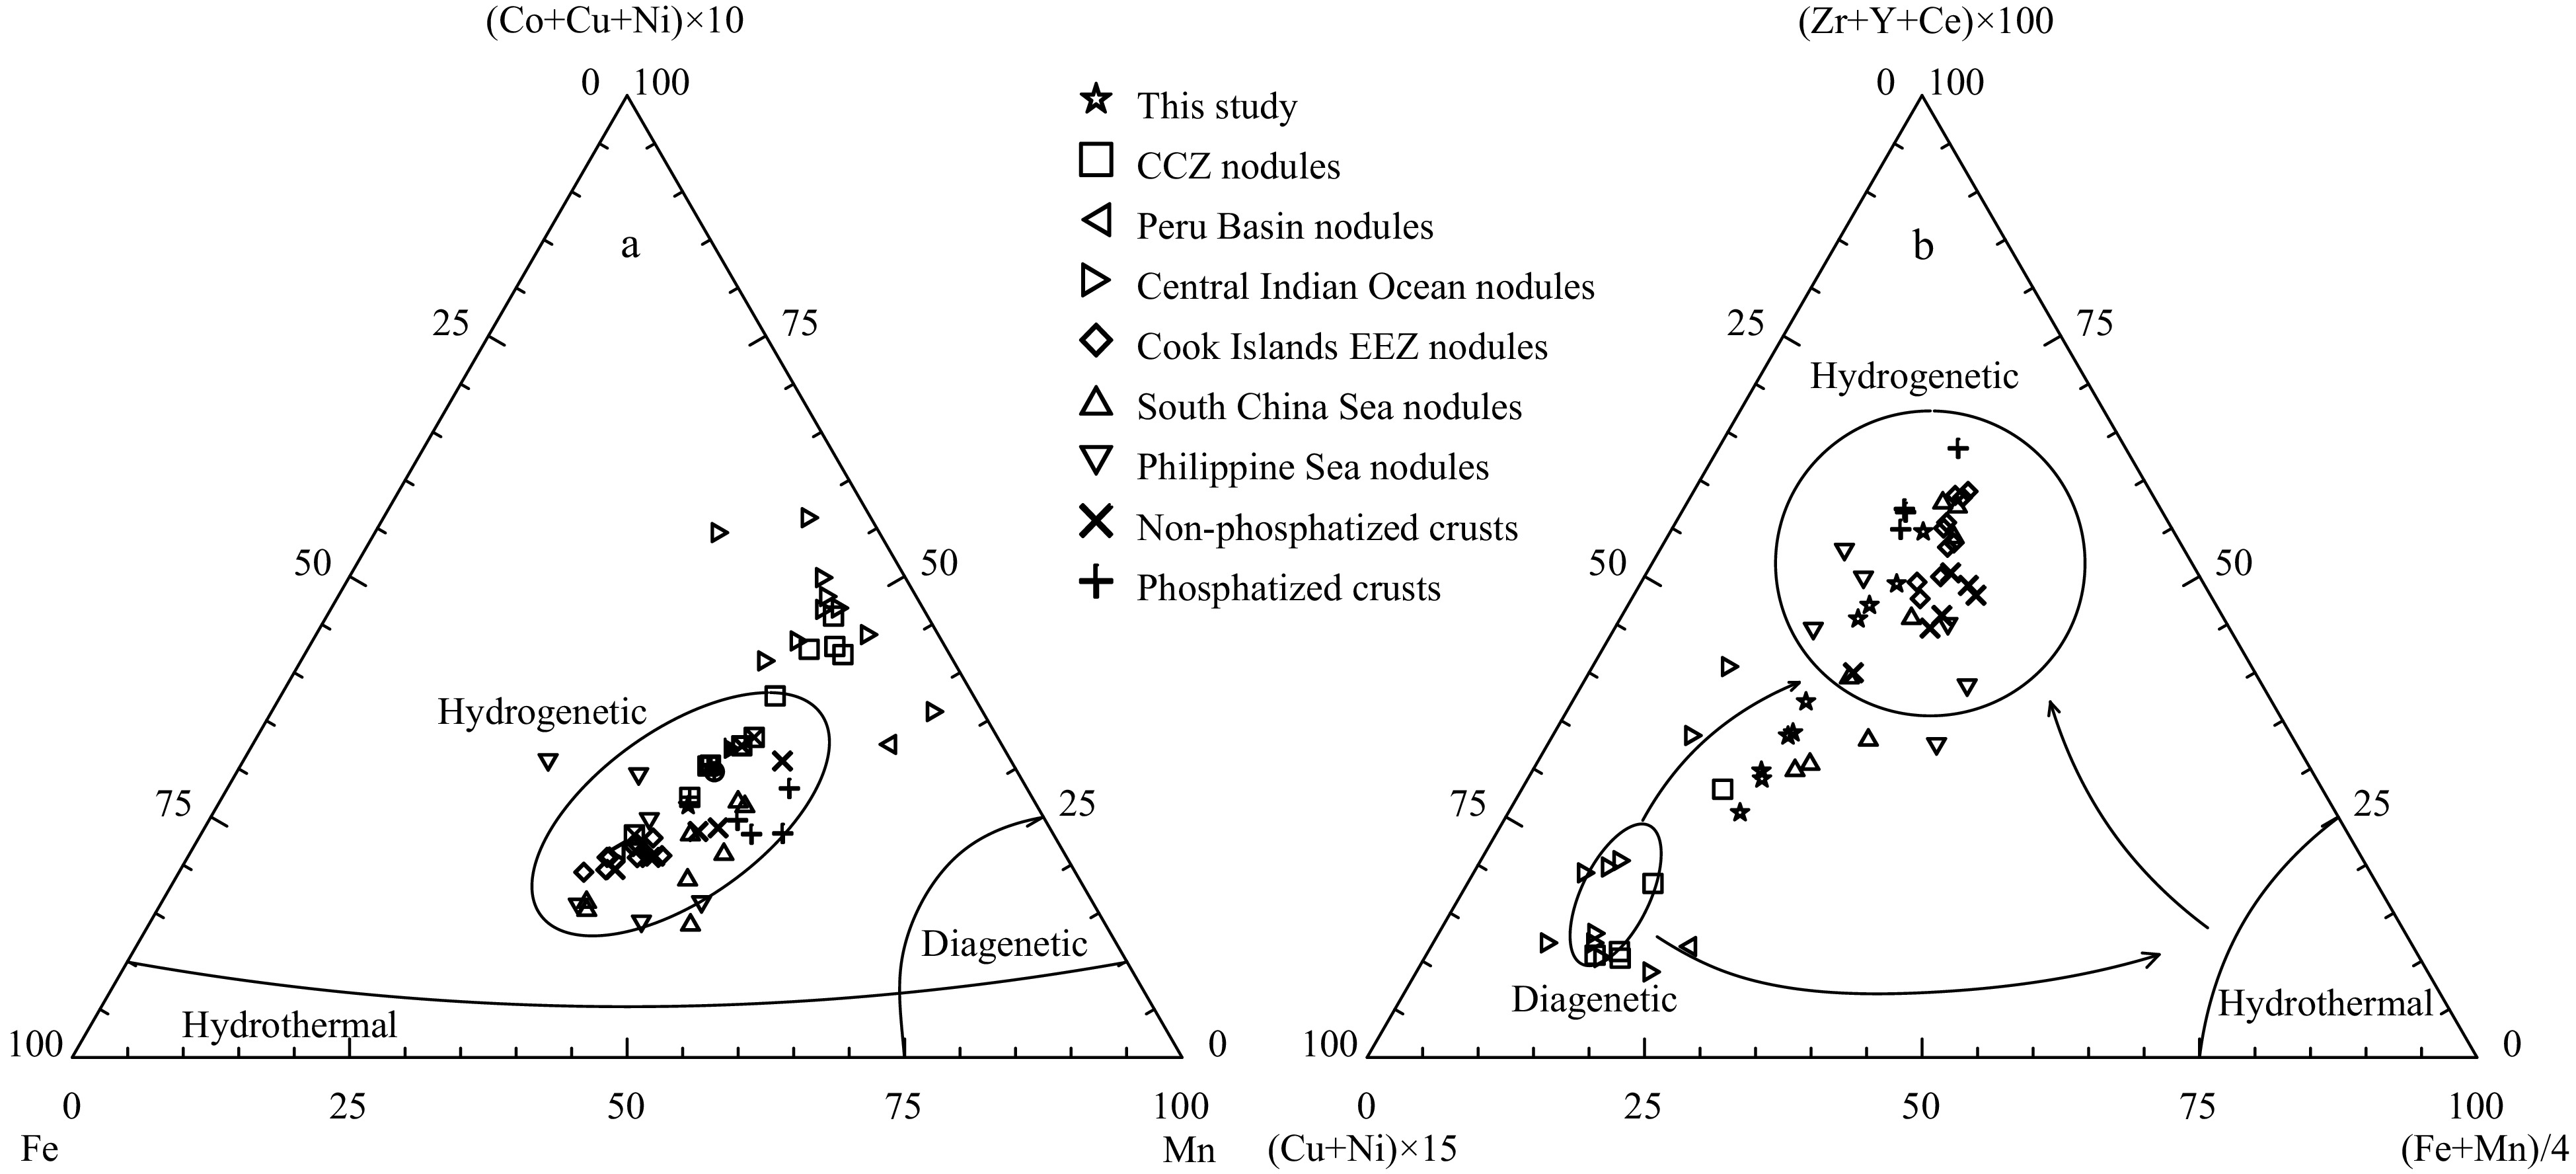
Figure 5. Ternary diagram of ferromanganese nodules: a. Fe-(Co+Cu+Ni)×10-Mn; b. (Cu+Ni)×15-(Zr+Y+Ce)×100- (Fe+Mn)/4. Nodule data sources: CCZ (Reykhard and Shulga, 2019), Peru Basin (Hein et al., 2013), Central Indian Ocean Basin (Sensarma et al., 2021), Cook Islands EEZ (Hein et al., 2015), South China Sea (Zhong et al., 2017a), Philippine Sea (Zhou et al., 2022), non-phosphatized and phosphatized crusts (Gao et al., 2022).
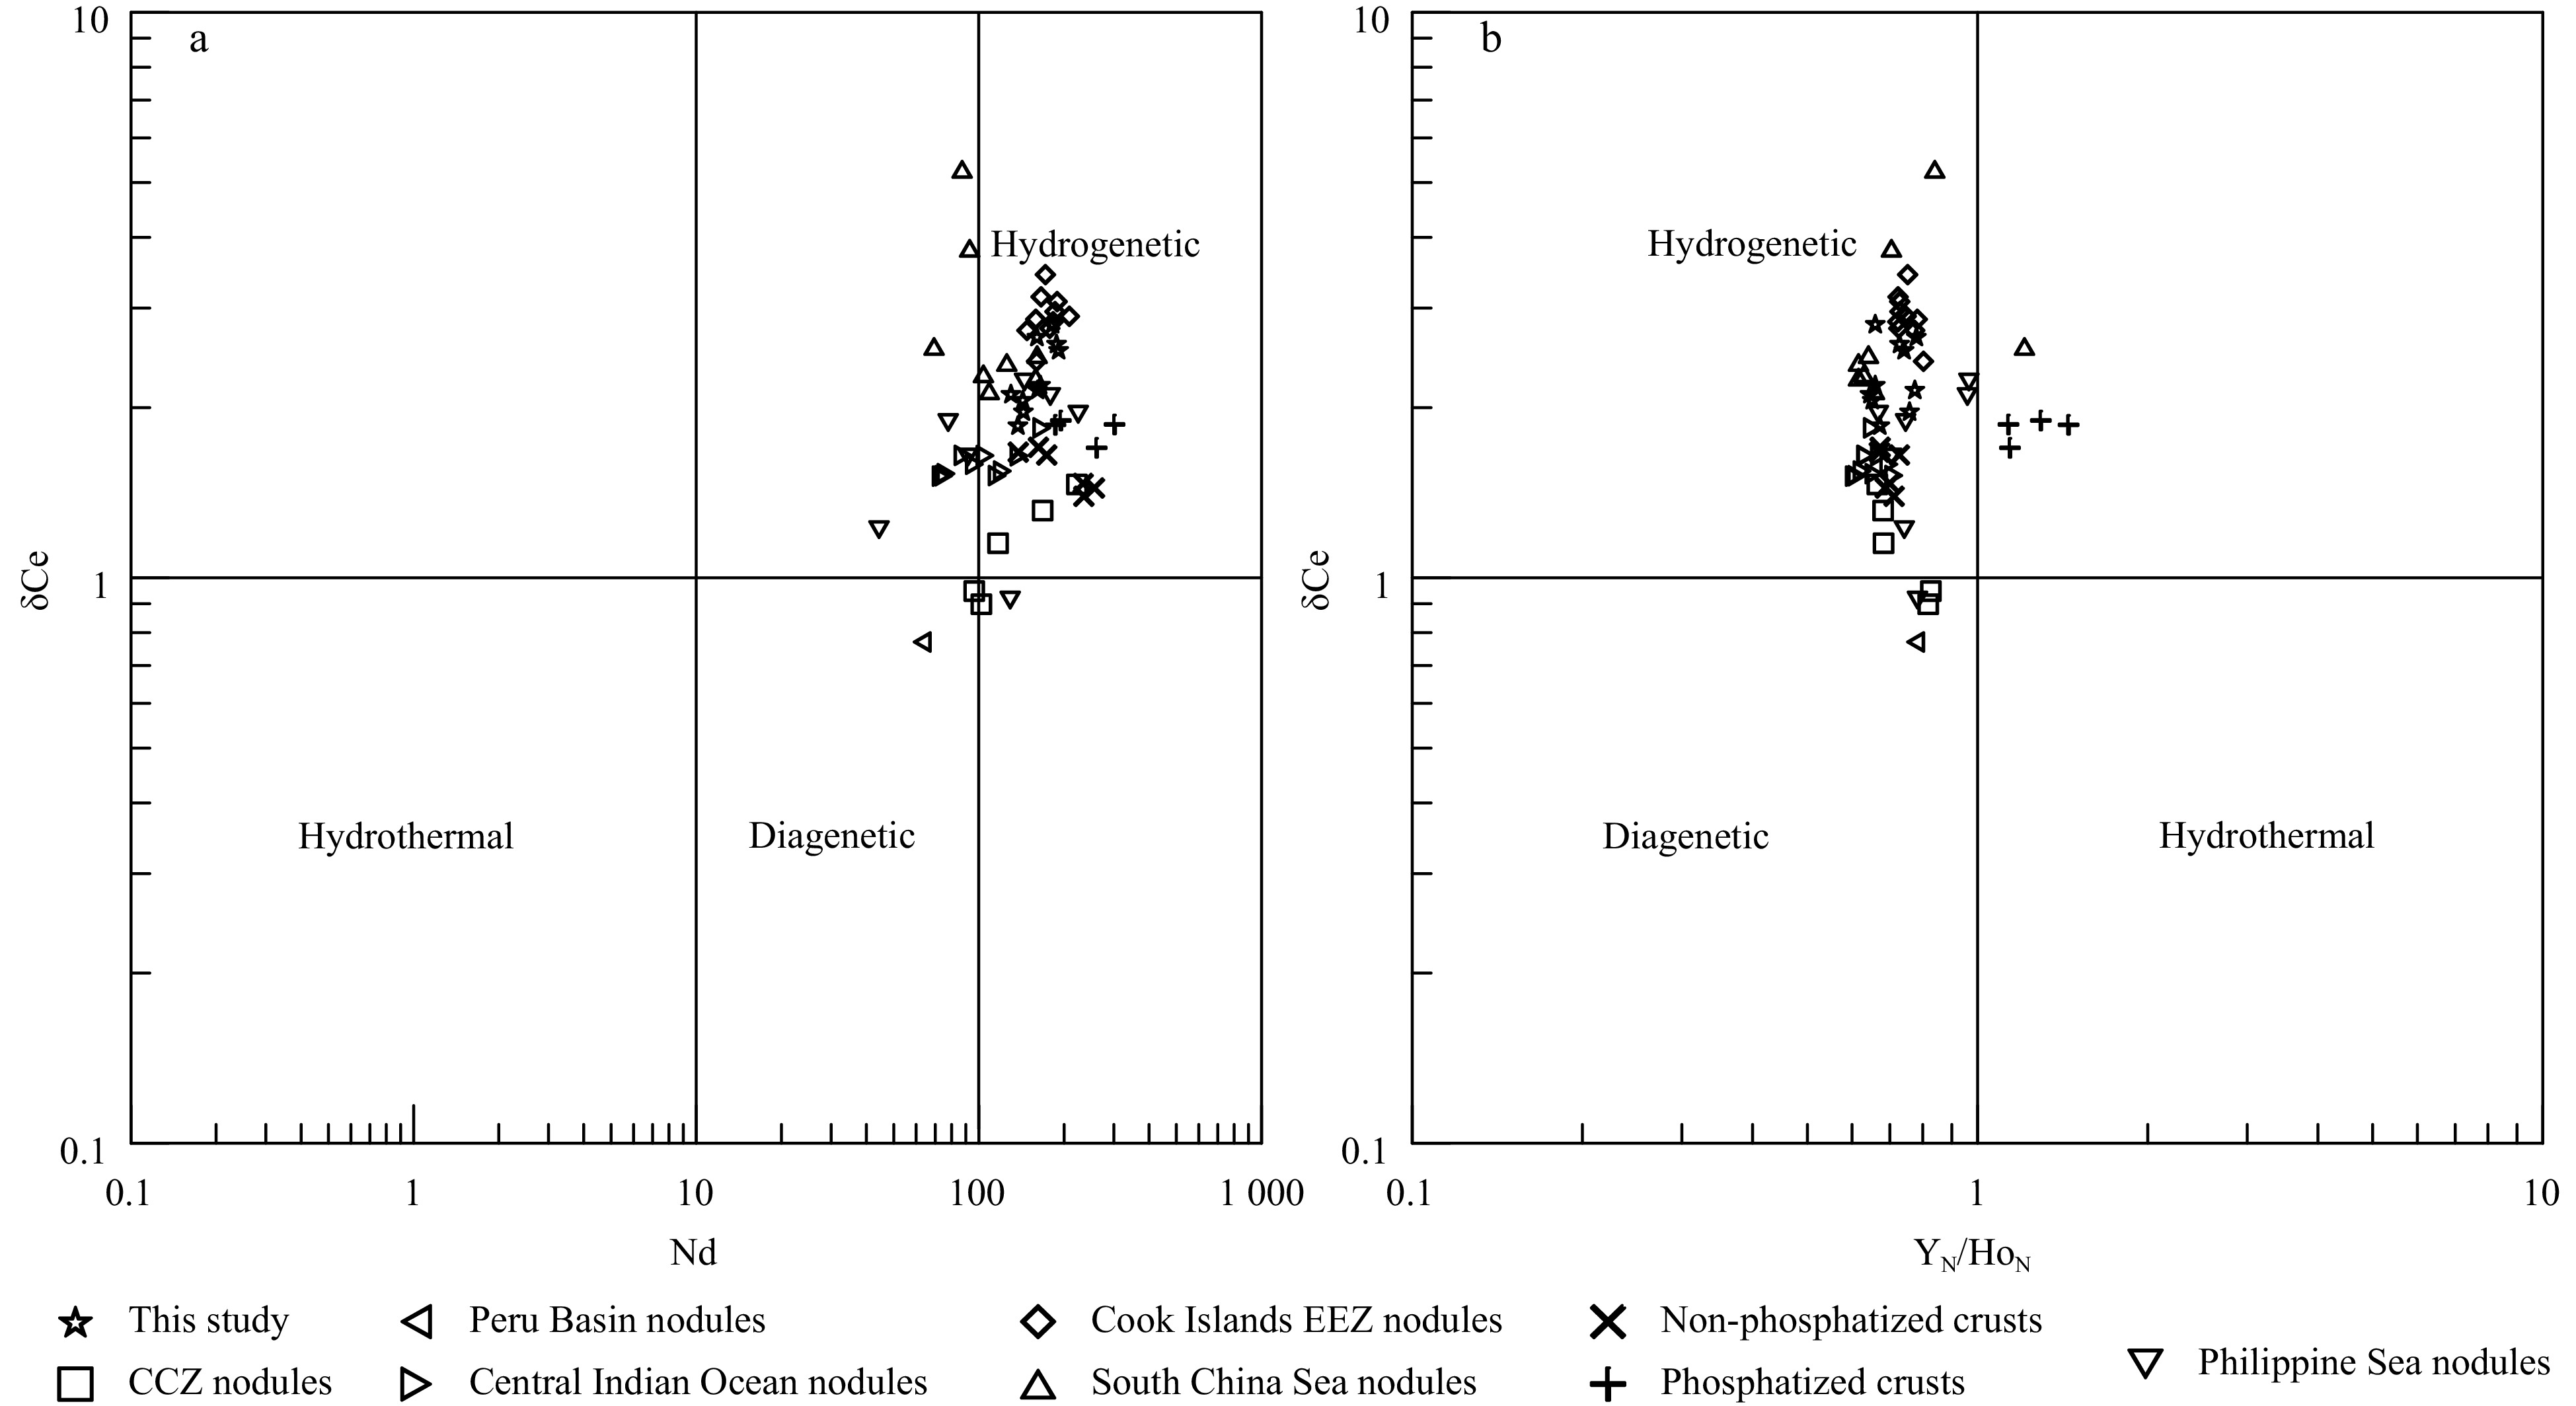
Figure 6. Elemental correlation diagram of ferromanganese nodules: a. δCe vs Nd, b. δCe vs YN/HoN. δCe=2CeN/(LaN+PrN), LaN, CeN, PrN, YN and HoN are normalized to the NASC. NASC data are from Wang et al. (1989). Nodule data sources: CCZ (Reykhard and Shulga, 2019), Peru Basin (Hein et al., 2013), Central Indian Ocean Basin (Sensarma et al., 2021), Cook Islands EEZ (Hein et al., 2015), South China Sea (Zhong et al., 2017a), Philippine Sea (Zhou et al., 2022), non-phosphatized and phosphatized crusts (Gao et al., 2022).
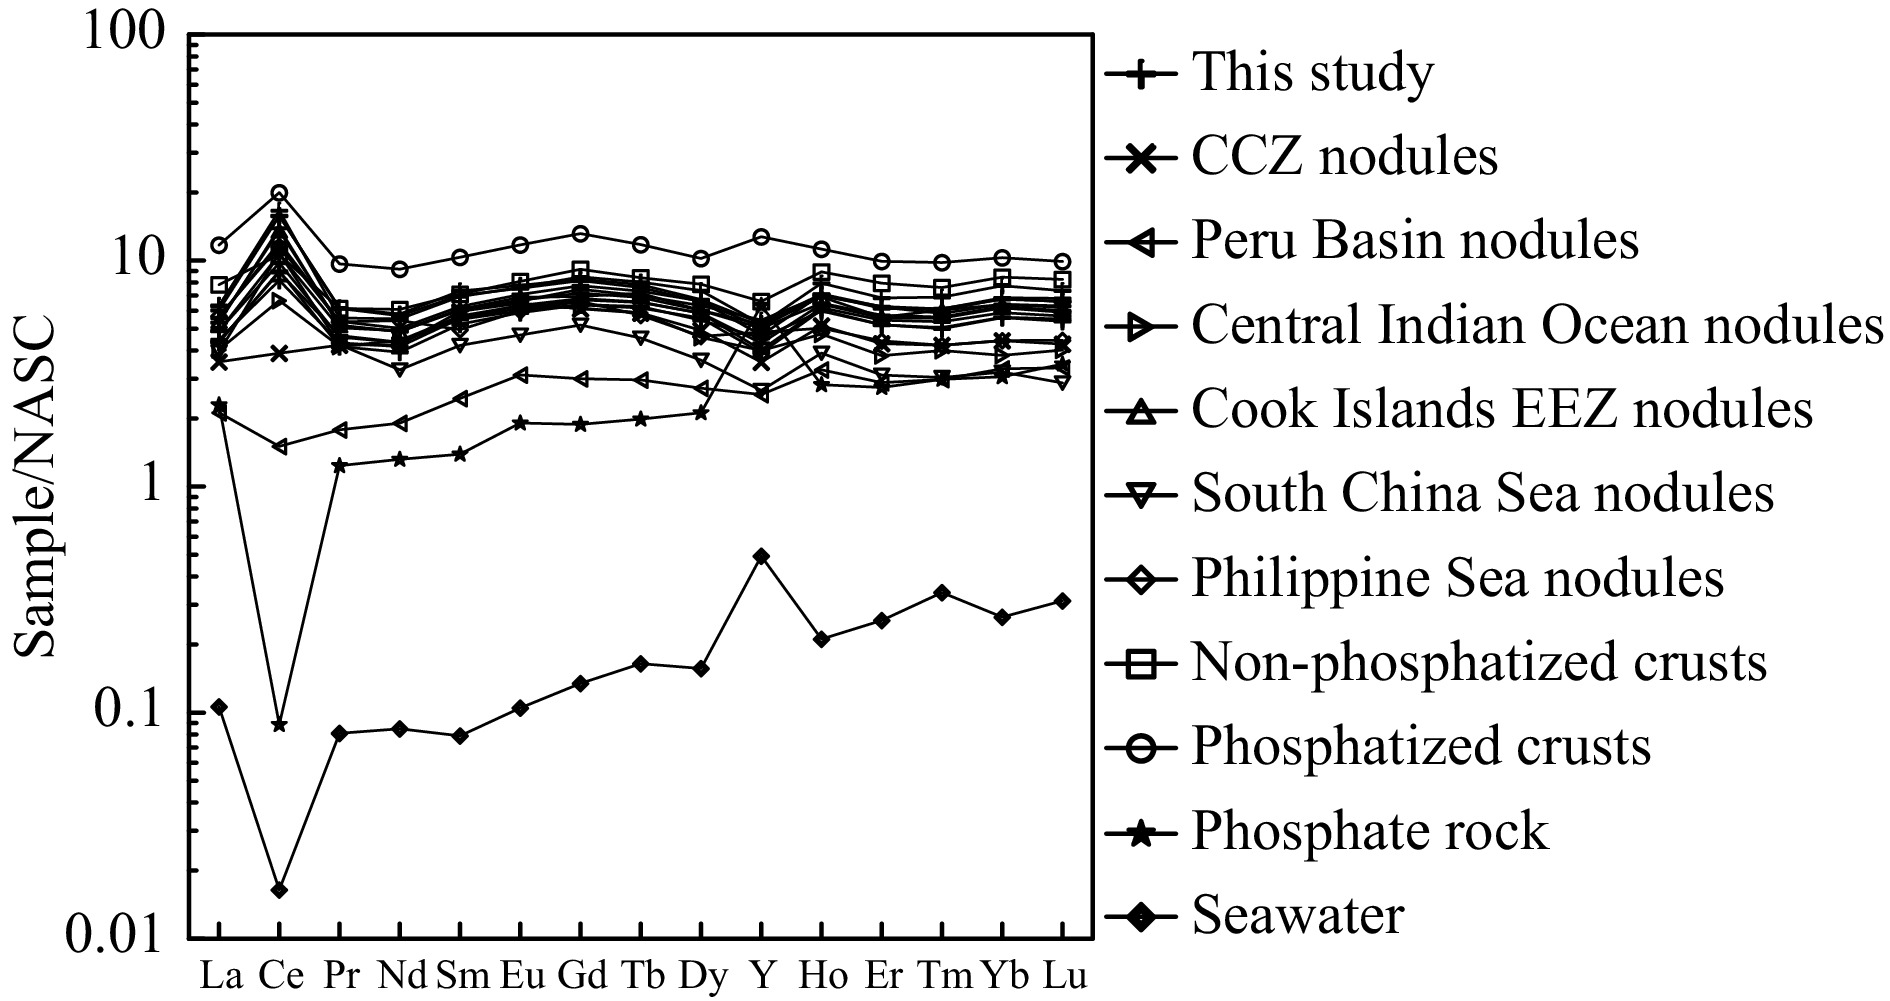
Figure 7. NASC-normalized REE distribution patterns of ferromanganese nodules: REE data of seawater are multiplied by 106. NASC and seawater data are from Wang et al. (1989), and the phosphate rock data are from this study. Nodule data sources: CCZ, Peru Basin and Central Indian Ocean Basin (Hein et al., 2013), Cook Islands EEZ (Hein et al., 2015), South China Sea (Yin et al., 2019), Philippine Sea (Zhou et al., 2022), non-phosphatized crusts (Gao et al., 2023), phosphatized crusts (Gao et al., 2022),
Table 1. Description of ferromanganese nodule samples
Station Longitude/°E Latitude/°N Number Type Diameter/cm Water depth/m Sampling B01 153.695282 17.807557 B01M Middle spherical nodules 3×3 5694 boxing B01S Small spherical nodules 2×2 5694 boxing B03 155.464373 17.640543 B03M Middle conjunctive nodules 4×3 5698 boxing B03S Small conjunctive nodules 3×2 5698 boxing B04 159.093026 16.549205 B04M Middle conjunctive nodules 4×3 5790 boxing B04S Small conjunctive nodules 3×2 5790 boxing B06 161.702904 20.310552 B06M Middle conjunctive nodules 4×3 5140 boxing B06S Small conjunctive nodules 3×2 5140 boxing T01 155.492477 17.656095 T01M Middle conjunctive nodules 4×3 5689 dredging T01S Small conjunctive nodules 3×2 5689 dredging  下载: 导出CSV
Table 2. Major and trace element contents of ferromanganese nodules
Element Unit Spherical nodules Conjunctive nodules B01M B01S Average B06M B06S B03M B03S T01M T01S B04M B04S Average Mn % 16.55 17.36 16.96 20.99 20.44 21.26 23.22 21.99 23.19 18.79 24.94 21.85 Fe % 17.40 16.78 17.09 15.37 15.14 13.49 12.35 14.19 13.01 12.29 12.19 13.50 Al % 2.91 3.37 3.14 2.45 2.58 2.68 2.64 2.83 2.96 3.67 2.86 2.83 Ca % 1.58 1.60 1.59 1.74 1.79 1.68 1.56 1.70 1.67 2.07 1.62 1.73 K % 0.66 0.67 0.66 0.74 0.75 0.67 0.69 0.72 0.73 0.81 0.78 0.74 Mg % 1.24 1.41 1.32 1.55 1.45 1.62 1.81 1.74 1.91 1.48 1.89 1.68 Na % 1.50 1.55 1.53 1.70 1.73 1.69 1.69 1.81 1.84 2.12 1.83 1.80 P % 0.28 0.29 0.28 0.28 0.27 0.26 0.22 0.26 0.24 0.22 0.22 0.25 Ti % 1.38 1.33 1.35 1.05 1.08 0.87 0.73 0.87 0.75 0.71 0.64 0.84 Co % 0.37 0.35 0.36 0.42 0.41 0.32 0.28 0.33 0.29 0.24 0.26 0.32 Cu % 0.23 0.30 0.27 0.32 0.30 0.47 0.59 0.55 0.59 0.53 0.73 0.51 Ni % 0.33 0.38 0.36 0.62 0.55 0.68 0.84 0.71 0.83 0.58 0.86 0.71 Ba % 0.12 0.12 0.12 0.14 0.14 0.12 0.11 0.12 0.12 0.10 0.10 0.12 Sr % 0.09 0.09 0.09 0.10 0.10 0.08 0.07 0.09 0.08 0.08 0.07 0.08 Pb % 0.12 0.11 0.11 0.10 0.10 0.10 0.10 0.09 0.09 0.09 0.08 0.10 V µg/g 498 458 478 529 530 473 456 494 480 432 474 483 Zn µg/g 505 553 529 654 599 697 844 697 820 624 905 730 Zr µg/g 681 657 669 639 637 524 463 508 473 465 420 516 Mn/Fe - 0.95 1.03 0.99 1.37 1.35 1.58 1.88 1.55 1.78 1.53 2.05 1.63 Ca/P - 5.68 5.60 5.64 6.13 6.59 6.42 7.00 6.50 6.84 9.59 7.23 7.04 La µg/g 201 170 186 203 193 179 156 156 140 139 143 164 Ce µg/g 1216 1017 1117 1154 1150 877 713 779 648 656 597 822 Pr µg/g 44.0 40.6 42.3 48.8 48.5 42.5 36.2 39.9 36.8 32.9 34.2 40.0 Nd µg/g 182 160 171 191 188 165 143 161 144 130 137 158 Sm µg/g 39.5 34.3 36.9 41.8 40.0 35.7 31.9 34.6 31.3 29.8 31.7 34.6 Eu µg/g 9.44 8.22 8.83 9.62 9.35 8.78 7.85 8.28 7.42 7.29 7.62 8.28 Gd µg/g 44.1 38.8 41.4 43.1 42.4 40.2 35.3 37.3 33.2 33.1 34.8 37.4 Tb µg/g 6.82 5.95 6.38 6.65 6.46 6.22 5.57 5.84 5.33 5.24 5.55 5.86 Dy µg/g 42.7 36.7 40.0 39.0 38.1 38.4 33.9 34.9 31.6 32.3 34.0 35.3 Ho µg/g 8.26 7.27 7.77 7.40 7.25 7.37 6.43 6.74 6.22 6.30 6.67 6.80 Er µg/g 23.3 21.3 22.3 21.2 21.2 20.9 18.5 19.5 17.7 17.7 18.9 19.4 Tm µg/g 3.45 3.06 3.25 3.01 2.92 3.06 2.68 2.81 2.50 2.52 2.78 2.79 Yb µg/g 24.0 21.2 22.6 21.1 19.9 20.9 18.2 19.5 17.3 17.4 19.2 19.2 Lu µg/g 3.53 3.26 3.40 3.16 3.02 3.17 2.73 2.88 2.58 2.64 2.84 2.88 Y µg/g 141 147 144 142 137 126 109 135 122 105 116 124 REEs µg/g 1990 1716 1853 1935 1907 1575 1320 1444 1246 1218 1192 1480 LREE µg/g 1693 1431 1562 1648 1629 1308 1088 1179 1007 995 950 1226 HREE µg/g 297 285 291 287 278 266 232 265 239 223 241 254 LREE/HREE – 5.69 5.03 5.36 5.75 5.86 4.91 4.69 4.45 4.22 4.47 3.94 4.78 Y/Ho – 17.1 20.2 18.7 19.2 18.9 17.1 16.9 20.1 19.7 16.8 17.4 18.3 δCe – 2.81 2.67 2.74 2.53 2.59 2.19 2.06 2.15 1.97 2.11 1.86 2.18 δEu – 0.99 0.98 0.99 0.99 0.99 1.01 1.02 1.01 1.01 1.01 1.00 1.01 δY – 0.68 0.82 0.75 0.76 0.75 0.68 0.67 0.80 0.79 0.67 0.70 0.73 Note: LREEs=La+Ce+Pr+Nd+Sm+Eu, HREEs=Gd+Tb+Dy+Ho+Er+Tm+Yb+Lu+Y, δCe=2CeN/(LaN+PrN), δEu=2EuN/(SmN+GdN), δY=2YN/(DyN+HoN), and LaN, CeN, PrN, SmN, EuN, GdN, YN, DyN and HoN are normalized to North American shale (NASC). NASC data are from Wang et al. (1989).
下载: 导出CSV
Table 3. Elemental correlation coefficient matrix of ferromanganese nodules
Element Mn Fe Ca P Al Na K Mg Ti Co Cu Ni Ba Sr Pb V Zn Zr REEs Mn 1 Fe –0.763* 1 Ca –0.186 –0.296 1 P –0.632* 0.930** –0.249 1 Al –0.448 –0.064 0.467 –0.200 1 Na 0.350 –0.755* 0.797** –0.708* 0.423 1 K 0.344 –0.567 0.734* –0.562 0.261 0.866** 1 Mg 0.947** –0.782** –0.202 –0.663* –0.236 0.390 0.276 1 Ti –0.813** 0.989** –0.286 0.904** –0.009 –0.767** –0.599 –0.827** 1 Co –0.393 0.789** –0.187 0.872** –0.539 –0.624 –0.357 –0.546 0.747* 1 Cu 0.826** –0.908** 0.025 –0.874** 0.082 0.611 0.453 0.891** –0.927** –0.827** 1 Ni 0.971** –0.867** –0.081 –0.745* –0.319 0.470 0.364 0.966** –0.903** –0.538 0.888** 1 Ba –0.235 0.670* –0.141 0.791** –0.585 –0.498 –0.247 –0.377 0.611 0.965** –0.709* –0.378 1 Sr –0.362 0.643* 0.127 0.770** –0.417 –0.332 –0.083 –0.516 0.600 0.936** –0.760* –0.484 0.950** 1 Pb –0.768** 0.791** –0.315 0.717* –0.081 –0.775** –0.778** –0.777** 0.848** 0.580 –0.838** –0.780** 0.396 0.395 1 V 0.021 0.484 –0.175 0.581 –0.745* –0.391 –0.082 –0.186 0.397 0.858** –0.484 –0.151 0.917** 0.827** 0.161 1 Zn 0.954** –0.820** –0.234 –0.756* –0.262 0.357 0.302 0.960** –0.845** –0.594 0.905** 0.964** –0.466 –0.599 –0.750* –0.228 1 Zr –0.757* 0.959** –0.163 0.927** –0.155 –0.700* –0.484 –0.828** 0.961** 0.878** –0.979** –0.857** 0.765** 0.779** 0.807** 0.563 –0.846** 1 REEs –0.622 0.886** –0.179 0.886** –0.382 –0.701* –0.459 –0.765** 0.876** 0.939** –0.939** –0.742* 0.833** 0.830** 0.768** 0.709* –0.759* 0.960** 1 Note: Elemental correlation coefficient is simple pearson (n=10). ** marked P=99%, * marked P=95%.
下载: 导出CSV
Table 4. Principal component analysis of ferromanganese nodules
Element Main factor F1 F2 F3 Mn –0.995 0.0570 0.0170 Ni –0.984 –0.102 0.0800 Zn –0.967 –0.206 – 0.0530 Mg –0.958 –0.150 – 0.0200 Cu –0.850 –0.474 0.173 Ti 0.835 0.339 –0.398 Zr 0.790 0.541 –0.265 Fe 0.788 0.418 –0.381 Pb 0.762 0.138 –0.539 P 0.674 0.570 –0.338 V 0.0270 0.974 – 0.0750 Ba 0.287 0.935 –0.118 Sr 0.423 0.881 0.116 Co 0.444 0.867 –0.211 Al 0.424 –0.746 0.393 REEs 0.658 0.682 –0.270 Ca 0.192 – 0.0870 0.950 K –0.322 – 0.0290 0.895 Na –0.362 –0.323 0.865 Eigenvalue 8.86 5.71 3.57 Variance/% 46.6 30.1 18.8 Accumulative
variance/%46.6 76.7 95.5
下载: 导出CSV
Table 5. Results of elemental occurrence phases in ferromanganese nodules
Number Phase Mn
%Fe
%Al
%Ca
%K
%Mg
%Na
%P
%Ti
%Co
%Cu
µg/gNi
µg/gBa
µg/gSr
µg/gPb
µg/gV
µg/gZn
µg/gZr
µg/gREEs
µg/gB01M Carbonate phase 0.002 0.01 0.14 1.41 0.22 1.02 1.62 0.002 0.0002 0.0001 75.48 41.76 7.61 411 0.06 0.0001 32.68 0.16 12.77 Mn-Oxide phase 16.41 0.45 0.001 0.41 0.22 0.58 0.05 0.0001 0.001 0.29 255 2386 590 354 0.96 115 124 0.0001 290 Fe-Oxide phase 0.61 15.44 2.58 0.03 0.01 0.10 0.001 0.59 1.83 0.06 2089 1014 510 8.20 1155 358 335 657 1413 Residual phase 0.03 2.21 2.82 0.35 0.32 0.40 0.32 0.06 0.33 0.002 101 49.27 154 46.36 30.94 37.67 29.37 49.75 270 B01S Carbonate phase 0.01 0.01 0.24 1.45 0.23 1.13 1.65 0.002 0.0003 0.0001 141 86.15 8.19 463 0.03 0.14 51.64 0.11 15.36 Mn-Oxide phase 16.92 0.52 0.002 0.31 0.19 0.64 0.05 0.0001 0.001 0.28 532 2827 558 282 1.19 98.05 155 0.0001 236 Fe-Oxide phase 0.61 14.23 3.00 0.09 0.05 0.11 0.04 0.57 1.70 0.06 2224 814 443 30.48 855 311 305 533 1251 Residual phase 0.05 3.10 2.79 0.30 0.31 0.37 0.33 0.08 0.45 0.002 168 34.17 240 41.60 75.06 46.37 42.35 64.95 116 B06M Carbonate phase 0.002 0.004 0.09 1.40 0.23 1.16 1.65 0.001 0.0002 0.0001 106 75.91 9.50 465 0.02 0.08 51.37 0.0001 14.57 Mn-Oxide phase 18.64 0.62 0.0001 0.38 0.13 0.65 0.02 0.0001 0.0004 0.32 691 4480 828 292 1.71 122 223 0.0001 301 Fe-Oxide phase 0.61 12.51 1.60 0.01 0.02 0.06 0.01 0.54 1.32 0.04 2058 854 358 8.45 1105 323 283 503 1170 Residual phase 0.02 1.49 1.69 0.16 0.28 0.21 0.29 0.03 0.21 0.001 75.37 23.29 85.62 21.66 41.10 26.10 25.56 34.32 168 B06S Carbonate phase 0.002 0.01 0.10 1.46 0.22 1.16 1.65 0.001 0.0003 0.0001 117 93.89 8.52 481 0.02 0.0001 54.56 0.0001 15.42 Mn-Oxide phase 18.94 0.59 0.001 0.38 0.15 0.59 0.03 0.0001 0.0004 0.33 609 4071 821 318 4.52 119 198 0.0001 314 Fe-Oxide phase 0.66 13.23 1.60 0.02 0.02 0.05 0.01 0.55 1.46 0.05 2140 925 417 9.95 1142 356 289 547 1216 Residual phase 0.02 1.57 2.15 0.24 0.32 0.26 0.37 0.03 0.22 0.001 77.49 21.49 101 32.20 37.68 25.80 25.80 35.65 222 B03M Carbonate phase 0.003 0.01 0.12 1.41 0.17 1.12 1.65 0.002 0.0002 0.0001 139 79.6 4.97 399 0.06 0.0001 51.83 0.23 15.01 Mn-Oxide phase 20.52 0.52 0.0005 0.43 0.20 1.03 0.03 0.0002 0.001 0.25 1328 5221 745 296 1.36 127 243 0.0001 226 Fe-Oxide phase 0.72 13.14 2.21 0.01 0.0001 0.08 0.001 0.60 1.30 0.05 3471 1283 375 10.49 1187 339 374 522 1123 Residual phase 0.01 1.29 2.47 0.30 0.34 0.33 0.34 0.02 0.15 0.001 74.96 27.19 102 35.21 16.87 21.38 22.69 25.17 47.96 B03S Carbonate phase 0.004 0.005 0.13 1.30 0.14 1.15 1.77 0.002 0.0002 0.0001 132 78.79 3.24 357 0.06 0.0001 52.87 0.19 14.20 Mn-Oxide phase 22.25 0.46 0.0003 0.44 0.24 1.26 0.03 0.002 0.001 0.22 2069 6242 717 278 0.99 120 292 0.0001 172 Fe-Oxide phase 0.64 11.69 2.24 0.01 0.0001 0.09 0.002 0.50 1.03 0.05 3818 1636 323 8.58 1036 324 453 448 983 Residual phase 0.01 1.37 2.45 0.23 0.37 0.36 0.29 0.02 0.16 0.001 83.01 46.38 83.08 27.53 16.04 23.44 25.82 27.85 29.04 T01M Carbonate phase 0.004 0.01 0.15 1.43 0.22 1.22 1.83 0.002 0.0003 0.0001 226 97.90 7.43 446 0.02 0.0001 69.05 0.0001 16.67 Mn-Oxide phase 20.38 0.64 0.001 0.35 0.17 0.89 0.03 0.002 0.0004 0.26 1782 5316 655 252 1.25 118 247 0.0001 223 Fe-Oxide phase 0.59 12.21 2.14 0.02 0.02 0.07 0.01 0.53 1.17 0.03 3122 1004 418 10.03 895 316 308 427 1062 Residual phase 0.01 1.26 2.00 0.25 0.28 0.26 0.29 0.02 0.16 0.001 87.54 35.72 88.19 27.61 13.05 19.63 22.23 23.30 27.09 T01S Carbonate phase 0.004 0.004 0.13 1.25 0.18 1.19 1.80 0.002 0.0002 0.0001 155 80.28 4.91 375 0.01 0.0001 55.15 0.04 13.18 Mn-Oxide phase 20.71 0.61 0.0004 0.37 0.18 1.08 0.02 0.003 0.0004 0.22 2180 6139 702 239 1.49 124 303 0.0001 198 Fe-Oxide phase 0.55 10.55 2.13 0.02 0.01 0.07 0.01 0.48 0.94 0.03 2997 1054 315 8.15 807 281 345 383 871 Residual phase 0.01 1.27 2.26 0.25 0.32 0.31 0.30 0.02 0.16 0.001 96.06 57.14 69.34 28.25 12.31 20.66 24.72 24.48 25.06 B04M Carbonate phase 0.01 0.004 0.13 1.18 0.16 0.96 1.67 0.002 0.0002 0.0001 198 88.95 3.45 335 0.03 0.0001 61.14 0.17 14.87 Mn-Oxide phase 17.68 0.71 0.001 0.31 0.23 0.86 0.04 0.001 0.0005 0.20 1844 4634 434 221 1.72 130 253 0.04 231 Fe-Oxide phase 0.58 10.44 1.87 0.02 0.01 0.07 0.001 0.45 0.94 0.03 3151 818 408 10.27 884 270 256 421 829 Residual phase 0.02 1.96 3.58 1.16 0.49 0.41 0.96 0.04 0.21 0.002 178 63.38 184 127 24.64 30.16 32.76 45.93 26.61 B04S Carbonate phase 0.005 0.01 0.16 1.36 0.14 1.11 1.78 0.002 0.0002 0.0001 172 96.28 2.46 337 0.05 0.0001 63.00 0.18 16.32 Mn-Oxide phase 23.31 0.51 0.0002 0.41 0.31 1.31 0.04 0.003 0.001 0.20 2962 6258 479 261 0.90 124 317 0.0001 145 Fe-Oxide phase 0.58 10.96 2.36 0.02 0.01 0.09 0.001 0.48 0.85 0.05 4245 1609 489 9.19 929 320 454 396 853 Residual phase 0.01 1.51 2.54 0.20 0.38 0.38 0.28 0.02 0.18 0.002 127 105 119 27.17 18.70 25.82 30.45 32.46 26.31
下载: 导出CSV
-
Bai Zhimin, Wang Yingbin, Jiang Bo, et al. 2004. Occurrence modes of REE in the Pacific cobalt-rich crusts. Earth Science Frontiers (in Chinese), 11(2): 387–392 Bau M, Koschinsky A. 2009. Oxidative scavenging of cerium on hydrous Fe oxide: evidence from the distribution of rare earth elements and yttrium between Fe oxides and Mn oxides in hydrogenetic ferromanganese crusts. Geochemical Journal, 43(1): 37–47, doi: 10.2343/geochemj.1.0005 Bau M, Schmidt K, Koschinsky A, et al. 2014. Discriminating between different genetic types of marine ferro-manganese crusts and nodules based on rare earth elements and yttrium. Chemical Geology, 381: 1–9, doi: 10.1016/j.chemgeo.2014.05.004 Bonatti E, Kraemer T, Rydell H S. 1972. Classification and genesis of submarine iron-manganese deposits. In: Horn D R, ed. Ferromanganese Deposits on the Ocean Floor. New York: Columbia University, 149–166 (查阅网上资料, 不确定文献类型及格式是否正确, 请确认) Byrne R H. 2002. Inorganic speciation of dissolved elements in seawater: the influence of pH on concentration ratios. Geochemical Transactions, 2002,3: 11–16 Cao Dekai, Ren Xiangwen, Shi Xuefa. 2017. Genesis and grade control factors of polymetallic nodules in the East Mariana Basin of Pacific. Journal of Marine Sciences (in Chinese), 35(4): 76–86 Chen J C, Owen R M. 1989. The hydrothermal component in ferromanganese nodules from the Southeast Pacific Ocean. Geochimica et Cosmochimica Acta, 53(6): 1299–1305, doi: 10.1016/0016-7037(89)90064-1 Cheng Yulong, Xu Yonghang, Li Dongyi, et al. 2023a. Enrichment mechanism of critical metals and records of paleoenvironment in a polymetallic nodule from the Somali Basin. Acta Petrologica Sinica (in Chinese), 39(9): 2778–2794, doi: 10.18654/1000-0569/2023.09.14 Cheng Yulong, Xu Yonghang, Yi Liang, et al. 2023b. Chronology and critical metals enrichment mechanism of ferromanganese nodules from the Parece Vela Basin, Philippine Sea. Chemical Geology, 630: 121494, doi: 10.1016/j.chemgeo.2023.121494 Cui Yingchun, Shi Xuefa, Liu Jihua, et al. 2012. Records of past 70 Ma dust activities in ferromanganese crusts from Pacific Ocean. Journal of Jilin University (Earth Science Edition) (in Chinese), 42(2): 393–399 Deng Xianze, He Gaowen, Xu Yue, et al. 2022. Oxic bottom water dominates polymetallic nodule formation around the Caiwei Guyot, northwestern Pacific Ocean. Ore Geology Reviews, 143: 104776, doi: 10.1016/j.oregeorev.2022.104776 Deng Yinan, Ren Jiangbo, Guo Qingjun, et al. 2019. Trace elements geochemistry characteristics of seawater and porewater in deep-water basin, western Pacific. Earth Science (in Chinese), 44(9): 3101–3114 Fu Yazhou, Wen Hanjie. 2020. Variabilities and enrichment mechanisms of the dispersed elements in marine Fe-Mn deposits from the Pacific Ocean. Ore Geology Reviews, 121: 103470, doi: 10.1016/j.oregeorev.2020.103470 Gao Jingjing, Liu Jihua, Zhang Hui, et al. 2022. Geochemistry and sources of rare earth elements in cobalt-rich crusts from the Caiwei and Xufu seamounts, West Pacific Ocean. Marine Geology & Quaternary Geology (in Chinese), 42(3): 87–99 Gao Jingjing, Liu Jihua, Zhang Hui, et al. 2023. Geochemistry and occurrence phase of the elements in cobalt-rich crusts from the Magellan Seamounts. Oceanologia et Limnologia Sinica (in Chinese), 54(2): 424–435 Guan Yao, Ren Yingzhi, Sun Xiaoming, et al. 2019. Fine scale study of major and trace elements in the Fe-Mn nodules from the South China Sea and their metallogenic constraints. Marine Geology, 416: 105978, doi: 10.1016/j.margeo.2019.105978 Guan Yao, Sun Xiaoming, Ren Yingzhi, et al. 2017. Mineralogy, geochemistry and genesis of the polymetallic crusts and nodules from the South China Sea. Ore Geology Reviews, 89: 206–227, doi: 10.1016/j.oregeorev.2017.06.020 Halbach P, Scherhag C, Hebisch U, et al. 1981. Geochemical and mineralogical control of different genetic types of deep-sea nodules from the Pacific Ocean. Mineralium Deposita, 16(1): 59–84 He Gaowen, Sun Xiaoming, Yang Shengxiong, et al. 2011. A comparison of REE geochemistry between polymetallic nodules and cobaltrich crusts in the Pacific Ocean. Geology in China (in Chinese), 38(2): 462–472 Hein J R, Conrad T A, Frank M, et al. 2012. Copper-nickel-rich, amalgamated ferromanganese crust-nodule deposits from Shatsky Rise, NW Pacific. Geochemistry, Geophysics, Geosystems, 13(10): Q10022 Hein J R, Koschinsky A. 2014. Deep-ocean ferromanganese crusts and nodules. Treatise on Geochemistry (Second Edition), 13: 273–291 Hein J R, Koschinsky A, Kuhn T. 2020. Deep-ocean polymetallic nodules as a resource for critical materials. Nature Reviews Earth & Environment, 1(3): 158–169 Hein J R, Kosschinsky A, Bau M, et al. 2000. Cobalt-rich ferromanganese crusts in the Pacific. In: Cronan D S, ed. Handbook of Marine Mineral Deposits. Boca Raton: CRC Press, 239–280 Hein J R, Mizell K, Koschinsky A, et al. 2013. Deep-ocean mineral deposits as a source of critical metals for high- and green-technology applications: Comparison with land-based resources. Ore Geology Reviews, 51: 1–14, doi: 10.1016/j.oregeorev.2012.12.001 Hein J R, Spinardi F, Okamoto N, et al. 2015. Critical metals in manganese nodules from the Cook Islands EEZ, abundances and distributions. Ore Geology Reviews, 68: 97–116, doi: 10.1016/j.oregeorev.2014.12.011 Heller C, Kuhn T, Versteegh G J M, et al. 2018. The geochemical behavior of metals during early diagenetic alteration of buried manganese nodules. Deep-Sea Research Part I: Oceanographic Research Papers, 142: 16–33., doi: 10.1016/j.dsr.2018.09.008 Huang Wei, Hu Bangqi, Xu Lei, et al. 2021. Geochemical characteristics and genesis of the ferromanganese nodules in the middle western margin of the Parece Vela Basin. Marine Geology & Quaternary Geology (in Chinese), 41(1): 199–209 Jiang Xuejun, Lin Xuehui, Yao De, et al. 2011. Enrichment mechanisms of rare earth elements in marine hydrogenic ferromanganese crusts. Science China Earth Sciences, 54(2): 197–203, doi: 10.1007/s11430-010-4070-4 Josso P, Pelleter E, Pourret O, et al. 2017. A new discrimination scheme for oceanic ferromanganese deposits using high field strength and rare earth elements. Ore Geology Reviews, 87: 3–15, doi: 10.1016/j.oregeorev.2016.09.003 Kawabe M, Fujio S, Yanagimoto D. 2003. Deep-water circulation at low latitudes in the western North Pacific. Deep-Sea Research Part I: Oceanographic Research Papers, 50(5): 631–656, doi: 10.1016/S0967-0637(03)00040-2 Khanchuk A I, Mikhailik P E, Mikhailik E V, et al. 2015. Peculiarities of the distribution of rare-earth elements and yttrium in mineral phases of the ferromanganese crusts from the Detroit Guyot (Pacific Ocean). Doklady Earth Sciences, 465(2): 1243–1247, doi: 10.1134/S1028334X15120016 Knaack D R, Leybourne M L, Layton-Matthews D, et al. 2023. The role of depositional environment and chemical composition on the triple oxygen isotope ratios of ferromanganese precipitates and their endmember components. Chemical Geology, 642: 121785, doi: 10.1016/j.chemgeo.2023.121785 Koppers A A P, Staudigel H, Pringle M S, et al. 2003. Short-lived and discontinuous intraplate volcanism in the South Pacific: Hot spots or extensional volcanism? Geochemistry, Geophysics, Geosystems, 4(10): 1089 Koschinsky A, Halbach P. 1995. Sequential leaching of marine ferromanganese precipitates: genetic implications. Geochimica et Cosmochimica Acta, 59(24): 5113–5132, doi: 10.1016/0016-7037(95)00358-4 Koschinsky A, Hein J R. 2003. Uptake of elements from seawater by ferromanganese crusts: Solid-phase associations and seawater speciation. Marine Geology, 198(3–4): 331–351, doi: 10.1016/S0025-3227(03)00122-1 Koschinsky A, Hein J R, Kraemer D, et al. 2020. Platinum enrichment and phase associations in marine ferromanganese crusts and nodules based on a multi-method approach. Chemical Geology, 539: 119426, doi: 10.1016/j.chemgeo.2019.119426 Kuhn T, Wegorzewski A, Rühlemann C, et al. 2017. Composition, formation, and occurrence of polymetallic nodules. In: Sharma R, ed. Deep-Sea Mining: Resource Potential, Technical and Environmental Considerations. Cham: Springer, 23–63 Li Tong. 1976. Chemical element abundances in the Earth and it's major shells. Geochimica (in Chinese), 5(3): 167–174 Li Tong. 1984. Abundance of Chemical elements in oceanic and Continental crust. Geotectonica et Metallogenia (in Chinese), 8(1): 19–27 Li Dengfeng, Fu Yu, Sun Xiaoming, et al. 2020. Critical metal enrichment mechanism of deep-sea hydrogenetic nodules: Insights from mineralogy and element mobility. Ore Geology Reviews, 118: 103371, doi: 10.1016/j.oregeorev.2020.103371 Li Kang, Zeng Zhigang, Yin Xuebo, et al. 2009. Mode of element occurrence in surface sediments from East Pacific Rise near 13°N and the equator. Marine Geology & Quaternary Geology (in Chinese), 29(3): 53–60 Liang Yongjia, Sun Xiaoming, Li Dengfeng, et al. 2024. Effects of phosphate on REY adsorption by goethite: Insights into REY enrichment and release in marine iron oxyhydroxides during early diagenesis. Chemical Geology, 649: 121966, doi: 10.1016/j.chemgeo.2024.121966 Luo Shuaijie, Ren Jiangbo, He Gaowen, et al. 2023. Geochemical characteristics of polymetallic nodules and adjacent sediments in the western Pacific Ocean: effects of sedimentary environments on nodules. Marine Geology & Quaternary Geology (in Chinese), 43(3): 119–131 Machida S, Fujinaga K, Ishii T, et al. 2016. Geology and geochemistry of ferromanganese nodules in the Japanese Exclusive Economic Zone around Minamitorishima Island. Geochemical Journal, 50(6): 539–555, doi: 10.2343/geochemj.2.0419 Menendez A, James R H, Lichtschlag A, et al. 2019. Controls on the chemical composition of ferromanganese nodules in the Clarion-Clipperton Fracture Zone, eastern equatorial Pacific. Marine Geology, 409: 1–14, doi: 10.1016/j.margeo.2018.12.004 Mikhailik P E, Mikhailik E V, Zarubina N V, et al. 2017. Distribution of rare-earth elements and yttrium in hydrothermal sedimentary ferromanganese crusts of the sea of Japan (from phase analysis results). Russian Geology and Geophysics, 58(12): 1530–1542, doi: 10.1016/j.rgg.2017.11.013 Mohwinkel D, Kleint C, Koschinsky A. 2014. Phase associations and potential selective extraction methods for selected high-tech metals from ferromanganese nodules and crusts with siderophores. Applied Geochemistry, 43: 13–21, doi: 10.1016/j.apgeochem.2014.01.010 Müller R D, Sdrolias M, Gaina C, et al. 2008. Age, spreading rates, and spreading asymmetry of the world's ocean crust. Geochemistry, Geophysics, Geosystems, 9(4): Q04006 Nakamura K, Horinouchi K, Shimomura R, et al. 2024. Geochemical insights into secular changes in the depositional environment of ferromanganese nodules in the western north Pacific. Deep-Sea Research Part I: Oceanographic Research Papers, 203: 104227, doi: 10.1016/j.dsr.2023.104227 Ren Jiangbo, Deng Yinan, Lai Peixin, et al. 2021. Geochemical characteristics and genesis of the polymetallic nodules in the Pacific survey area. Earth Science Frontiers (in Chinese), 28(2): 412–425 Ren Jiangbo, He Gaowen, Deng Xiguang, et al. 2022. Metallogenesis of Co-rich ferromanganese nodules in the northwestern Pacific: Selective enrichment of metallic elements from seawater. Ore Geology Reviews 143: 104778 Ren Jiangbo, He Gaowen, Yang Yong, et al. 2024. Ultraselective enrichment of trace elements in seawater by Co-rich ferromanganese nodules. Global and Planetary Change, 239: 104498, doi: 10.1016/j.gloplacha.2024.104498 Ren Jiangbo, He Gaowen, Yao Huiqiang, et al. 2016. Geochemistry and significance of REE and PGE of the cobalt-rich crusts from west Pacific Ocean Seamounts. Earth Science (in Chinese), 41(10): 1745–1757 Ren Yingzhi, Sun Xiaoming, Guan Yao, et al. 2019. Distribution of rare earth elements plus yttrium among major mineral phases of marine Fe-Mn crusts from the South China Sea and Western Pacific Ocean: a comparative study. Minerals, 9(1): 8 Ren Jiangbo, Yao Huiqiang, Yang Yong, et al. 2023. Critical metal enrichment in atypical hydrogenetic ferromanganese nodules: a case study in the Central Basin Ridge of the West Philippine Basin. Chemical Geology, 615: 121224, doi: 10.1016/j.chemgeo.2022.121224 Reykhard L Y, Shulga N A. 2019. Fe-Mn nodule morphotypes from the NE Clarion-Clipperton Fracture Zone, Pacific Ocean: comparison of mineralogy, geochemistry and genesis. Ore Geology Reviews, 110: 102933, doi: 10.1016/j.oregeorev.2019.102933 Sensarma S, Saha A, Hazra A. 2021. Implications of REE incorporation and host sediment influence on the origin and growth processes of ferromanganese nodules from Central Indian Ocean Basin. Geoscience Frontiers, 12(3): 101123, doi: 10.1016/j.gsf.2020.11.017 Shen Fangyu, Shi Xuefa, Bi Dongjie, et al. 2024. Geochemical characteristics of a ferromanganese nodule with a tooth nucleus from the northwestern Pacific: Implications for element migration between Fe-Mn (oxyhydr)oxide and biogenic apatite. Ore Geology Reviews, 166: 105925, doi: 10.1016/j.oregeorev.2024.105925 Surya P L, Durbar R, Nagender N B, et al. 2020. Anomalous phase association of REE in ferromanganese crusts from Indian mid-oceanic ridges: evidence for large scale dispersion of hydrothermal iron. Chemical Geology, 549: 119679 (查阅网上资料, 作者信息不确定, 请确认) Wang Zhonggang, Yu Xueyuan, Zhao Zhenhua, et al. 1989. Rare Earth Elements Geochemistry (in Chinese). Beijing: Science Press, 1–535 (查阅网上资料, 未找到对应的英文翻译, 请确认) Wegorzewski A V, Kuhn T. 2014. The influence of suboxic diagenesis on the formation of manganese nodules in the Clarion Clipperton nodule belt of the Pacific Ocean. Marine Geology, 357: 123–138, doi: 10.1016/j.margeo.2014.07.004 Wu Xiaoping, Zhao Guangtao, Xu Cuiling, et al. 2023. Mineralogical and geochemical characteristics and genesis of subsurface buried manganese nudule from discol experiment area of Peru Basin in Southeastern Pacific. Periodical of Ocean University of China (in Chinese), 53(2): 94–106 Xu Zhaokai, Li Anchun, Yu Xinke, et al. 2008. Elemental occurrence Phases of the new-type ferromanganese crusts from the East Philippine Sea. Earth Science-Journal of China University of Geosciences (in Chinese), 33(3): 329–336, doi: 10.3799/dqkx.2008.043 Yang Kehong, Dong Yanhui, Li Zhenggang, et al. 2024. Geochemistry of buried polymetallic nodules from the eastern Pacific Ocean: Implication for the depth-controlled alteration process. Marine Geology, 467: 107190, doi: 10.1016/j.margeo.2023.107190 Yin Zhengxin, Wang Haifeng, Han Jinsheng, et al. 2019. Comparison between the marginal-sea polymetallic nodules in South China Sea and ocean polymetallic nodules. Journal of Jilin University (Earth Science Edition) (in Chinese), 49(1): 261–277 Zhang Huan, Zhou Junming, Yuan Peng, et al. 2023. Highly positive Ce anomalies of hydrogenetic ferromanganese micronodules from abyssal basins in the NW and NE Pacific: implications for REY migration and enrichment in deep-sea sediments. Ore Geology Reviews, 154: 105324, doi: 10.1016/j.oregeorev.2023.105324 Zhong Yi, Chen Zhong, González F J, et al. 2017a. Composition and genesis of ferromanganese deposits from the northern South China Sea. Journal of Asian Earth Sciences, 138: 110–128, doi: 10.1016/j.jseaes.2017.02.015 Zhong Yi, Chen Zhong, González F J, et al. 2021. Insights into the origin of ferromanganese-rich deposits associated with South China Sea contourite depositional systems. Marine and Petroleum Geology, 133: 105257, doi: 10.1016/j.marpetgeo.2021.105257 Zhong Yi, Chen Zhong, Mo Aibin, et al. 2017b. Genetic types and elemental occurrence phases of ferromanganese nodules in the northern South China Sea. Journal of Tropical Oceanography (in Chinese), 36(2): 48–59 Zhou Jiao, Cai Pengjie, Yang Chupeng, et al. 2022. Geochemical characteristics and genesis of ferromanganese nodules and crusts from the Central Rift Seamounts Group of the West Philippine Sea. Ore Geology Reviews, 145: 104923, doi: 10.1016/j.oregeorev.2022.104923 -


 DownLoad:


 点击查看大图
计量
- 文章访问数: 31
- HTML全文浏览量: 11
- 被引次数: 0

