Key Laboratory of Marine Hazards Forecasting, National Marine Environmental Forecasting Center, Ministry of Natural Resources, Beijing 100081, China
2.
Key Laboratory of Physical Oceanography, College of Oceanic and Atmospheric Sciences, Ocean University of China, Qingdao 266100, China
Funds:
The National Natural Science Foundation of China under contract Nos. 42306255, 41976217; the National Key R&D Program of China under contract No. 2018YFA0605903.
Sea ice and snow are the most sensitive and important crucial components of the global climate system, affecting the global climate by modulating the energy exchange between the ocean and the atmosphere. The sea near Zhongshan Station in Antarctica is covered by landfast sea ice, with snow depth influenced by both thermal factors and wind. This region frequently experiences katabatic winds and cyclones from the westerlies, leading to frequent snow blowing events that redistribute the snow and affects its depth, subsequently impacting the thermodynamic growth of sea ice. This study utilizes the one-dimensional thermodynamic model ICEPACK was to simulate landfast sea ice thickness and snow depth near Zhongshan Station in 2016. Two parameterization schemes for snow blowing, the Bulk scheme and the ITDrdg scheme, were analyzed evaluated for their impact on snow depth. The results showed that simulations using snow blowing schemes more closely align with observed results, with the ITDrdg scheme providing more accurate simulations, evidenced by root mean square errors of less than 10 cm for both snow depth and sea ice thickness. Snow blowing also impacted the thermodynamic growth of sea ice, particularly bottom growth. The sea ice bottom increased by 9.0 cm using the ITDrdg scheme compared to simulations without the snow blowing, accounting for 12.5% of total sea ice bottom growth. Furthermore, snow blowing process also influenced snow ice formation, highlighting its primary role in affecting snow depth. Continued field observations of snow blowing are necessary to evaluate and improve parameterization schemes.
Figure 1. Map of the location of Zhongshan station (a) and the observation site on nearby landfast sea ice (b). The AWS were set up, and manual observations were carried out at the site.
Figure 2. Time series of hourly 2 m air temperature (a), wind speed (b) and daily cumulative snow precipitation (c) over the period between April 9 and November 22 in 2016, the dot lines indicate 0℃ (a) and 10 m/s (b).
Figure 3. The simulated snow depth using different snow blowing parameterization scheme and observed snow depth (a) and the snow depth difference between other experiments and the Crtl experiment (b). Obs means the manual observation of snow depth.
Figure 4. The simulated sea ice thickness using different snow blowing parameterization scheme and observed sea ice thickness. Buoy means the temperature buoy calculated sea ice thickness and obs means the manual observation of sea ice thickness.
Figure 5. The simulated sea ice temperature using different snow blowing parameterization scheme and observed sea ice temperature. Buoy means the temperature buoy observed sea ice temperature.
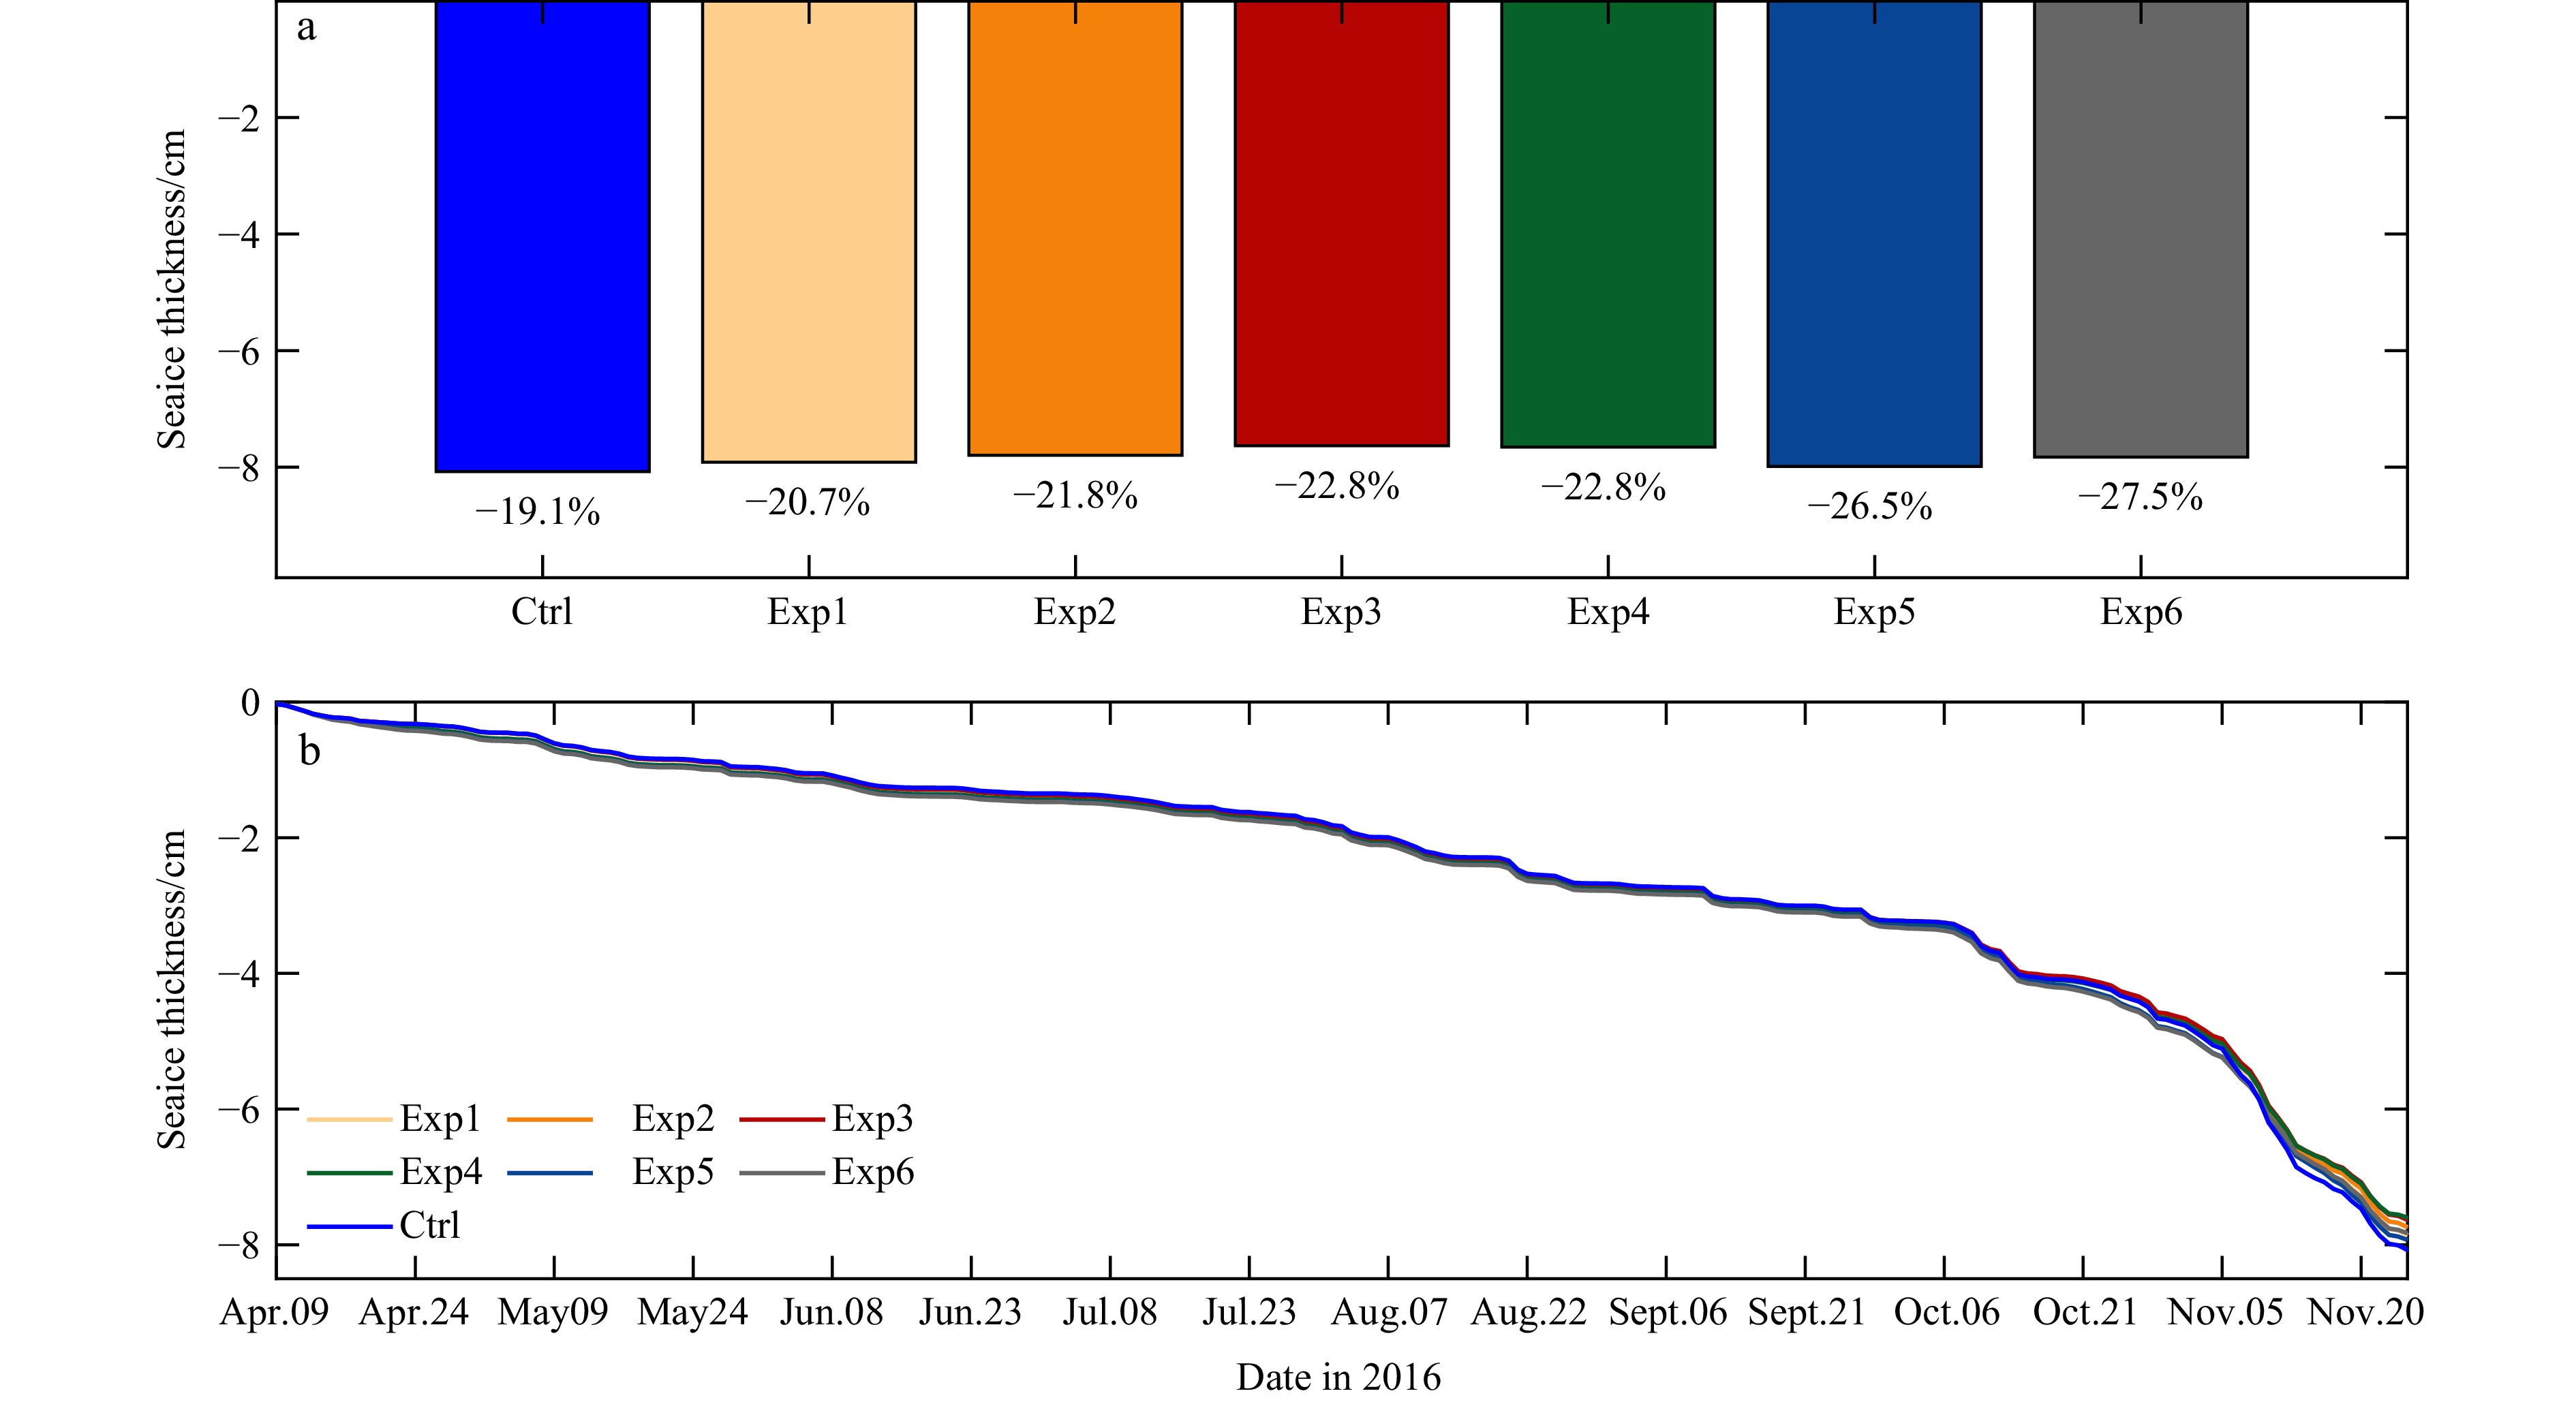
Figure 6. The simulated sea ice congelation (a) and the accumulated sea ice congelation over time (b) using different snow blowing parameterization scheme, the percentage indicates the ratio of sea ice congelation to the maximum simulated sea ice thickness in each experiment, respectively.
Figure 7. The simulated snow ice (a) and the accumulated snow ice over time (b) using different snow blowing parameterization scheme, the percentage indicates the ratio of snow ice to the maximum simulated sea ice thickness in each experiment, respectively.
Figure 8. The simulated snow sublimation (a) and the accumulated snow sublimation over time (b) using different snow blowing parameterization scheme, the percentage indicates the ratio of snow sublimation to the maximum simulated snow depth in each experiment, respectively.
Figure 9. The simulated snow melting (a) and the accumulated snow melting over time (b) using different snow blowing parameterization scheme, the percentage indicates the ratio of snow melting to the maximum simulated snow depth in each experiment, respectively.
Figure 10. The simulated sea ice bottom melting (a) and the accumulated sea ice bottom melting over time (b) using different snow blowing parameterization scheme, the percentage indicates the ratio of sea ice bottom melting to the maximum simulated sea ice thickness in each experiment, respectively.


 DownLoad: