National and Provincial Joint Engineering Research Centre for Marine Germplasm Resources Exploration and Utilization, Zhejiang Ocean University, Zhoushan 316022, China
2.
Marine Science and Technology College, Zhejiang Ocean University, Zhoushan 316022, China
Funds:
The National Natural Science Foundation of China under contract 42171069 and 41976121.
Despite most eel gobies (Gobionellidae: Amblyopinae) have inhabited brackish or marine waters, few species (such as Taenioides sp.) have been found to invade multiple inland freshwaters via artificial water transfer projects. The habitat transfers from brackish water to freshwater zones of Taenioides sp. have caused severe damage to Chinese aquatic ecosystems in recent years. Unfortunately, the molecular mechanism underlying freshwater invasion remains poorly understood. Considering changes of environment factors, especially salinity, are bound to adjust the demands for energy affected by mitochondria via oxidative phosphorylation, 13 Amblyopinae mitogenomes were compared, including the newly assembled Taenioides sp. mitogenome in this study. Comparative mitogenomic analyses revealed a highly conserved structure, composition and arrangements, with the exception of variable control region (CR). All of the CRs possessed tandem repeat sequences except Trypauchenopsis sp. G341, differing in motifs and number of copies, which was the dominant factor resulting in length heterogeneity of CR. The phylogenetic trees reconfirmed the paraphyletic origin of Amblyopinae with respect to Oxudercinae, supporting that these two subfamilies should be merged as an expansion of phenotypic variation within the “terrestrial goby” clade. Furthermore, four protein coding genes (COI, ND3, ND5 and Cyt b) in Taenioides sp. mitogenome have experienced adaptive evolution, indicating their important roles in enhancing the efficiency of ATP production to cope with the osmotic regulation adjustment and reach its current widespread distribution in multiple inland freshwaters of China. These results revealed the functional importance of mitochondrial genes, and provided fresh insights into the molecular mechanisms underlying the freshwater invasion. Also, our results may provide critical reference value for the future control of other invasive species.
Mitochondrion is the primary location to produce adenosine triphosphate (ATP) in almost all eukaryotic cells, which provides about 95% of the energy required for the fundamental activities of life through oxidative phosphorylation (OXPHOS) (Kadenbach, 2021; Mao et al., 2024). Increasing number of studies have uncovered that mitochondrial protein-coding genes (PCGs) experienced stronger functional constraints in animals that possess higher energy demands, such as long-distance migratory birds and mammals (Da Fonseca et al., 2008; Sun et al., 2011), flying bats and insects (Shen et al., 2010; Chang et al., 2020), and creatures living in extreme environments (Luo et al., 2008; Ning et al., 2010; Li et al., 2019). For example, the mitochondrial PCGs of migratory fishes exhibit significantly smaller Ka/Ks value than that of non-migratory fishes, indicating a stronger selective constraints on the mitochondrial genome (mitogenome) in migratory fishes (Sun et al., 2011). Similar results were found in fishes that live under different temperature environment, namely fishes living in cold climates have smaller Ka/Ks than that of tropical fishes, because fishes live in colder zones need greater heat production to elevate their body temperatures (Sun et al., 2011). A recent study reported that almost half of the mitochondrial PCGs in the flying fishes had remarkably smaller mean ω ratio than that of the non-flying fishes, indicating that flying fishes have undergone stronger selective constraints than non-flying fishes to elevate efficient energy metabolism to adapt to flight behavior (Ding et al., 2023). These results highlight the importance of mitochondrial protein-encoding genes in the attainment of strong locomotion by adapting to greater energy demands.
Eel gobies (Gobionellidae: Amblyopinae) typically live in the muddy bottoms of estuaries or in the burrows of tidal mudflats, which are the largest group of marine fishes representing unique adaptation to terrestrial life (Nelson et al., 2016). Despite this group are known to inhabit brackish and/or sea water for their whole life cycle, few species also can be found in freshwater areas occasionally or even permanently. Taenioides sp., for instance, was originally known to inhabit muddy bottoms of brackish waters in coastal areas of China; while recent studies reported that it has begun to invade multiple inland freshwaters including rivers, lakes, and reservoirs. Lakes such as Taihu, Luoma, Gaoyou, Nansi in China and their nearby regions have become the most affected areas (Yao et al., 2022; Sun et al., 2024). Up to now, most of the researches have tried to uncover the genetic mechanisms underlying adaptation ability to terrestrial life (Steppan et al., 2022; Liu et al., 2023; Lü et al., 2023), few studies have focused on their adaptations to fresh waters (Sun et al., 2024). The molecular mechanism underlying freshwater invasion remains largely unknown. However, the explosive growth of Taenioides sp. has been regarded as a severe threat to local benthic organisms, and it may cause further damage to the whole ecosystem. Hence, focusing on the freshwater adaptation and revealing the underlying molecular basis is becoming a burning issue.
The habitat transfers from brackish water (most Amblyopinae species) to freshwater zones (a small minority, such as Taenioides sp.), eel gobies in the face of severe change in salinity and osmotic regulation ability, are bound to adjust the demands for energy. Considering mitochondria are the key organelles involved in energy metabolism, and they are exquisitely sensitive to environmental changes (Vakifahmetoglu-Norberg et al., 2017; Ji et al., 2023), we intend to reveal the adaptation basis of Taenioides sp. from the original brackish water to freshwater from mitogenomic perspective. In the present study, the complete mitogenome of Taenioides sp. was assembled and annotated for the first time. Combined with the published Amblyopinae mitogenomes, the mitogenomic characteristics and control region structure were comparatively analyzed. Also, the phylogenetic relationship of this subfamily and the potential positive selection signals in Taenioides sp. were elucidated. These results will not only contribute to better understanding the evolutionary characteristics of Amblyopinae mitogenomes, but also provide insights into freshwater adaptation in few species of this group.
2.
Materials and methods
2.1
Sample collection, PCR amplification and sequencing
The specimen was collected from the Gaoyou Lake, Jiangsu Province, China (32˚51'31''N, 119˚23'38''E) using ground cages. Several key morphological features, including number of vertebrae, barbels on the ventral surface of head, and dorsal-fin elements were counted for morphological identification. Partial mitochondrial COI sequence was also obtained for molecular identification. Total genomic DNA was extracted using a standard phenol-chloroform method from muscle tissue. A series of primer pairs (Table S1) were designed to amplify the complete mitogenome according to the following procedures: PCR was conducted in 25 μL volume containing 25 ng template DNA, 2.0 mmol/L MgCl2, 0.4 mmol/L of each dNTP, 0.5 mmol/L of each primer, 1.0 U of Taq polymerase (Takara, Beijing, China), 2.5 μL of 10× Taq buffer. The PCR cycling conditions included an initial denaturation at 94℃ for 2 min, followed by 35 cycles at 94℃ for 45 s, an annealing temperature of 46−55℃ for 45 s, elongation at 68−72℃ for 1−3 min, and a final extension at 72℃ for 10 min. PCR products were sequenced using Sanger sequencing at Invitrogen Ltd., Shanghai, China.
2.2
Mitogenome assembly, annotation and analysis
The gene fragments were assembled to a complete mitogenome using CodonCode Aligner 5.1.5 (CodonCode Corporation, Dedham, MA). The assembled mitogenome was annotated with the help of Sequin (version 15.10, http://www.ncbi.nlm.nih.gov/Sequin/). Transfer RNA (tRNA) genes were identified using tRNAscan-SE 1.21 (Chan et al., 2021). The boundaries of PCGs and ribosomal RNA (rRNA) genes were determined using NCBI-BLAST (http://blast.ncbi.nlm.nih.gov). The circular mitogenome maps of 13 Amblyopinae species was performed using the CG View Comparison Tool (CCT). The base composition was calculated using MEGA X (Kumar et al., 2018). The tandem repeat sequence of the control region (CR) was identified by Tandem Repeats Finder (Benson, 1999). The CR sequences were aligned using Clustal X 2.0 (Larkin et al., 2007) and manually checked with BioEdit (Hall, 1999).
2.3
Phylogenetic analysis
Thirteen Amblyopinae mitogenomes and 14 Oxudercinae mitogenomes were included to reconstruct the phylogenetic relationships, adding two Sicydiinae species as the outgroups. The nucleotide sequences of 13 PCGs were extracted, concatenated and aligned for phylogenetic analyses. Phylogenetic trees were constructed under maximum likelihood (ML) and Bayesian inference (BI) methods using PhyloSuite (Zhang et al., 2020). The ML analysis was conducted using IQ-TREE (Nguyen et al., 2015), under an ML+rapid bootstrap (BS) algorithm with 1 000 replicates. The BI analysis was conducted in MrBayes 3.2.6 with four metropolis-coupled Markov Chain Monte Carlo (MCMCMC) running for 3×10⁶ generations (Ronquist et al., 2012). The trees were sampled every 1 000 generations with a burn-in of 25%. The average standard deviation of split frequencies was set below 0.01 to guarantee the stationarity.
2.4
Positive selection analysis
Considering that mitochondria supply about 95% of adenosine triphosphate (ATP) to maintain the fundamental activities of organism via OXPHOS, we focused on the 13 PCGs to test whether adaptive evolution of energy metabolism-related genes occurred in Taenioides sp. mitogenome. Among the above phylogenetic tree, Taenioides sp. has adapted to fresh waters throughout the lifecycle, while almost all of its closely related species remain their adaptations to brackish or seawaters. So Taenioides sp. was selected as the only foreground representative, eight brackish-adapted relatives were selected as the background representatives, to examine whether selection pressures differed between these two taxa adapting to divergent salinity environments.
The nonsynonymous to synonymous ratio (dn/ds or ω) calculated by CODEML program of the PAML package (v.4.8) (Yang, 2007) has been widely used to reflect changes in selection pressure at the protein level. Both branch model and branch-site model were adopted to detect the possible positive selection signs. The “two ratios” (M2) model was used, which supposes that foreground and background branches have different ω ratios in the branch model. Conversely, the “one-ratio” (M0) model, which assumes an identical ω value for all branches, was also adopted to compare with the M2 model. Then likelihood ratio test was used to compare the M2 model with M0 model. Chi-square (χ2) test was used to determine whether M2 model was significantly better than M0 model with the threshold P value less than 0.05. Given that the positive selection signs may be equalized among the whole branches due to very short evolutionary episodes, the branch-site model was also used to examine the potential positive selection sites in Taenioides sp. mitogenome. Model A (model = 2, NSsites = 2, fix_omega = 0, omega = 5) and the null model (model = 2, NSsites = 2, fix_omega = 1, omega = 1) were compared. All sites with a posterior ratio greater than 0.75 were regarded as possible positive selection sites using Bayes Empirical Bayes analysis in CODEML (Yang, 2007).
3.
Results and discussion
3.1
Overall characteristics of Amblyopinae mitogenomes
The complete mitogenome of Taenioides sp. (GenBank accession number MK541900) was a closed-circular molecule of 17 069 bp in length. The mitogenomic structure and gene composition were typical with other Gobionellidae mitogenomes (Huang et al., 2016; Gong et al., 2018; Lü et al., 2023), which included 13 PCGs, 22 tRNA genes, 2 rRNA genes and a long non-coding CR. The mitogenome size, nucleotide composition and base skewness of 13 Amblyopinae species were compared. The mitogenomes have obvious variation in length, varying from 16 552 bp (Paratrypauchen microcephalus and Ctenotrypauchen chinensis) to 17 245 bp (Odontamblyopus lacepedii) (Table 1). All mitogenomes are slightly AT biased, with the AT content ranging from 54.9% (Taenioides sp.) to 57.4% (Odontamblyopus lacepedii and Odontamblyopus rebecca) (Table 1). AT-skew and GC-skew were consistent with most metazoan mitogenomes, i.e., the former shows a positive value and the latter shows a negative value (Wang et al., 2023; Zhang et al., 2023). Using Taenioides sp. mitogenome as the reference sequence, the mitogenomic structure and sequence conservation of 13 Amblyopinae mitogenomes were compared via CCT. As a whole, the Amblyopinae mitogenomes were quite conserved in structure and sequence, especially Taenioides gracilis, Taenioides anguillaris, Odontamblyopus rubicundus (maybe misidentification) and Taenioides sp. XM-2018 (the outermost four circles). Reversely, the non-coding CR shared lower sequence similarity, indicating a rapid evolutionary rate (Fig. 1).
Table
1.
List of 13 Amblyopinae species compared in this paper
Figure
1.
Comparative analyses of 13 Amblyopinae mitogenomes. The intensity of the ring color indicates the degree of sequence conservation. The innermost ring to the outermost is presented as follows: Odontamblyopus rebecca, Odontamblyopus lacepedi, Odontamblyopus sp. ZL-2016, Trypauchenopsis sp. G341, Paratrypauchen microcephalus, Trypauchen vagina, Ctenotrypauchen chinensis, Amblyotrypauchen arctocephalus, Taenioides sp. CHY-2020, Taenioides gracilis, Taenioides anguillaris, Odontamblyopus rubicundus and Taenioides sp. XM-2018.
The codon usage of 13 PCGs were compared. There were four types of start codons in Gobionellidae mitogenomes. ATG was the most frequently used start codon almost occurring in all PCGs, followed by GTG and ATA. ATT was an unusual start codon found exclusively in Taenioides sp. mitogenome (COI). By contrast, types of stop codons were more abundant. TAA was the most frequently used complete stop codon, followed by the complete TAG and AGG. AGA was a seldom used stop codon occurring exclusively in Taenioides sp. mitogenome (ND5). The usage of incomplete stop codons (T or TA) was a quite common phenomenon in metazoan mitogenomes. Here, these two types of incomplete stop codons existed in seven PCGs (ND2, ND3, ND4, COII, COIII, ATP6 and Cyt b) (Table S2).
3.2
Control region structure
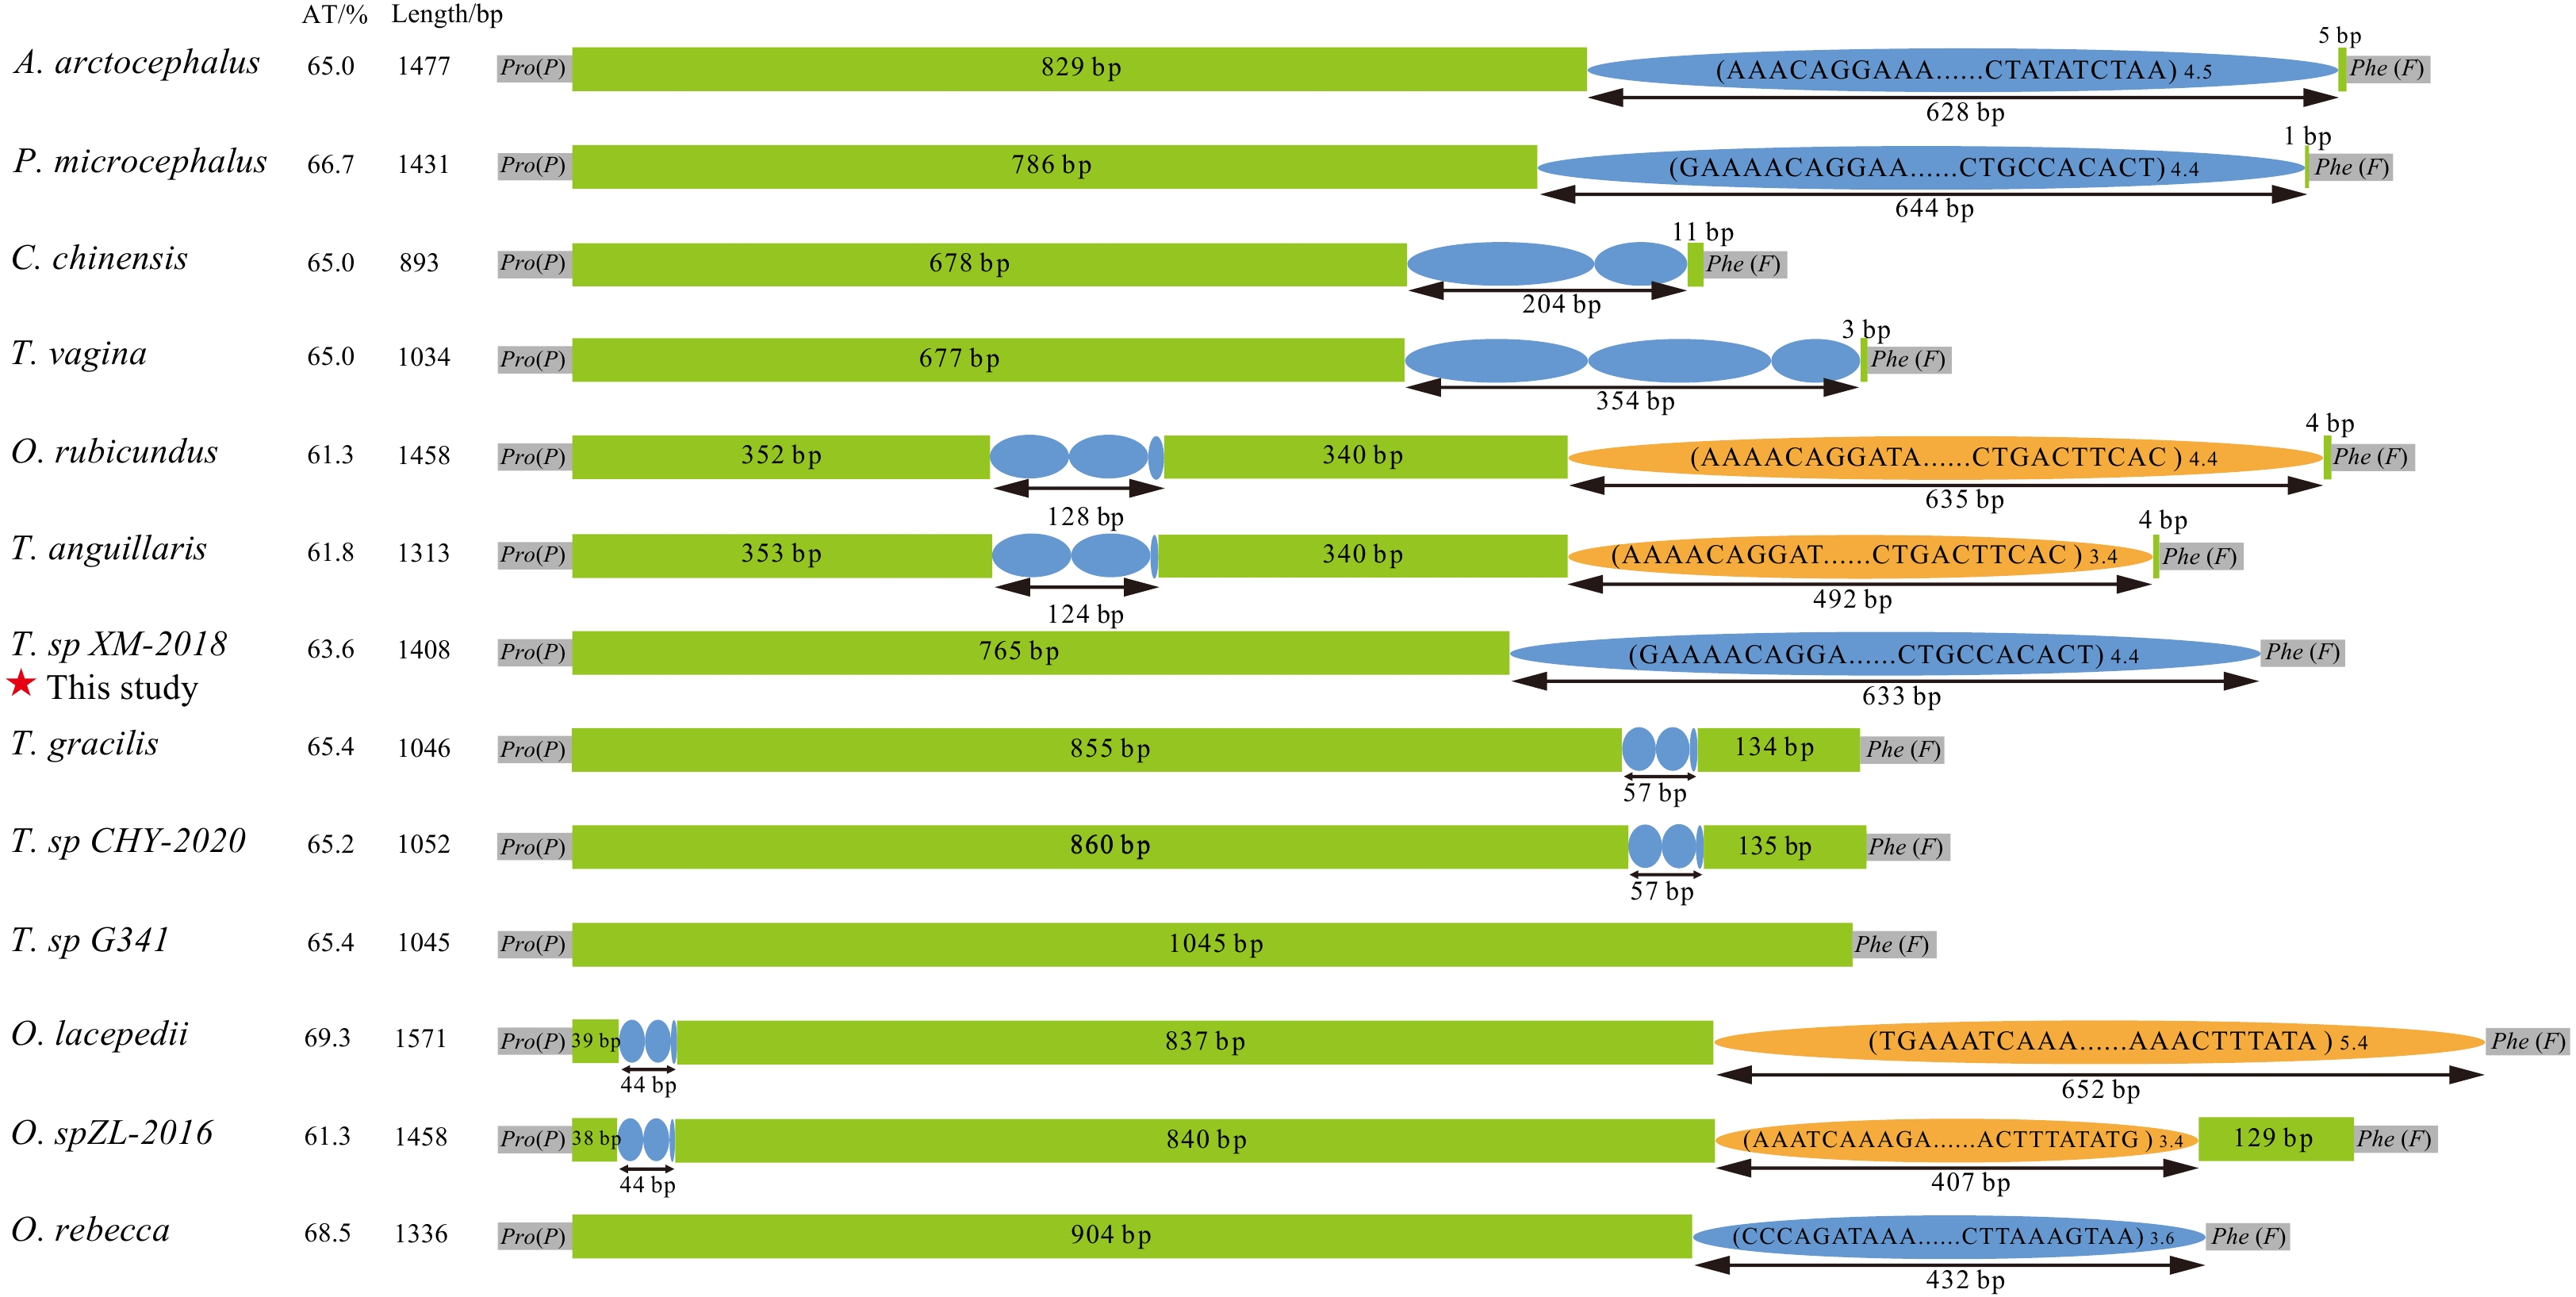
The long non-coding CR was located between tRNA-Pro and tRNA-Phe genes in 13 Amblyopinae mitogenomes. The length ranged from 893 bp (Ctenotrypauchen chinensis) to 1 571 bp (Odontamblyopus lacepedii). Typically, CR is characterized with AT-biased sequence, higher than that of the complete mitogenome (Zhang et al., 2022; Hu et al., 2024). Here, AT content of the CR varied from 61.3% (Odontamblyopus rubicundus and Odontamblyopus sp. ZL-2016) to 69.3% (O. lacepedii), moderately higher than that of the whole mitogenome (Fig. 2). CR is the fastest evolving region among all mitogenomic genes due to relaxed constraints, hence it usually has more variable sequences (Chang et al., 2020). In order to explore the structure and sequence features of CR, comparative analyses of 13 Amblyopinae CRs showed that all of them possessed tandem repeat (TR) sequences except Trypauchenopsis sp. G341. Most of the TRs occurred in the 3’-end of CR, differing in motifs and number of copies, which ranges from 19 bp to 144 bp and 1.5 to 5.4 copies, respectively. Further analysis shows that the difference of TRs is the dominant factor resulting in length heterogeneity of CR (Fig. 2).
Figure
2.
Comparative analyses of the organization of 13 Amblyopinae CRs. Purple and orange ellipses indicate the tandem repeat units; the remaining regions are shown in green boxes. The tandem repeat with copy number is displayed in the format of (motif) n.
Despite CR ranks the most rapidly evolving region with highly variable sequences, several typically conserved structures were identified in Amblyopinae mitogenomes. The TAS motif is generally situated at the 5’-end of the CR with a conventional TAS-complementary TAS block, i.e., TAS-cTAS: TACAT--ATGTA. Here, except for Paratrypauchen microcephalus, the remaining species captured an almost identical TAS block in the same position (Fig. 3). Most of the central conserved blocks (CSB-F, E, D, C and B) were hardly recognizable, even the extremely conserved G-box (GTGGGGG) was lost, indicating Amblyopinae CRs are undergoing a rapid evolutionary process. With the help of pyrimidine tract (TTATTTTT-TTT-TYYTCYTTT) as a landmark, the adjoining CSB-A was easily recognized with a conserved sequence CATCCTAAAGGACATGG (Fig. 3). By contrast, the CSB-1, 2 and 3 blocks were relatively conservative, which were confirmed at the 3’-end of the CR. Their consensus sequences were as follows: CSB-1: ATAACTGAT-TCATGAGCATAAA; CSB-2: AAA-CCCCCCTACCCCC; CSB-3: TGAAAACCCCCCGGAAA-CAG (Fig. 3).
Figure
3.
Aligned sequences of 13 Amblyopinae CRs. The shaded blocks indicate the conserved sequences. Abbreviations of species names are given as follows: A.arc: Amblyotrypauchen arctocephalus; P.mic: Paratrypauchen microcephalus; C.chi: Ctenotrypauchen chinensis; T.vag: Trypauchen vagina; O.rub: Odontamblyopus rubicundus; T.ang: Taenioides anguillaris; T.sp1: Taenioides sp. XM 2018; T.gra: Taenioides gracilis; T.sp2: Taenioides sp. CHY 2020; T.sp3: Typauchenopsis sp. G341; O.lac: Odontamblyopus lacepedi; O.sp: Odontamblyopus sp. ZL-2016; O.reb: Odontamblyopus rebecca.
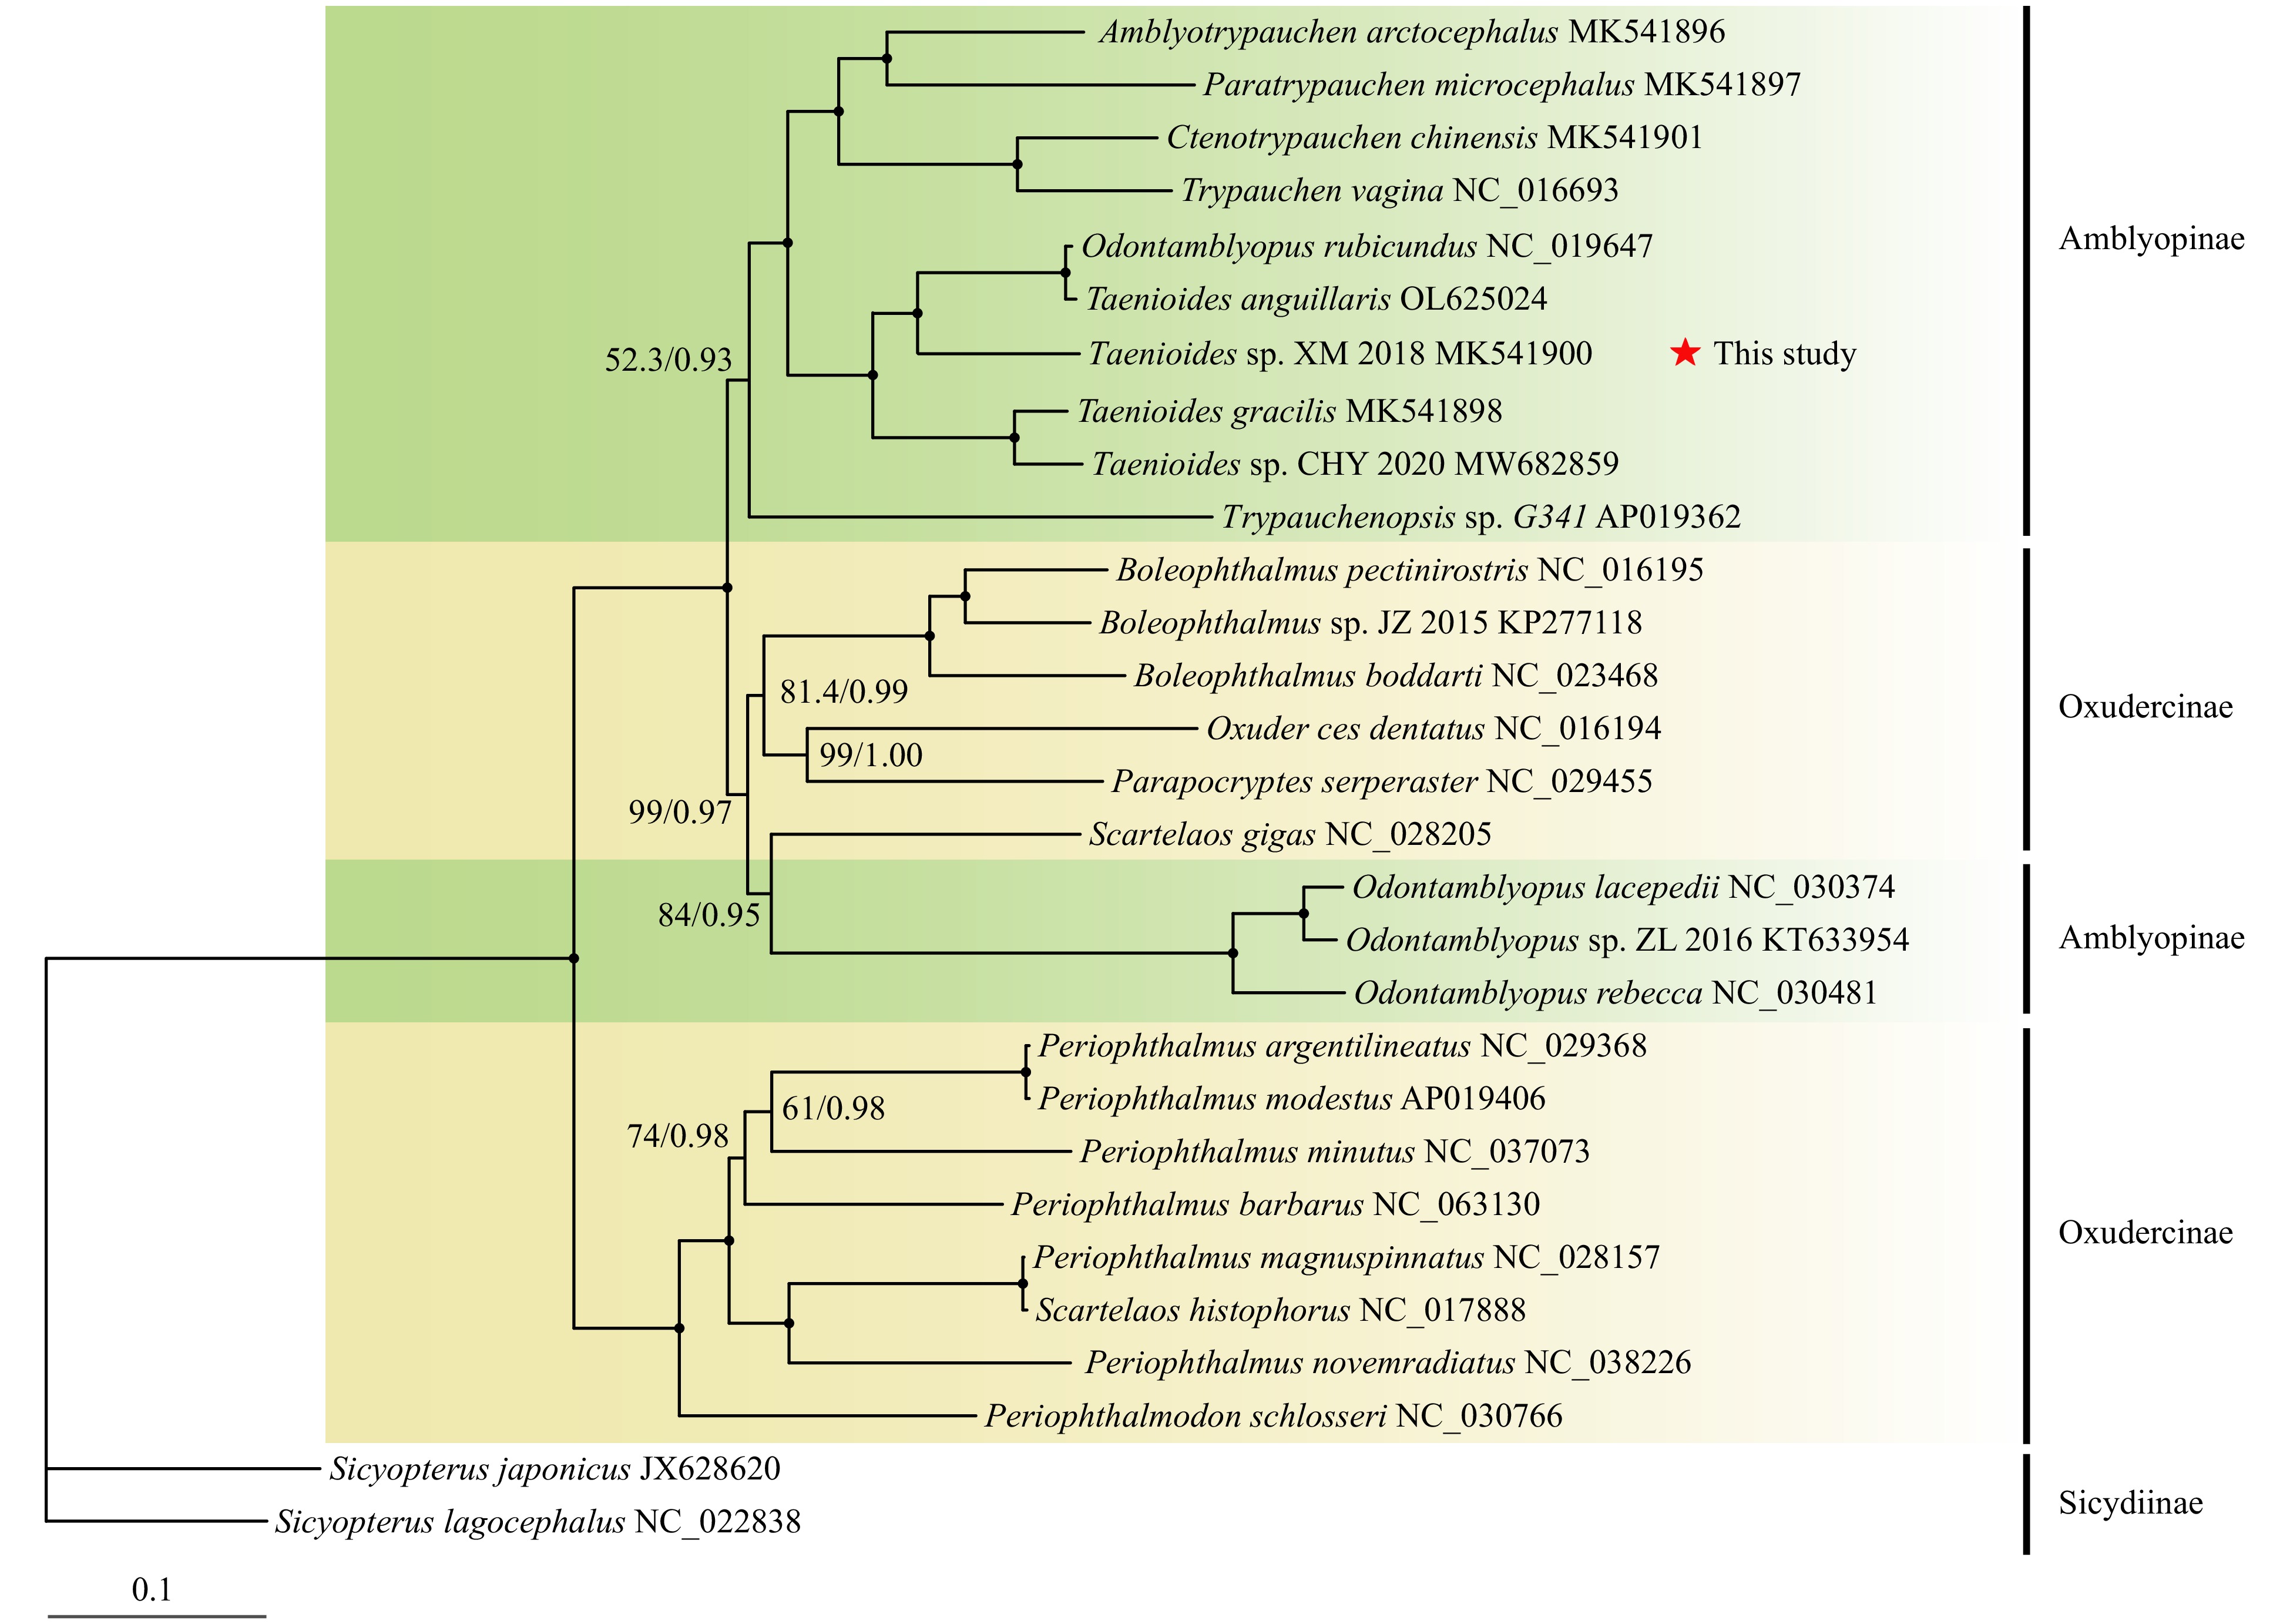
In order to clarify the evolutionary position of Taenioides sp. and the origin of Amblyopinae, 13 representatives from Amblyopinae and 14 closely related representatives from Oxudercinae were included for phylogenetic reconstruction. Both ML and BI inference trees based on 13 PCGs yielded consistent topologies with high level of supporting values. The phylogenetic trees showed that Taenioides sp. was most closely related to Taenioides anguillaris. Significantly, T. anguillaris formed a closer relationship with Odontamblyopus rubicundus rather than the same genus Taenioides, while all Taenioides species formed a clade, which raises a possibility of a mistaken identity of O. rubicundus (Fig. 4). Hence, we compared the sequence similarity of COI gene among Taenioides clade and O. rubicundus. The results showed that the maximum sequence similarity existed between T. anguillaris and O. rubicundus, the corresponding genetic distance was 0.0103. According to Hebert’s barcoding law, the genetic distance value between different species will typically surpass 0.02 (Hebert et al., 2003a; 2003b). Here, the value between T. anguillaris and O. rubicundus (0.0103) was far less than Hebert’s 0.02. Furthermore, these two complete mitogenomes were also highly similar except for the subtle differences in CR. Excluding the CR, the sequence similarity of these two complete mitogenomes was up to 99.4%, which strongly suggested that O. rubicundus might be a misidentification of T. anguillaris.
Figure
4.
The phylogenetic relationship between Amblyopinae and their closely related Oxudercinae. The node labelled with a solid circle indicates 100 maximum likelihood bootstrap support and 100% Bayesian inference posterior probability. The numbers on the branches are bootstrap support for ML analyses (left) and posterior probability (right) for Bayesian inference.
Regarding the origin of Amblyopinae and Oxudurcinae, both trees displayed that these two subfamilies were divided into two clades. In Amblyopinae group, three Odontamblyopus species formed a closer relationship with the subfamily Oxudercinae, while not clustering with other Amblyopinae species. Likewise, the genus Periophthalmus, Periophthalmodon and Scartelaos formed a closer relationship with the subfamily Amblyopinae, rather than with other species from the same subfamily Oxudercinae (Fig. 4). These results strongly corroborate those of previous studies that Amblyopinae and Oxudercinae form a clade and that neither is monophyletic with respect to the other (Ghanbarifardi and Lagzian, 2019; Steppan et al., 2022; Lü et al., 2023). Murdy (1989) created the first comprehensive phylogeny of Oxudurcinae based on morphological characters and subsequently identified Ambylopinae as their sister group (Murdy, 2012). Clearly, this classification system conflicts strongly with the increasing number of molecular studies, which suggests that these two subfamilies should be merged and proposes an expansion of phenotypic variation within the “terrestrial goby” clade (Tornabene et al., 2013; Steppan et al., 2022; Lü et al., 2023).
3.4
Positive selection analysis
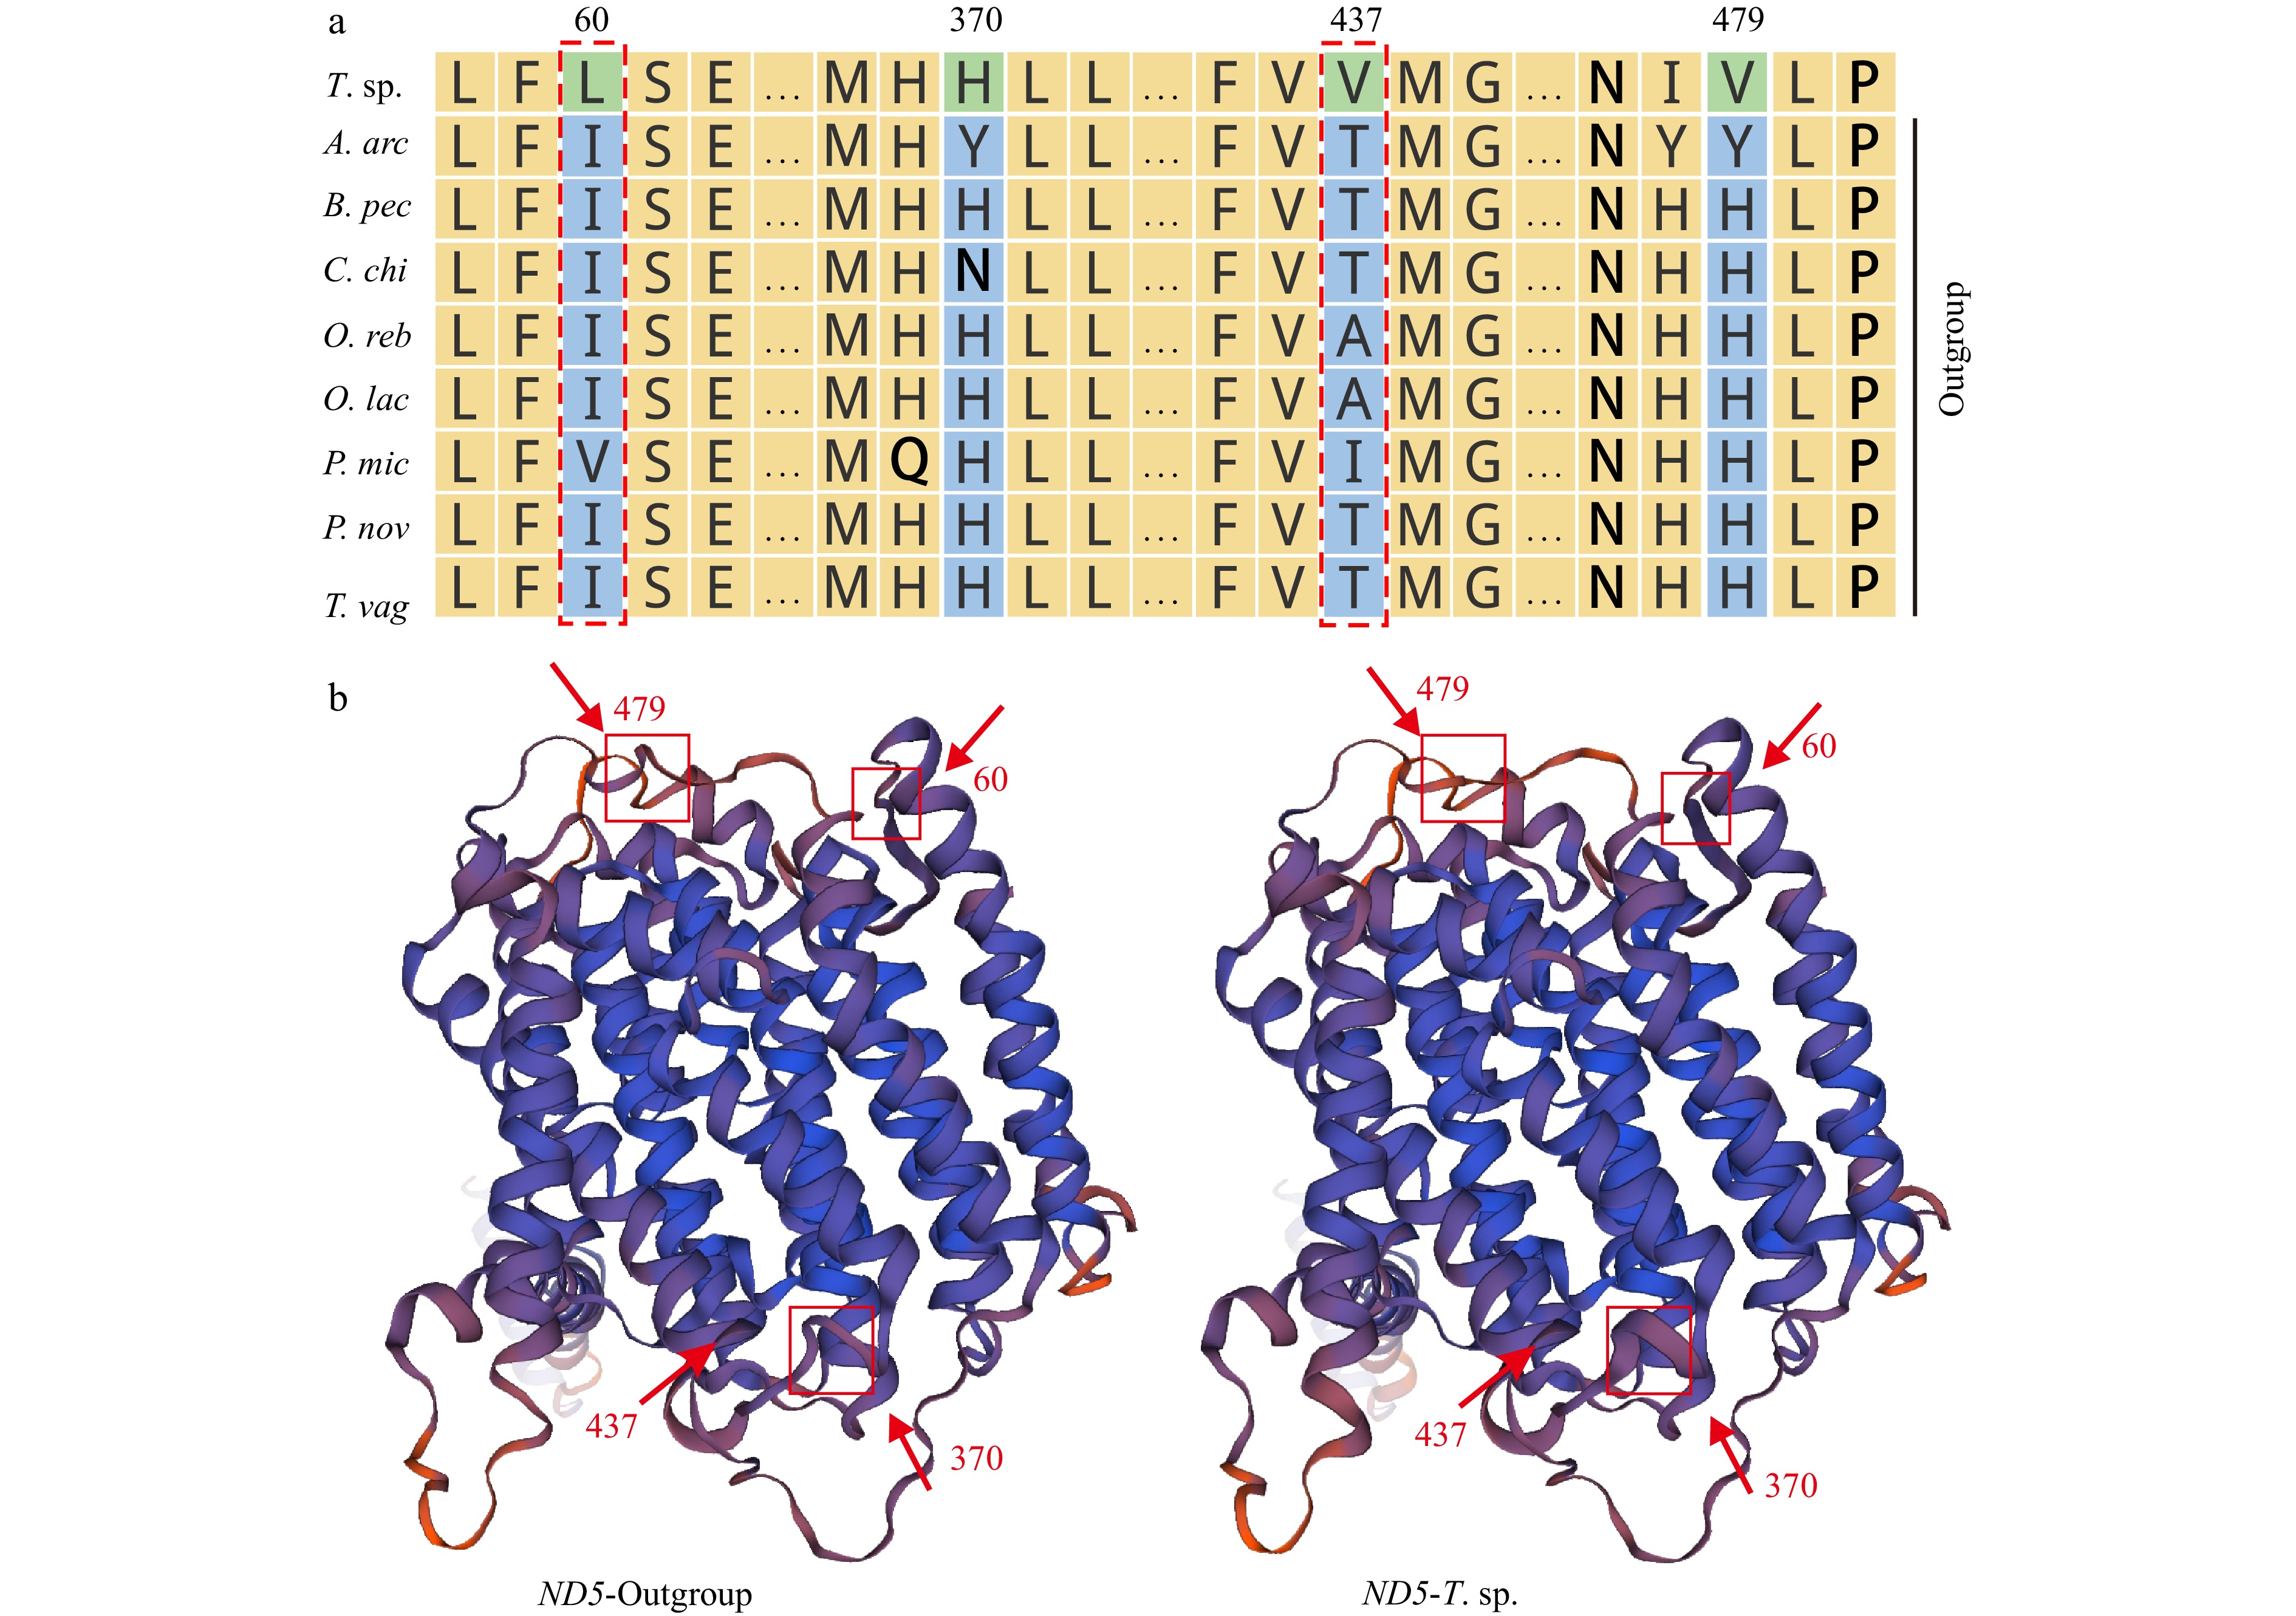
The overwhelming majority of eel gobies live in brackish water or sea water, few species are adapted to live in fresh water. In order to reveal the underlying molecular basis of freshwater adaptation, the selection pressure on 13 PCGs was evaluated. Both branch model and branch-site model were used for positive selection analysis. In branch model, the average ω ratio for all PCGs was significantly less than 1 under the one-ratio model (M0), indicating that all PCGs in the sampled Amblyopinae and their relatives Oxudercinae mitogenomes have evolved under strong functional constraints (Table S3). Further, selecting Taenioides sp. as foreground, eight species adapting to brackish water exclusively from Amblyopinae and Oxudercinae as background, the average ω ratio under the two-ratio model (M2) was calculated. It showed that the ω value of eight PCGs (COI, COIII, ND1, ND3, ND4L, ND5, ND6 and Cyt b) in the foreground clade was higher than that in the background clade, suggesting that these genes have been positively selected in Taenioides sp. mitogenome (Table S3). However, all the P-values were larger than 0.05, which means that all the differences were not significant. Accordingly, the branch-site model was further adopted to detect the potential positive selection sites in individual codon of the 13 PCGs. It showed that six residues in four PCGs, i.e., COI (V484T), ND3 (I20A), ND5 (I60L, T437V), and Cyt b (M125A, L320M), were inferred as positively selected sites in the foreground branch with posterior probabilities larger than 0.75 (Table 2). One third of the amino acids variations resulted in changes in the physicochemical property of proteins, including their polarity and hydrophilicity (Table S4). We further predicted the three-dimensional structure of the PCGs, which showed that the positively selected sites and their adjacent sites have largely affected the structure of ND5 in complex I of the mitochondrial respiratory chain (Fig. 5).
Table
2.
CODEML analyses of selective pressure on 13 PCGs in Taenioides sp. Mitogenome
Note: * indicates the positive selected site in Taenioides sp. clade with a statistical significance of P value less than 0.05, using LRT tests in branch-site model.
Figure
5.
The sequence alignment (a) and predicted three-dimensional protein structure of ND5 in freshwater-adapted Taenioides sp. and its closely related species inhabiting brackish and/or sea water (b). The positively selected sites were marked with red dotted box (a). Red squares represent the changes in the three-dimensional structure; numbers show the position of changes (b).
Mitochondrial protein-coding genes are mainly involved in OXPHOS for production of ATP for various physiological activities and biochemical reactions in organisms. Due to their essential roles in cellular energy production, the mitochondrial PCGs are considered broadly conserved. Actually, a flood of studies has confirmed that they typically evolved under strong purifying selection (Zhang et al., 2022; Graham et al., 2024). Nevertheless, there is statistically significant evidence of positive selection associated with enduring energy demands or colonization of new habitats (Xia et al., 2018; Sebastian et al., 2022; Ding et al., 2023; Nachtigall et al., 2023). For example, studies have revealed that several mitochondrial PCGs were under strongly positive selection in freshwater bony fishes when compared to saltwater bony fishes. They explained that amino acid mutations in mitochondrial PCGs may be related to metabolic advantages, in organisms that have evolved originally from saltwater, thereby affecting their ability to colonize the freshwater habitat (Sebastian et al., 2022; Nachtigall et al., 2023). In the present study, a total of six sites in four PCGs (i.e., COI, ND3, ND5 and Cyt b) were detected positively selected in the freshwater-adapted Taenioides sp. clade. Some of them will cause amino acid property or protein structure changes, implying functional alterations of these mitochondrial PCGs in Taenioides sp. that guarantee adjustment for equilibrium pressure in freshwater habitat. The habitat transfer from brackish water to freshwater zones will be inevitably involved in the changes of osmotic pressures, which requires more energy in response to the balance of salinity changes. In this sense, our study is in agreement with previously published studies uncovering the significance of OXPHOS genes in the adaptive evolutionary processes of colonization of heterogeneous habitats (Sun et al., 2011; Romero et al., 2016; Sebastian et al., 2020), including the freshwater invasion of Taenioides sp. in this study.
Note: * indicates the positive selected site in Taenioides sp. clade with a statistical significance of P value less than 0.05, using LRT tests in branch-site model.
Figure 1. Comparative analyses of 13 Amblyopinae mitogenomes. The intensity of the ring color indicates the degree of sequence conservation. The innermost ring to the outermost is presented as follows: Odontamblyopus rebecca, Odontamblyopus lacepedi, Odontamblyopus sp. ZL-2016, Trypauchenopsis sp. G341, Paratrypauchen microcephalus, Trypauchen vagina, Ctenotrypauchen chinensis, Amblyotrypauchen arctocephalus, Taenioides sp. CHY-2020, Taenioides gracilis, Taenioides anguillaris, Odontamblyopus rubicundus and Taenioides sp. XM-2018.
Figure 2. Comparative analyses of the organization of 13 Amblyopinae CRs. Purple and orange ellipses indicate the tandem repeat units; the remaining regions are shown in green boxes. The tandem repeat with copy number is displayed in the format of (motif) n.
Figure 3. Aligned sequences of 13 Amblyopinae CRs. The shaded blocks indicate the conserved sequences. Abbreviations of species names are given as follows: A.arc: Amblyotrypauchen arctocephalus; P.mic: Paratrypauchen microcephalus; C.chi: Ctenotrypauchen chinensis; T.vag: Trypauchen vagina; O.rub: Odontamblyopus rubicundus; T.ang: Taenioides anguillaris; T.sp1: Taenioides sp. XM 2018; T.gra: Taenioides gracilis; T.sp2: Taenioides sp. CHY 2020; T.sp3: Typauchenopsis sp. G341; O.lac: Odontamblyopus lacepedi; O.sp: Odontamblyopus sp. ZL-2016; O.reb: Odontamblyopus rebecca.
Figure 4. The phylogenetic relationship between Amblyopinae and their closely related Oxudercinae. The node labelled with a solid circle indicates 100 maximum likelihood bootstrap support and 100% Bayesian inference posterior probability. The numbers on the branches are bootstrap support for ML analyses (left) and posterior probability (right) for Bayesian inference.
Figure 5. The sequence alignment (a) and predicted three-dimensional protein structure of ND5 in freshwater-adapted Taenioides sp. and its closely related species inhabiting brackish and/or sea water (b). The positively selected sites were marked with red dotted box (a). Red squares represent the changes in the three-dimensional structure; numbers show the position of changes (b).


 DownLoad:

 DownLoad:


 DownLoad: