Anqi Liu, Feng Zhou, Xiao Ma, Qiang Zhao, Guanghong Liao, Yuntao Zhou, Di Tian, Xiaobo Ni, Ruibin Ding. Inter-annual variations of dissolved oxygen and hypoxia off the northern Changjiang River (Yangtze River) Estuary in summer from 1997 to 2014[J]. Acta Oceanologica Sinica. doi: 10.1007/s13131-023-2244-0
Citation:
Anqi Liu, Feng Zhou, Xiao Ma, Qiang Zhao, Guanghong Liao, Yuntao Zhou, Di Tian, Xiaobo Ni, Ruibin Ding. Inter-annual variations of dissolved oxygen and hypoxia off the northern Changjiang River (Yangtze River) Estuary in summer from 1997 to 2014[J]. Acta Oceanologica Sinica. doi: 10.1007/s13131-023-2244-0
Anqi Liu, Feng Zhou, Xiao Ma, Qiang Zhao, Guanghong Liao, Yuntao Zhou, Di Tian, Xiaobo Ni, Ruibin Ding. Inter-annual variations of dissolved oxygen and hypoxia off the northern Changjiang River (Yangtze River) Estuary in summer from 1997 to 2014[J]. Acta Oceanologica Sinica. doi: 10.1007/s13131-023-2244-0
Citation:
Anqi Liu, Feng Zhou, Xiao Ma, Qiang Zhao, Guanghong Liao, Yuntao Zhou, Di Tian, Xiaobo Ni, Ruibin Ding. Inter-annual variations of dissolved oxygen and hypoxia off the northern Changjiang River (Yangtze River) Estuary in summer from 1997 to 2014[J]. Acta Oceanologica Sinica. doi: 10.1007/s13131-023-2244-0
College of Oceanography, Hohai University, Nanjing 210098, China
2.
State Key Laboratory of Satellite Ocean Environment Dynamics, Second Institute of Oceanography, Ministry of Natural Resources, Hangzhou 310012, China
3.
Observation and Research Station of Changjiang River Delta Marine Ecosystems, Ministry of Natural Resources, Zhoushan 316022, China
4.
Ningbo Marine Center, Ministry of Natural Resources, Ningbo 315000, China
5.
School of Oceanography, Shanghai Jiao Tong University, Shanghai 200240, China
6.
Institute of Polar and Ocean Technology, Second Institute of Oceanography, Ministry of Natural Resources, Hangzhou 310012, China
Funds:
The National Natural Science Foundation of China under contract No. 41876026; the Scientific Research Fund of the Second Institute of Oceanography, Ministry of Natural Resources under contract No. YJJC2201; the National Programme on Global Change and Air–Sea Interaction Phase II under contract No. GASI-01-CJK; the Zhejiang Provincial Ten Thousand Talents Program under contract No. 2020R52038; the Project of State Key Laboratory of Satellite Ocean Environment Dynamics under contract No. SOEDZZ2105.
Hypoxia off the Changjiang River Estuary has been the subject of much attention, yet systematic observations have been lacking, resulting in a lack of knowledge regarding its long-term change and drivers. By revisiting the repeated surveys of dissolved oxygen (DO) and other relevant hydrographic parameters along the section from the Changjiang River Estuary to the Cheju Island in the summer from 1997 to 2014, rather different trends were revealed for the dual low-DO cores. The nearshore low-DO core, located close to the river mouth and relatively stable, shows that hypoxia has become more severe with the lowest DO descending at a rate of −0.07 mg/(L·a) and the thickness of low-DO zone rising at a rate of 0.43 m/a. The offshore core, centered around 40-m isobath but moving back and forth between 123.5°–125°E, shows large fluctuations in the minimum DO concentration, with the thickness of low-DO zone falling at a rate of −1.55 m/a. The probable factors affecting the minimum DO concentration in the two regions also vary. In the nearshore region, the decreasing minimum DO is driven by the increase in both stratification and primary productivity, with the enhanced extension of the Changjiang River Diluted Water (CDW) strengthening stratification. In the offshore region, the fluctuating trend of the minimum DO concentration indicates that both DO loss and DO supplement are distinct. The DO loss is primarily attributed to bottom apparent oxygen utilization caused by the organic matter decay and is also relevant to the advection of low-DO water from the nearshore region. The DO supplement is primarily due to weakened stratification. Our analysis also shows that the minimum DO concentration in the nearshore region was extremely low in 1998, 2003, 2007 and 2010, related to El Niño signal in these summers.
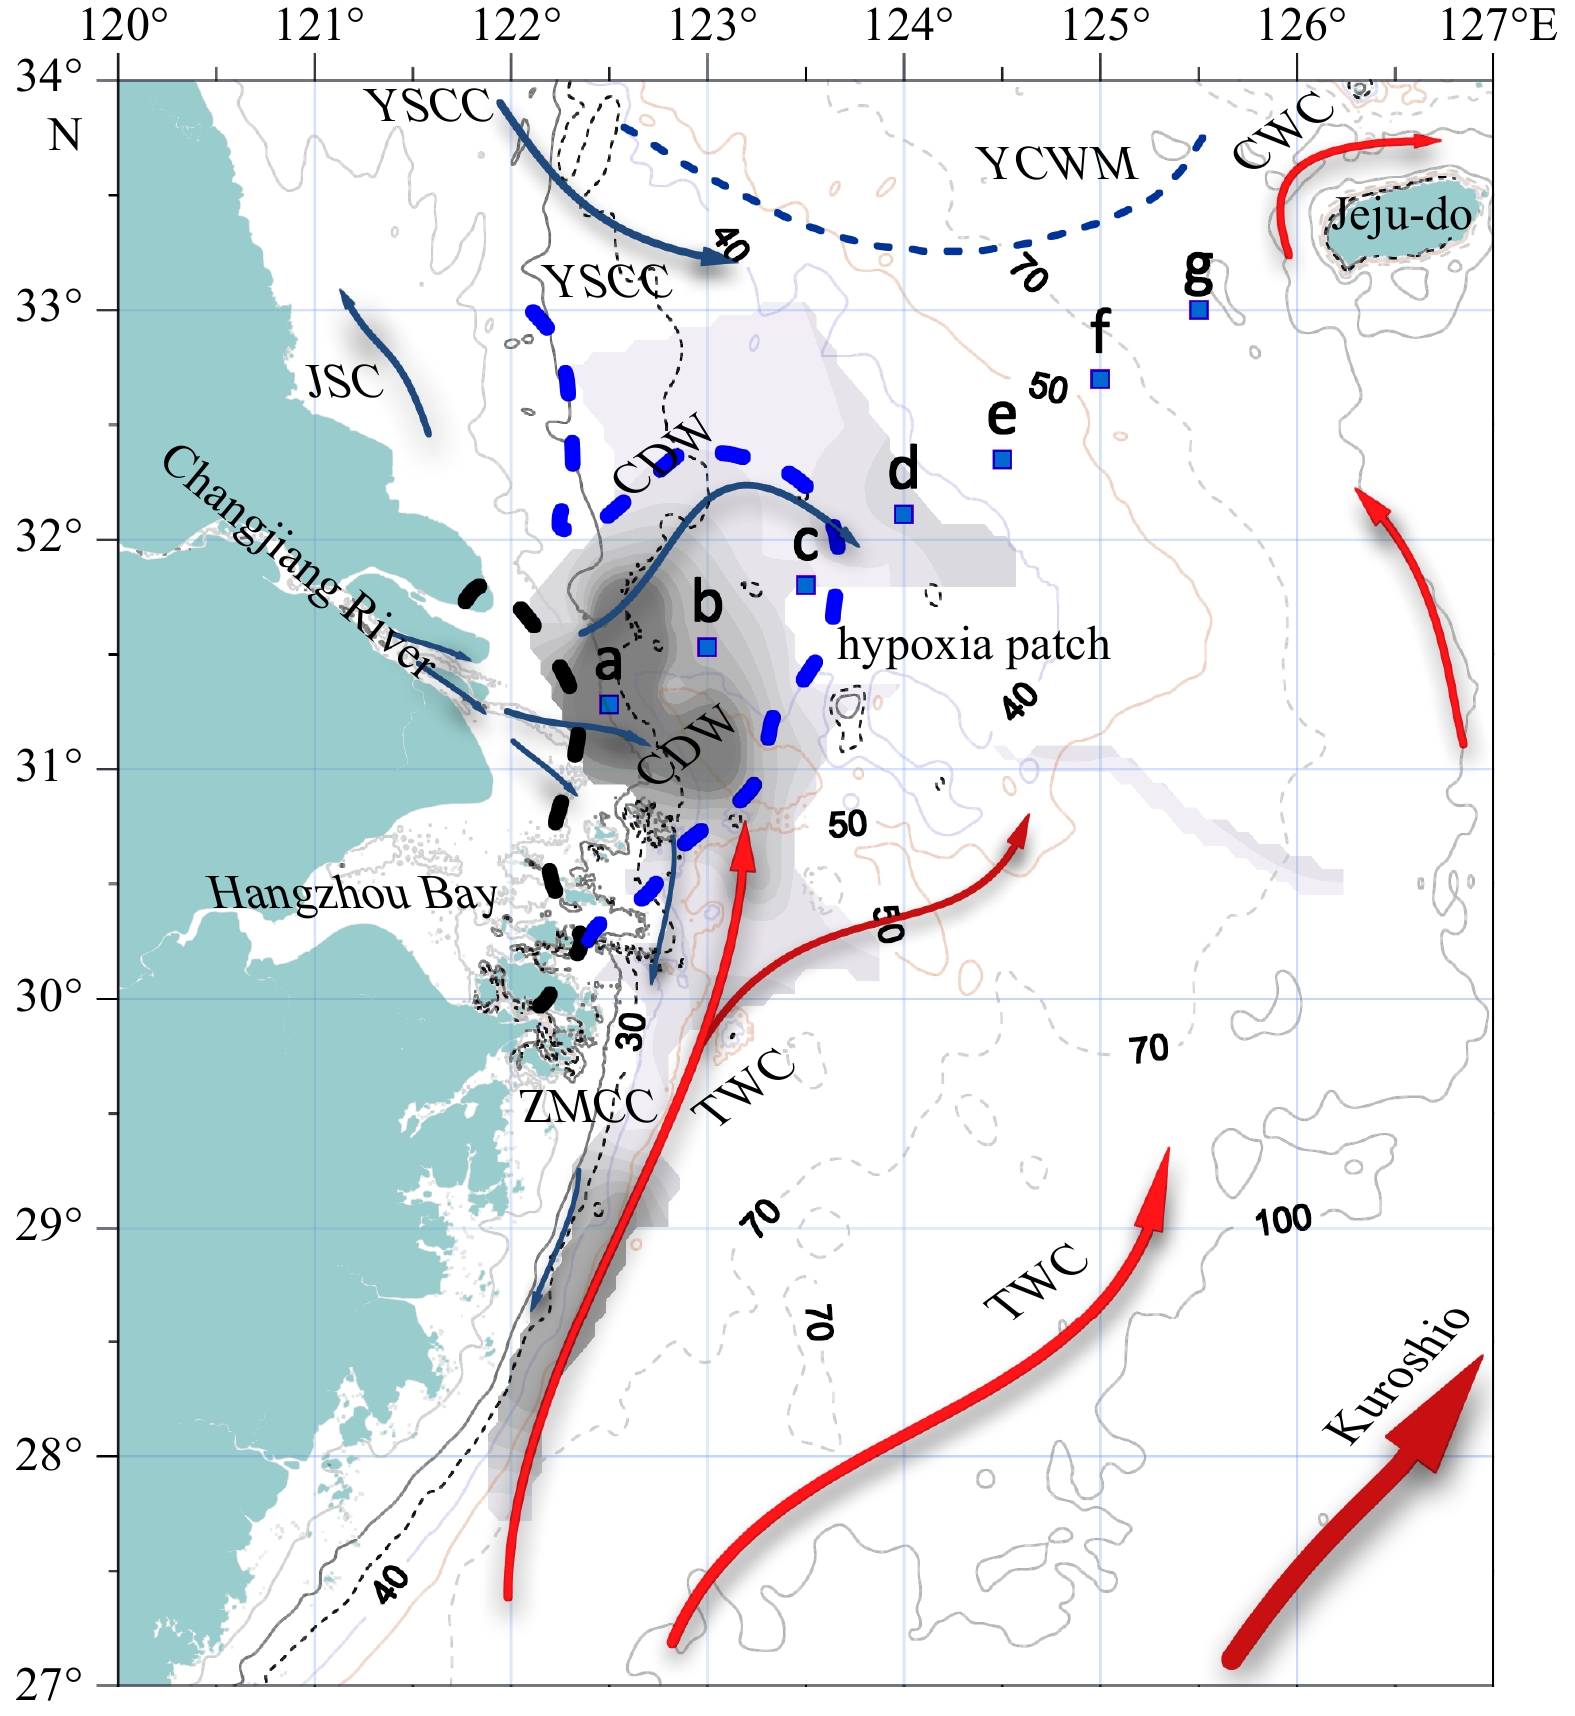
Figure 1. Map of two Section S1 in summer from 1997 to 2014 in the East China Sea with station number above marker. Gray shading indicates locations where hypoxia was found during historical surveys. The dashed black curve indicates the surface suspended sediment front near the Changjiang River mouth and dashed blue curve indicates the surface plume front (Li et al., 2021). The arrows indicate the direction of the summer circulation, and the red arrow represents the current, i.e., the Kuroshio and its branches, namely the Taiwan Warm Current (TWC), and the blue represents the current system with the nature of offshore water masses, including the Changjiang River Diluted Water (CDW), the Yellow Sea Coastal Current (YSCC), the Cheju Warm Current (CWC), the Yellow Sea Cold Water Mass (YCWM), the Jiangsu Shoal Current (JSC) and the Zhe-min Coastal Current (ZMCC).
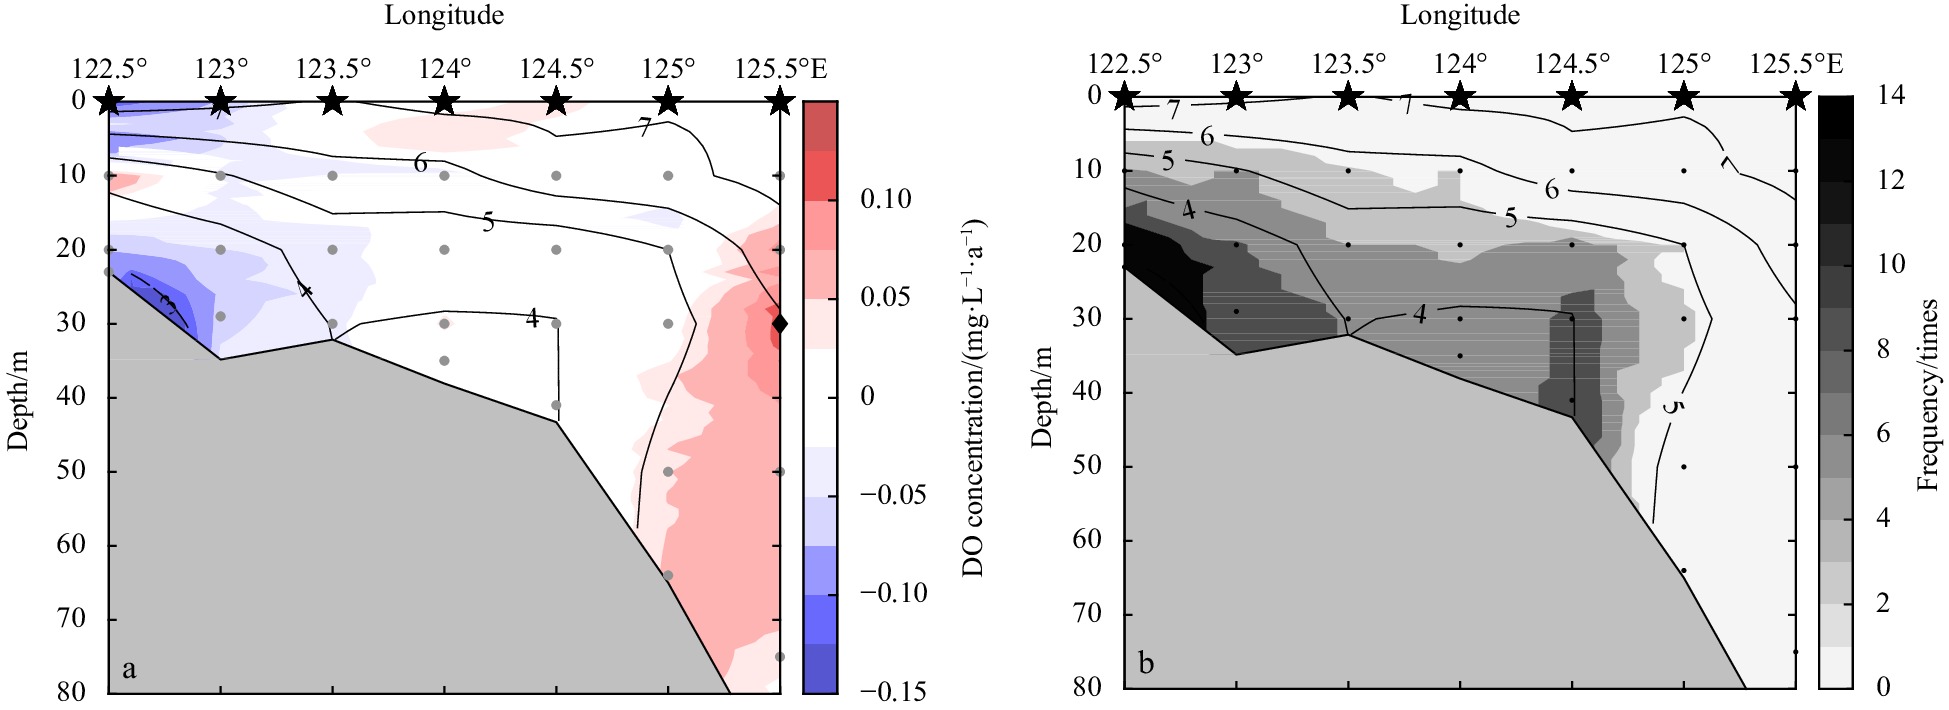
Figure 2. Eighteen-year averaged DO concentration in summer. a. Trend of DO concentration; b. frequency of low DO. The isoline represents the averaged DO concentration, the shading represents the trend (a) and frequency (b) of low DO, the black dot with five-pointed star indicates the sampling location, and the black dots are the sampling point.
Figure 3. Variations in DO-relevant parameters. a, c. The thickness of the low-DO core (DO concentration <4 mg/L) in the nearshore and offshore regions along Section S1; b, d. the minimum DO concentration in the two low-DO cores along Section S1. The top two panels are the result of the nearshore core and the bottom panels are the result of the offshore core. The gray dotted lines represent the trend calculated using Sen’s slope estimator. The thickness of low-DO core is represented by subtracting the minimum depth from the maximum depth of the core where the DO concentration is less than 4 mg/L.
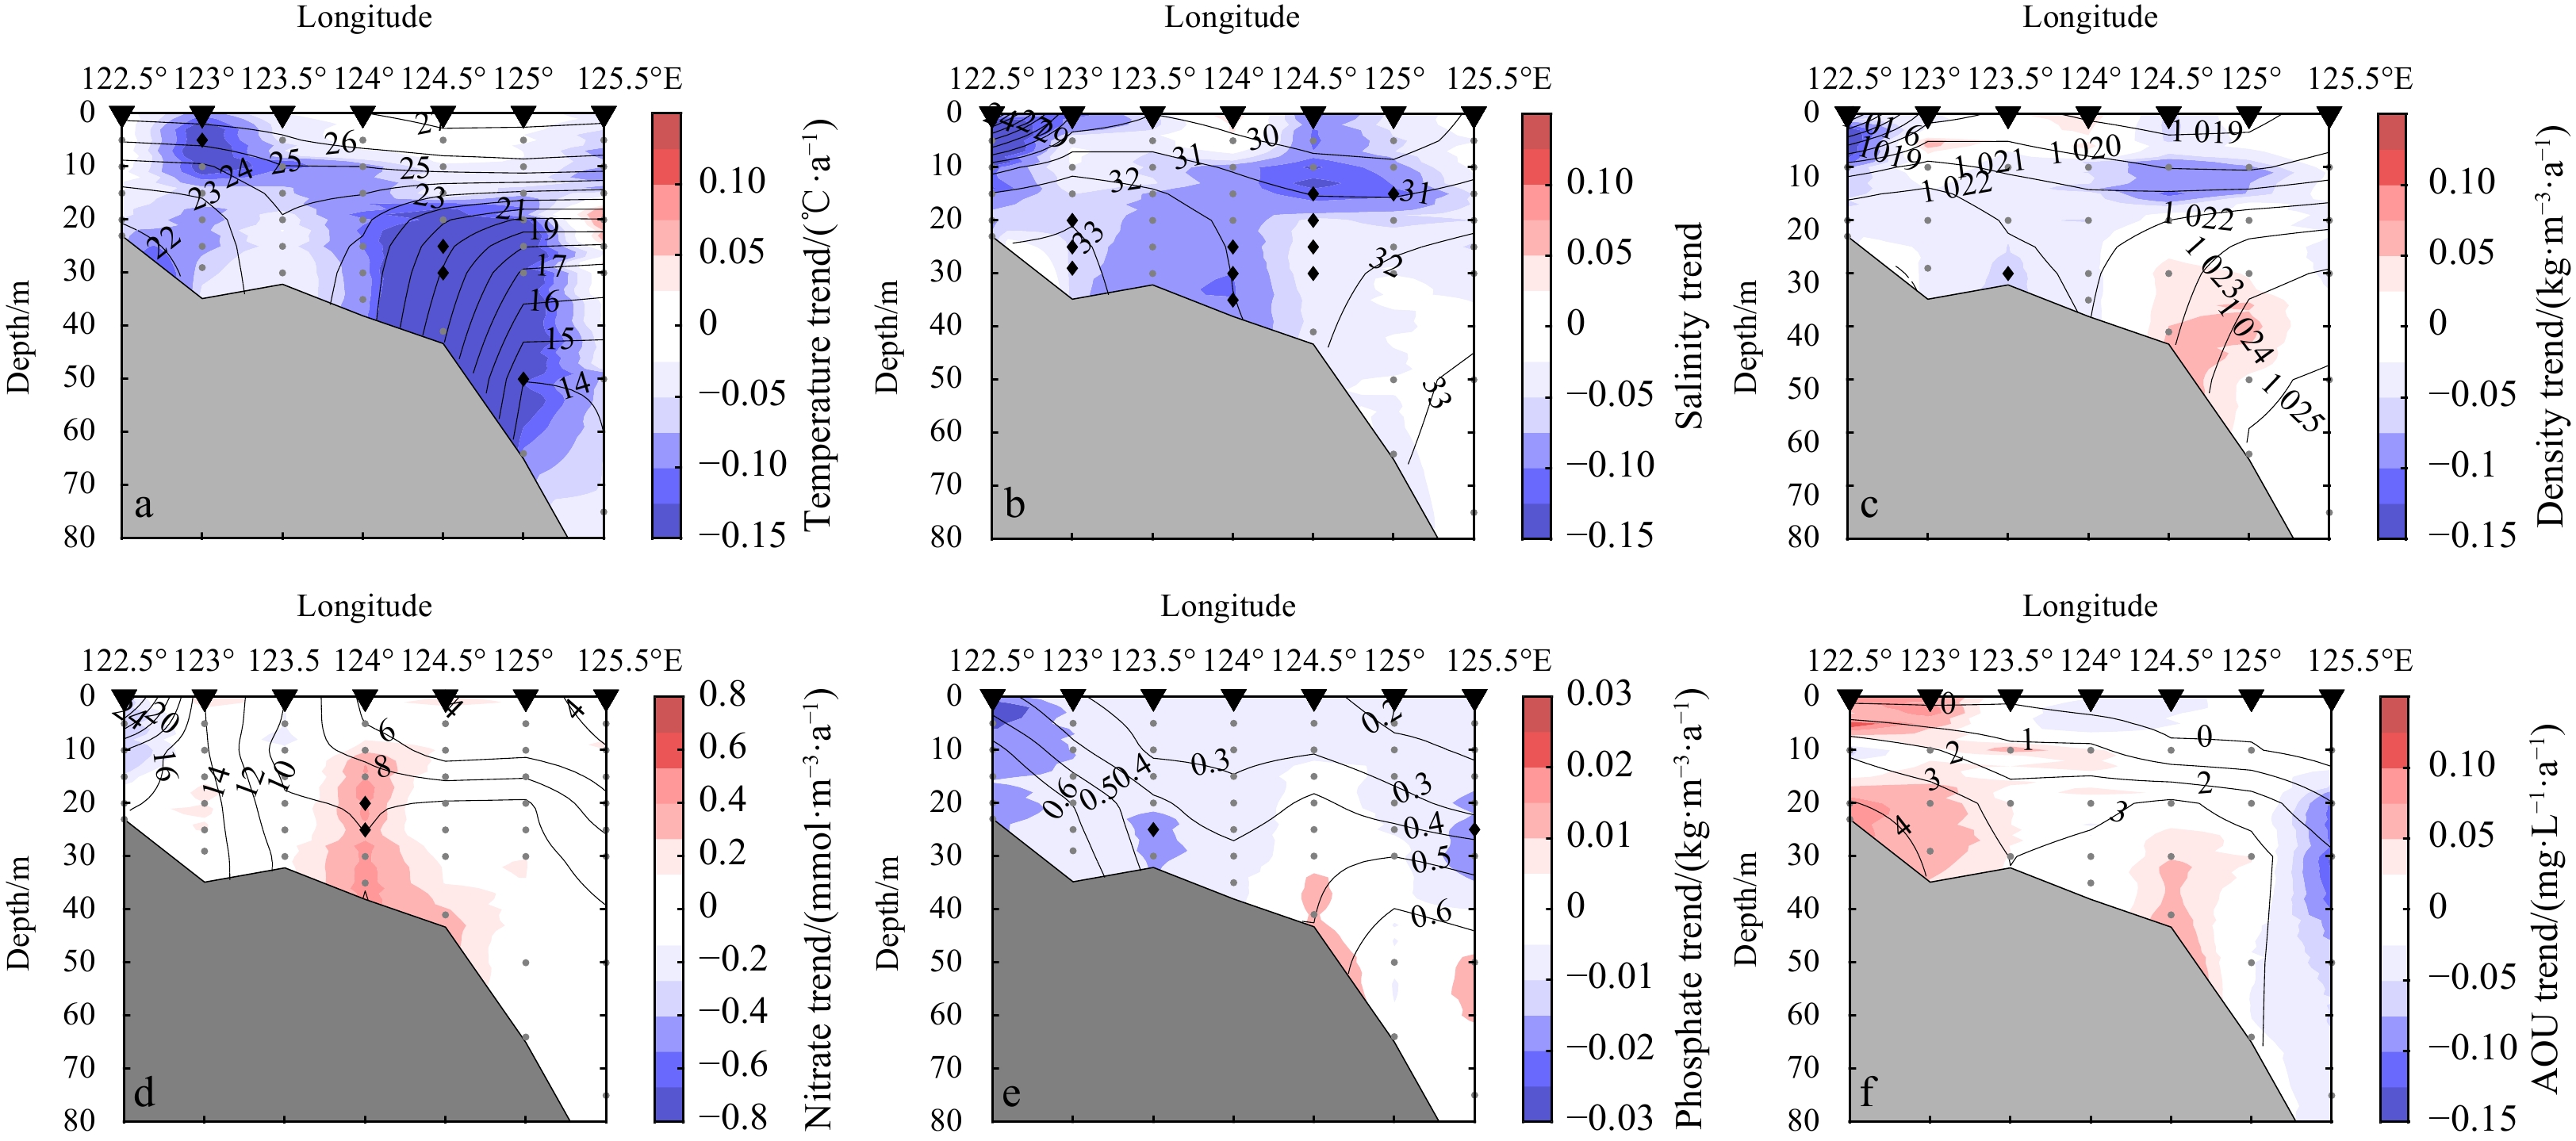
Figure 4. Eighteen-year averages of environmental factors in summer; temperature (a), salinity (b), density (c), nitrate concentration (d), phosphate concentration (e), and apparent oxygen utilization (f) (AOU) in Section S1. The isoline represents the average distribution of hydrographic variables, the shading represents the trend calculated using Mann-Kendall method, the black diamond indicates that the station location is significant with 95% confidence, the gray dot was not significant with 95% confidence, and the black triangle was the sampling site.
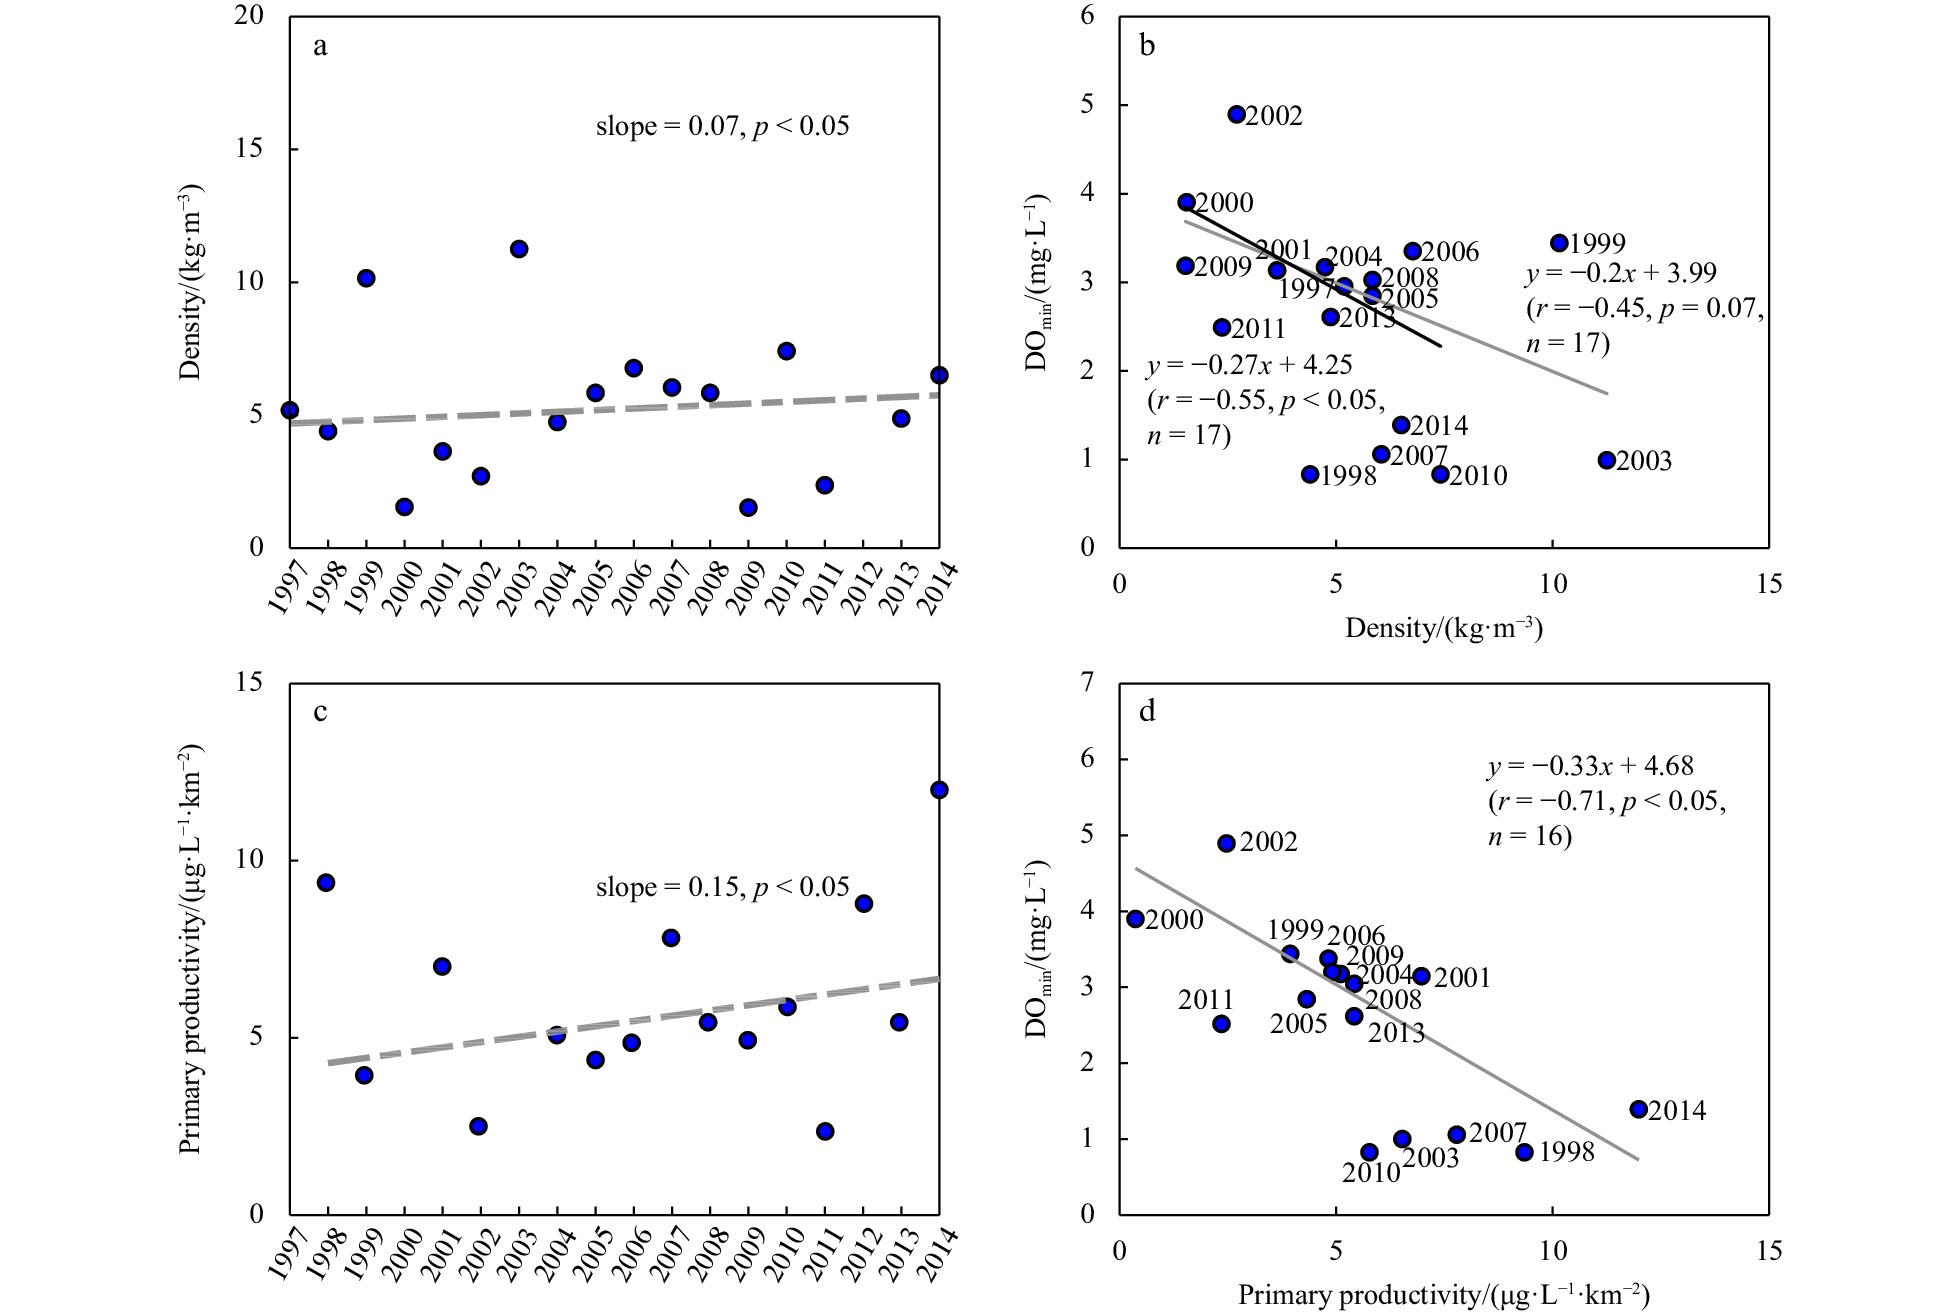
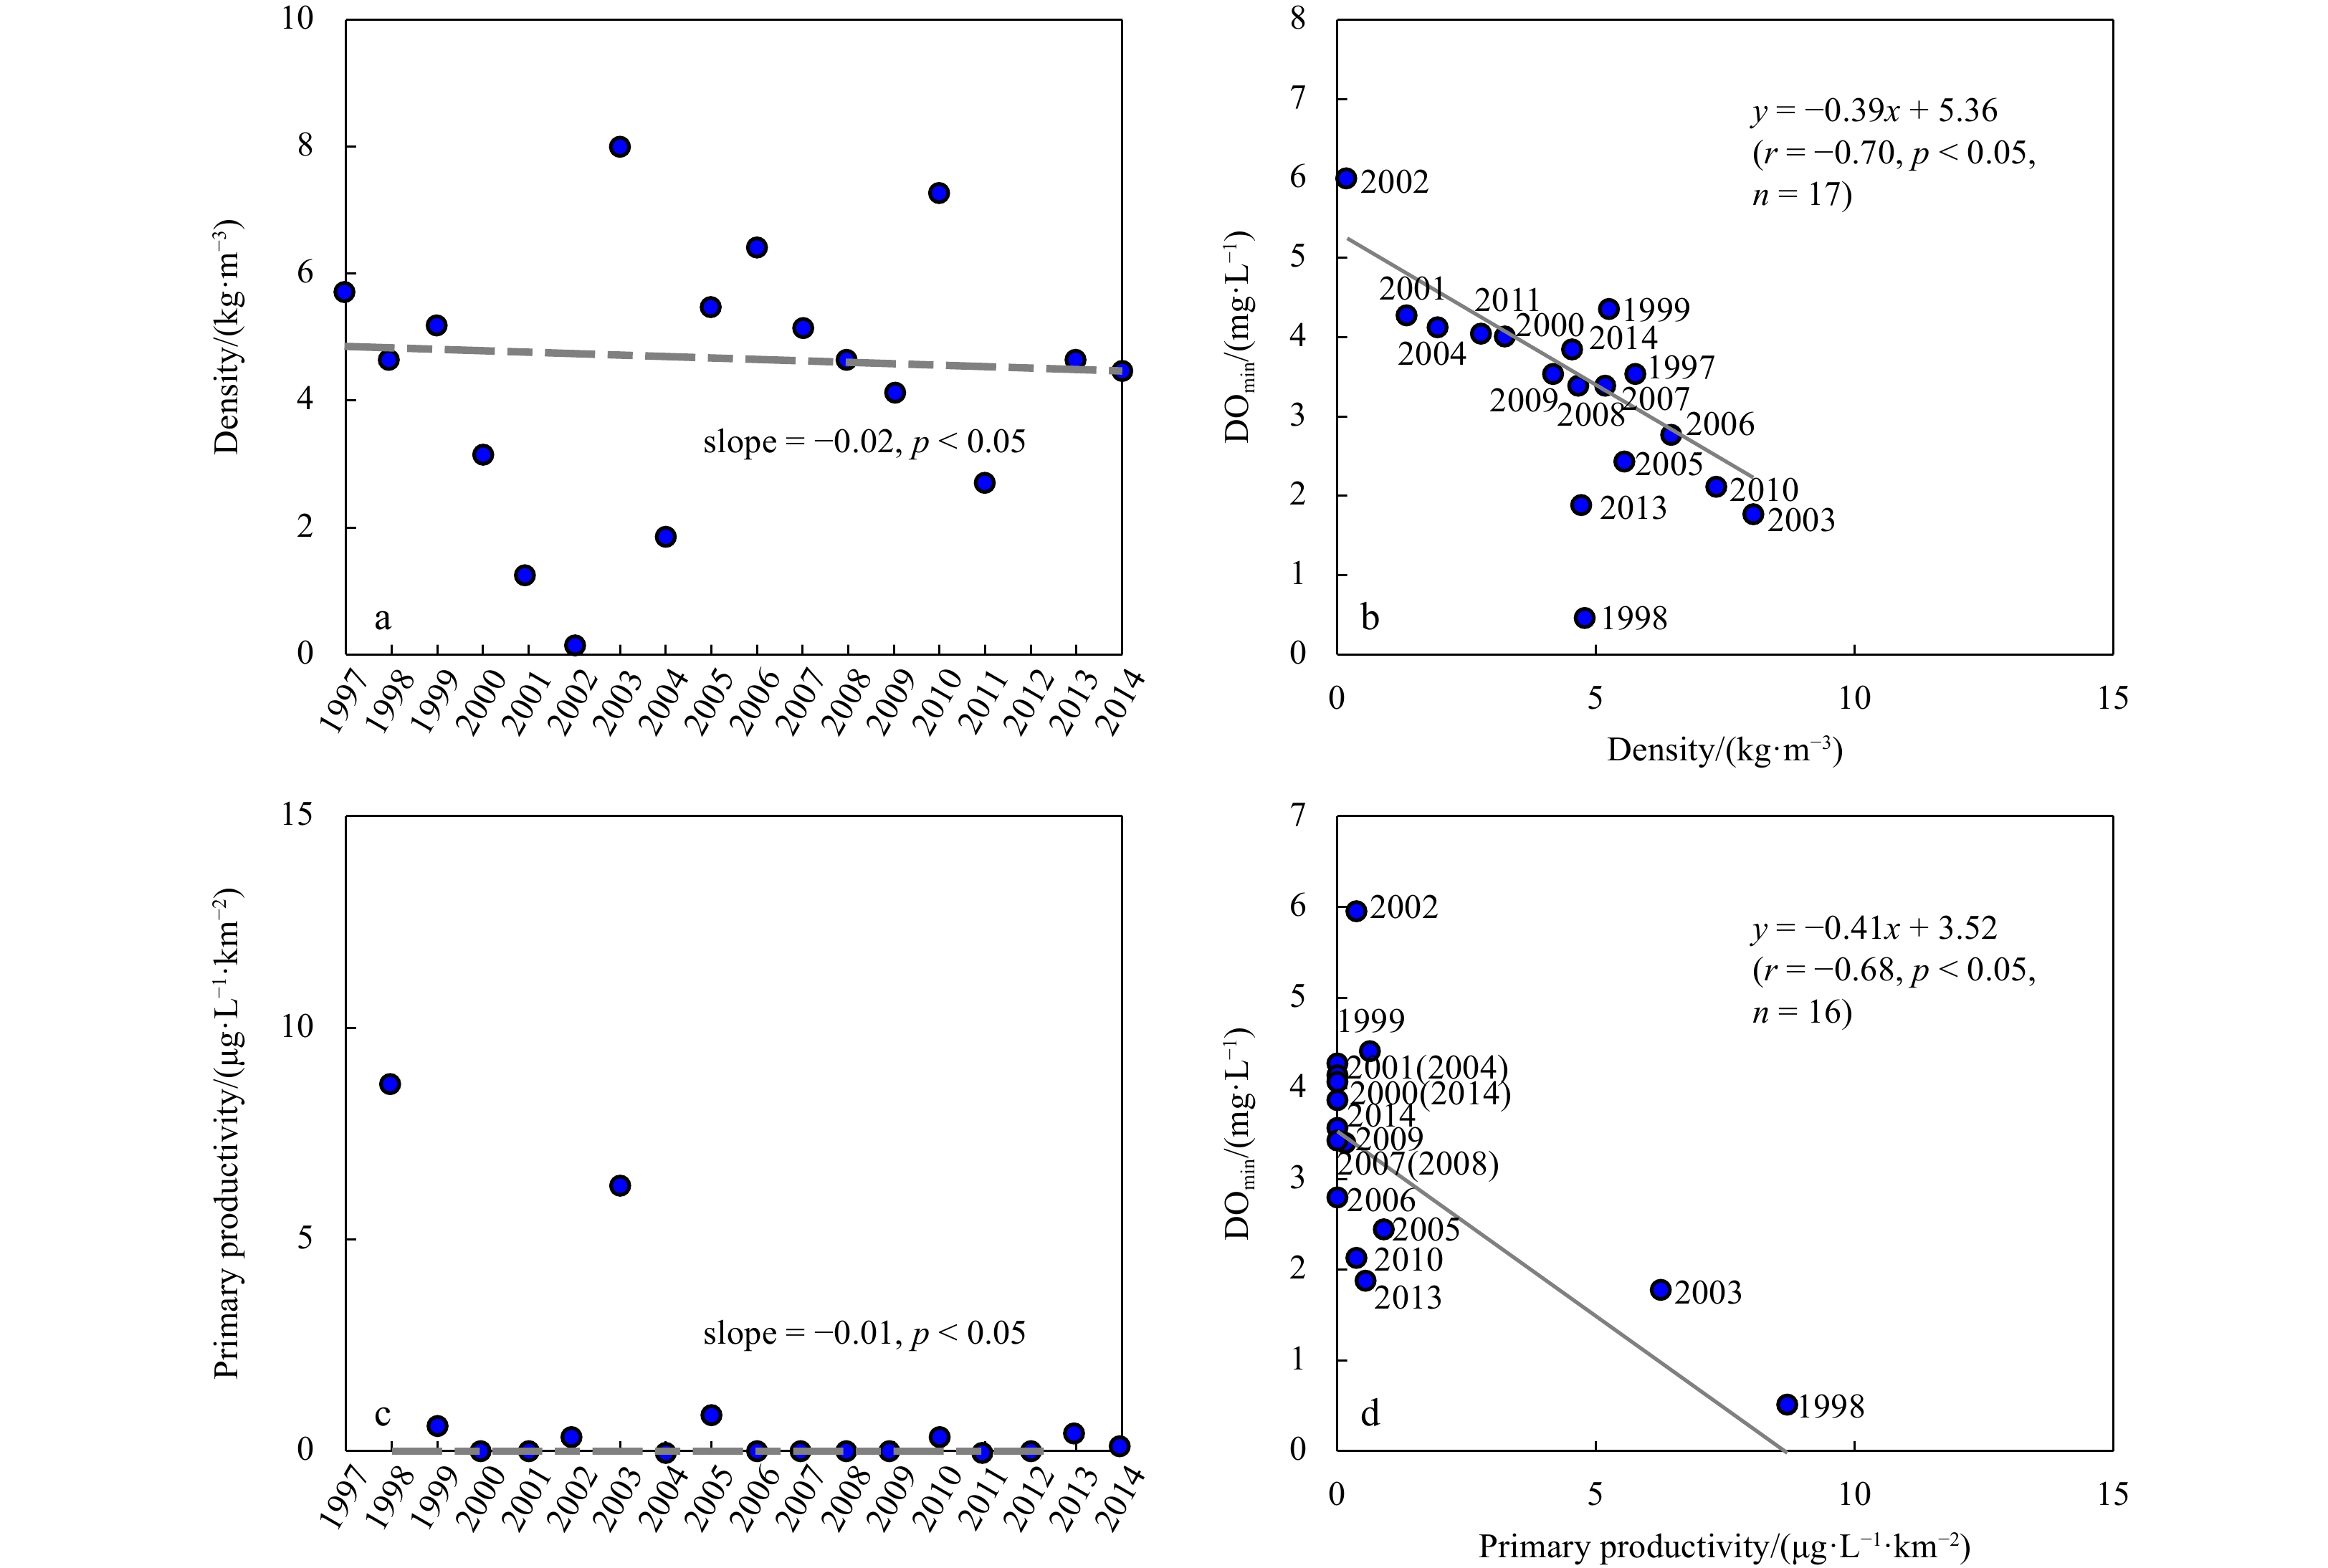
Figure 5. The trend in density stratification and primary productivity (a, c) in the nearshore region. Correlations of minimum DO and stratification and primary productivity (b, d) in the nearshore region. The gray line and words in b denote the correlations of minimum DO and stratification in 17 a, and the black line and words in b denote the correlations of minimum DO and stratification in 15 a (except for 1999 and 2003).
Figure 6. Trend of stratification and primary productivity (a, c) in the offshore core. Correlations of minimum DO and stratification and primary productivity (b, d) in the offshore core.
Figure 7. The trend of CDW strength in the nearshore core (a), relation between stratification and CDW strength (b), relation between the minimum DO and strength of CDW in the nearshore core (c).
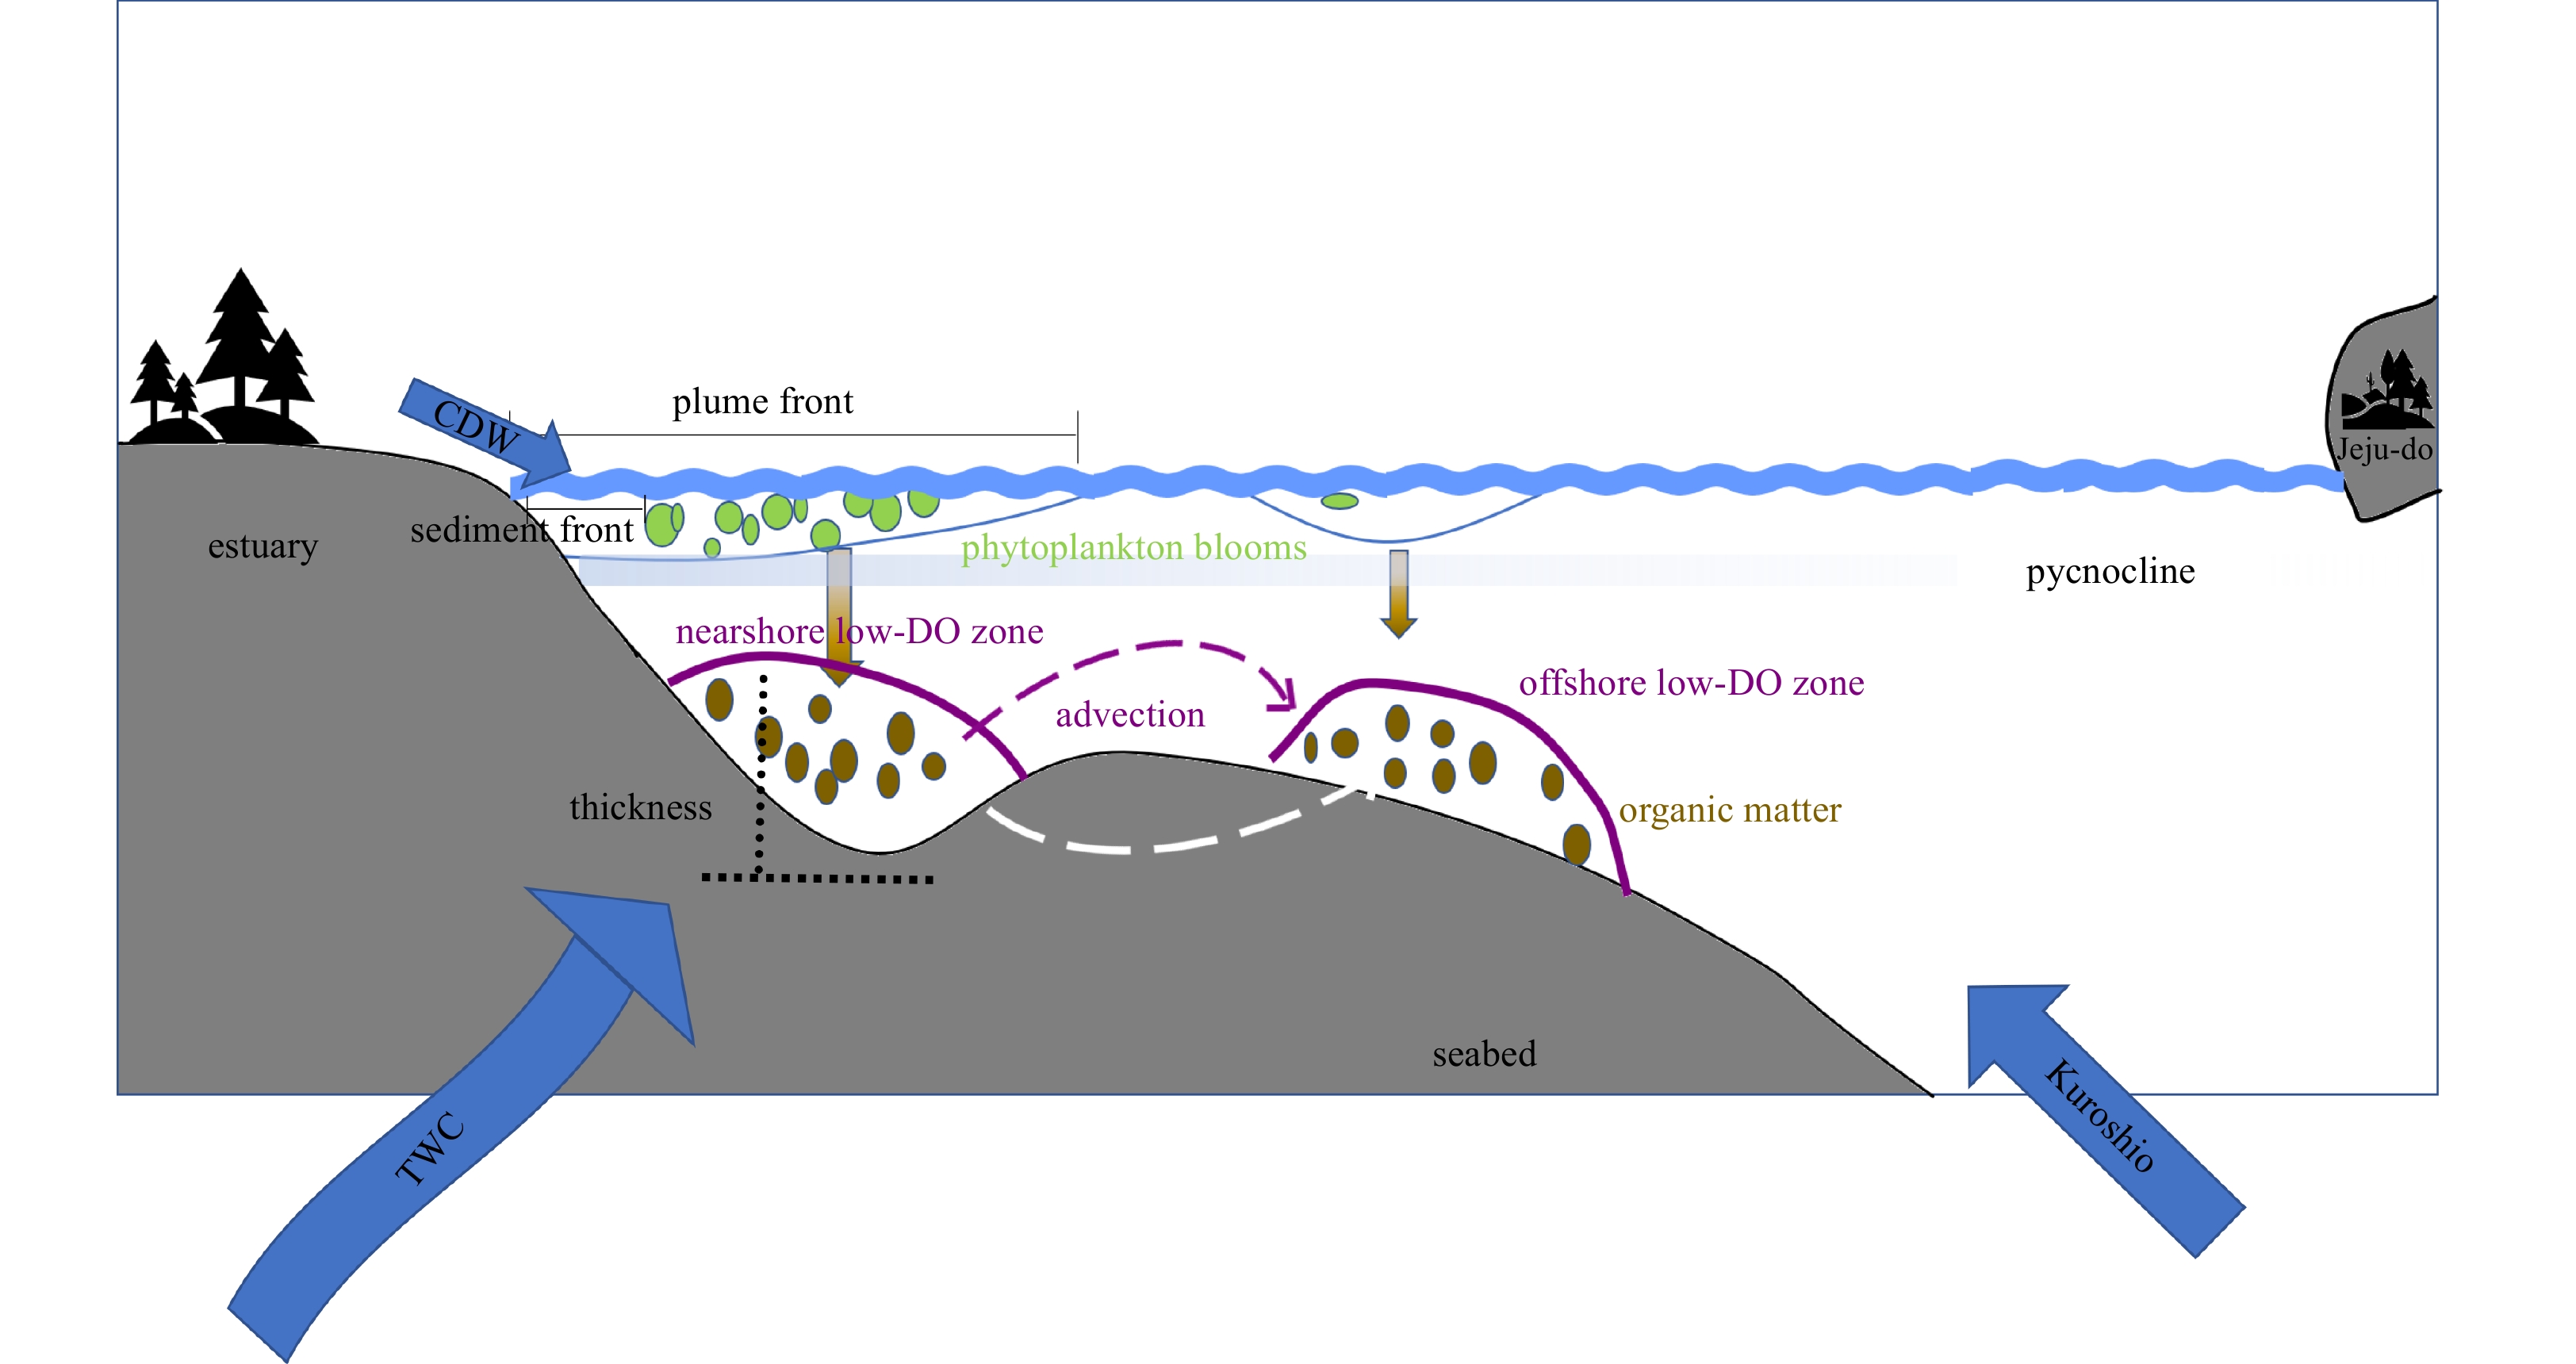
Figure 8. Schematic diagram of physical and biogeochemical processes responsible for the formation of two low-DO cores along the section in the northern CJE.
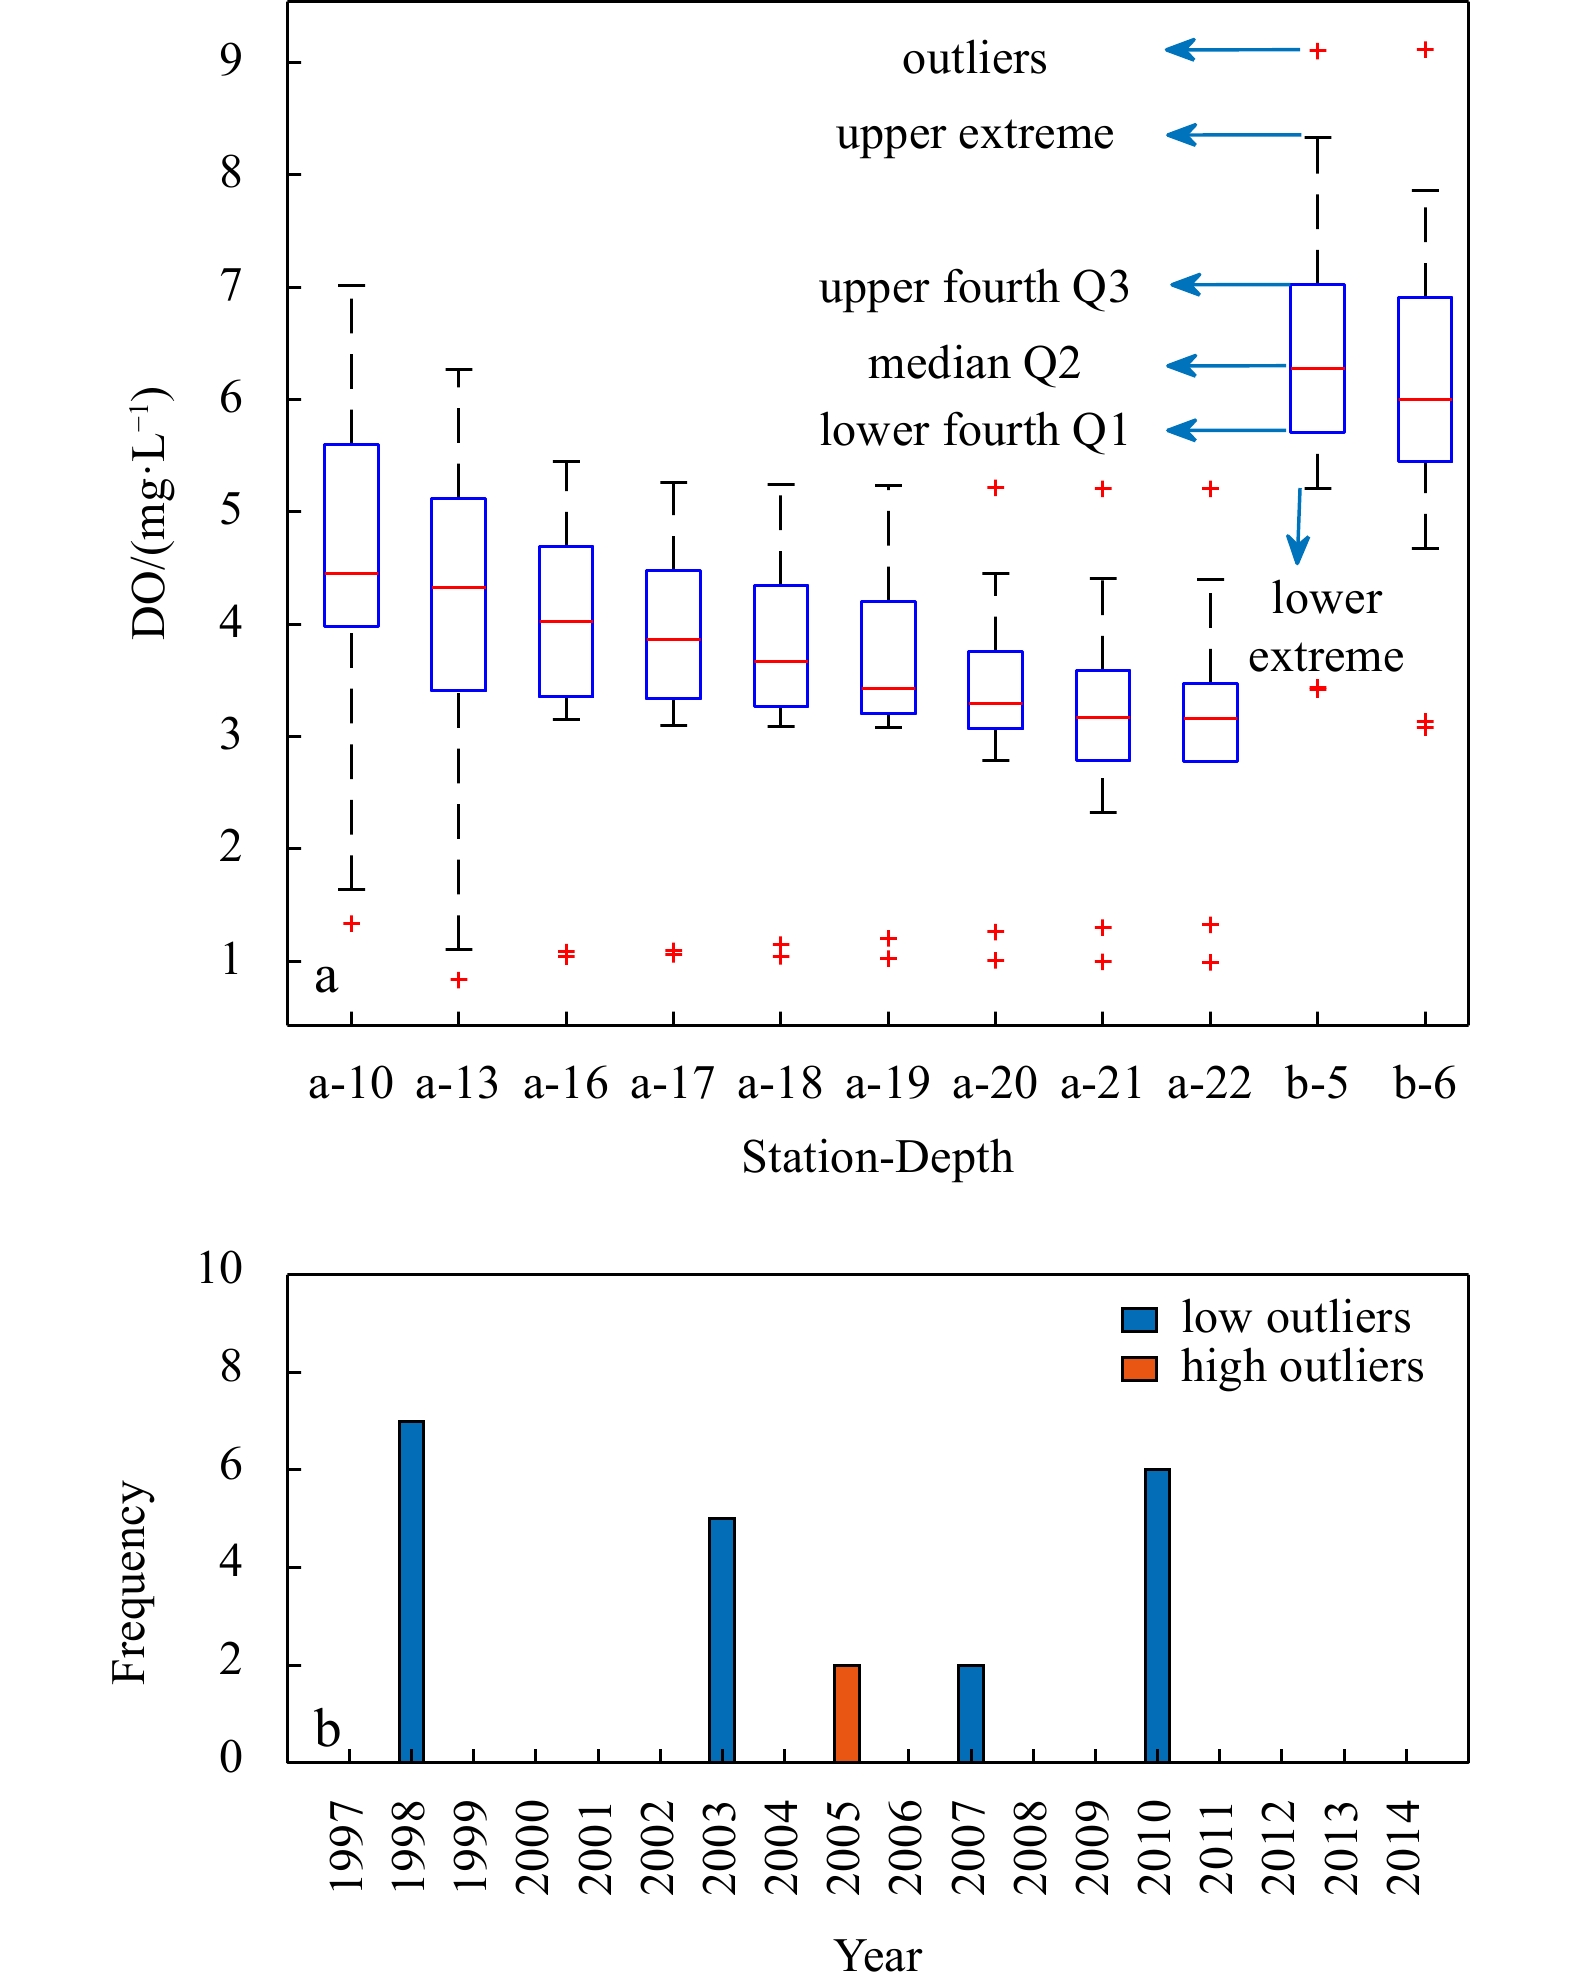
Figure 9. Boxplot of the minimum DO in the nearshore core (a). Frequency of the year of outliers (red ‘‘+’’) in a (b). Depth unit: m.
Figure 10. DO concentration distribution at Station a (A) and Station b (B) from 1997 to 2014; the Niño 3.4 index from 1997 to 2014. The Niño 3.4 index data from Ma et al. (2022) (C).


 DownLoad: