Gaolei Cheng, Shiqiu Peng, Bin Yang, Dongliang Lu. A numerical model study on the spatial and temporal variabilities of dissolved oxygen in Qinzhou Bay of the northern Beibu Gulf[J]. Acta Oceanologica Sinica. doi: 10.1007/s13131-023-2243-1
Citation:
Gaolei Cheng, Shiqiu Peng, Bin Yang, Dongliang Lu. A numerical model study on the spatial and temporal variabilities of dissolved oxygen in Qinzhou Bay of the northern Beibu Gulf[J]. Acta Oceanologica Sinica. doi: 10.1007/s13131-023-2243-1
Gaolei Cheng, Shiqiu Peng, Bin Yang, Dongliang Lu. A numerical model study on the spatial and temporal variabilities of dissolved oxygen in Qinzhou Bay of the northern Beibu Gulf[J]. Acta Oceanologica Sinica. doi: 10.1007/s13131-023-2243-1
Citation:
Gaolei Cheng, Shiqiu Peng, Bin Yang, Dongliang Lu. A numerical model study on the spatial and temporal variabilities of dissolved oxygen in Qinzhou Bay of the northern Beibu Gulf[J]. Acta Oceanologica Sinica. doi: 10.1007/s13131-023-2243-1
Oxygen facilitates the breakdown of the organic material to provide energy for life. The concentration of dissolved oxygen (DO) in the water must exceed a certain threshold to support the normal metabolism of marine organisms. Located in the northern Beibu Gulf, Qinzhou Bay receives abundant freshwater and nutrients from several rivers which significantly influence the level ofthe dissolved oxygen. However, the spatial-temporal variations of DO as well as the associated driving mechanisms have been rarely studiedstudied through field observations. In this study, a three-dimensional coupled physical-biogeochemical model is used to investigate the spatial and seasonal variations of the DO and the associated driving mechanisms in Qinzhou Bay. The validation against observations indicates that the model can capture the seasonal and inter-annual variability of the DO concentration with the range of 5−10 mg·L−1. Sensitivity experiments show that the river discharges, winds and tides play crucial roles in the seasonal variability of the DO by changing the vertical mixing and stratification of the water column and the circulation pattern. In winter, the tide and wind forces have strong effects on the DO distribution by enhancing the vertical mixing, especially near the bay mouth. In summer, the river discharges play a dominant role in the DO distribution by inhibiting the vertical water exchange and delivering more nutrients to the Bay, which increases the DO depletion and results in lower DO on the bottom of the estuary salt wedge. These findings can contribute to the preservation and management of the coastal environment in the northern Beibu Gulf.
Figure 1. (a) The model domain and (b) the locations of observation stations.
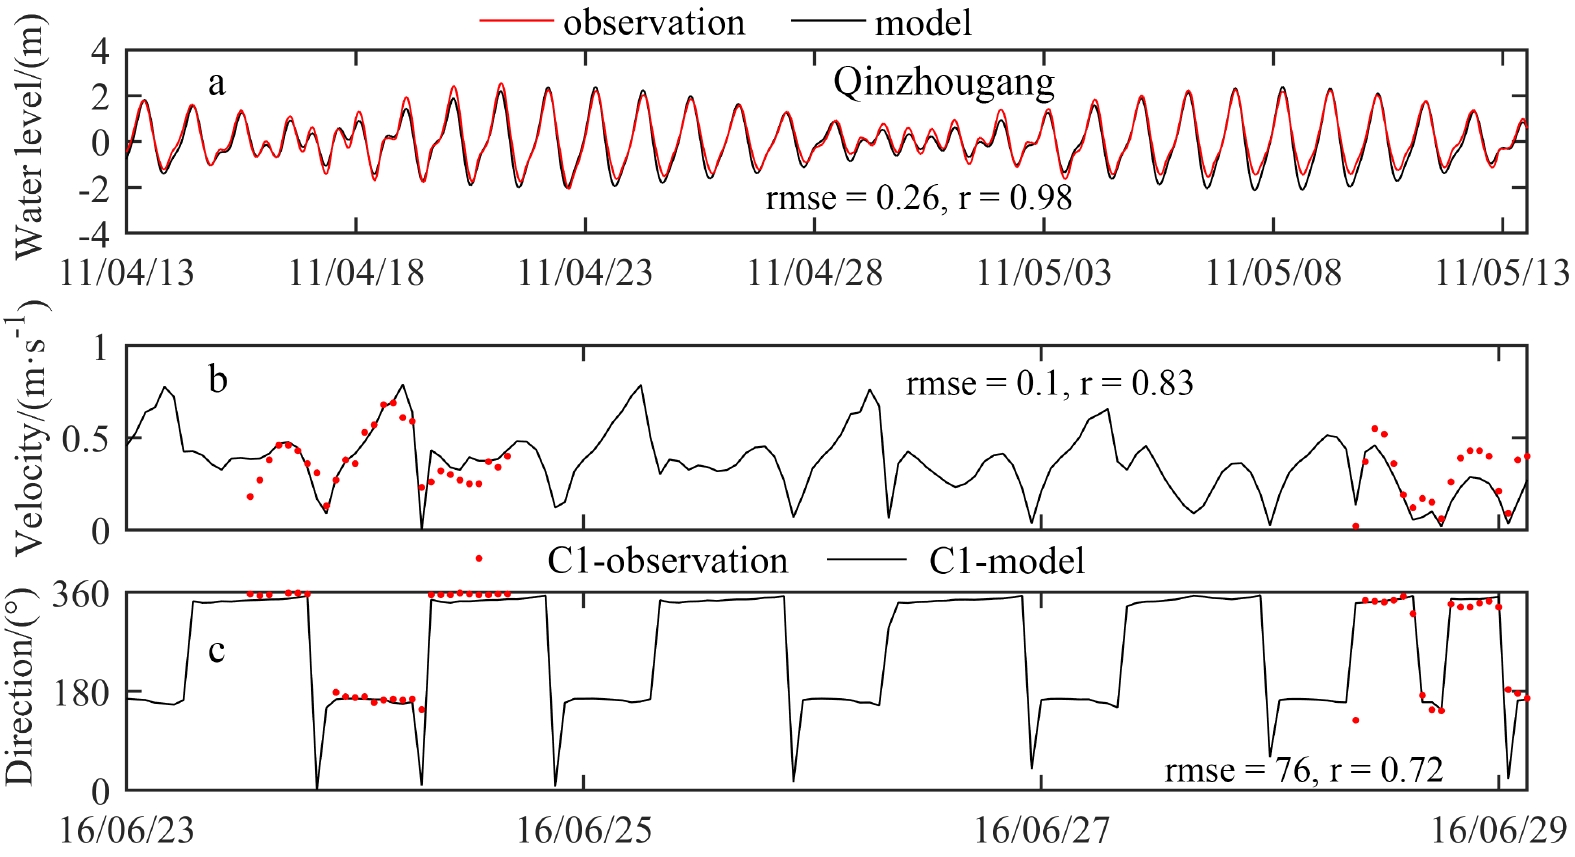
Figure 2. The observed and simulated (a) water level at Qinzhoug port, (b) velocity (b) and (c) direction at C1 station.
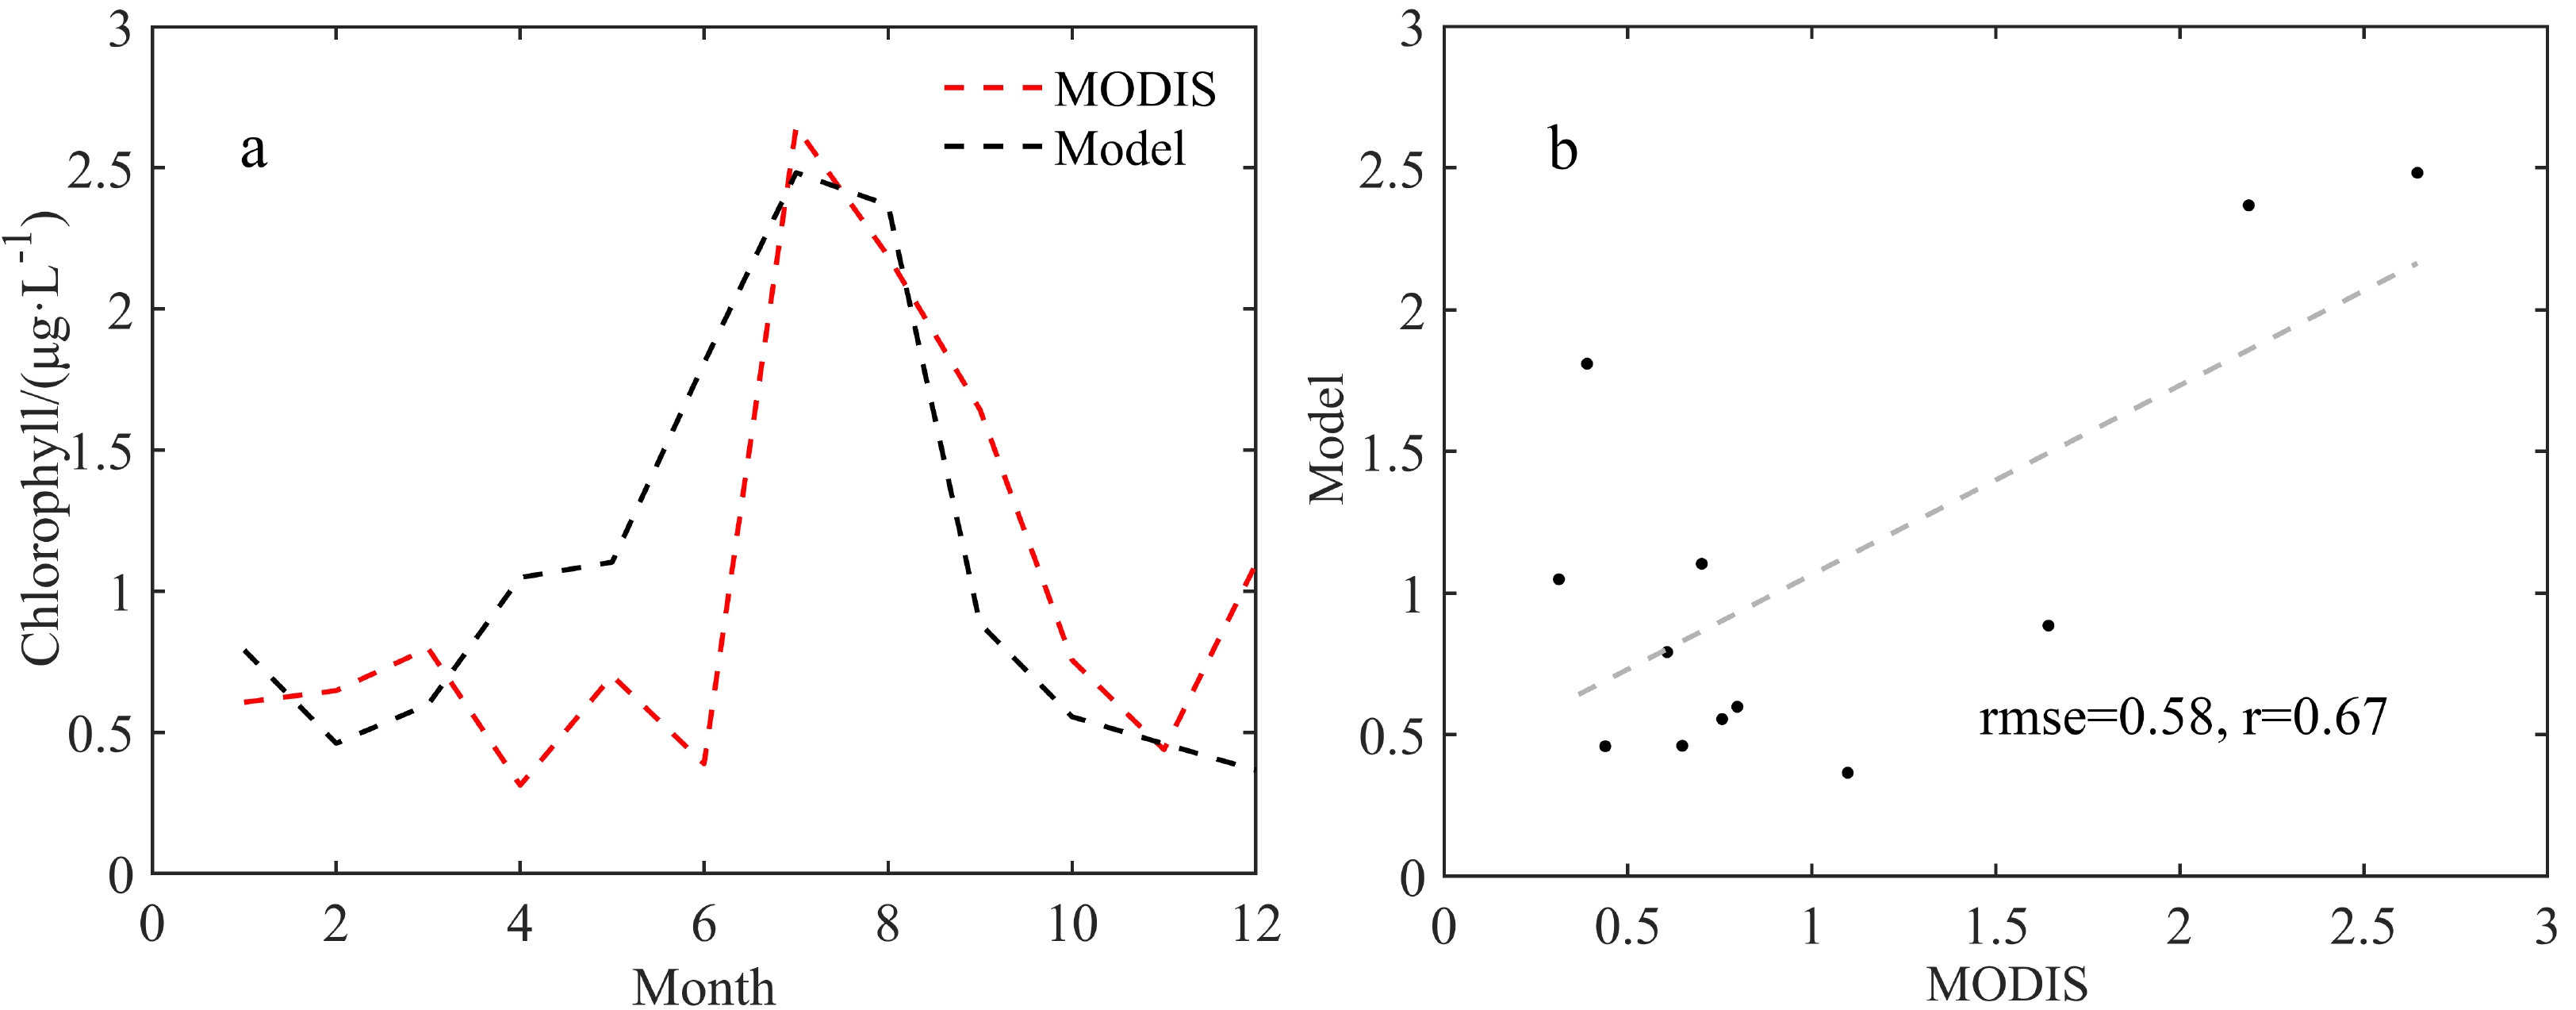
Figure 3. (a)The seasonal variation and (b) scatter plot of the monthly chlorophyll from MODIS and model simulation.
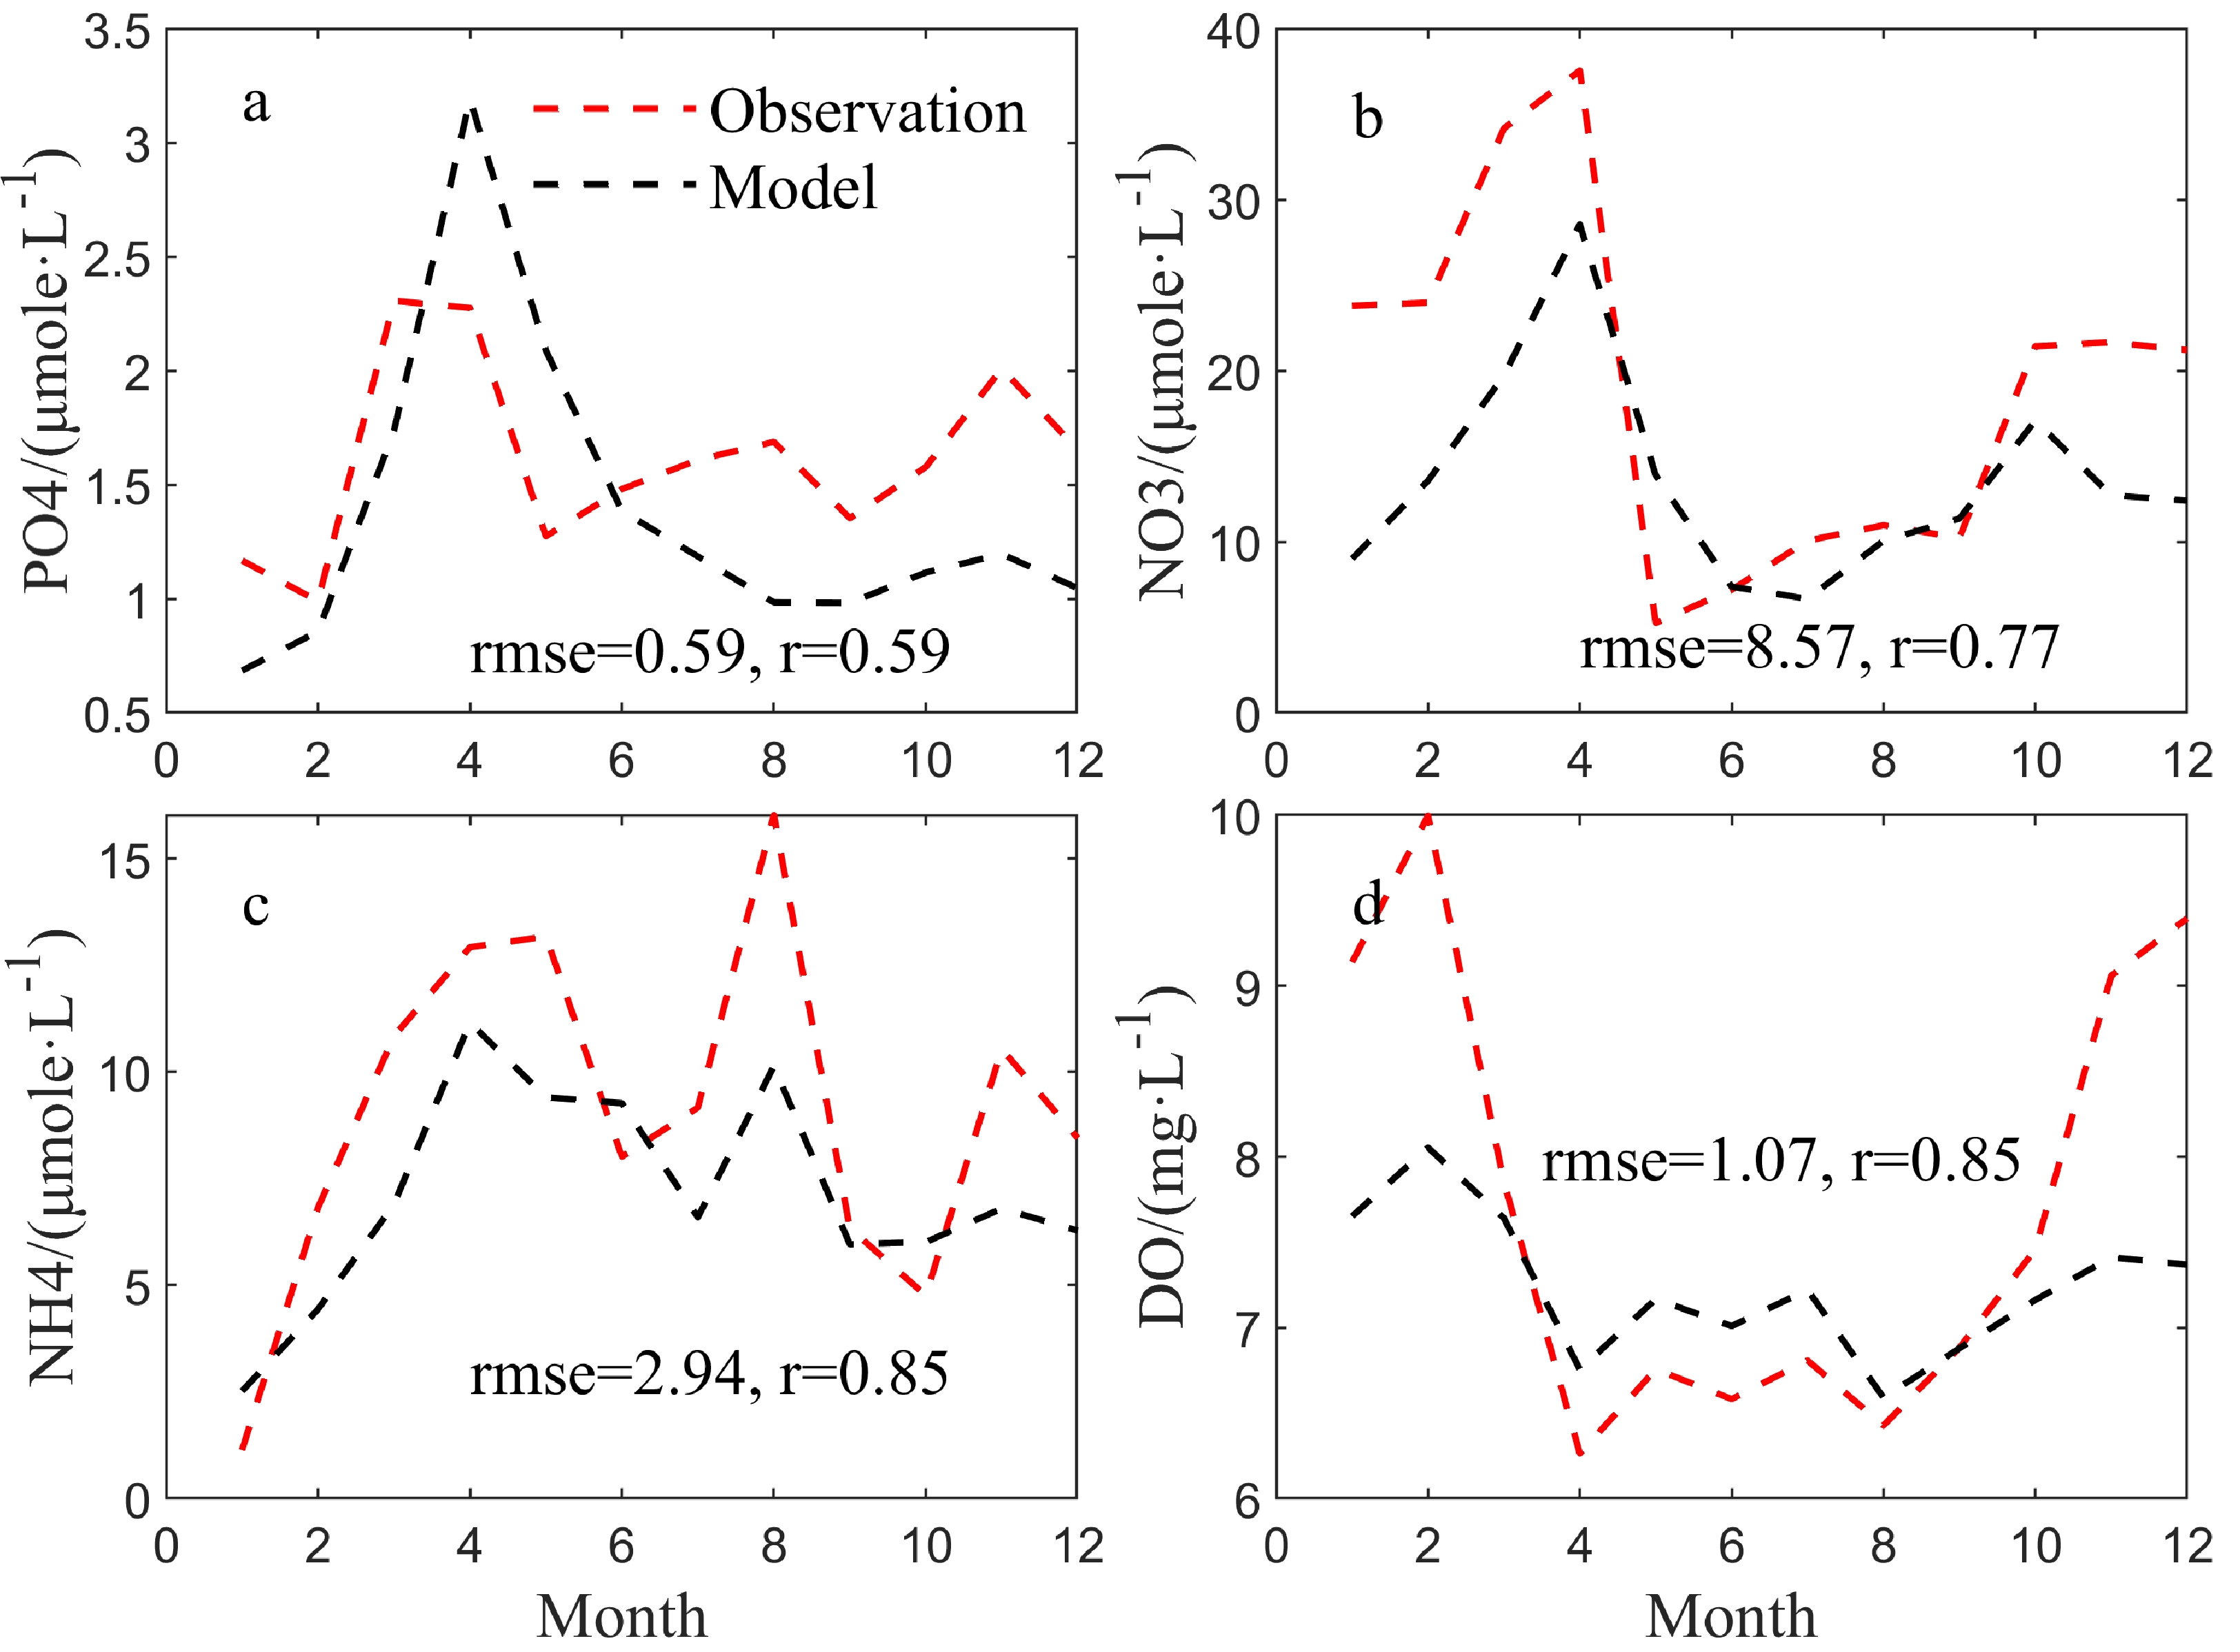
Figure 4. The observed and simulated the mean monthly of surface PO4 (a), NO3 (b), NH4 (c) and DO (d) in the inner bay (as indicated in Fig. 1b).
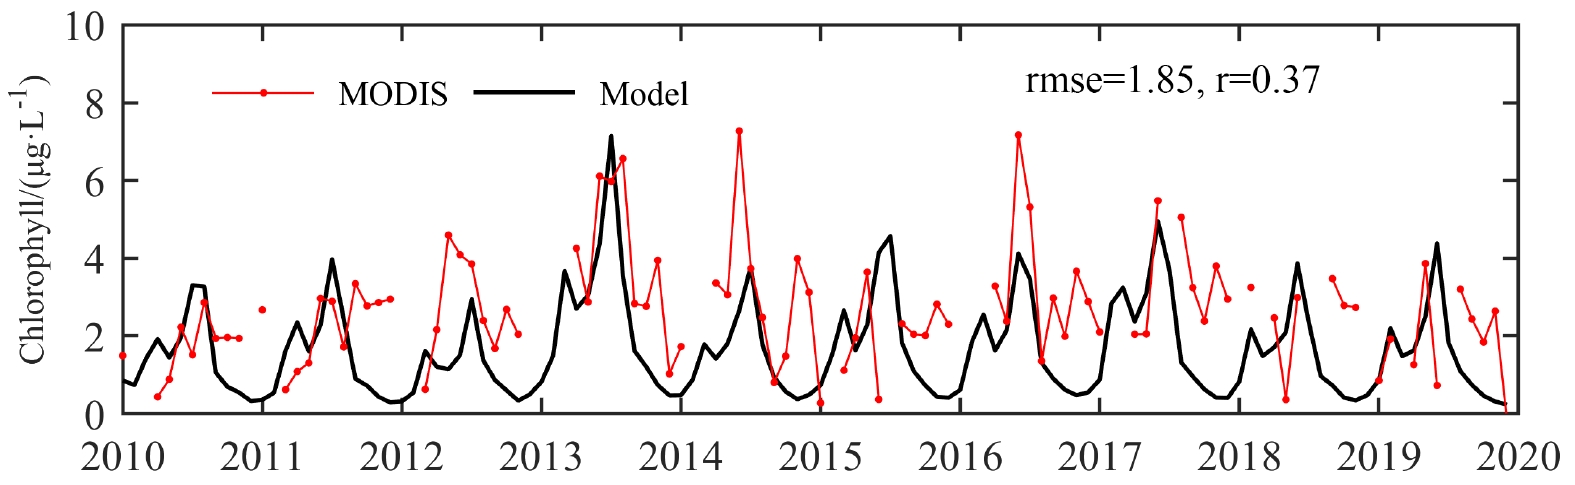
Figure 5. The monthly chlorophyll from MODIS and model simulation from 2010 to 2019.
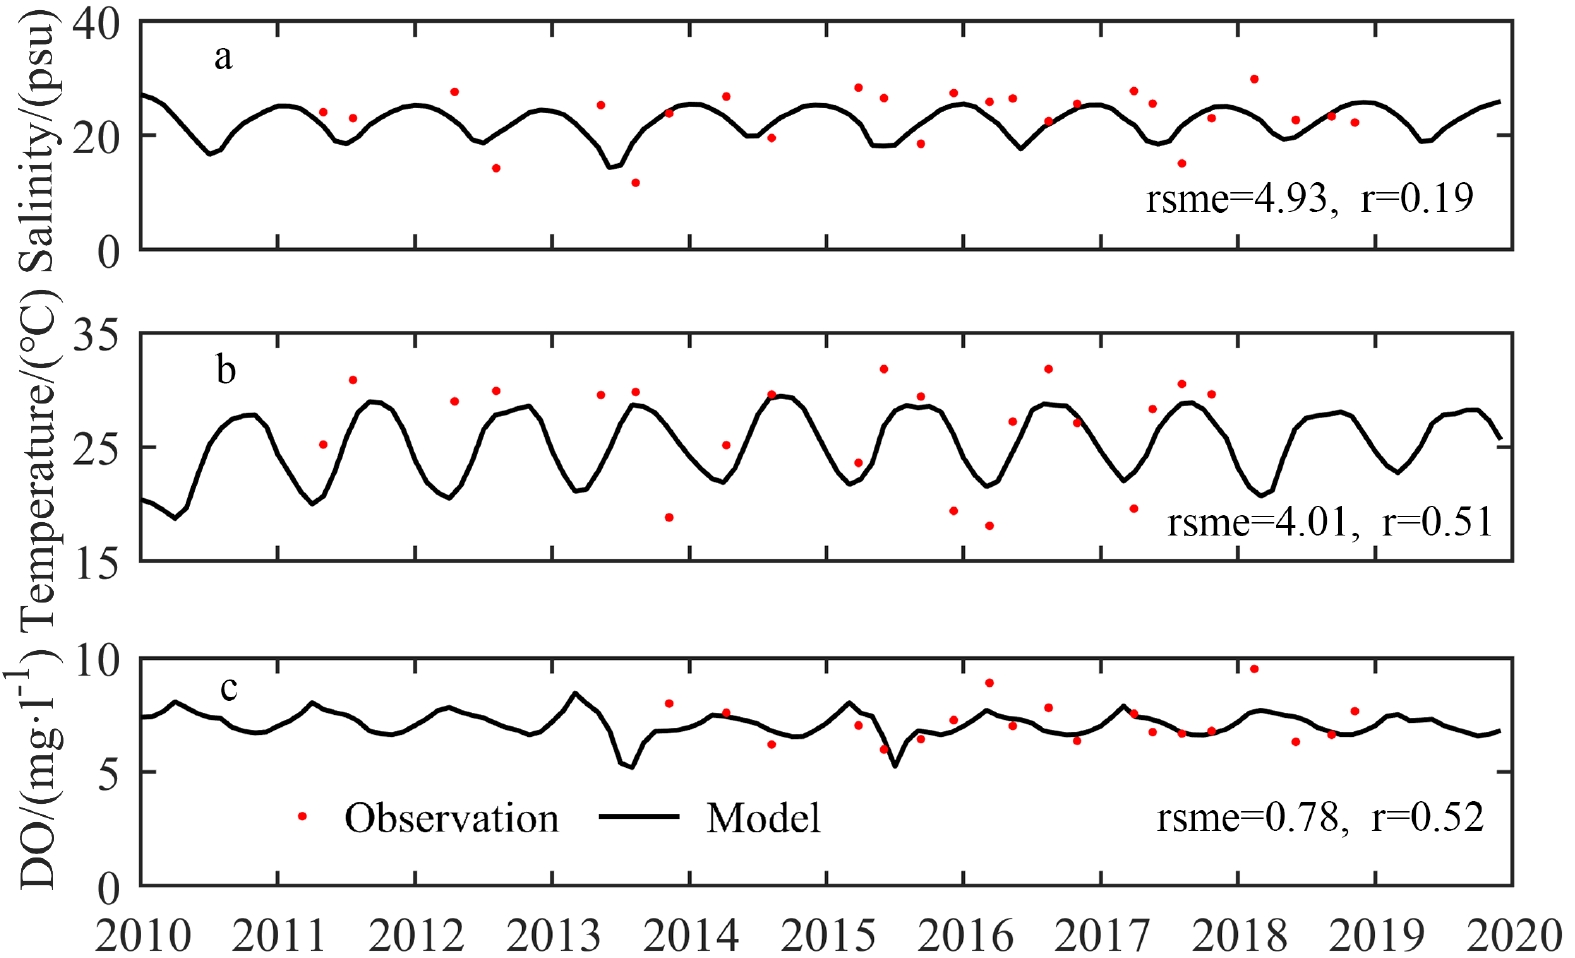
Figure 6. The observed and simulated monthly mean (a) surface salinity, (b) surface temperature, and (c) DO in the inner bay from 2010 to 2019.
Figure 7. The same as Fig. 6 except for the outer bay.
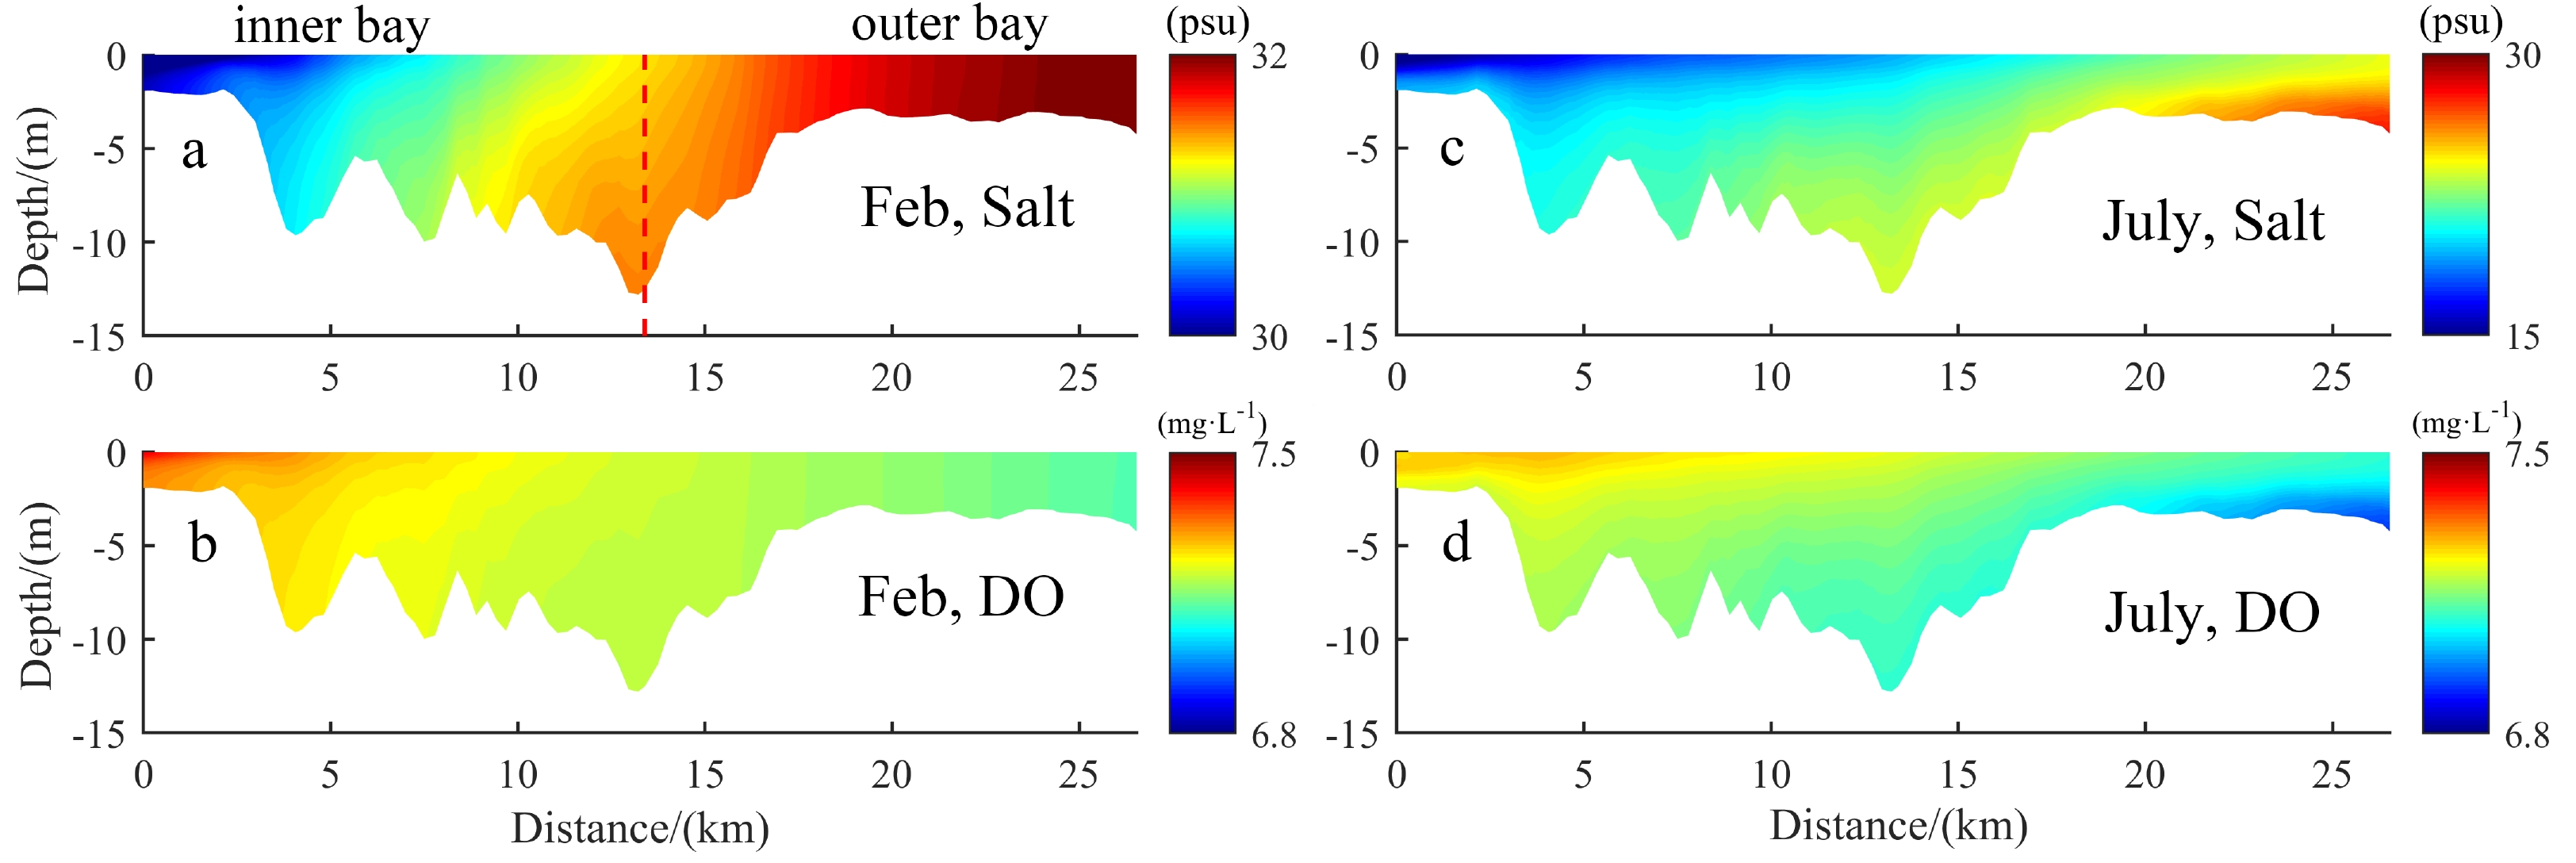
Figure 8. The monthly mean (a, c) salinity and (b, d) DO in winter (February, left panels) and summer (July, right panels) along transection A (as indicated in Fig. 1b). The red dotted line shows the location of transection B shown in Fig. 10.
Figure 9. The monthly mean (a, d) NH4, (b, e) NO3, and (c, f) PO4 in winter (February, left panels) and summer (July, right panels) along transection A (as indicated in Fig. 1b).
Figure 10. The monthly mean (a, c) salinity and (b, d) DO in winter (February, left panels) and summer (July, right panels) along transection B (as indicated in Fig. 1b). The black dotted line shows the location of transaction A shown in Figs 8 and 9.
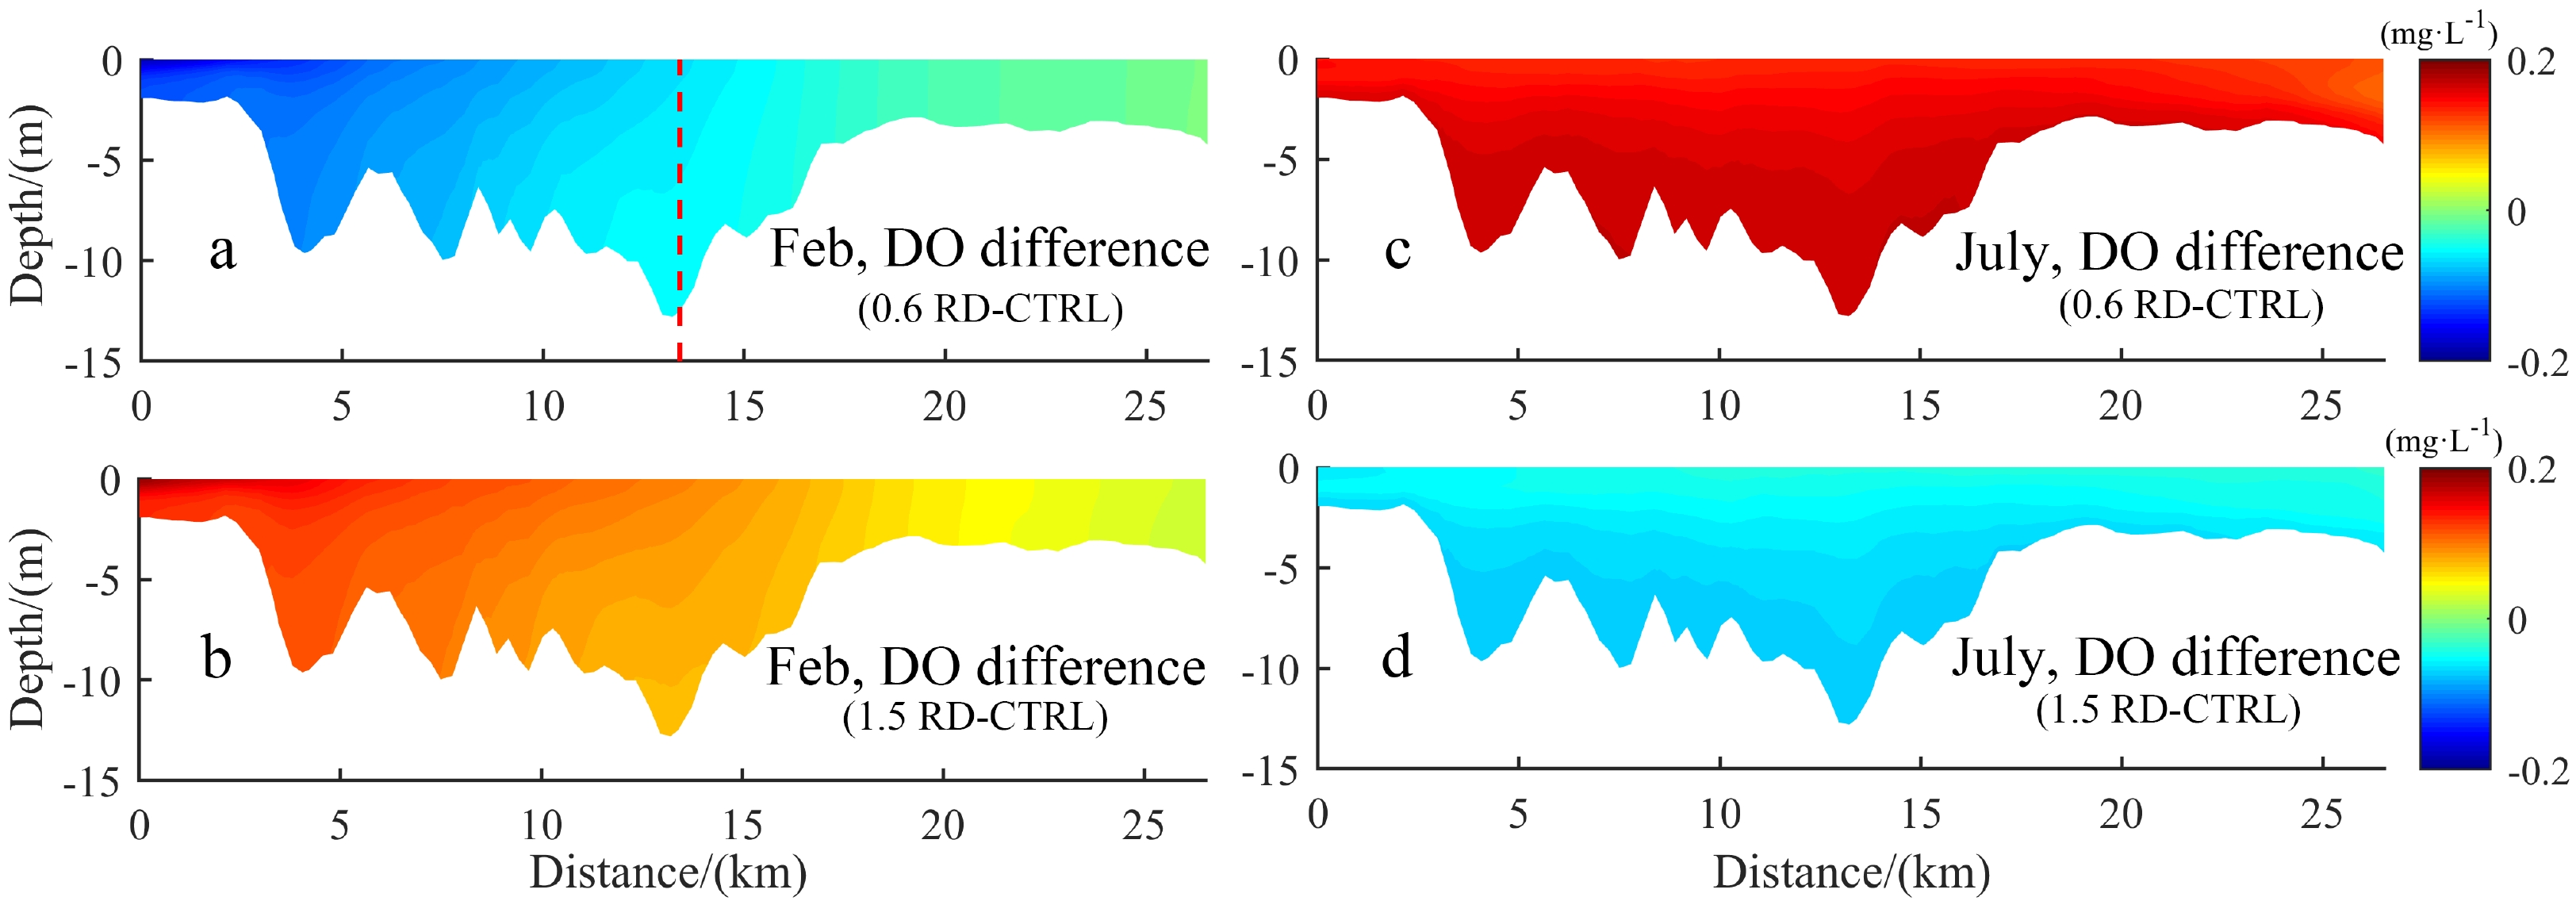
Figure 11. The differences of DO against the control experiment for the sensitivity experiments (a, c) 0.6 RD-CTRL and (b, d) 1.5 RD-CTRL in winter (February, left panels) and summer (July, right panels) along transection A (as indicated in Fig. 1b).
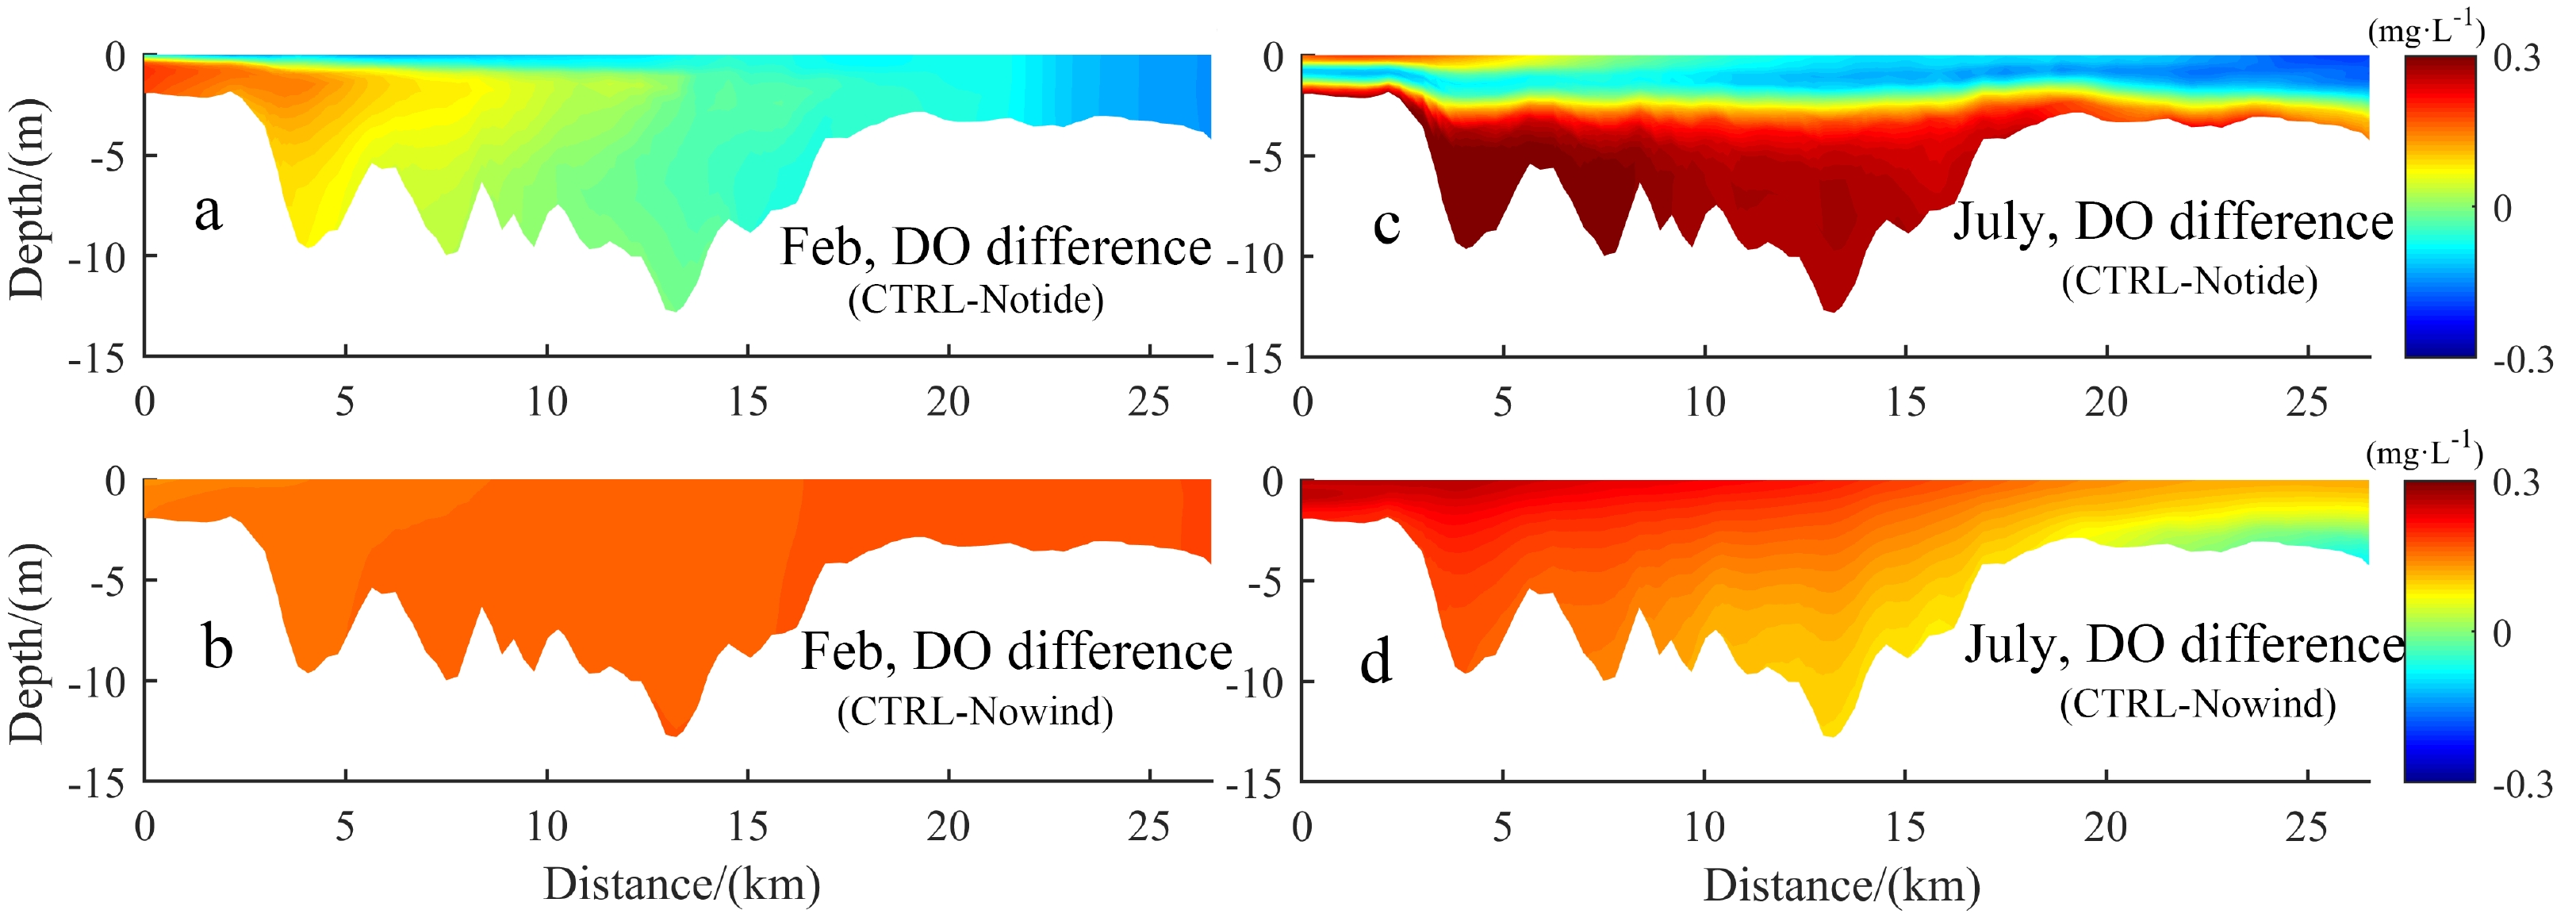
Figure 12. The differences of DO against the control experiment for the sensitivity experiments (a, c) CTRL-Notide and (b, d) CTRL-Nowind in winter (February, left panels) and summer (July, right panels) along transection A (as indicated in Fig. 1b).
Figure 13. The differences of the monthly mean (a, c) surface and (b, d) bottom currents against the control experiment for the sensitivity experiment NW in winter (February, left panels) and summer (July, right panels).


 DownLoad: