Jialong Luo, Li Jiang, Limin Hu, Zenghui Yu, Weini Chong, Fudong Lin, Fenghua Su, Yanguang Liu, Kirill Aksentov, Alexander Bosin, Anatolii Astakhov, Xuefa Shi. Temporal trend of organic carbon in East Siberian Arctic shelf sediments and its relation to the recent climate forcing.[J]. Acta Oceanologica Sinica. doi: 10.1007/s13131-020-0000-0
Citation:
Jialong Luo, Li Jiang, Limin Hu, Zenghui Yu, Weini Chong, Fudong Lin, Fenghua Su, Yanguang Liu, Kirill Aksentov, Alexander Bosin, Anatolii Astakhov, Xuefa Shi. Temporal trend of organic carbon in East Siberian Arctic shelf sediments and its relation to the recent climate forcing.[J]. Acta Oceanologica Sinica. doi: 10.1007/s13131-020-0000-0
Jialong Luo, Li Jiang, Limin Hu, Zenghui Yu, Weini Chong, Fudong Lin, Fenghua Su, Yanguang Liu, Kirill Aksentov, Alexander Bosin, Anatolii Astakhov, Xuefa Shi. Temporal trend of organic carbon in East Siberian Arctic shelf sediments and its relation to the recent climate forcing.[J]. Acta Oceanologica Sinica. doi: 10.1007/s13131-020-0000-0
Citation:
Jialong Luo, Li Jiang, Limin Hu, Zenghui Yu, Weini Chong, Fudong Lin, Fenghua Su, Yanguang Liu, Kirill Aksentov, Alexander Bosin, Anatolii Astakhov, Xuefa Shi. Temporal trend of organic carbon in East Siberian Arctic shelf sediments and its relation to the recent climate forcing.[J]. Acta Oceanologica Sinica. doi: 10.1007/s13131-020-0000-0
College of Marine Geosciences, Key Laboratory of Submarine Geosciences and Prospecting Techniques, Ocean University of China, Qingdao 266100, China
2.
Laboratory for Marine Geology, Qingdao Marine Science and Technology Center, Qingdao 266237, China
3.
Key Laboratory of Marine Geology and Metallogeny, First Institute of Oceanography, Ministry of Natural Resources, Qingdao 266061, China
4.
College of Ocean Science and Engineering, Shandong University of Science and Technology, Qingdao 266590, China
5.
V.I. Il'ichev Pacific Oceanological Institute, Far Eastern Branch Academy of Science, Vladivostok 690041, Russia
Funds:
The National Natural Science Foundation of China under contract Nos 42130412, 42376068; the Fundamental Research Funds for the Central Universities under contract No. 202241001; the Ocean Negative Carbon Emissions (ONCE) Program and the Taishan Scholar Program under contract No.TSQN20182117; the Russian Scientific Foundation under contract No. 21-77-30001; the Ministry of Science and Higher Education of the Russian Federation under contract Nos 124022100083-1 and 124022100084-8).
Arctic climate changes have profoundly influenced the polar environmental changes in recent years. Arctic Oscillation (AO), as a key component of the Arctic climate system’s internal variability, affects the source to sink processes and interactions across the multilayer Arctic system by regulating the land, ocean, sea ice, and atmospheric processes. The East Siberian Arctic Shelf (ESAS) has experienced significant changes in the input, transport, and burial of sedimentary organic carbon (OC) due to climate warming and shifts in the AO phase in recent decades. This study analyzes grain size, total organic carbon (TOC), total nitrogen (TN), and stable carbon isotope (δ13C) in two sediment cores from the ESAS to reconstruct the burial record of OC over the past few decades and examine the response mechanism of sedimentary OC records to regional-scale climate forcing. The results show that the OC in the two sediment cores originates from mixed sources with a dominant terrestrial contribution. In the LV83-28 core from the Laptev Sea, the TOC and TN content have increased at an accelerated rate since the 1990s, with a noticeable rise in the contribution of terrestrial OC. This trend is linked to an increase in terrigenous input caused by the positive AO phase. Core LV83-39 in the East Siberian Sea could have accumulated more terrestrial OC transported along the continental shelf during the positive AO. This implies that, under the interannual regulation of the AO regime, the input and cross-shelf transport of terrigenous OC in the ESAS showed consistent sedimentary responses. This finding could enhance the understanding of the burial mechanism of sedimentary OC and its environmental response to regional climate change.
In recent decades, the rate of warming in the Arctic has been significantly higher than the global average, leading to rapid climate changes that have intensified sea-land-air interactions (Chylek et al., 2022; Serreze and Barry, 2011; Wu et al., 2019). The Arctic Oscillation (AO), the dominant mode of atmospheric circulation variability in the Arctic, is considered a key factor in the internal variability of the Arctic climate system. Shifts in the AO phase regulate the processes of land, ocean, sea ice, and atmosphere, which have a profound impact on the Arctic climate (Wang et al., 2021). These processes play a crucial role in the exchange of material and energy across the Arctic system (Solomon, 2007).
The Arctic Ocean holds the world’s largest continental shelf system, which is characterized by intense sea-land-air interactions. This region is a key site for materials and energy exchanges within the Arctic multilayer system and serves as the primary repository for organic carbon (OC), accounting for about 11 % of the global OC burial (Stein and Macdonald, 2004). Due to the Arctic climate change, the processes of OC supply, burial, and preservation on the Arctic shelf are also changing, which in turn has direct feedback on both the regional and global carbon cycle (Chen et al., 2015; Martens et al., 2022; Stein and Macdonald, 2004). The East Siberian Arctic Shelf (ESAS) is an important component of the Arctic continental shelf, receiving substantial amounts of freshwater nutrients and terrestrial OC (Terr-OC), playing a key role in the biogeochemical cycle within the Arctic coastal margins (McClelland et al., 2016; Sánchez-García et al., 2011; Vetrov and Romankevich, 2019).
Particularly, the river basins and coasts of the ESAS are rich in permafrost, making them highly sensitive to climate change (Lantuit et al., 2012; McClelland et al., 2016; Peterson et al., 2002). In recent years, rising temperatures have caused the increase of precipitation and permafrost degradation, which have changed the freshwater circulation in the Arctic, leading to an increase in river runoff, transporting more terrestrial sedimentary OC to the adjacent continental shelf (Chen et al., 2015; Hu et al., 2020; Shiklomanov et al., 2021). Furthermore, the permafrost thaw also releases large amounts of permafrost OC into the continental shelf, thus increasing Terr-OC export to the ESAS (Lantuit et al., 2013; Ni et al., 2019; Stein and Macdonald, 2004). The release of permafrost OC not only produces greenhouse gases and yielding positive feedback to climate warming (Irrgang et al., 2022), but also releases old, buried carbon into the shelf sediments, thereby altering the composition of the sedimentary OC pool (Bröder et al., 2019; Hu et al., 2020). Moreover, climate warming has reduced sea ice coverage, promoted shelf primary production, and increased the contribution of marine-derived OC (Ardyna and Arrigo, 2020; Arrigo and Van Dijken, 2015; Shi et al., 2022). Therefore, understanding and assessing the changes in the sources and sinks of OC on the ESAS under rapid climate change is scientifically significant for understanding the climate response of the shelf OC cycle (Bianchi et al., 2018; Dudarev et al., 2022; Macdonald et al., 2015).
Previous studies on sedimentary OC in the Arctic shelf have focused on the spatial distribution patterns of OC, along with its burial and preservation mechanisms, indicating that Terr-OC is the main source of modern sedimentary OC on the ESAS (Karlsson et al., 2016; Martens et al., 2022; Vonk et al., 2010, 2014). However, in the context of rapid climate change, the ecological system of the ESAS has also been changing in recent decades. This involves not only the direct emission and deposition processes of carbon between land and ocean, but also the atmospheric regulation of carbon input or output processes either on land or in the ocean, which have significant impacts on the source-sink processes and fates of OC (Macdonald et al., 2015; Solomon, 2007; Stein and Macdonald, 2004). For example, the AO regulates the atmosphere-ocean circulation in the ESAS, affecting both river runoff (Bauch et al., 2011; Zhu et al., 2021) and the rate of coastal erosion (Nielsen et al., 2020), which leads to the changes in the flux of Terr-OC (including older permafrost carbon) transported to the ocean (Günther et al., 2013; Hu et al., 2020; Wang et al., 2020). Additionally, the AO also promotes the cross-shelf transport of materials (including nutrients and particulate OC) carried by shelf circulation along different pathways, potentially affecting the deposition patterns of varied OC components on the continental shelf (Charette et al., 2020; Gobeil et al., 2001; Macdonald et al., 2015; Stein and Macdonald, 2004).
In general, the large-scale interactions between the sea, land, and atmosphere significantly influence the source, transport and burial of OC within the ESAS. However, previous studies have primarily focused on the direct processes and effects of carbon emissions between land and sea. With relatively fewer studies on the transport and depositional response of OC with the large-scale factors, such as the regional climate patterns. In this study, we analyzed the OC burial records from the ESAS in recent decades and highlighted its sedimentary response to AO shifts, which could improve our understanding of these processes to interpret the source-to-sink and fate of OC in the Arctic coastal margins in the context of climate change.
2.
Sampling and methods
2.1
Study area
The ESAS includes the Laptev Sea (LS), the East Siberian Sea (ESS), and the Russian part of the Chukchi Sea. The ESAS is covered with ice for the majority of year, which is an important area for sea ice formation (Stein and Macdonald, 2004). Along the coast of the LS and ESS, sea ice generally begins to melt in June and July. Ice cover in these regions has significant interannual variability (Osadchiev et al., 2021). The surface ocean current system in the shallow continental shelf area of ESAS is driven by wind (Dmitrenko et al., 2008; Steele and Ermold, 2004). In the absence of strong wind forcing, the Coriolis force promotes the eastward transport of Eurasian freshwater along the coast to the ESS and even to the Chukchi Sea (Osadchiev et al., 2021). In addition, as the starting point of Transpolar Drift (TPD), a large part of sea ice and some fresh water in the ESAS can also be transported northward to the central basin across the shelf (Charette et al., 2020).
The LS covers an area of nearly 500 000 km2, with an average water depth of 48 meters (Stein and Macdonald, 2004). It primarily receives freshwater input from the Lena River, one of the largest Arctic rivers with an average annual runoff and sediment transport of approximately 566 km3 and 20.7—28.6 km3, respectively (Holmes et al., 2002). Most of the suspended particulate matter (85—90 %), including particulate OC, is deposited in the river deltas (Sánchez-García et al., 2011). About 30 % of the Laptev coast consists of ice complex deposit (ICD) which are ice-rich Pleistocene permafrost. The total OC flux entering the LS through coastal erosion is approximately 1.8×10⁶ t C per year (Stein and Macdonald, 2004). Additionally, the coast of the LS has a high sea ice formation rate, which is the most important source for the TPD (Stein and Macdonald, 2004). Sediments (including OC) may become incorporated into sea ice and transported into other areas (Chen et al., 2015; Hu et al., 2020)
The ESS extends for more than 1 200 kilometers from west to east, covering an area of approximately 987 000 km2 with an average depth of around 58 m (Bröder et al., 2016; Stein and Macdonald, 2004). The Siberian Coastal Current (SCC) usually flows eastward along the coast of the ESS, which significantly affects the western part of the ESS, inducing that the ESS contains two distinct depositional environments (Dudarev et al., 2022; Semiletov et al., 2012). In the western ESS, the sedimentary conditions resemble those of the LS, primarily influenced by river input and coastal erosion. The sedimentary OC in this region mainly originates from terrestrial sources delivered by rivers and coastal erosion. In contrast, the eastern ESS receives significantly less Terr-OC than the western region due to the lack of major river inflows. Nevertheless, this eastern area is influenced by the inflow of the Pacific water, which supports higher productivity (Bröder et al., 2019; Dudarev et al., 2022). As a result, marine OC produced by phytoplankton serves as a major component of sedimentary OC in this region (Dudarev et al., 2022; Stein and Macdonald, 2004).
2.2
Sampling
In this study, sediment cores LV83-28 and LV83-39 were collected using a multi-tube sampler from the ESS and LS shelf during the China-Russia Arctic Joint Expedition in September-October 2018 (Fig. 1). After the samples were taken to the deck, they were divided, sealed, and stored at -20°C until analysis.
Figure
1.
Study area and sampling station. The black rectangle in (a) highlights the important research area, and the brown dot in (b) is the collection station of cores. As shown in the figure, the black and purple arrows indicate the approximate location of Transpolar Drift (TPD) during negative and positive AO, respectively. The SCC is the Siberian Coastal Current. Coastal erosion rate from references (Lantuit et al., 2012).
The activities of 210Pb and 226Ra were determined using a low background HPGe γ-ray detector (GWL-120-15-LB-AWT, AMETEK). 226Ra was used as an index of supported 210Pb (210Pbsu), the excess 210Pb (210Pbex) activities were calculated by subtracting 226Ra activities from 210Pb activities.
In this study, the Constant Flux and Constant Sedimentation (CFCS) model was applied to calculate the average sedimentation rate. The sediment dry bulk density was calculated based on the water content of the sediment, and subsequently, the cumulative mass(g/cm2) was determined to exclude the influence of porosity on the sedimentation rate. An exponential curve was fitted with the activities of 210Pbex (dpm/g) and cumulative mass (g/cm2) to obtain the average Mass Accumulation Rate (MAR).
2.3.2
Grain size analyses
The sediment grain size analysis was conducted using a laser particle size analyzer at the Laboratory of Marine Geology and Mineralization, Ministry of Natural Resources. A 0.2 g sample was immersed in 15 mL of 3 % hydrogen peroxide for 24 hours to eliminate OC content. Subsequently, diluted hydrochloric acid (3 M) was added for another 24 hours to remove inorganic carbon. The sample underwent repeated acid washing and centrifugation until the supernatant reached neutral pH. Finally, ultrasonic vibration treatment was applied to the sample and tested with the Mastersizer 3 000 laser particle size analyzer. The instrument has a measuring range from 0.02-3 500 μm with a resolution of 0.01 diameter, ensuring that the relative error is < 3 %.
2.3.3
Total organic carbon (TOC) and total nitrogen (TN) analyses
The experiment was completed in the Laboratory of Marine Geology and Mineralization of the Ministry of Natural Resources. First, the sample was freeze-dried, and ground to 200 mesh. About 1 g of sediment was put into the centrifuge tube, and the inorganic carbon was removed by adding hydrochloric acid (1 M). After that, the sample was washed with ultra-pure water until the supernatant was neutral. The sample was then dried at 60°C and weighed to about 30 mg. It was wrapped with a tin boat and tested to obtain the percentage content of total carbon and TN. Quality control was performed using the GSD-9 standard and blank samples. The percentage of TOC is then calculated as the difference between the weight before and after pickling.
2.3.4
Stable carbon isotope (δ13C) analyses
The δ13C was determined using a high-temperature oxidation method in the Laboratory for Marine Geology, Qingdao Marine Science and Technology Center. The samples, after carbonate removal, were wrapped in a tin boat (containing about 30 μg of OC) for testing. The mass spectrometer model MAT 253 plus was used for the test, and the sampling equipment was EAIsolink. IAEA-600 and USGS-40 standards were selected as quality monitoring standards. The δ13C ratio adopted the international standard V-PDB, and the value of δ13C (‰) was calculated as follows:
where Rsample and Rstandard are the isotopic 13C/12C ratios of samples and standards, respectively. The standard deviation is < 0.1 ‰.
3.
Results
3.1
Profiles of excess210Pb
The profiles of excess 210Pb (210Pbex) activities with cumulative mass depth are shown in Fig. 2. The 210Pbex activities in the Core LV83-28 decay exponentially with cumulative mass depth, indicating that the sedimentary sequence of the core is relatively continuous and stable, with an average sedimentation rate of about 0.35 g/(cm2 yr). In contrast, the 210Pbex activities in the upper 15 cm of LV83-39 decreased exponentially with accumulated mass depth, while fluctuations observed below 15 cm. It is speculated that mixing or inversion likely occurred in the lower part. Based on the upper 15 cm of sediment, the average sedimentation rate for LV83-39 is approximately 0.33 g/(cm2 yr), which is used to estimate the age of sediments below 15 cm of accumulated mass depth. The sedimentation rate of Core LV83-28 at the Lena River estuary is comparable to that of Core LV83-39 in the western ESS. Finally, the chronological framework was established based on the sedimentation rates obtained from 210Pbex over the past few decades.
Figure
2.
Variation of 210Pb specific activity of cores LV83-28 and LV83-39 with cumulative mass depth. The red dots are abnormal data points that were not involved in chronological fitting.
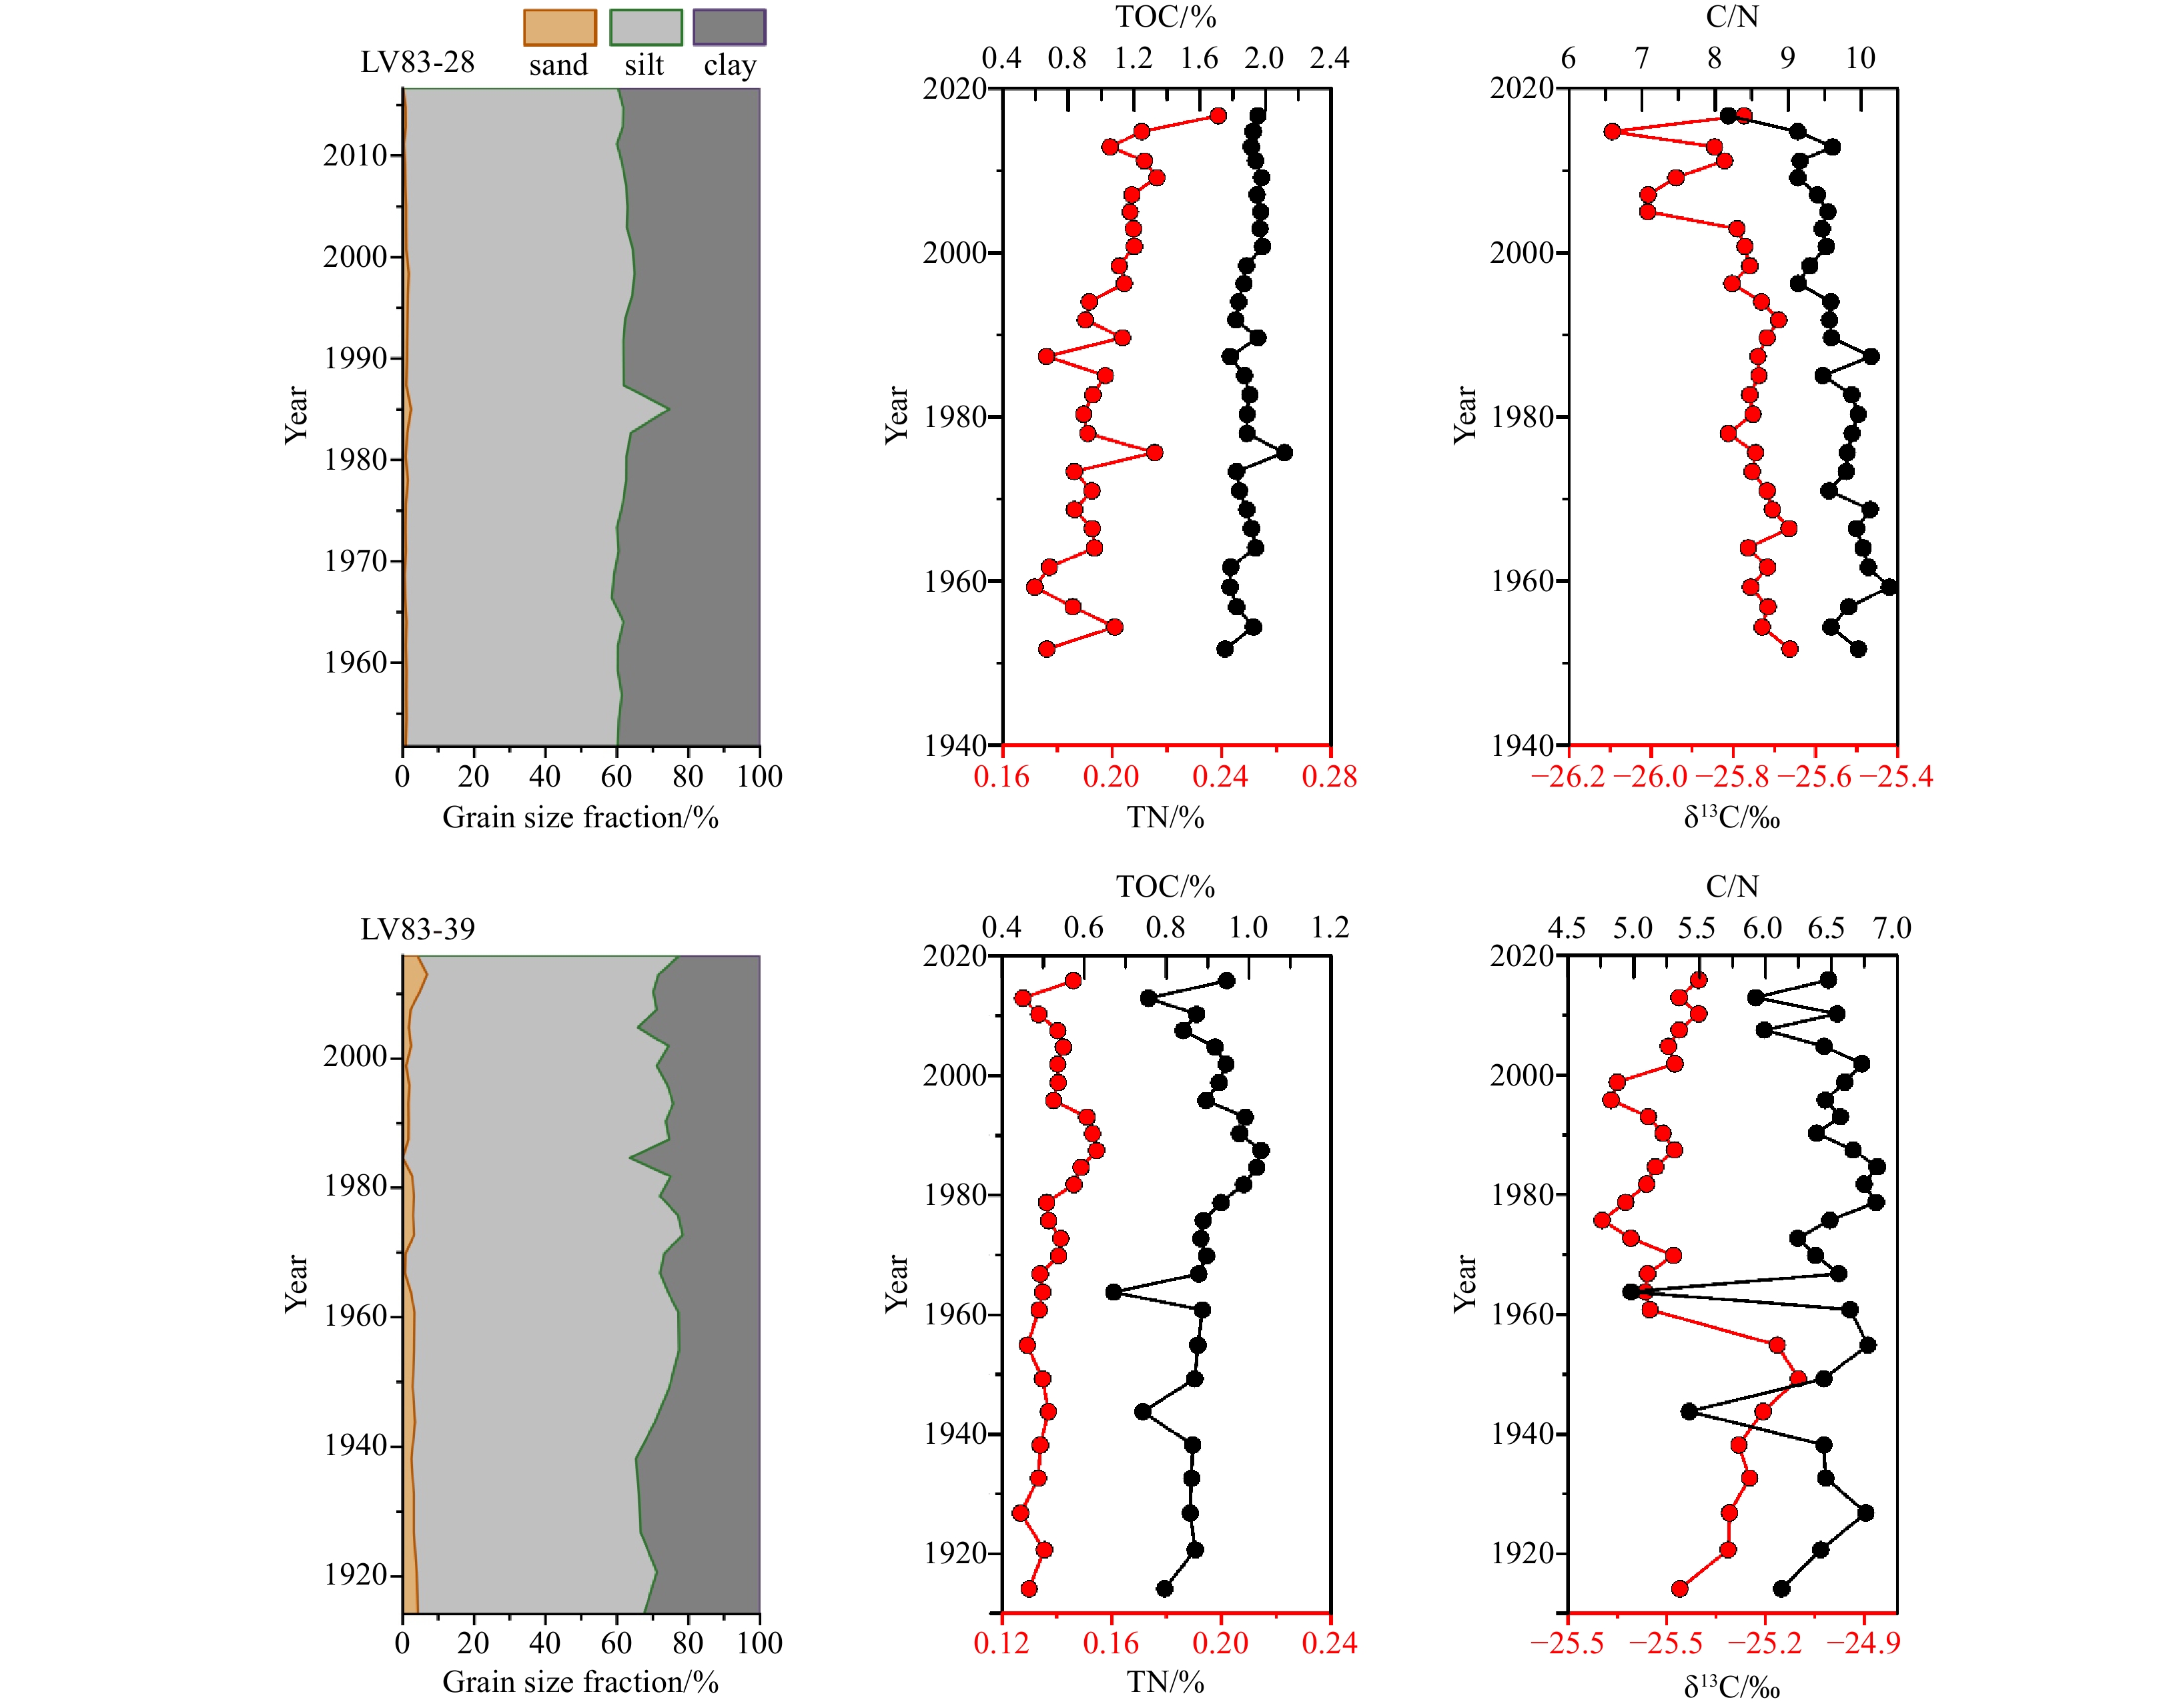
The grain size of cores LV83-28 and LV83-39 is shown in Fig. 3. The vertical variation of sediment grain size within the two cores was minimal. The grain size of LV83-28 core from the Lena River estuary is finer compared to that of Core LV83-39 from the ESS. The main components of the LV83-28 core were clayey silt, with the silt component ranging from 57.86 % to 72.31 %, averaging 61.08 % ± 2.52 %. The variation range for the sand and clay components were 0.18-2.35 % and 25.33—41.41 %, with averages of 1.04 % ± 0.40 % and 37.87 % ± 2.83 % respectively. The average grain size ranged from 6.96 Ф to 7.66 Ф, with a mean of 7.50 Ф. In contrast, the sediments from LV83-39 were primarily clayey silt, with the silt component varying from 62.86 % to 75.22 %, averaging 69.53 % ± 4.19 % The sand and clay components ranged from 0.03 % to 6.84 % and 21.59 % to 36.39 %, with averages of 2.70 % ± 1.40 % and 27.77 % ± 4.11 % respectively. The average particle size varied between 6.67—7.47 Ф, with an average of 6.95 Ф.
Figure
3.
Vertical distribution profiles of grain size, TOC, TN, C/N ratio, and δ13 C parameters of cores LV83-28 and LV83-39 (the age of sediments before 1970 in Core LV83-39 was estimated by the upper sedimentation rate).
TOC, TN, δ13C, and C/N ratios of cores LV83-28 and LV83-39 are shown in Fig. 3, and the results of the two cores were significantly different. The TOC and TN contents in Core LV83-28 were relatively high, ranged from 1.75—2.11 % (mean = 1.89 % ± 0.08 %) and 0.17—0.24 % (mean = 0.20 % ± 0.01 %) respectively, and increased from the bottom to the top. The δ13C values ranged from –25.7 ‰ to –26.1 ‰, with an average of –25.8 ‰ ± 0.10 ‰. The δ13C values were stable initially and then gradually became lighter from the bottom to the top, while the C/N ratio gradually decreased. In contrast, the TOC and TN contents in Core LV83-39 were relatively low, ranging from 0.67—1.03 % (mean = 0.89 % ± 0.08 %) and 0.13—0.15 % (mean = 0.14 % ± 0.01 %), respectively, with a relatively high value during the 1970s to the 1990s. The δ13C values ranged from –25.1 ‰ to –25.7 ‰, with an average of –25.5 ‰ ± 0.16 ‰. The δ13C values were relatively stable at the bottom but has been abnormally depleted since about the 1960s, while the C/N ratio showed a relatively high value during the same period (Fig. 3).
4.
Discussion
4.1
Sources of sedimentary OC
The δ13C values were widely used for determining the sources of sedimentary OC, reflecting the relative contributions of marine and terrestrial OC. The δ13C values for C3 and C4 plants are approximately -27 ‰ and -14 ‰, respectively (Yin et al., 2012; Zhang et al., 2018). The study area is influenced by riverine input from the Lena River, where the predominant vegetation in the basin consists of C3 plants (Ogneva et al., 2023; Vonk et al., 2017). Consequently, the end-member δ13C values were selected as -27 ‰ for Terr-OC and -21 ‰ for marine OC origins (Semiletov et al., 2011; Vonk et al., 2014). Utilizing the two-end-member mixing model is an important method to evaluate the relative contribution of Terr-OC to TOC (Walsh et al., 1989), Terr-OC can be calculated using the following equation:
where δ13Cterr and δ13Cmar are the isotope values of the terrigenous and marine OC endmembers. The results indicate that the Terr-OC contribution in cores LV83-28 and LV83-39 ranges from 77 % to 84 % (mean = 79 %) and 68 % to 78 % (mean = 74 %), respectively. Overall, the sedimentary OC in both cores was derived from a mixture of terrestrial and marine sources, with Terr-OC being the predominant contributor, which aligns with findings from previous studies on surface sediments (Karlsson et al., 2016; Semiletov et al., 2011; Vonk et al., 2014).
The C/N ratio also serves as an important index for the origin of sedimentary OC (Schmidt et al., 2010; Yin et al., 2012). Generally, the C/N ratio for Terr-OC is predominantly derived from higher terrestrial plants > 15, whereas marine OC typically exhibits a C/N ratio at around 6 (McClelland et al., 2016; Xia et al., 2022; Zhang et al., 2018). It should be noted that the C/N ratio is defined as the ratio of TOC to total organic nitrogen (TON). Given that TN in sediments can be influenced by the binding of sedimentary clay particles with inorganic nitrogen (Müller, 1977), corrections must be applied when utilizing the sediment TOC/TN ratio as a substitute for the C/N ratio in assessing the source of OC. Otherwise, the obtained C/N ratio will be underestimated (Stein and Macdonald, 2004).
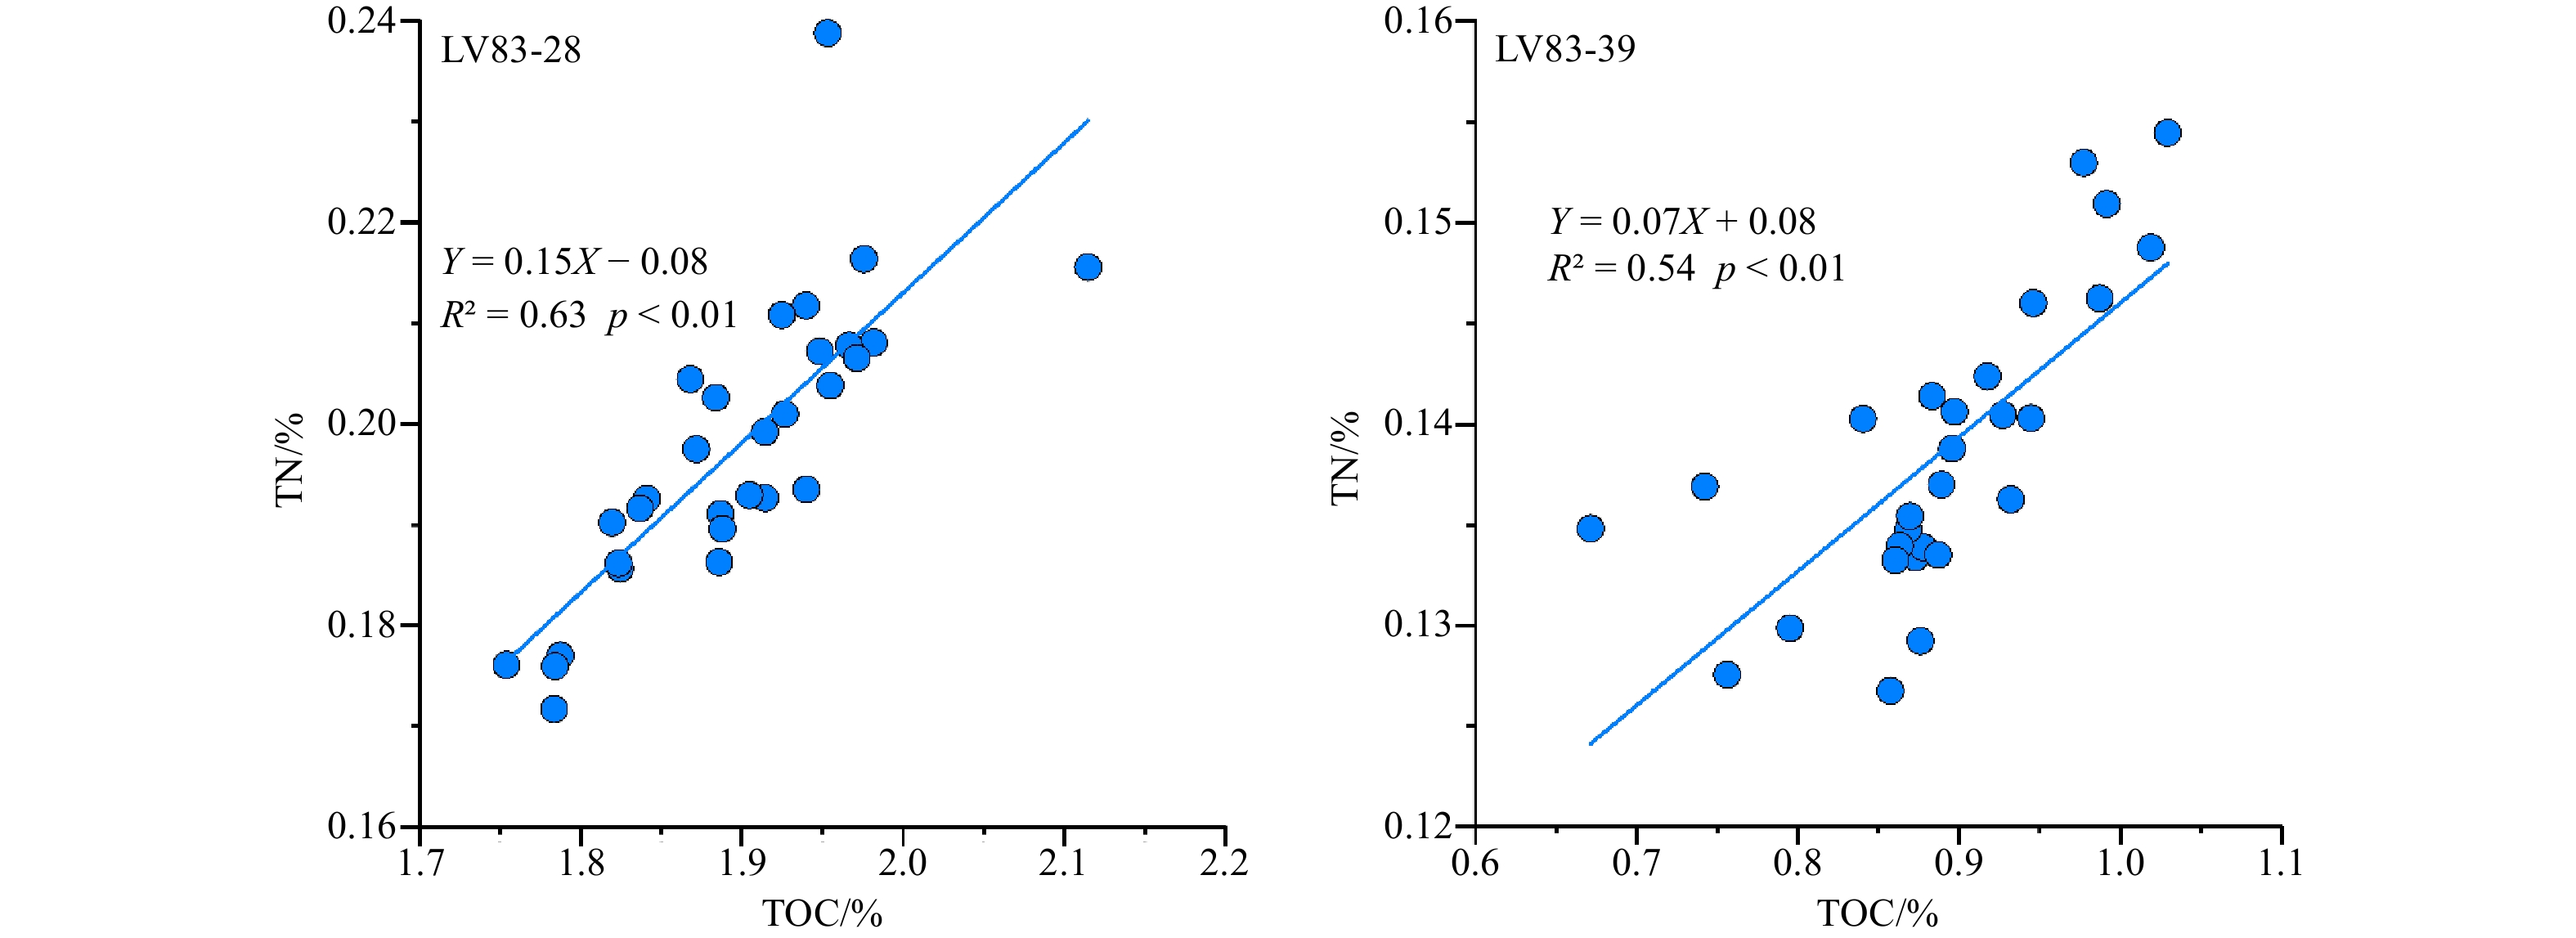
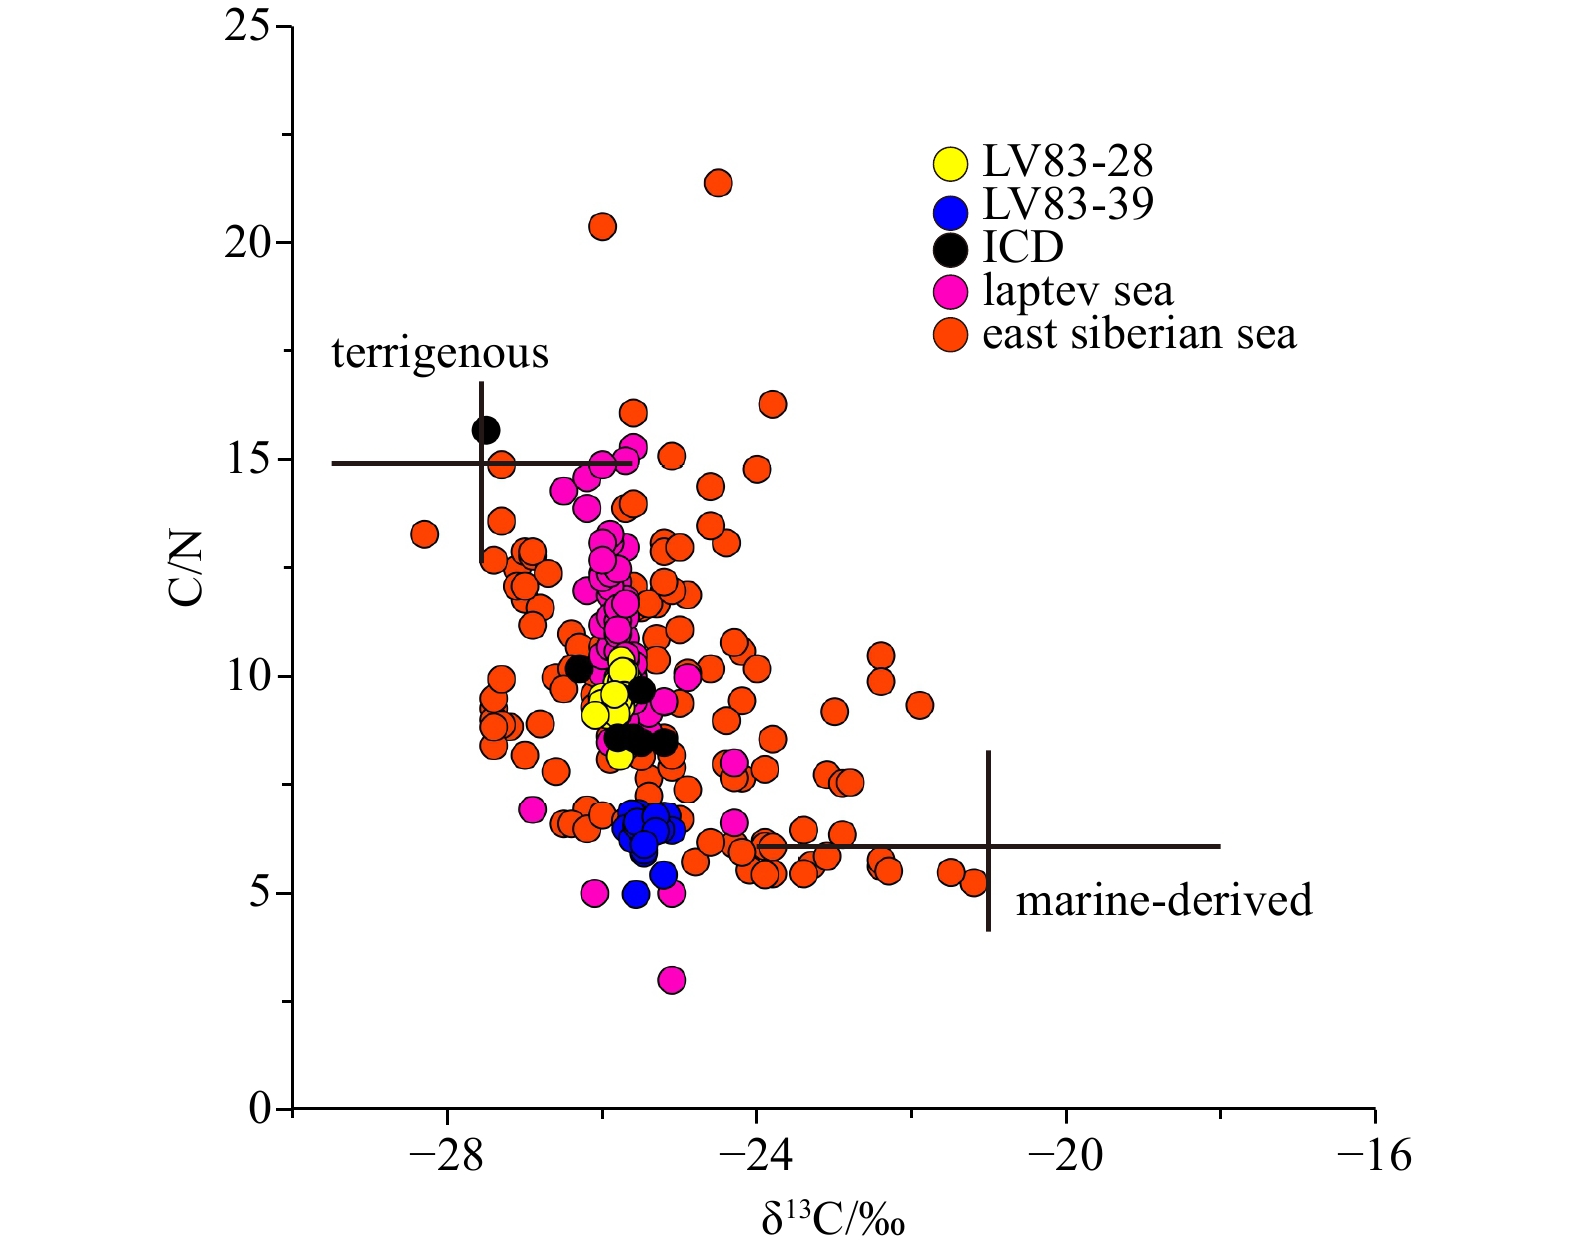
The C/N ratio of Core LV83-28 ranged from 8.2 to 10.4, with a mean value of 9.6, higher than the average value of 6.5 observed in Core LV83-39, which ranged from 5.0 to 6.9. A previous study has indicated that the corrected C/N ratio for sediments in the LS is between 10 to 25 (Stein and Macdonald, 2004), aligning closely with the C/N ratio observed in Core LV83-28. In contrast, the lower C/N ratio of Core LV83-39 indicates that of marine OC origins, which contradicts the δ13C results (Fig. 3). As illustrated in Fig. 4, when the TOC content of Core LV83-28 is zero, the TN value is less than zero, suggesting minimal influence from inorganic nitrogen. However, the TN value of Core LV83-39 exceeds zero when the TOC content is zero, indicating the influence of inorganic nitrogen. The diagram of the relationship between TOC and TN is helpful to estimate the content of total inorganic nitrogen (TIN), and the positive TN intercept at TOC = 0 represents the estimated TIN content. After a correction for the proportion of TON (using TON = TN – TIN), the corrected C/N ratio for Core LV83-39 ranged from 12.1 to 18.1, with an average of 15.1, which closely resembles the C/N ratio of Terr-OC. This finding implies that Core LV83-39 is predominantly influenced by terrigenous input, in agreement with the δ13C values. Furthermore, based on the dual-end-member scatter plot delineating terrigenous and marine sources (Fig. 5), the data from both cores are situated in the region between the terrigenous and marine end members, with the corresponding mixed OC sources.
Figure
4.
Correlation between TOC and TN in cores LV83-28 and LV83-39.
Figure
5.
The C/N and δ13C ratios for samples and two putative end-members corresponding to the major particulate OC sources. The end-member values are taken from literature (Xia et al., 2022);ICD permafrost data are taken from literature (Vonk et al., 2017); The points of the LS and ESS are surface sediment data from literature (Vonk et al., 2012).
Core LV83-28 is situated near the Lena River estuary and exhibits relatively high TOC and TN contents compared to Core LV83-39 (Figs. 1 and 3). The Lena River serves as the primary source of Terr-OC in the LS, discharging approximately 1.2 × 10⁶ tons of particulate OC and 3.6 × 10⁶ tons of dissolved OC into the estuary annually, with most sediments being deposited in the nearshore area (Semiletov et al., 2011; Stein and Macdonald, 2004). In Core LV83-28, TOC and TN contents increased from the bottom to the top, with a more pronounced rise observed since the 1990s. Linear regression analysis indicates a strong positive correlation between TOC and TN (Fig. 4), suggesting that these components originate from the same source. Conversely, the δ13C values decreased toward the top of the core, contrasting with the increasing trend of TOC (Fig. 3).
The Core LV83-39 is located near the Indigirka River estuary, with relatively low TOC and TN contents (Figs. 1 and 3). A positive correlation between TOC and TN indicates that they likely originate from the same source (Fig. 4). During the early 1970s to the late 1990s, TOC and TN contents showed higher values, while δ13C values are abnormally depleted (Fig. 3), suggesting a potential shift in the contribution and input pathway of OC.
4.3
Temporal variation in OC records and its sedimentary response
4.3.1
Evolution of sedimentary OC and the influencing factors
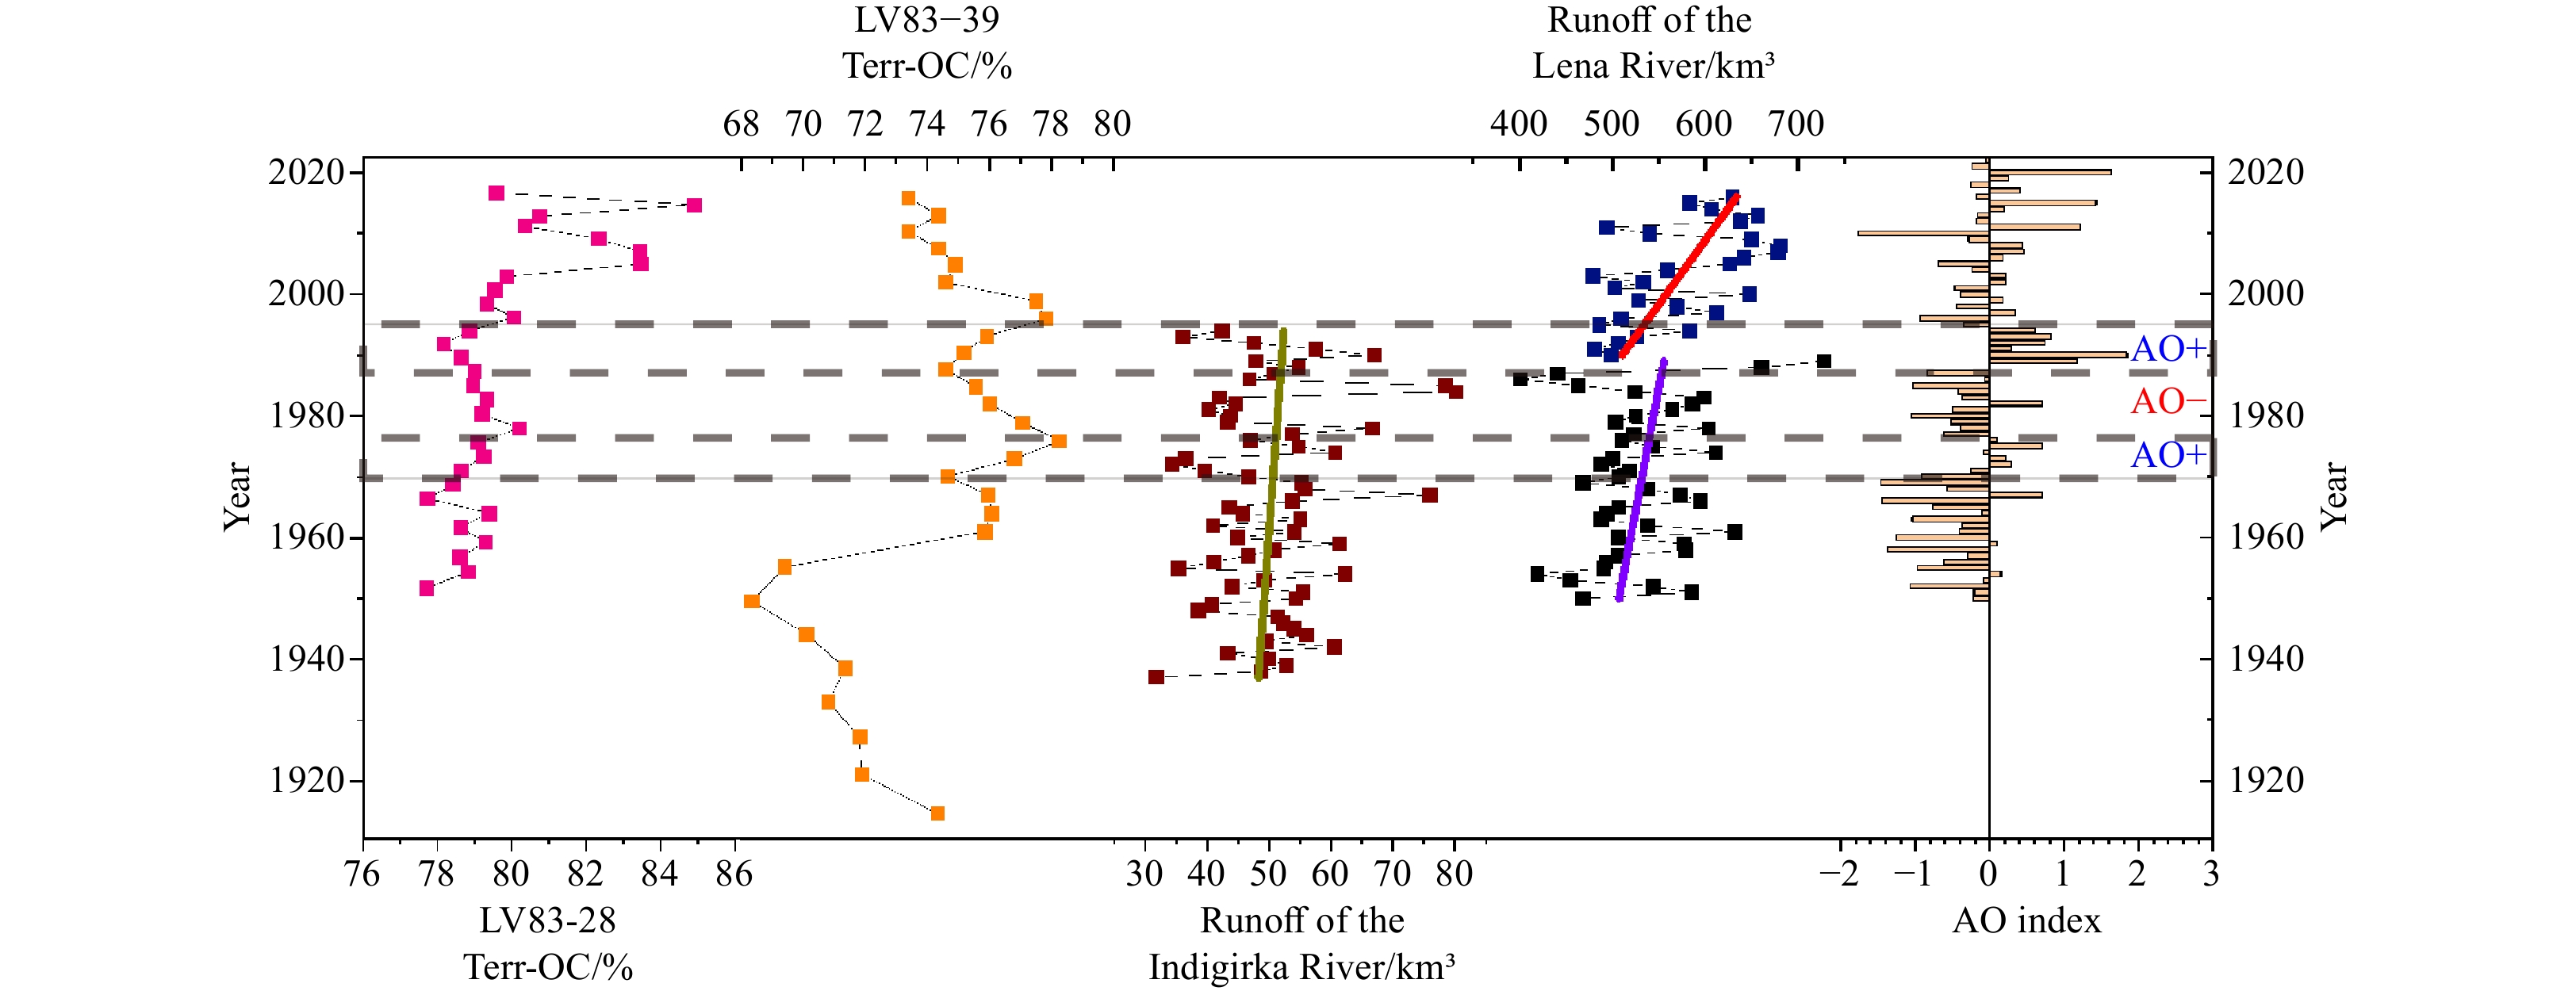
In general, the amount of OC input is positively correlated with the discharge of Arctic rivers (McClelland et al., 2016; Mu et al., 2019). The accelerated growth in the Lena River runoff since the 1990s has contributed to the increase of Terr-OC input (Fig. 6) (Liu et al., 2021; Mu et al., 2019). This aligns with the significant increase of TOC content and Terr-OC records of Core LV83-28 (Figs. 3 and 6), indicating the influence of enhanced river runoff on the OC burial in the Core LV83-28. Core LV83-39 exhibited a stable contribution of Terr-OC at the bottom, while the upper section showed an abnormal increase in contribution from 1970 to the late 1990s (Fig 6). However, the stable runoff of the Indigirka River suggests that the Core LV83-39 received additional Terr-OC supply besides the Indigirka River (Fig. 6). The source of this additional Terr-OC likely involves processes such as Terr-OC inputs transported from other areas, which will be discussed further below.
Figure
6.
Interannual variations of Terr-OC contribution in LV83-28 and LV83-39 cores and annual runoff of the Lena and Indigirka Rivers. The AO index data from the National Oceanic and Atmospheric Administration (NOAA) (http://www.cpc.ncep.noaa.gov). The Lena River runoff from Arctic Great Rivers Observatory data set (https://arcticgreatrivers.org/data/). The Indigirka River runoff from the data set (R-ArcticNet - A Database of Pan-Arctic River Discharge (unh.edu)).
Coastal erosion is an important contributor to OC burial in the ESAS. Climate warming has led to widespread permafrost thaw and ground-ice melt, which has enhanced the erosion of the Arctic coast (Irrgang et al., 2022; Nielsen et al., 2022). The acceleration in coastal erosion rates in response to climate warming could potentially release more ICD carbon that has been preserved in the ESAS coast (Günther et al., 2013; Irrgang et al., 2022; Martens et al., 2022). In addition, both river input and coastal erosion supply nutrients to the ESAS, thus sustaining primary production and possibly increasing the presence of marine OC (Terhaar et al., 2021). Therefore, the diverse sources of sedimentary OC comprehensively affect the OC supply and are subject to change in response to rapid climate change, which would lead to new changes in the buried records of sedimentary OC in the ESAS.
4.3.2
Response of OC burial records to the AO phase
The contents of TOC and TN have increased significantly since 1990 in Core LV83-28, accompanied by an increase in the contribution of Terr-OC. The similarity in average grain size between this section and the bottom sediments, with average values of 7.49 Ф and 7.51 Ф respectively, excludes the influence of grain size effect (Mayer, 1994). Therefore, as mentioned above, the increase in Terr-OC contribution could be related to the rise in runoff from the Lena River (Figs. 3 and 6). River runoff, as an important factor affecting the input influx of sedimentary OC in the ESAS, is controlled by changes in precipitation (Mu et al., 2019; Wang et al., 2020). Previous studies have shown that the interannual variability of precipitation in Siberia is influenced by the AO phase (Bauch et al., 2011; Zhu et al., 2021). The positive AO phase in winter favors spring moisture transport, thus bringing more precipitation to Siberia, which contributes to the increase of river runoff and riverine OC input (Bauch et al., 2011; Zhu et al., 2021).
The AO (average from November to April) was predominantly in negative phases prior to 1990 (Fig. 6) (Wang et al., 2021), during which TOC, TN, and δ13C values in Core LV83-28 were relatively stable. Since 1990, the increase in the AO-positive phase has been consistent with a rapid rise in the Lena River runoff (Fig. 6), coinciding with previous findings that the rise in river runoff has a strong corresponding relationship with the positive AO (Fichot et al., 2013; Ogi and Tachibana, 2006; Xie et al., 2023). The contribution of Terr-OC in Core LV83-28 has increased significantly since the 1990s, further suggesting that the significant positive trend of AO has enhanced Terr-OC inputs (Fig. 3). In addition, positive AO has also promoted the OC input by coastal erosion, which could contribute to Terr-OC input in the LV83-28 core since the 1990s (Günther et al., 2013; Nielsen et al., 2020). Therefore, a shift in the AO phase is a significant factor influencing Terr-OC input and subsequent accumulation in the ESAS.
The profiles of TOC and TN in Core LV83-39 were relatively stable before the 1970s (Fig. 3), but with a significant change in δ13C values. Based on the estimated age of the bottom sediments, the δ13C values exhibited a marked depletion around 1960, which may be attributed to vertical sediment mixing indicated by the change of 210Pb (Figs. 2 and 3). Conversely, from the early 1970s to the late 1990s in Core LV83-39, the contents of TOC and TN were elevated with abnormally depleted δ13C values, despite no significant change in the average sediment size compared to other sections (Fig. 3). In this section, the contribution of Terr-OC increased in association with a sustained positive AO, while an opposite trend was observed during negative AO phases (Fig. 6). This suggests that the record of sedimentary OC of Core LV83-39 may have been controlled by the AO phase since 1970. However, as mentioned above, the increase in Terr-OC in Core LV83-39 was not a result of AO-related enhancements in river runoff, but rather due to other processes.
Previous studies have demonstrated that the AO affects sediment transport between the LS and the ESS by modulating the ESAS circulation (Bröder et al., 2019). During positive AO phases, cyclonic circulation dominates in the ESAS, strengthening the SCC that transports sediments from the LS to the ESS (Fig. 7a). In contrast, during negative AO phases, anticyclonic circulation prevails, driving sediment carried by the Lena plume across the shelf into the deeper part of the Arctic Ocean (Fig. 7b) (Bröder et al., 2019; Charkin et al., 2011; Wegner et al., 2013). Additionally, sea ice plays a crucial role in sediment transport (Chen et al., 2015; Hu et al., 2020). During positive AO phases, sea ice can transport sediments from the LS to the Alaska coast where they may become preserved in the sedimentary record (Darby et al., 2012; Rigor et al., 2002). Conversely, during the negative phase of AO, sea ice from the LS is transported to the Eurasian basin via the TPD, potentially reducing the sediment transport to the ESS (Gobeil et al., 2001; Macdonald et al., 2015; Mysak, 2001). The sedimentary records of Core LV83-39 showed that the contribution of Terr-OC increased with a continuous positive AO (Fig. 6). This increase corresponds with the transport of Terr-OC via freshwater and sea ice from the LS to the ESS during positive AO phases (Osadchiev et al., 2021; Stein and Macdonald, 2004), suggesting that the LV83-39 core received sedimentary OC supplies from the LS during these periods.
Figure
7.
Transport patterns of Sedimentary OC on the ESAS under different AO phases. (a) During the positive AO (AO+), the ESAS is dominated by cyclonic circulation, the input of rivers and coast erosion increased, and the SCC developed. (b) During the negative AO (AO-), the ESAS is dominated by anticyclonic circulation, freshwater and sea ice transport northward preferentially.
There is evidence that from 1990 to the late 1990s, the positive AO facilitated the transfer of low salinity waters from the LS to the ESS, accompanied by the disappearance of the cold halocline layer in the Eurasian Basin (Dmitrenko et al., 2008; Morison et al., 2006; Steele and Boyd, 1998). This further supports that substances (including OC) could be transported from the LS to the ESS carried by fresh water and sea ice, thus increasing the Terr-OC contribution observed in the Core LV83-39 (Fig. 6) (Charette et al., 2020; Macdonald et al., 2005; Stein and Macdonald, 2004; Wegner et al., 2013). Since the late 1990s, the contribution of Terr-OC in Core LV83-39 has declined to low values, aligning with a medium or negative AO phase (Figs. 3 and 6). This decline corresponds with the recovery of the cold halocline layer in the Eurasian Basin (Boyd et al., 2002), indicating a shift of freshwater and sea ice carrying sediments back to the LS. The reduction in sediment transport from the LS to the ESS has significant implications for the decrease in Terr-OC content in Core LV83-39, indicating that the Terr-OC supply in Core LV83-39 returned to being influenced primarily by the Indigirka River. Conversely, the contribution of Terr-OC in Core LV83-28 has shown an increasing trend during this period, likely related to rising runoff from the Lena River (Fig. 6), indicating that it is primarily influenced by changes in OC input flux. Therefore, compared to Core LV83-28, Core LV83-39 is more significantly affected by circulation patterns governed by the AO, highlighting its sensitivity to changes in cross-shelf transport of OC under the AO control (Fig. 7).
As mentioned above, the sedimentary records of both cores remained relatively stable during the continuous negative phase of the AO; however, during the positive phase of the AO, the input of sedimentary OC in both cores exhibited significant variability. The primary controlling factors for the Terr-OC changes in the two cores were different. Core LV83-28 was dominated by variations in sediment input flux, while Core LV83-39 was predominantly controlled by changes in the transport pathways of sedimentary OC within the shelf. In recent years, with global warming, the AO has tended toward a positive phase (Chylek et al., 2022; Jeong et al., 2022; Shindell et al., 1999). The variations in river runoff, permafrost, and coastal erosion have changed the input of terrestrial sedimentary OC into the ocean (Irrgang et al., 2022; Lantuit et al., 2013; Macdonald et al., 2005; Martens et al., 2022). On the other hand, the accelerated decline in Arctic sea ice concentration enlarges the interaction area between the ocean and the atmosphere, further amplifying the influence of the AO on the transport of OC in the shelf by regulating the Arctic atmospheric circulation system (Fig. 7) (Hudson et al., 2024). These processes are likely to become more complicated and variable with ongoing climate warming and the positive trend of AO. Therefore, further understanding the response of Arctic sedimentary OC to climate change is of great significance for elucidating the dynamics of the carbon cycle in the Arctic.
5.
Conclusions
The TOC and TN contents in Core LV83-28 from the LS were higher than those in Core LV83-39 from the ESS. Vertical profiles of TOC and TN contents of Core LV83-28 showed an increase from the bottom to the top of the core, with an accelerated rise observed since 1990. Core LV83-39 exhibited stable TOC and TN contents at the bottom layer, with high values from 1970 to the late 1990s, followed by a decline at the uppermost section. Sedimentary OC in both cores showed high Terr-OC contribution, mainly influenced by riverine inputs and coastal erosion. Since the 1990s, the positive trend of the AO has promoted a greater Lena runoff and accelerated coastal erosion, resulting in an increase in the contribution of Terr-OC in Core LV83-28. From 1970 to the late 1990s, positive AO promoted the development of SCC, which led Core LV83-39 to receive a larger influx of OC from the LS, resulting in the corresponding increase in the contribution of Terr-OC. These changes demonstrate that OC inputs and dispersal under shelf circulation, controlled by the AO, could modulate the spatio-temporal patterns of OC burial within the shelf. The sources, transport patterns and sedimentary records of OC in the ESAS vary with changes in the AO phase under the rapid climate change. These shifts, in turn, affect the burial and fate of shelf sedimentary OC, and have important implications for further understanding the impact of climate change on the translocation and fate of OC in the Arctic Ocean.
Jialong Luo, Li Jiang, Limin Hu, Zenghui Yu, Weini Chong, Fudong Lin, Fenghua Su, Yanguang Liu, Kirill Aksentov, Alexander Bosin, Anatolii Astakhov, Xuefa Shi. Temporal trend of organic carbon in East Siberian Arctic shelf sediments and its relation to the recent climate forcing.[J]. Acta Oceanologica Sinica. doi: 10.1007/s13131-020-0000-0
Jialong Luo, Li Jiang, Limin Hu, Zenghui Yu, Weini Chong, Fudong Lin, Fenghua Su, Yanguang Liu, Kirill Aksentov, Alexander Bosin, Anatolii Astakhov, Xuefa Shi. Temporal trend of organic carbon in East Siberian Arctic shelf sediments and its relation to the recent climate forcing.[J]. Acta Oceanologica Sinica. doi: 10.1007/s13131-020-0000-0
Figure 1. Study area and sampling station. The black rectangle in (a) highlights the important research area, and the brown dot in (b) is the collection station of cores. As shown in the figure, the black and purple arrows indicate the approximate location of Transpolar Drift (TPD) during negative and positive AO, respectively. The SCC is the Siberian Coastal Current. Coastal erosion rate from references (Lantuit et al., 2012).
Figure 2. Variation of 210Pb specific activity of cores LV83-28 and LV83-39 with cumulative mass depth. The red dots are abnormal data points that were not involved in chronological fitting.
Figure 3. Vertical distribution profiles of grain size, TOC, TN, C/N ratio, and δ13 C parameters of cores LV83-28 and LV83-39 (the age of sediments before 1970 in Core LV83-39 was estimated by the upper sedimentation rate).
Figure 4. Correlation between TOC and TN in cores LV83-28 and LV83-39.
Figure 5. The C/N and δ13C ratios for samples and two putative end-members corresponding to the major particulate OC sources. The end-member values are taken from literature (Xia et al., 2022);ICD permafrost data are taken from literature (Vonk et al., 2017); The points of the LS and ESS are surface sediment data from literature (Vonk et al., 2012).
Figure 6. Interannual variations of Terr-OC contribution in LV83-28 and LV83-39 cores and annual runoff of the Lena and Indigirka Rivers. The AO index data from the National Oceanic and Atmospheric Administration (NOAA) (http://www.cpc.ncep.noaa.gov). The Lena River runoff from Arctic Great Rivers Observatory data set (https://arcticgreatrivers.org/data/). The Indigirka River runoff from the data set (R-ArcticNet - A Database of Pan-Arctic River Discharge (unh.edu)).
Figure 7. Transport patterns of Sedimentary OC on the ESAS under different AO phases. (a) During the positive AO (AO+), the ESAS is dominated by cyclonic circulation, the input of rivers and coast erosion increased, and the SCC developed. (b) During the negative AO (AO-), the ESAS is dominated by anticyclonic circulation, freshwater and sea ice transport northward preferentially.


 DownLoad: