Lingfang Fan, Min Chen, Zifei Yang, Minfang Zheng, Yusheng Qiu. Alleviated photoinhibition on nitrification in the Indian Sector of the Southern Ocean[J]. Acta Oceanologica Sinica, 2024, 43(7): 52-69. doi: 10.1007/s13131-024-2379-7
Citation:
Lingfang Fan, Min Chen, Zifei Yang, Minfang Zheng, Yusheng Qiu. Alleviated photoinhibition on nitrification in the Indian Sector of the Southern Ocean[J]. Acta Oceanologica Sinica, 2024, 43(7): 52-69. doi: 10.1007/s13131-024-2379-7
Lingfang Fan, Min Chen, Zifei Yang, Minfang Zheng, Yusheng Qiu. Alleviated photoinhibition on nitrification in the Indian Sector of the Southern Ocean[J]. Acta Oceanologica Sinica, 2024, 43(7): 52-69. doi: 10.1007/s13131-024-2379-7
Citation:
Lingfang Fan, Min Chen, Zifei Yang, Minfang Zheng, Yusheng Qiu. Alleviated photoinhibition on nitrification in the Indian Sector of the Southern Ocean[J]. Acta Oceanologica Sinica, 2024, 43(7): 52-69. doi: 10.1007/s13131-024-2379-7
College of Ocean and Earth Sciences, Xiamen University, Xiamen 361102, China
Funds:
The National Natural Science Foundation of China under contract No. 41721005; the Fund of the Ministry of Natural Resources of the People’s Republic of China under contract Nos IRASCC 02-01-01 and 01-01-02C.
Nitrification, a central process in the marine nitrogen cycle, produces regenerated nitrate in the euphotic zone and emits N2O, a potent greenhouse gas as a by-product. The regulatory mechanisms of nitrification in the Southern Ocean, which is a critical region for CO2 sequestration and radiative benefits, remain poorly understood. Here, we investigated the in situ and dark nitrification rates in the upper 500 m and conducted substrate kinetics experiments across the Indian Sector in the Cosmonaut and Cooperation seas in the late austral summer. Our findings indicate that light inhibition of nitrification decreases exponentially with depth, exhibiting a light threshold of 0.53% photosynthetically active radiation. A positive relationship between dark nitrification and apparent oxygen utilization suggests a dependence on substrate availability from primary production. Importantly, an increased ${\mathrm{NH}}_4^+ $ supply can act as a buffer against photo-inhibitory damage. Globally, substrate affinity (α) increases with depth and transitions from light to dark, decreases with increasing ambient ${\mathrm{NH}}_4^+ $, and exhibits a latitudinal distribution, reflecting substrate utilization strategies. We also reveal that upwelling in Circumpolar Deep Water (CDW) stimulates nitrification through the introduction of potentially higher iron and deep diverse nitrifying microorganisms with higher α. We conclude that although light is the primary limiting factor for nitrification in summer, coupling between substrate availability and CDW upwelling can overcome this limitation, thereby alleviating photoinhibition by up to 45% ± 5.3%.
The Southern Ocean plays a crucial role in global carbon sequestration and climate change mitigation through the primary production of phytoplankton (DeVries, 2014; Gruber et al., 2023). However, nitrification releases N2O, a potent greenhouse gas that counteracts the carbon sink effect in the ocean (Law and Ling, 2001). In classical nitrification, ammonia-oxidizing archaea (AOA) and ammonia-oxidizing bacteria (AOB) convert ammonium into nitrite, which is subsequently oxidized to nitrate by nitrite-oxidizing bacteria (NOB). Their activity in the euphotic zone directly influences the composition of inorganic nitrogen and the production of regenerative nitrate for phytoplankton assimilation, thereby affecting the strength of marine biological pumps. Elucidating the magnitude and environmental regulation of nitrification rates is critical to understanding carbon and nitrogen cycles in the Southern Ocean fully.
Studies on nitrification in the Southern Ocean are limited (summarized in Table S1) and focus on areas north of 60°S (Olson, 1981; Bianchi et al., 1997; Mdutyana et al., 2020, 2022a, 2022b; Raes et al., 2020), in the Antarctic coastal waters (Tolar et al., 2016b; Alcamán-Arias et al., 2022), and in naturally iron-fertilized areas (Cavagna et al., 2015; Fripiat et al., 2015), which are not representative of the open Southern Ocean. Owing to diverse research objectives and early technical constraints, studies have mainly focused on the different steps of nitrification, such as the total nitrification rate (NR, oxidation of ${\mathrm{NH}}_4^+ $ to ${\mathrm{NO}}_{{x}}^- $) or individual steps (${{\mathrm{NH}}_4^+}_{\mathrm{ox}} $ and/or ${{\mathrm{NO}}_2^-}_{\mathrm{ox}} $). Decoupling may occur between ${{\mathrm{NH}}_4^+}_{\mathrm{ox}} $ and ${{\mathrm{NO}}_2^-}_{\mathrm{ox}} $ due to different light sensitivities (Guerrero and Jones, 1996; Merbt et al., 2012), posing challenges in direct comparison of reported nitrification rates. An enhanced resolution and understanding of complex nitrification interactions with physicochemical factors in the Southern Ocean are necessary.
The debate on light inhibition of nitrification continues. The consistent finding of higher nitrification rates at the base of the euphotic zone has led to a growing acceptance that light suppression is responsible for the reduced nitrification in the epipelagic zone (Shiozaki et al., 2019; Lu et al., 2020), although whether this photoinhibition to nitrifiers is direct (Qin et al., 2014) or indirect via photochemical production of H2O2 (Kim et al., 2016) remains to be resolved (Hollibaugh, 2017). The notion of photoinhibition is further supported by the potential competition of phytoplankton for ${\mathrm{NH}}_4^+ $ under light conditions (Smith et al., 2014b; Wan et al., 2018), along with the lack of competitive advantage for iron in AOA (Shafiee et al., 2019). However, the elevated abundance of nitrifying microorganisms, particularly Nitropumilus and Nitrosopelagicus (Sow et al., 2022; Gwak et al., 2023), at shallower depths in the polar seas (Shiozaki et al., 2016; Sintes et al., 2016) compared to the peak abundances in the mesopelagic zone in low-latitude oceans (Santoro et al., 2019) may indicate that the Southern Ocean plays a unique role in global nitrification. The biogeochemical results highlight the importance of summer nitrification in the Southern Ocean, as demonstrated by field-measured nitrification rates (Tolar et al., 2016b; Alcamán-Arias et al., 2022) and isotopic signals of nitrate (Fripiat et al., 2015) and nitrite (Chen et al., 2023). Furthermore, evidence indicates that some shallow-water AOA groups (WCA) (Francis et al., 2005) have strong potential for antioxidation and resistance to photodamage (Luo et al., 2014; Santoro et al., 2015) and remain active at high irradiance levels (Smith et al., 2014b). These findings contradict the conventional view that light inhibits nitrification. Currently, no study has measured both light and dark nitrification rates in the Southern Ocean to quantitatively assess the degree of light inhibition of nitrification and whether alleviation mechanisms for photoinhibition exist.
Nitrification is typically modeled as a linear function of the ambient ammonium (${{\mathrm{NH}}_4^+ }_{\mathrm{amb}} $) concentration (Vichi et al., 2007;Yool et al., 2007). However, field-derived nitrification rates often lack correlation with ${{\mathrm{NH}}_4^+ }_{\mathrm{amb}} $. Previous research has shown that NH4+ox decreases with depth, following a power-law distribution similar to that of particulate organic carbon (Smith et al., 2016; Santoro et al., 2021), which suggests that the relationship between nitrification and depth probably reflected the ${{\mathrm{NH}}_4^+ } $ supply, not just [${{\mathrm{NH}}_4^+ } $]. Regions with high organic matter export and ${{\mathrm{NH}}_4^+ } $ supply fluxes are expected to have a greater abundance of nitrifying microorganisms, such as equatorial upwelling zones (Santoro et al., 2019). The only substrate kinetics study of nitrification in the Southern Ocean was performed under dark conditions in winter surface waters with steps ${{\mathrm{NH}}_4^+ }_{\mathrm{ox}} $ and ${{\mathrm{NO}}_2^-}_{\mathrm{ox}} $ (Mdutyana et al., 2022a, 2022b). However, studies on substrate kinetics at varying depths in summer and the effect of light on substrate affinity (α) in the Southern Ocean are still lacking.
As important areas in East Antarctica, the Cosmonaut and Cooperation seas are located south of the Polar Front [PF, the center of the Antarctic Circumpolar Current (ACC)] and serve as natural laboratories for nitrification. The region is characterized by the upwelling of Circumpolar Deep Water (CDW), which is an important source of nutrients, specifically iron, from the deep ocean to the surface (Tagliabue et al., 2012). Moreover, the Southern Boundary of the upper CDW (SB front) in the Cosmonaut and Cooperation seas is closest to the Antarctic shore. High nitrification rates of up to 400 nmol/(L·d) (in terms of N) have been observed in well-known upwelling zones of low-latitude oligotrophic seas (Rees et al., 2006; Fernández et al., 2009; Beman et al., 2012; Fernández and Farías, 2012). These high rates are often attributed to enhanced primary production spurred by nutrients provided by upwelling. However, for the ${{\mathrm{NO}}_3^-} $ replete high-latitude Southern Ocean, the impact and driving mechanism of physical events such as CDW upwelling on nitrification have not yet been reported.
To uncover the biogeochemical mechanisms driving nitrification and their role in the dynamic Southern Ocean, we conducted nitrification and substrate kinetic experiments in both light and dark incubations using the 15N tracer method in the Cosmonaut and Cooperation seas south of 60°S. Our study aimed to (1) assess the extent and trend of light inhibition on summer nitrification; (2) examine the response of substrate kinetics and the interaction between light inhibition and substrate supply to substrate affinity (α); and (3) explore the regulatory role and distinct mechanism of CDW upwelling in nitrification. We propose that in the Southern Ocean during summer, nitrification rates are enhanced by alleviated photoinhibition through the coupling of ammonium availability and upwelling events.
2.
Materials and methods
2.1
Sampling and hydrochemical measurements
Seawater samples were collected from the Cosmonaut and Cooperation seas in the Indian sector of the Southern Ocean aboard R/V Xuelong 2. The sampling time was from December 4, 2019, to January 7, 2020, during the 36th China Antarctic Research Expedition (Fig. 1). Detailed descriptions of sampling locations, procedures for oceanographic measurements for temperature, salinity, dissolved oxygen (DO), dissolved inorganic nitrogen (${{\mathrm{NH}}_4^+ } $, ${{\mathrm{NO}}_2^-} $, and ${{\mathrm{NO}}_3^-} $), chlorophyll a (Chl-a), primary production (PP), NR, substrate kinetics of nitrification are given in Materials and methods S1.
Figure
1.
Sampling locations, bathymetry, and circulation in the Indian sector of the Southern Ocean, 62°−68°S and 30°−80°E. Sections C3, C4, C5, C6, and C7 are located in the Cosmonaut Sea, and Sections C8, C9, and P1 are located in the Cooperation Sea. All dots represent CTD observation and nutrient sampling sites. Yellow dots indicate nitrification rate measurements in situ and in the dark. The two yellow underlines indicate sites where substrate kinetic experiments for nitrification under light and dark conditions were performed. Oceanographic features highlighted include the Southern Antarctic Circumpolar Current Front (SACCF, 1.8℃ isotherm, brown line), the Southern Boundary of the upper CDW (SB, 1.5℃ isotherm, red line), and the Antarctic Slope Current (purple line) (Orsi et al., 1995). Dark blue circular arrows indicate the Antarctic Divergence zone (AD) between the SACCF and SB, with a large number of mesoscale eddies (Talley et al., 2011). The eastern boundary of the Weddell Gyre is marked by a green line with an arrow. The Prydz Bay Gyre is marked by a gray dashed circle (Heywood et al., 1999). The location of the Cape Darnley Polynyas (CDP) is marked off the Mawson Coast. The isobaths at 500 m, 1000 m, 3000 m, and 4000 m are represented by khaki, black dashed, turquoise, and blue lines, respectively.
2.2
Incubation experiment 1: NR in situ and under dark conditions
The in-situ light NR (denoted as NRin situ) in the water column above 500 m at 18 sites was measured using a 15N-spike incubation under simulated field conditions (yellow dots in Fig. 1). Seawater samples collected from 100%, 50%, 10%, 1%, and 0.1% surface photosynthetically active radiation (PAR) depths and two deep layers in darkness (corresponding to depths of 0 m, ~25 m, ~50 m, ~100 m, ~200 m, 300 m, and 500 m) were pre-filtered through a 200 μm pore size sieve to remove macrozooplankton. The PAR at each depth was determined from the light transmission using a standard Secchi-disc with a diameter of 30 cm, assuming that the light intensity decays exponentially with depth. After transferring the samples to 500 mL acid-washed, sample-rinsed clear polycarbonate bottles, 15N-labeled (NH4)2SO4 tracer (15N abundance > 98% (atomic percent), Sigma-Aldrich, USA) was added to obtain a final 15${{\mathrm{NH}}_4^+ } $ concentration of approximately 50 nmol/L (Ward, 2011b; Tolar et al., 2016b; Raes et al., 2020). The amount of added tracer ranged from 5% to 40% of the ${{\mathrm{NH}}_4^+ }_{\mathrm{amb}} $ content, with a median of 16%. No significant correlation was observed between the NRin situ and ${}^{15}{{\mathrm{NH}}_4^+ } $ enrichment factors (R2 = 0.007, p = 0.3969, n = 108), indicating that the added tracer did not affect the accuracy of the NR measurements. The 15N-labeled samples were placed on the deck and incubated for approximately 24 h (22.5−29.5 h) under in situ light conditions simulated by a neutral density screen, maintained at a constant temperature with flowing surface seawater [(−0.89 ± 0.36)℃]. Pre- and post-incubation samples were filtered through pre-cleaned cellulose acetate membranes (47 mm diameter, 0.22 μm pore size). The 100 mL filtrate was collected in a 180 mL high-density polyethylene (HDPE) bottle and stored at −20℃ for subsequent concentration and isotopic measurements of ${{\mathrm{NO}}_{{x}}^-} $ (${{\mathrm{NO}}_3^-} $ + ${{\mathrm{NO}}_2^-} $).
The NRs of the samples in darkness between 0 m and 200 m were also determined (denoted as NRdark). After the samples were transferred to bottles and the same amount of 15N tracer was added, the bottles were covered with a completely opaque black cloth and incubated under simulated field conditions. The incubation of NRin situ at depths of 300 m and 500 m was identical to that of NRdark. No significant correlation was observed between NRdark and ${}^{15}{{\mathrm{NH}}_4^+ } $ enrichment factors (R2 = 0.007, p = 0.3964, n = 109). The subsequent experimental procedure was the same as that used for NRin situ.
Time-series experiments in situ and under dark conditions were performed at Sites C9-05 and C8/09-10 to verify the linear increase in δ15${{\mathrm{NO}}_{{x}}^-} $ during incubation (Fig. S1) excluding the effects of biological fractionation and isotopic dilution. Detailed procedures are provided in the Materials and methods S1.
2.3
Incubation experiment 2: Substrate kinetics in light and dark incubations
${}^{15}{\mathrm{NH}}_4^+ $ kinetic experiments were performed under different light and nutrient levels to reveal the dependence of nitrification on substrate concentration and the effect of light on substrate kinetics. Seawater samples collected near the deep chlorophyll maximum and from the bottom of the euphotic zone at Sites C9-09 (60 m and 200 m) and C9-05 (25 m and 200 m) were transferred to incubation bottles. Different amounts of 15N-labeled (NH4)2SO4 [15N abundance > 98% (atomic percent), Sigma-Aldrich, USA] were added to the bottles such that the final concentrations of ${}^{15}{\mathrm{NH}}_4^+ $ in the medium were 34 nmol/L, 55 nmol/L, 103 nmol/L, 207 nmol/L, 620 nmol/L, and 1580 nmol/L. Immediately after the tracer was added, approximately 100 mL of the sample was filtered through a cellulose acetate membrane (47 mm diameter, 0.22 μm pore size) without incubation to represent initial conditions. The remaining samples were incubated 24 h, following the same procedure described above. The post-incubation filtrate was collected by filtration through a cellulose acetate membrane (47 mm diameter, 0.22 μm pore size) for ${{\mathrm{NO}}_{{x}}^-}$ concentration and isotopic measurements.
2.4
Nitrogen isotope analysis of ${{{\boldsymbol{NO}}}_{{{\boldsymbol{x}}}}^{\bf{-}}} $
δ15N in ${{\mathrm{NO}}_{{x}}^-} $ was quantitatively converted to N2O using the denitrifier bacterial method (Sigman et al., 2001) and determined using a GasBenchII-coupled DELTAplus XP mass spectrometer (GC-IRMS) (Thermo Finnigan, USA). Briefly, the bacterial strains Pseudomonas chlororaphis subsp. aureofaciens (ATCC No. 13985) lacking N2O reductase were harvested by centrifugation at 18℃ (5600 r/min, 10 min) after 6−7 d of culture in the dark at controlled temperature (24−26℃). The dense pink bacteria were concentrated 4- to 10-fold by resuspending the cells in a fresh nitrate-free medium. Samples containing ~20 nmol N were injected into 20 mL muffled headspace vials prefilled with concentrated bacteria, followed by purging with ultrapure He (0.1−0.2 L/min) for 3 h to remove background N2O. The samples were kept in the dark for 12 h to quantitatively convert ${{\mathrm{NO}}_{{x}}^-} $ into N2O, and subsequently 0.2 mL of 10 mol/L NaOH was added to terminate the reaction. The produced N2O was introduced into the GC-IRMS for nitrogen isotopic composition measurements using an online N2O extraction and purification system. Five nitrate isotopic reference standards (IAEA N3: δ15N = 4.7‰, USGS 34: δ15N = −1.8‰, USGS 32: δ15N = 180‰, and two laboratory reference materials: δ15N = 14.6‰ and δ15N = 89.3‰) were measured at routine intervals interspersed with the nitrification samples to calibrate the measured δ15N values in ${{\mathrm{NO}}_{{x}}^-} $. δ15N measurement accuracy was better than 0.2‰.
where NR represents the total nitrification rate [nmol/(L·d), in terms of N]; Ct and C0 are the ${{\mathrm{NO}}_{{x}}^-} $ concentration at the end and beginning of the incubation, respectively (nmol/L, in terms of N); nt and n0 (%) are the atomic percent 15N of ${{\mathrm{NO}}_{{x}}^-} $ at the end and beginning of the incubation, respectively; f15 is the faction of ${}^{15}{\mathrm{NH}}_4^+ $ tracer in the initial ambient ${\mathrm{NH}}_4^+ $ substrate, and T is the incubation time (h). Three times the standard deviation of the ${{\mathrm{NO}}_{{x}}^-} $ standards (i.e., 0.6‰) was used as the threshold for the presence or absence of 15N enrichment at the end compared with the initial value (Wan et al., 2018; Shiozaki et al., 2019). The detection limit of NR varied from 0.08 nmol/(L·d) to 0.32 nmol/(L·d) (in terms of N), which was sensitive to the ${{\mathrm{NO}}_{{x}}^-} $ concentration, and f15 at the end of the incubation. To achieve greater spatial and depth resolutions, we sacrificed parts of the parallel samples of NRin situ and NRdark. By comparing in situ and dark incubations to controls in the substrate kinetics experiments, we achieved an acceptable level of consistency with a standard deviation of 0.03 to 0.06.
2.5.2
Photosensitivity index (PI)
PI was used to evaluate the effect of light intensity on the NR and was defined as follows:
PI values greater and less than 1 represent negative and positive light effects, respectively. The greater the deviation of the PI value from 1, the higher the photosensitivity of the nitrifying microorganisms.
The Michaelis-Menten (M-M) equation (MacIsaac and Dugdale, 1969) was used to establish the relationship between the PI and PAR (%), from which the maximum photosensitivity index (PImax) and half-saturation constant of light intensity (KL) were estimated as follows:
The estimated PImax and KL values were used to reflect the light tolerance and photosensitivity of the nitrifiers. Furthermore, the light threshold can be derived from the M-M curve at PI = 1.
The following equation was used to quantify the photoinhibition effect at each depth:
The profile of light inhibition (%) reflects the variation in the extent of photoinhibition on nitrification.
2.5.3
Substrate kinetic parameters
The M-M equation (MacIsaac and Dugdale, 1969) was used to estimate the substrate kinetic parameters from the data obtained in situ and the dark in ${}^{15}{\mathrm{NH}}_4^+ $ enrichment experiments:
where NR represents the measured nitrification rate [nmol/(L·d), in terms of N], Vmax is the maximum rate at the substrate saturation concentration [nmol/(L·d), in terms of N], Km is the half-saturation constant of the substrate at (1/2) × Vmax (nmol/L), and S is the total ${\mathrm{NH}}_4^+ $ concentration (${{\mathrm{NH}}_4^+}_{\mathrm{amb}} $ + 15N tracer, denoted as ${\mathrm{TNH}}_4^+ $) (nmol/L). Here, Km values were also used to calibrate NR and assess possible overestimation by tracer addition, despite the potentially large error in correcting the rate over the entire region from limited Km values (Materials and method S1).
The substrate affinity coefficient (α) is a good indicator of competitiveness for the substrate and can be estimated from the initial slope of the M-M curve at low substrate concentrations (Healey, 1980; Martens-Habbena et al., 2009):
where α (d−1) is substrate affinity coefficient (×10−3 h−1), and Vmax and Km are derived from Eq. (5). This method was used to calculate α values for nitrification in the global ocean, as detailed in the Dataset S1.
2.5.4
${NH}_4^+ $ turnover time by nitrification
Here, we assumed that nitrification occurs at different rates during a 12 h light and dark cycle, and the nitrification-driven ${\mathrm{NH}}_4^+ $ turnover time (T, unit: d) can be calculated using the following formula [modified from Xu et al. (2019)]:
where S represents the substrate concentration (nmol/L), and the subscripts L and D represent Vmax [nmol/(L·d), in terms of N] or α (h−1) under light and dark conditions, respectively. This method incorporated the influence of light on substrate turnover, better than previous approaches that relied solely on dividing the ${\mathrm{NH}}_4^+ $ concentration by dark rate to estimate T (Tolar et al., 2016b).
2.5.5
Upwelling intensity indicators
To assess the relationship between upwelling and NRs, we employed several indicators reflecting upwelling strength, including potential temperature (θ), salinity, and nitrate anomalies. These indicators were derived by identifying the positive anomalies for each parameter referenced to the mean value at 100 m for the open ocean sites on each meridional transect (Williams et al., 2010). A more pronounced positive anomaly indicated stronger upwelling, whereas a negative anomaly indicated no upwelling.
3.
Results
3.1
NR
The comprehensive characteristics of water masses are depicted in Fig. 2a and explained in the Text S1. In water masses above 500 m, Winter Residual Water (WW) and Thermocline Water (TCW) contributed to the highest NRin situ, each averaging approximately 30 nmol/(L·d) (in terms of N) with substantial variability (Fig. 2b). In contrast, the mean NRin situ in Antarctic Surface Water (AASW) situated above the WW was reduced by a factor of 8.8, despite the generally high ${{\mathrm{NH}}_4^+}_{\mathrm{amb}} $ and ${{\mathrm{NO}}_2^-} $ concentrations between 0 m and 50 m (Figs 3b and c). The mean NRin situ in the CDW located below the WW declined by a factor of 3.9. Notably, NRin situ in Low Salinity Shelf Water (LSSW) at shelf Site P1-11 was significant with an average of (49.7 ± 32.9) nmol/(L·d) (in terms of N). The most striking feature of the NRin situ profile was the single peak observed between 100 m and 200 m, just below the layer interval with the largest gradient of increasing apparent oxygen utilization (AOU) (Fig. 3a). This peak in NRin situ varied from 9.3 nmol/(L·d) to 118.7 nmol/(L·d) (in terms of N) with an average of (55.2 ± 31.4) nmol/(L·d) (in terms of N), which corresponds to the layers of 1%−0.1% PAR (yellow area in Fig. 3e). At Site P1-11, high NRin situ persisted from 100 m to nearly 500 m at the bottom of the shelf (Fig. 3e). The depth profile of NRdark was similar to that of NRin situ. However, the maximum NRdark exhibited a broader distribution, spanning 40−200 m (yellow area in Fig. 3f), in contrast to the narrow interval of the NRin situ peak.
Figure
2.In-situ nitrification rates in different water masses above 500 m depth. a. Potential temperature (θ) versus salinity at sampling sites. The light grey curves represent the contours of potential density anomalies referenced to zero pressure (kg/m3). The dashed red lines along the x- and y-axes represent the surface freezing point (−1.89℃) and the salinity 34.65 contours. The water masses in the upper 500 m include Antarctic Surface Water (AASW), Winter Residual Water (WW), Thermocline Water (TCW), Circumpolar Deep Water (CDW), and Low-Salinity Shelf Water (LSSW). The characteristic range of potential temperature and salinity for each water mass is marked with black rectangles and lines. The detailed information and classification of water masses are given in the Text S1. b. The in situ nitrification rate [NRin situ, nmol/(L·d), in terms of N] in each water mass, its average ± standard deviation (SD) is shown in the upper left corner.
Figure
3.
Profiles of apparent oxygen utilization (AOU), ${{\mathrm{NH}}_4^+} $, ${{\mathrm{NO}}_2^-} $, ${{\mathrm{NO}}_3^-} $, and nitrification rate (NR) in situ and under dark conditions in the upper 500 m water column. The yellow highlighted area indicates the depth at which the maximum value occurs. Black dashed lines in e and f represent 0.1% PAR depth. The legend below the plot shows the color and symbol representing each sampling site.
Regionally, the maximum NR along each meridional section in the open areas appeared near the SB front. The distribution of NR in Section SB (Fig. S2a) showed that the sites with higher NRs correspond to the rising of deep nitrate, such as Sites C8-06 and C9-03 in the Cooperation Sea and Site C4-04 in the Cosmonaut Sea. The maximum NRinsitu at these sites ranged between 83.3 nmol/(L·d) and 118.7 nmol/(L·d) (in terms of N), corresponding to NRdark between 101.8 nmol/(L·d) and 217.8 nmol/(L·d) (in terms of N) (Figs S2e−g). The lowest NR occurred at Section C7 northeast of Cape Ann, where ${{\mathrm{NO}}_3^-} $ concentrations are low. More detailed features of the AOU, ${\mathrm{NH}}_4^+ $, ${{\mathrm{NO}}_3^-} $, and ${{\mathrm{NO}}_2^-} $ can be found in Text S2.
3.2
Substrate effect
We investigated the effect of substrate concentration on NRs in situ and under dark conditions by adding different amounts of isotope-labeled substrates to samples at different depths at two sites (C9-09 and C9-05). In each case, both NRin situ and NRdark increased with the total ammonium (15N tracer plus ${{\mathrm{NH}}_4^+}_{\mathrm{amb}} $, denote as ${{\mathrm{TNH}}_4^+} $) until saturation, conforming to the M-M curve (Fig. 4). The only exception occurred for NRin situ at 25 m (50% PAR) from Site C9-09, where NRin situ displayed a linear increase over a range of ${{\mathrm{TNH}}_4^+} $ concentrations between 368 nmol/L and 1913 nmol/L (Fig. 4a, red dashed line) and reached a low NRin situ of 7.9 nmol/(L·d) (in terms of N) with the highest tracer addition, although this layer had the highest ${{\mathrm{NH}}_4^+}_{\mathrm{amb}} $ of 333.3 nmol/L among the four depths. Overall, the incubation experiments showed three other features of the influence of substrate on nitrification. First, NRdark was consistently higher than NRin situ and responded faster to substrate supply, regardless of the initial substrate level, PAR, and Chl-a. Secondly, the difference between NRin situ and NRdark at 200 m was much lower than that in the subsurface layers. Third, the NR at 200 m (0.1% PAR and dark) at Site C9-09 was markedly higher than that at 25 m (10% PAR and dark), showing an increase with depth; at Site C9-05, NRin situ (10% PAR) and NRdark at a shallow depth of 60 m exceeded 200 m (0.1% PAR and dark) when the ${{\mathrm{TNH}}_4^+} $ concentrations were greater than 790 nmol/L and 280 nmol/L, respectively (Fig. 4b).
Figure
4.
Nitrification rate as a function of total ${{\mathrm{NH}}_4^+} $ concentration in substrate enrichment experiments at Sites C9-09 (a) and C9-05 (b). The samples for nitrification incubation at Site C9-09 were collected from 25 m (open square) and 200 m (solid square), and those at Site C9-05 were collected from 60 m (open square) and 200 m (solid square). The red and black dots and lines represent data obtained in situ [50%, 10%, and 0.1% photosynthetically active radiation (PAR)] and in the dark, respectively. The dashed and solid curves represent the fitting results of the M-M equation at p < 0.05 level for the data of 25 m/60 m and 200 m, respectively. Note that NRin situ at 25 m from Site C9-09 does not fit the Michaelis-Menten (M-M) curve, but is linearly positively correlated (slope = 0.0051, R2 = 0.98, p = 0.0002), reflecting the unsaturated state of the substrate.
Nitrification was photoinhibited at our study sites. The spatial distribution of the average NRin situ and NRdark at each site is shown in Fig. 5a. Site P1 values, obtained by comparing site average-NR in darkness and in situ light [Eq. (2)], ranged from 1.1 to 2.3, with an average of 1.6 ± 0.4. Culture experiments have suggested that photoinhibition results from light-induced damage to electron transport systems and ammonia monooxygenase (AMO) in nitrifying microorganisms such as AOB, while this physiological mechanism in AOA remains unclear (Lu et al., 2020). Moreover, AOA is susceptible to indirect photoinhibition in surface water (Kim et al., 2016; Tolar et al., 2016a) with H2O2 toxicity threshold ranging from 10 nmol/L to 300 nmol/L (Tolar et al., 2016a; Horak et al., 2018). We cannot differentiate the relative contributions of direct and indirect photoinhibition on nitrification, where AOA dominates in the Southern Ocean (Kalanetra et al., 2009; Sow et al., 2022). However, reported H2O2 concentrations in upper waters near our study area are low at 5−32 nmol/L (Sarthou et al., 2011; Morris et al., 2022). Nitrification may experience a more fundamental inhibition directly from light irradiation rather than H2O2 toxicity in open ocean regimes (Horak et al., 2018), which needs to be confirmed. In our study, significant differences in light and dark NR were observed at light intensities above 1% PAR (p = 0.0244, n = 67). After accounting for all depths, the PI ranged from 0.1 to 17.1 (mean 2.5 ± 2.9), showing greater variation across depths than those in between sites. Above PI data do not consider the case in which NRin situ is below the detection limit, which results in a mathematically infinite PI. The PI values available for comparison in the literature are limited. The maximum PI of 17.1 in this study fell between the reported summer maximums of 5.5 and 48.9 (Tolar et al., 2020; Proctor et al., 2023).
Figure
5.
Light inhibition on nitrification. a. Spatial variation of site averages of nitrification rates (NRavg, nmol/(L·d), in terms of N) under in situ (yellow bar) and dark conditions (grey bar). The brown, red, and purple lines show the Southern Antarctic Circumpolar Current (ACC) Front (SACCF, 1.8℃ isotherm), Southern Boundary of ACC (SB, 1.5℃ isotherm), and Antarctic Slope Current, respectively. b. Profiles of mean NRin situ (yellow dots) and NRdark (dark grey dots) at depth are shown with their respective error bars for all sites. The Light Inhibition calculated from the difference between mean NRin situ and NRdark is represented by horizon blue bars with light blue error bars. Note that a break is set at a depth of 122 m for better visualization. c. The relationship between NRin situ and NRdark under paired incubation experiments. The linear fit equation (red circles and dark red line) has a slope of 1.22, and the linear fit equation (blue triangles and dark blue line with 95% confidence band between double dashed blue lines) has a slope of 1.13 at low chlorophyll a (Chl-a) levels. The black solid line represents the 1:1 line.
The photoinhibition of nitrification follows an exponential decay pattern with depth. The percentage of nitrification inhibited by light at each depth [Eq. (4)] is shown in Fig. 5b as blue horizontal bars. The strongest photoinhibition (ca. 72%) occurred at 0−25 m (100%−50% PAR); however, most NRin situ in this depth interval remained above the detection limit with a mean value of (2.6 ± 3.1) nmol/(L·d) (in terms of N). For NRdark in the 0−25 m depth interval, most NRdark did not increase significantly [mean (5.2 ± 4.9) nmol/(L·d), in terms of N] compared with that of NRin situ, despite having the highest [${{\mathrm{NH}}_4^+}_{\mathrm{amb}} $] [mean (0.42 ± 0.24) μmol/L]. This suggests that full recovery after intense light damage may take longer than 24 h (incubation time) or may require additional substrates. Culture experiments have shown that 90% of the photo-inactivated AOB cells require 6 h to recover ${{\mathrm{NH}}_4^+}_{\mathrm{ox}} $ activity (Hooper and Terry, 1974), and some AOA strains exhibit slow or no activity during the dark phase after exposure to intense light (Merbt et al., 2012). These studies support the most irreversible photodamage observed at depths of 0−25 m (100%−50% PAR). In deeper waters, the inhibition of nitrification by light decreased from 55.6% at 50 m to 10.8% at 300 m (Fig. 5b). Moreover, the photoinhibition of nitrification in the upper 500 m decreases with depth according to the following exponential equation: $ \mathrm{Light}\; \mathrm{inhibition}=2.9+74\times\mathrm{e}^{\left(-0.86\frac{\mathrm{Depth}}{100}\right)} $ (R2 = 0.93, p = 0.0302). Overall, our results suggest that light inhibits nitrification in the euphotic zone, but not completely, consistent with previous culture and field results (Guerrero and Jones, 1996; Qin et al., 2014; Peng et al., 2016).
NR and light inhibition followed a predictable pattern, and the impact of diurnal phytoplankton competition for ${{\mathrm{NH}}_4^+} $ on nitrification was minor in our study. Despite the variations in NRin situ and NRdark across sites and depths, a robust positive correlation was observed between them with a slope of 1.22 (Fig. 5c, dark red linear fitting line, p < 0.001, R2 = 0.80). Thus, local nitrifying microbial communities may have adapted to the recurring diurnal fluctuations in conditions such as light intensity, nutrient availability, and temperature (Bianchi et al., 1997; Baer et al., 2014). The competition of phytoplankton for ${{\mathrm{NH}}_4^+} $ under light exposure (Smith et al., 2014b; Wan et al., 2018) may also have produced this relationship. To avoid this effect, we excluded samples with high Chl-a levels (>0.08 μg/L), and also found a linear correlation between NRin situ and NRdark with a slope of 1.13 (Fig. 5c, blue linear fitting line, p < 0.0001, R2 = 0.71), which is a better representative of the unique photoinhibition effect. The small difference in the two slopes (Δ slope = 0.09) and because the data points that deviated the most from the fitted line mostly occurred within 50%−100% PAR suggest a negligible effect of competition from phytoplankton. Additionally, the lack of correlation between Chl-a, PAR, and light inhibition (Fig. S3) further supports the idea that phytoplankton in productive coastal waters do not have a significant negative effect on nitrification in summer (Alcamán-Arias et al., 2022). The high nitrate concentrations prevalent throughout the water column may also reduce the competition for ${{\mathrm{NH}}_4^+} $ between phytoplankton and nitrifiers, allowing them to coexist in the sunlit layer of the Southern Ocean (Wan et al., 2018; Zakem et al., 2018), a scenario distinct from oligotrophic seas
However, the light threshold for nitrification remains poorly understood, with the reported threshold at about 0.22%−0.54% PAR in the Arctic shelf (Shiozaki et al., 2019) and between 0.2% and 2% PAR in coastal Southern California (Olson, 1981). Most studies have only described the PAR values at which the nitrification peaks, with early studies at 5%−10% PAR (Ward, 2011a) and recent reports at approximately 1% PAR (Peng et al., 2018; Clark et al., 2022). We treated the PAR as a variable and calculated the average PI (PIavg) for each PAR group. The relationship between PIavg and PAR followed an M-M curve with a maximum PI (PImax) of 3.4 ± 0.6 and a light saturation constant (KL) of 1.3% ± 1.4% PAR [Eq. (3), Fig. S4, p < 0.05, R2 = 0.54]. The PImax value exceeds the slope of the linear fit between NRin situ and NRdark by 1.22. These results may indicate two things. (1) The effects of photoinhibition on nitrification, in the context of global climate warming and reduced sea ice, follow a first-order reaction, as observed in the Arctic (Shiozaki et al., 2019); and (2) the photosensitivity of nitrification may be saturated in the more distant future. Nitrifying AOAs are diverse (Francis et al., 2005; Santoro et al., 2019), and some members may have significant physiological diversity, including light tolerance (Kalanetra et al., 2009; Martens-Habbena et al., 2009; Smith et al., 2014b) and unique genetic traits associated with reduced photodamage (Luo et al., 2014). Specifically, a high abundance of ammonia-oxidizing organisms in the epipelagic zone accounts for 45%−100% of the prokaryotes in the Southern Ocean (Alonso-Sáez et al., 2011; Kim et al., 2014; Raes et al., 2018, 2020; Sow et al., 2022), with high transcription levels of AOA, AOB, and extremely high NRin situ [68.3 nmol/(L·d), in terms of N] observed in Antarctic coastal surface waters in summer, possibly due to metabolic light adaptation of nitrifying microorganisms (Alcamán-Arias et al., 2022).
The light threshold for nitrification in our study area obtained from the M-M curve (when PI = 1) was 0.53% PAR, which falls within the reported range of 0.2% to 2% PAR (Olson, 1981; Shiozaki et al., 2019). To the best of our knowledge, this is the first study to quantify light-sensitive parameters of summer nitrification in the Southern Ocean, including PImax, KL, and light threshold, based on field measurements. As surface light intensity and its attenuation with depth vary seasonally and regionally, future studies will benefit from the relationship between PI and PAR (or absolute light intensity) established by paired light-dark NR experiments. This approach allows for a more intuitive comparison of the spatiotemporal variability in light inhibition and provides insights into future trends in photoinhibition tolerance.
4.2
Substrate effect and its buffering against photoinhibition
Ammonium is a crucial substrate for nitrification and an energy source for nitrifiers. We found no correlation between NR and [${{\mathrm{NH}}_4^+} $] (p > 0.1). Nevertheless, an exponential trend was observed between NRdark and AOU in the top 100 m (Fig. 6a, dark red circles), where the AOU gradient was most pronounced (Fig. 3a). In addition, a linear positive correlation was found between primary production (PP, data shown in Dataset S2) and depth-integrated nitrification rate (DINR) under in situ (slope = 0.25, p = 0.0029, R2 = 0.44) and dark conditions (slope = 1.06, p = 0.0144, R2 = 0.32) (Fig. 6b). The decrease in NR at depths of 200−500 m may be attributed to the decrease in ${{\mathrm{NH}}_4^+} $ flux with increasing depth. These results suggest that the maximum nitrification capacity is mainly controlled by the availability of ${{\mathrm{NH}}_4^+} $ from the remineralization of organic matter synthesized from primary production, which is consistent with the results of other studies (Bianchi et al., 1997; Shiozaki et al., 2016; Mdutyana et al., 2020) and model predictions (Zakem et al., 2022). Additionally, NR and [${{\mathrm{NH}}_4^+}_{\mathrm{amb}} $] remained consistently high near the bottom of the shelf Site P1-11, suggesting that sediment resuspension may have facilitated nitrification by providing ${{\mathrm{NH}}_4^+} $. In the Indian sector of the Southern Ocean (41°−51°S), high sediment ${{\mathrm{NH}}_4^+}_{\mathrm{ox}} $ and ${{\mathrm{NO}}_2^-}_{\mathrm{ox}} $ at the water-sediment interface were found to be closely related to [${{\mathrm{NH}}_4^+}_{\mathrm{amb}} $] in interstitial water (Bianchi et al., 1997). The increasing trend of NR with ${{\mathrm{NH}}_4^+} $ observed in our substrate kinetic experiments (Fig. 4) also confirms the dependence of NR on the ${{\mathrm{NH}}_4^+} $ supply.
Figure
6.
The relationship between on-site nitrification rate and environmental factors. a. Relationship between nitrification rate in darkness (NRdark) and apparent oxygen consumption (AOU). The NRdark in the upper 100 m water column increases exponentially with the increase of AOU (dark red circle). No correlation was observed between the two at the depth of 200−500 m due to the low available substrate (black square). b. Relationship between depth-integrated nitrification rate (DINR) and primary productivity (PP). Results in situ and the dark are shown in red and black, respectively.
Nitrification is regulated by both the substrate and light; however, light inhibition becomes the primary limiting factor for summer nitrification at local ${{\mathrm{NH}}_4^+} $ levels in the epipelagic zone. This was confirmed by the vertical variation of NR, with NRin situ values being low at 100% and 50% PAR; increasing below 10% PAR, and peaking at 1%−0.1% PAR. Even at the same ${{\mathrm{TNH}}_4^+} $ concentration, NRin situ in the epipelagic zone was lower than that at the base of the euphotic zone (Fig. 7a, solid symbols). Furthermore, although some of the higher NRdark appeared at shallower depths than the corresponding NRin situ, their distribution patterns were similar to those of NRin situ, suggesting residual photoinhibition under stronger illumination (Fig. 7a, open symbols). The long-term light-dark cycle that regulates the depth distribution of nitrifier populations could be an additional explanation for this phenomenon (Peng et al., 2016). Thus, nitrification in the upper waters of the Southern Ocean during summer was more strongly influenced by photoinhibition than by ${{\mathrm{NH}}_4^+} $ availability. This is consistent with the lower ${{\mathrm{NH}}_4^+} $ regeneration flux and the higher NRs observed in the western Antarctic Peninsula (WAP) continental shelf waters in winter (Tolar et al., 2016b).
Figure
7.
Light is the primary limiting factor for nitrification compared to ammonium in the epipelagic zone. a. Relationship between nitrification rate (NR) and total ${{\mathrm{NH}}_4^+} $ concentration under different photosynthetically active radiation (PAR). Data obtained at different light intensities are represented by different colors. b. The change of photosensitivity index (PI) value with tracer addition at Sites C9-09 and C9-05. The data at 25 m and 200 m at Site C9-09 are represented by solid pink squares and hollow squares, respectively. The data at 60 m and 200 m at Site C9-05 are represented by solid yellow circles and hollow circles, respectively. The pink arrow marks the most significant decrease in PI values under dark and 50% PAR conditions.
The primary role of light inhibition was further validated by substrate kinetics experiments. For the 25 m sample (50% PAR) at Site C9-09, NRin situ did not fit the M-M curve, showed minimal rate response and persistent unsaturation (red hollow squares in Fig. 4a) and had the highest PI at low tracer addition (pink solid squares in Fig. 7b). The linear fit indicated a substrate threshold of 305 nmol/L. Notably, Vmax under dark conditions was restored to fit the M-M curve despite being the shallowest of the four depths in the substrate kinetic experiment. Accordingly, we suggest that nitrifier communities need a substrate threshold higher than the survival threshold (10 nmol/L, Martens-Habbena et al., 2009) to cope with intense light-induced stress and perform nitrification under photoinhibition greater than 50% PAR. In contrast, the strong response of NRlight at 60 m from Site C9-05 may have benefited from the reduction in photoinhibition at 10% PAR, thereby allowing a greater proportion of the substrate to be used directly for nitrification.
Changes of photosensitivity parameters and NRs in substrate enrichment experiments suggest enhanced photoinactivation under low-substrate conditions and buffered photodamage under high-substrate conditions, even at the maximum PAR (Dataset S3). Specifically, across a tracer gradient from 34 nmol/L to 1580 nmol/L, the photoinhibition of nitrification decreased from 100% to 59.2% at 25 m (50% PAR vs. dark conditions) and from 22.5% to 4.8% at 200 m (0.1% PAR vs. dark conditions) at Site C9-09; decreased from 43.2% to 30.2% and from 14.0% to 0% at 60 m (10% PAR vs. dark conditions) and 200 m (0.1% PAR vs. dark conditions) at Site C9-05, respectively. The extent of photoinhibition reduction varied from 30% to 100%, which represented the degree of relief from photoinhibition by substrate enrichment. In addition, the mean light inhibition at each depth was strongly negatively correlated with the ambient AOU (slope = −0.90, p = 0.0395, R2 = 0.92), and the PI value decreased with increasing substrate concentration, with the most apparent decrease at 25 m at Site C9-09 decreasing from 40.7 to 2.5 (Fig. 7b). Studies have shown that new AMOs are essential for AOB recovery after photoinactivation and that ${{\mathrm{NH}}_4^+} $ replenishment accelerates AMO synthesis (Hooper and Terry, 1974; Fukushima et al., 2012), thereby providing a buffer mechanism against light-induced damage (Lu et al., 2020). In the AOA-dominated Southern Ocean, an increased substrate supply indeed reduces PI and light inhibition and enhances NR. A mechanism similar to ${{\mathrm{NH}}_4^+} $-buffered photoinhibition might operate for AOA, although its exact metabolic pathways remain unresolved. This phenomenon implies that nitrification in the upper Southern Ocean in summer may not be negligible because of the intensive feeding activities of zooplankton, such as krill releasing pulses of dissolved organic nitrogen (DON) and ${{\mathrm{NH}}_4^+} $ (Cavan et al., 2019), thereby alleviating the photoinhibition of nitrification.
4.3
Controlling factors of global α
Currently, substrate kinetic parameters for nitrification have been obtained primarily from dark incubations in limited marine environments, with most studies focusing on the Northern Hemisphere. More attention was given to comparing the values of Km and/or Vmax with their influencing factors. This comparison is of limited significance because the data are from different depths and lack normalization for nitrifying microbial abundance (Smith et al., 2014a; Mdutyana et al., 2022b). In addition, a smaller Km (generally considered to indicate a higher substrate affinity) does not necessarily correspond to a larger Vmax value, and vice versa (Dataset S1). The reported Vmax values for NR or ${{\mathrm{NH}}_4^+}_{\mathrm{ox}} $ varied from 0.5 nmol/(L·d) to 98.4 nmol/(L·d) (in terms of N) (Horak et al., 2013; Wan et al., 2018; Xu et al., 2019; Zhang et al., 2020; Mdutyana et al., 2022b) at Km values similar to those of the marine representative strain SCMI-AOA [Km = (133 ± 38) nmol/L (Martens-Habbena et al., 2009)]. Although Peng et al. (2016) and Liu et al. (2023) reduced the Km value of ${{\mathrm{NH}}_4^+}_{\mathrm{ox}} $ to 8−27 nmol/L (in terms of N), the Vmax value was only 5−25 nmol/(L·d) (in terms of N). Healey (1980) pointed out that comparing Km and/or Vmax alone to understand competitive advantage among taxa, conditions, or processes is neither scientific nor robust. Here, the ratio α of Vmax to Km [Eq. (5)] was introduced as an index to compare the substrate affinity for nitrification in different regions, depths, and seasons. A higher α value means that nitrifying microorganisms have a greater substrate competitive advantage at lower substrate concentrations. We estimate for the first time the substrate kinetic parameters for nitrification in the Southern Ocean in situ and under dark conditions in summer and integrate the reported Km and Vmax values to calculate α values to investigate the mechanism regulating substrate affinity in the global ocean (Dataset S1).
The αdark and αlight values at Sites C9-09 and C9-05 ranged from (0.8 × 10⁻³) h−1 to (9.9 × 10⁻³) h−1 and (0.2 × 10⁻³) h−1 to (7.6 × 10⁻³) h−1, respectively (Fig. 8a). The reported αdark changed between (0.05 × 10⁻³) h−1 and (50.7 × 10⁻³) h−1 (Horak et al., 2013; Newell et al., 2013; Peng et al., 2016; Wan et al., 2018; Xu et al., 2019; Zhang et al., 2020; Mdutyana et al., 2022b) and the reported αlight changed between (0.01 × 10⁻³) h−1 and (1.5 × 10⁻³) h−1 (Xu et al., 2019). These α values cover differences in ${{\mathrm{NH}}_4^+}_{\mathrm{ox}} $ and NR, euphotic zone and seasons, and more (details in Dataset S1), reflecting the broad variability in the substrate kinetics of pelagic nitrification (Fig. 8). Multiple factors may regulate the variability of α values.
Figure
8.
Nitrification substrate affinity (α) and its variation in our study sites and the global ocean. a. Comparison of α values under light (white bars) and dark (gray bars) conditions at Sites C9-09 and C9-05. Compared with light, the folds of α increase in the dark in the same layer marked with blue arrows and numbers. A negative correlation was observed between α and photosynthetically active radiation (PAR) (slope = −0.12, R2 = 0.66, p = 0.0145). b. The relationships between αlight and αdark. Data from our study sites, the Western North Pacific Ocean (WNP) and the East China Sea (ECS) (Xu et al., 2019) are represented by red and dark green open squares, and dark green open triangle, respectively. Linear fit lines and their 95% confidence are plotted, with red and dark green lines for our study sites and WNP, respectively. c. Profiles of α in the global ocean. The α-value data include those from our study sites, the South China Sea (SCS) (Wan et al., 2018), the Hood Canal in Puget Sound (Horak et al., 2013), the WNP (Zhang et al., 2020), the Indian sector south of Africa (Mdutyana et al., 2022b), the eastern Equatorial South Pacific (ETSP) (Peng et al., 2016), the Sargasso Sea (Newell et al., 2013), the WNP and the ECS (Xu et al., 2019). Data for summer, autumn, winter, and spring are represented in red, yellow, blue, and green, respectively. Filled and open symbols represent data under dark and light conditions, respectively. d. Relationship between αdark and ${{\mathrm{NH}}_4^+}_{\mathrm{amb}} $ in summer, winter, and the Southern Hemisphere oceans, shown in red, blue, and black, respectively. Data from winter were sparse and discrete, resulting in poor fitted correlation (p > 0.1). e. Variation of α with latitude in the global ocean. The absolute values of the slopes (|slope|) and p-values of the fitted equations for the Southern and Northern Hemisphere oceans are shown.
Light is the first factor affecting the substrate kinetics of nitrification. In this study, we found that α values increased with depth (PAR decay) and were higher under dark conditions. The deep αlight and αdark values were 2.2 times to 17.3 times and 1.4 times to 7.0 times than that of the shallower layer at the same site, respectively. In contrast, at the same depth, αdark was 1.3 times to 3.9 times higher than αlight (Fig. 8a). A negative correlation was observed between α value and PAR (slope = −0.12, R2 = 0.66, p =0.0145). Interestingly, a positive linear relationship was observed between αlight and αdark with a slope of 1.20 (R2 = 0.94, p < 0.05, red squares with a red solid fitting line in Fig. 8b), which was closely related to the positive slope between NRin situ and NRdark (Fig. 5c), suggesting that light inhibition has an equally negative effect on α. The results of the spring western North Pacific Ocean and the East China Sea showed that αlight decreased by 1.5−30.8 times compared with αdark when light intensity varied from 1.5% to 48% PAR (Xu et al., 2019), and a positive trend was found between αlight and αdark as well (green symbols in Fig. 8b). The profile of α in the global ocean also shows an increasing trend with depth, although some fluctuations are observed due to regional and seasonal variations (Fig. 8c). Given that most substrate kinetic parameters are only obtained under dark conditions, quantifying the specific impact of PAR on global α is difficult. However, light inhibition may be one of the reasons for this depth change because the residual effect of photoinhibition influences αdark. In our light-dark pairing experiments, both Km and Vmax showed changes within less than 24 h of incubation at different PARs (Dataset S1), illustrating that light disrupts the competitiveness of nitrifiers for ${{\mathrm{NH}}_4^+} $ and limits the achievable Vmax, which is particularly pronounced under intense light conditions.
The second factor affecting the substrate kinetics of nitrification is substrate concentration. We found a negative correlation between α and [${{\mathrm{NH}}_4^+}_{\mathrm{amb}} $] on a global scale, implying an enhanced adaptation of nitrifiers to substrate depletion (Fig. 8d). Remineralized ${{\mathrm{NH}}_4^+} $ flux was the main factor leading to the separation of the WCA and WCB niches at depths (Santoro et al., 2017), with WCA and WCB having low and high α, respectively (Sintes et al., 2016; Santoro et al., 2019). This correspondence provides an additional explanation for the increase in α with depth, namely, that it is associated with a decrease in ${{\mathrm{NH}}_4^+} $ flux. In addition, the slopes of the linear fit between ${{\mathrm{NH}}_4^+}_{\mathrm{amb}} $ and αdark in summer (Wan et al., 2018, and this study), winter (Newell et al., 2013; Peng et al., 2016; Mdutyana et al., 2022b), and Southern Hemisphere oceans (Peng et al., 2016; Mdutyana et al., 2022b, and this study) are −0.0900, −0.0851, and −0.0777, respectively (Fig. 8d). Similar slopes emphasize the key role of ${{\mathrm{NH}}_4^+} $ in regulating variations in αdark across global scale. Therefore, the value of αdark can be used to predict the native ${{\mathrm{NH}}_4^+} $ level and the possible response of α to changes in ${{\mathrm{NH}}_4^+} $, providing new insights into nitrification kinetics.
In addition, the αdark value seems to have a latitude effect, decreasing from low to high latitude seas (Fig. 8e), with a larger absolute slope value in the linear fit between αdark and latitude in the Northern Hemisphere (0.89) than the Southern Hemisphere (0.56). This latitude effect may be related to changes in temperature, and the composition of the nitrifying microbial community, which deserves further study.
Light and substrate availability coregulate NR and α values, therefore the estimation of ${{\mathrm{NH}}_4^+} $ turnover times (T) contributed by nitrification should consider these two factors. Our estimates [based on Eq. (7)] indicated that T values at 25 m and 200 m at Site C9-09 were 80.3 d and 8.8 d, respectively; at 60 m and 200 m at Site C9-05 were 8.0 d and 2.8 d, respectively. These T values are greater than the 0.6−5.0 d reported for the WNP euphotic zone in spring, which included the contribution of ${{\mathrm{NH}}_4^+} $ assimilation by phytoplankton (Xu et al., 2019). The longest T (80.3 d) at 25 m at Site C9-09 was plausible because NR was not detectable in the control treatment, and substrate saturation was not reached with the addition of tracer, reflecting considerable photoinhibition. Thus, the nitrification-driven ${{\mathrm{NH}}_4^+} $ turnover time in the Cosmonaut and Cooperation seas is on a monthly scale in surface waters and on a weekly scale at the base of the euphotic zone during summer.
In summary, we describe patterns of α variation in the global ocean, confirm that αdark is also affected by the residual effects of high PAR inhibition, and reveal the survival strategies of nitrifying microorganisms in response to photoinhibition and substrate limitation. Conducting experiments under light and dark conditions simultaneously is necessary to reveal the substrate kinetics of nitrification more accurately.
4.4
Upwelling effect on nitrification
Our results showed that at 100 m, the spatial variation of NRin situ and NRdark fits well with the distribution of upwelling indicators such as anomalies of nitrate, potential temperature (θ), and salinity (Figs 9a−e). The linear positive correlation between NRin situ, NRdark, and nitrate anomaly at 100 m (in situ: slope = 5.1, R2 = 0.35, p = 0.0157; in dark: slope = 4.2, R2 = 0.34, p = 0.0178; Fig. 9h) confirms that upwelling promotes nitrification. The mean maximum NRin situ reached (97.8 ± 18.5) nmol/(L·d) (in terms of N) at Sites C4-04, C8-06, and C9-03, where the strongest upwelling was observed (nitrate anomalies at 5.5, 5.4, and 4.3, respectively). The mean value of maximum NRin situ decreased to (50.5 ± 25.9) nmol/(L·d) (in terms of N) for Sites C9-05, P1-07, C7-05, C9-09, and P1-11 with weak upwelling (nitrate anomaly between 1.1 and 3.9), and further decreased to (38.6 ± 18.1) nmol/(L·d) (in terms of N) at non-upwelling sites (nitrate anomaly < 0). Similar to NRin situ, NRdark exhibited a decreasing trend with decreasing upwelling intensity. Upwelling increased the mean maximum NR by approximately 8-fold, both in situ and in the dark, compared to non-upwelling sites. This phenomenon is similar to that observed in the Benguela, Chilean, and Peruvian upwelling systems, where the maximum ${{\mathrm{NH}}_4^+}_{\mathrm{ox}} $ and ${{\mathrm{NO}}_2^-}_{\mathrm{ox}} $ reach up to 84−400 nmol/(L·d) and 200−384 nmol/(L·d), in terms of N, respectively (Rees et al., 2006; Fernández et al., 2009; Fernández and Farías, 2012; Füssel et al., 2012); and in upwelling zones off the eastern Hainan Island, where the average of maximum NR was 14.3 times higher than that in the non-upwelling site (Liu et al., 2022). Therefore, the higher NRin situ and NRdark values near the SB of the ACC in the Cosmonaut and Cooperation seas reflect the effect of upwelling (see also Figs S2e−g).
Figure
9.
Relationship between nitrification rate (NR) and upwelling intensity indicators. a. Spatial variation of nitrate anomaly at 100 m. b. Spatial variation of temperature anomaly at 100 m. c. Spatial variation of salinity anomaly at 100 m. d. Spatial variation of NRin situ at 100 m. e. Spatial variation of NRdark at 100 m. f. Spatial variation of ΔNR (NRdark minus NRin situ) at 100 m. g. Relationship between NR and ${{\mathrm{NO}}_3^-} $ concentration. Data under in situ and dark conditions are represented by red and black open circles, respectively. h. Relationship between NR and nitrate anomaly at 100 m. Data under in situ and dark conditions are represented by red and black open triangles, respectively.
Two main hypotheses have been proposed to explain the enhancement of nitrification via upwelling in oligotrophic seas. First, upwelling or mesoscale eddies provide nutrients and promote the primary production and regeneration of ${{\mathrm{NH}}_4^+} $, thereby enhancing nitrification (Clark et al., 2016, 2022; Liu et al., 2022). Second, upwelling causes changes in AOA communities (Damashek et al., 2017; Liu et al., 2022) or shifts in the dominant species of phytoplankton due to nitracline variations (Wan et al., 2018). However, unlike low-latitude oligotrophic seas, the upper waters of the Southern Ocean are rich in nitrate (e.g., the surface concentration is as high as approximately 17 μmol/L) and the nitracline is relatively inconspicuous (Fig. 3d). Only a weak linear positive relationship was found between NR and ${{\mathrm{NO}}_3^-} $ concentrations (in situ: slope = 1.09, p = 0.0212, R2 = 0.05; in the dark: slope = 1.86, p = 0.0078, R2= 0.06, Fig. 9g). In addition, the dominant species of phytoplankton in the Antarctic Zone, particularly in the upwelling zone in summer, are diatoms (Davidson et al., 2010; Petrou et al., 2016; Feng et al., 2022), which mainly assimilates ${{\mathrm{NO}}_3^-} $ (Lomas and Glibert, 2000; Glibert et al., 2016) and have little competition of ${{\mathrm{NH}}_4^+} $ with nitrification. Our assessment also ruled out primary production as a major cause for the differences in photoinhibition and NR between the upwelling and non-upwelling sites (Text S3, Fig. S5). Therefore, the mechanisms by which upwelling near the SB front in Cosmonaut and Cooperation seas lead to enhanced nitrification must be determined. Here, we propose that the CDW upwelling increases NR by providing nitrifying microorganisms with greater diversity and higher α to the upper water column as well as by providing iron.
The CDW is a hotspot for archaeal richness and diversity. In the Amundsen and Ross seas, the relative abundance of Marine Group I (MGI) with ammonia oxidation function in the CDW was 3.2−30.7 times higher than that in the upper waters (Alonso-Sáez et al., 2011). The diversity of Nitrosopumilus (represented by SCMI-AOA) in the Indian Ocean sector (48°−65°S, 71°−99°E), mesopelagic and abyssal in summer was higher than that on the surface (<200 m) (Sow et al., 2022). Second, the transport of CDW allows the dispersal of archaea to Antarctic shelves and other oceans (Murray et al., 1999; Alonso-Sáez et al., 2011; Sintes et al., 2016). The higher NRs measured in this study appeared in Sections C8, C9, and P1, which were areas where CDW rose and mixed with dense shelf water to form Antarctic Bottom Water (Gao et al., 2022), reflecting the promotion effect of rising CDW on nitrification. The highest deep NRdark was 141.7 nmol/(L·d) (in terms of N) at 200 m from slope Site P1-09 (Fig. 3f), which was comparable to the maximum ${{\mathrm{NH}}_4^+}_{\mathrm{ox(dark)}} $ in the CDW of the shelf and slope regions of the WAP in summer [144.5 nmol/(L·d) (in terms of N)] (Tolar et al., 2016b). Thus, the rising CDW may bring nitrifying communities with higher diversity and higher α value (Fig. 8a) to the upper water column, where they buffer photoinhibition and increase NRs through their competitive advantage for substrates. This was confirmed by observations in the subpolar North Atlantic (~ 60°N) and the core of the Ross Sea Gyre (61°S), where cyclonic eddy-induced vertical displacement of nitrifying communities in the sub-euphotic zone enhanced euphotic nitrification (Painter, 2011; Kemeny et al., 2016).
Higher DFe provided by the CDW upwelling may alleviate the limitation of iron on nitrification in the upper water. The key enzymes in nitrifying microorganisms have high iron requirements (Arp et al., 2002; Lücker et al., 2010; Shafiee et al., 2019). The concentration of DFe in the mixed layer of the Southern Ocean is typically lower than 0.2 nmol/L (Tagliabue et al., 2012), which is much lower than the requirement of AOA. Studies of the surface layer in the Indian Ocean sector of the Southern Ocean have shown that iron is the main factor constraining Vmax in winter (Mdutyana et al., 2022b). In the waters off the Kerguelen Plateau (marked in Fig. 1), bathymetry-induced CDW increased the iron supply, resulting in an NR of up to 3000 nmol/(L·d) (in terms of N) in the mixed layer (Cavagna et al., 2015). Additionally, CDW rose strongly near the SB (approximately 65°S) of the ACC, affecting up to 100 m in our cruise (Zu et al., 2022). These findings provide theoretical support for our observation of higher NRs at 100 m [up to 83.3−146.6 nmol/(L·d) (in terms of N)] at sites with the strongest upwelling in the open area (Sites C4-04, C8-06, and C9-03, Fig. 9).
The continental shelf is another main source of DFe- and Fe-binding ligands in the Southern Ocean (Herraiz-Borreguero et al., 2016; Smith et al., 2021, 2022), therefore the intrusion of CDW onto the shelf and the offshore transport of Fe-rich shelf waters potentially benefit nitrification. This shelf effect may be reflected at shelf Site P1-11 (bottom depth 505 m, nitrate anomaly 1.1), where the NRin situ at the depth of 50−470 m increased significantly [20.1−60.6 nmol/(L·d), in terms of N], the mean NRdark at the depth of 25−300 m was as high as (81.8 ± 9.2) nmol/(L·d) (in terms of N), indicating that sufficient Fe promoted the recovery of NRdark. The slope Site P1-09 had a higher [${{\mathrm{NH}}_4^+}_{\mathrm{amb}} $] but a negative nitrate anomaly (−3.05), and its NRin situ and NRdark at 50 m were 3.9 times and 4.2 times lower than those at Site P1-11, respectively, indicating a limited supply of Fe to the upper layers. However, the higher NR at 200 m from Site P1-09 [108.8 nmol/(L·d) (in terms of N) in situ and 141.7 nmol/(L·d) (in terms of N) in the dark] may have been due to stronger upwelling from the adjacent southern shelf Site P1-10 (nitrate anomaly 2.5; Fig. 9a).
4.5
Assess the alleviation of photoinhibition
Upwelling-induced iron may alleviate photoinhibition and enhance the NR in the upper water. This was well represented by the difference in NR response to substrate enrichment (Fig. 4b). At Site C9-05, strongly affected by CDW upwelling (nitrate anomaly 3.91), NR at 60 m responded much faster to substrate supply than at Site C9-09 (nitrate anomaly 2.21, and negative values at surrounding sites, Fig. 9a) at 25 m. In the field, both NRinsitu and NRdark responded to upwelling and substrate enhancement, their responses may have differed slightly. The alleviation of light inhibition in NRin situ likely depends mainly on the ${{\mathrm{NH}}_4^+} $ supply, which is related to the lower affinity of AOA for DFe under light conditions (Shafiee et al., 2019). Residual photoinhibition of NRdark was further diminished by CDW upwelling coupled with ${{\mathrm{NH}}_4^+} $, leading to a more rapid and comprehensive dark recovery, resulting in an increased ΔNR (NRdark minus NRin situ) (Fig. 9f). Laboratory culture experiments have shown that an increase in chelated iron decreases the photosensitivity of AOB during the stationary growth phase (Hooper and Terry, 1974). The vertical variation in the mean value of percentage photoinhibition at the upwelling and non-upwelling sites fitted the following equations:
Comparing the two fitting equations, the photoinhibition at the upwelling site decays faster with depth, whereas the photoinhibition at the non-upwelling site is stronger. The profiles of the mean NR values at the upwelling and non-upwelling sites are shown in Fig. 10. The peak values of NRin situ and NRdark at 100 m at the upwelling sites were 3.1 times and 2.9 times higher than those at non-upwelling sites, respectively. NR values in upwelling sites at 75 m were comparable to those at 100 m, in contrast to non-upwelling sites, where NR values at 75 m were reduced by 1.9 times compared to those at 100 m. The difference in the percentage of photoinhibition at each depth between the upwelling and non-upwelling sites reflected the degree of photoinhibition alleviation caused by the CDW upwelling. A simple estimate showed that the alleviation to light inhibition varied from 2.2% ± 2.5% to 45.4% ± 5.3%, with the highest at 75 m (45.4% ± 5.3%), followed by 100 m (36.4% ± 2.6%) (Fig. 10). Therefore, CDW upwelling alleviated photoinhibition in the euphotic zone, thereby improving NR.
Figure
10.
Depth-averaged profiles of nitrification rate in situ light (NRin situ) and in darkness (NRdark) and photoinhibition alleviation between upwelling and non-upwelling sites. NRin situ for upwelling and non-upwelling sites are indicated by solid pink triangles and solid blue circles, respectively. NRdark for upwelling and non-upwelling sites are indicated by open triangles and circles, respectively. The percent alleviation from photoinhibition calculated from the difference between the percent inhibition of upwelling and non-upwelling sites is represented by green horizontal bars with dark green error bars. Note that a break is set at a depth of 122 m for better visualization.
Light inhibition is the primary limiting factor for nitrification in the Southern Ocean during summer. However, we reveal a mechanism for alleviating photoinhibition on nitrification. First, ${{\mathrm{NH}}_4^+} $ supply from primary production and subsequent remineralization can buffer photoinhibition, thereby decreasing photosensitivity and inhibition levels, as suggested by substrate kinetics experiments. Global substrate affinity suggests that nitrifying microorganisms adopt a substrate utilization and survival strategy of increasing α when faced with attenuated light exposure, increased depth, and limited substrate. Second, the mean maximum NR in the upwelling sites was approximately 8-fold greater than that in the non-upwelling sites, which can be attributed to CDW upwelling introducing diverse nitrifying communities with higher α and higher iron. The up-down coupling of biogeochemical and physical processes alleviated photoinhibition and facilitated summer nitrification, with a maximum overlapping effect between 75 m and 100 m.
Our study breaks the previous notion that summer epipelagic nitrification in the Southern Ocean is unimportant due to photoinhibition. The euphotic zone in the Southern Ocean is a feeding hotspot for zooplankton and has been identified as a significant source of DON, ${{\mathrm{NH}}_4^+} $, and Fe (Valdés et al., 2018; Cavan et al., 2019; Hubot et al., 2021), providing exogenous substrate for nitrification that may buffer against photodamage. Global warming leads to an increasing trend of Fe (Petrou et al., 2016), and the strengthening of western winds causes a southward expansion and upwelling of CDW (Zu et al., 2022), which allows more iron availability for nitrification. Additionally, each mole of N2O is equivalent to a radiative energy of 300 mol of CO2 (Masson-Delmotte et al., 2021). The enhanced nitrification could produce more active N2O by-products, which may be released into shallower layers through CDW upwelling ventilation, potentially offsetting some of the radiative benefits of biological carbon export (Law and Ling, 2001; Wan et al., 2023). The conceptual diagram for the mechanism of photoinhibition alleviation and nitrification promotion is shown in Fig. 11. Our study demonstrates the more significant role of summer nitrification in the Southern Ocean in marine carbon and nitrogen cycles than previously recognized.
Figure
11.
Conceptual diagram for the mechanism of photoinhibition alleviation and nitrification promotion in the summer Cosmonaut and Cooperation seas of the Indian Sector in the Southern Ocean.
Acknowledgements:
We would like to thank Pan Jianming’s team and Hao Qiang’s team at the Second Institute of Oceanography, Ministry of Natural Resources of China, for providing the data on nutrients and chlorophyll-a. We also thank Gao Libao’s team at the First Institute of Oceanography, Ministry of Natural Resources of China, for providing the CTD data. Further thanks to Wang Bo for the primary productivity data.
Alcamán-Arias M E, Cifuentes-Anticevic J, Díez B, et al. 2022. Surface ammonia-oxidizer abundance during the late summer in the west Antarctic coastal system. Frontiers in Microbiology, 13: 821902, doi: 10.3389/fmicb.2022.821902
Alonso-Sáez L, Andersson A, Heinrich F, et al. 2011. High archaeal diversity in Antarctic circumpolar deep waters. EnvironmentalMicrobiology Reports, 3(6): 689–697, doi: 10.1111/j.1758-2229.2011.00282.x
Arp D J, Sayavedra-Soto L A, Hommes N G. 2002. Molecular biology and biochemistry of ammonia oxidation by Nitrosomonas europaea. Archives of Microbiology, 178(4): 250–255, doi: 10.1007/s00203-002-0452-0
Baer S E, Connelly T L, Sipler R E, et al. 2014. Effect of temperature on rates of ammonium uptake and nitrification in the western coastal Arctic during winter, spring, and summer. Global Biogeochemical Cycles, 28(12): 1455–1466, doi: 10.1002/2013gb004765
Beman J M, Popp B N, Alford S E. 2012. Quantification of ammonia oxidation rates and ammonia-oxidizing archaea and bacteria at high resolution in the Gulf of California and eastern tropical North Pacific Ocean. Limnology and Oceanography, 57(3): 711–726, doi: 10.4319/lo.2012.57.3.0711
Bianchi M, Feliatra F, Tréguer P, et al. 1997. Nitrification rates, ammonium and nitrate distribution in upper layers of the water column and in sediments of the Indian sector of the Southern Ocean. Deep-Sea Research Part II: Topical Studies in Oceanography, 44(5): 1017–1032, doi: 10.1016/s0967-0645(96)00109-9
Cavagna A J, Fripiat F, Elskens M, et al. 2015. Production regime and associated N cycling in the vicinity of Kerguelen Island, Southern Ocean. Biogeosciences, 12(21): 6515–6528, doi: 10.5194/bg-12-6515-2015
Cavan E L, Belcher A, Atkinson A, et al. 2019. The importance of Antarctic krill in biogeochemical cycles. Nature Communications, 10(1): 4742, doi: 10.1038/s41467-019-12668-7
Chen Yangjun, Chen Jinxu, Wang Yi, et al. 2023. Sources and transformations of nitrite in the Amundsen Sea in summer 2019 and 2020 as revealed by nitrogen and oxygen isotopes. Acta Oceanologica Sinica, 42(4): 16–24, doi: 10.1007/s13131-022-2111-4
Clark D R, Rees A P, Ferrera C M, et al. 2022. Nitrite regeneration in the oligotrophic Atlantic Ocean. Biogeosciences, 19(5): 1355–1376, doi: 10.5194/bg-19-1355-2022
Clark D R, Widdicombe C E, Rees A P, et al. 2016. The significance of nitrogen regeneration for new production within a filament of the Mauritanian upwelling system. Biogeosciences, 13(10): 2873–2888, doi: 10.5194/bg-13-2873-2016
Damashek J, Pettie K P, Brown Z W, et al. 2017. Regional patterns in ammonia-oxidizing communities throughout Chukchi Sea waters from the Bering Strait to the Beaufort Sea. Aquatic Microbial Ecology, 79(3): 273–286, doi: 10.3354/ame01834
Davidson A T, Scott F J, Nash G V, et al. 2010. Physical and biological control of protistan community composition, distribution and abundance in the seasonal ice zone of the Southern Ocean between 30°E and 80°E. Deep-Sea Research Part II: Topical Studies in Oceanography, 57(9–10): 828–848, doi: 10.1016/j.dsr2.2009.02.011
DeVries T. 2014. The oceanic anthropogenic CO2 sink: storage, air-sea fluxes, and transports over the industrial era. Global Biogeochemical Cycles, 28(7): 631–647, doi: 10.1002/2013gb004739
Feng Yubin, Li Dong, Zhao Jun, et al. 2022. Effects of sea ice melt water input on phytoplankton biomass and community structure in the eastern Amundsen Sea. Advances in Polar Science, 33(1): 14–27, doi: 10.13679/j.advps.2021.0017
Fernández C, Farías L. 2012. Assimilation and regeneration of inorganic nitrogen in a coastal upwelling system: ammonium and nitrate utilization. Marine Ecology Progress Series, 451: 1–14, doi: 10.3354/meps09683
Fernández C, Farías L, Alcaman M E. 2009. Primary production and nitrogen regeneration processes in surface waters of the Peruvian upwelling system. Progress in Oceanography, 83(1–4): 159–168, doi: 10.1016/j.pocean.2009.07.010
Francis C A, Roberts K J, Beman J M, et al. 2005. Ubiquity and diversity of ammonia-oxidizing archaea in water columns and sediments of the ocean. Proceedings of the National Academy of Sciences of the United States of America, 102(41): 14683–14688, doi: 10.1073/pnas.0506625102
Fripiat F, Elskens M, Trull T W, et al. 2015. Significant mixed layer nitrification in a natural iron-fertilized bloom of the Southern Ocean. Global Biogeochemical Cycles, 29(11): 1929–1943, doi: 10.1002/2014gb005051
Fukushima T, Wu Y J, Whang L M. 2012. The influence of salinity and ammonium levels on amoA mRNA expression of ammonia-oxidizing prokaryotes. Water Science and Technology, 65(12): 2228–2235, doi: 10.2166/wst.2012.142
Füssel J, Lam P, Lavik G, et al. 2012. Nitrite oxidation in the Namibian oxygen minimum zone. The ISME Journal, 6(6): 1200–1209, doi: 10.1038/ismej.2011.178
Gao Libao, Zu Yongcan, Guo Guijun, et al. 2022. Recent changes and distribution of the newly-formed Cape Darnley bottom water, East Antarctica. Deep-Sea Research Part II: Topical Studies in Oceanography, 201: 105119, doi: 10.1016/j.dsr2.2022.105119
Glibert P M, Wilkerson F P, Dugdale R C, et al. 2016. Pluses and minuses of ammonium and nitrate uptake and assimilation by phytoplankton and implications for productivity and community composition, with emphasis on nitrogen-enriched conditions. Limnology and Oceanography, 61(1): 165–197, doi: 10.1002/lno.10203
Gruber N, Bakker D C E, DeVries T, et al. 2023. Trends and variability in the ocean carbon sink. Nature Reviews Earth & Environment, 4(2): 119–134, doi: 10.1038/s43017-022-00381-x
Guerrero M A, Jones R D. 1996. Photoinhibition of marine nitrifying bacteria. Ⅰ. wavelength-dependent response. Marine Ecology Progress Series, 141: 183–192, doi: 10.3354/meps141183
Gwak J H, Awala S I, Kim S J, et al. 2023. Transcriptomic insights into archaeal nitrification in the Amundsen Sea Polynya, Antarctica. Journal of Microbiology, 61(11): 967–980, doi: 10.21203/rs.3.rs-2763233/v1
Healey F P. 1980. Slope of the Monod equation as an indicator of advantage in nutrient competition. Microbial Ecology, 5(4): 281–286, doi: 10.1007/bf02020335
Herraiz-Borreguero L, Lannuzel D, van der Merwe P, et al. 2016. Large flux of iron from the Amery Ice Shelf marine ice to Prydz Bay, East Antarctica. Journal of Geophysical Research: Oceans, 121(8): 6009–6020, doi: 10.1002/2016jc011687
Heywood K J, Sparrow M D, Brown J, et al. 1999. Frontal structure and Antarctic bottom water flow through the Princess Elizabeth Trough, Antarctica. Deep-Sea Research Part Ⅰ: Oceanographic Research Papers, 46(7): 1181–1200, doi: 10.1016/s0967-0637(98)00108-3
Hollibaugh J T. 2017. Oxygen and the activity and distribution of marine Thaumarchaeota. Environmental Microbiology Reports, 9(3): 186–188, doi: 10.1111/1758-2229.12534
Hooper A B, Terry K R. 1974. Photoinactivation of ammonia oxidation in Nitrosomonas. Journal of Bacteriology, 119(3): 899–906, doi: 10.1128/jb.119.3.899-906.1974
Horak R E A, Qin Wei, Bertagnolli A D, et al. 2018. Relative impacts of light, temperature, and reactive oxygen on thaumarchaeal ammonia oxidation in the North Pacific Ocean. Limnology and Oceanography, 63(2): 741–757, doi: 10.1002/lno.10665
Horak R E A, Qin Wei, Schauer A J, et al. 2013. Ammonia oxidation kinetics and temperature sensitivity of a natural marine community dominated by Archaea. The ISME Journal, 7(10): 2023–2033, doi: 10.1038/ismej.2013.75
Hubot N D, Giering S L C, Füssel J, et al. 2021. Evidence of nitrification associated with globally distributed pelagic jellyfish. Limnology and Oceanography, 66(6): 2159–2173, doi: 10.1002/lno.11736
Kalanetra K M, Bano N, Hollibaugh J T. 2009. Ammonia-oxidizing Archaea in the Arctic Ocean and Antarctic coastal waters. Environmental Microbiology, 11(9): 2434–2445, doi: 10.1111/j.1462-2920.2009.01974.x
Kemeny P C, Weigand M A, Zhang Run, et al. 2016. Enzyme-level interconversion of nitrate and nitrite in the fall mixed layer of the Antarctic Ocean. Global Biogeochemical Cycles, 30(7): 1069–1085, doi: 10.1002/2015gb005350
Kim J G, Park S J, Quan Zhexue, et al. 2014. Unveiling abundance and distribution of planktonic Bacteria and Archaea in a polynya in Amundsen Sea, Antarctica. Environmental Microbiology, 16(6): 1566–1578, doi: 10.1111/1462-2920.12287
Kim J G, Park S J, Sinninghe Damsté J S, et al. 2016. Hydrogen peroxide detoxification is a key mechanism for growth of ammonia-oxidizing archaea. Proceedings of the National Academy of Sciences of the United States of America, 113(28): 7888–7893, doi: 10.1073/pnas.1605501113
Law C S, Ling R D. 2001. Nitrous oxide flux and response to increased iron availability in the Antarctic Circumpolar Current. Deep-Sea Research Part Ⅱ: Topical Studies in Oceanography, 48(11–12): 2509–2527, doi: 10.1016/s0967-0645(01)00006-6
Liu Li, Chen Mingming, Wan Xianhui, et al. 2023. Reduced nitrite accumulation at the primary nitrite maximum in the cyclonic eddies in the western North Pacific subtropical gyre. Science Advances, 9(33): eade2078, doi: 10.1126/sciadv.ade2078
Liu Hao, Zhou Peng, Cheung Shunyan, et al. 2022. Distribution and oxidation rates of Ammonia-Oxidizing Archaea influenced by the coastal upwelling off eastern Hainan Island. Microorganisms, 10(5): 952, doi: 10.3390/microorganisms10050952
Lomas M W, Glibert P M. 2000. Comparisons of nitrate uptake, storage, and reduction in marine diatoms and flagellates. Journal of Phycology, 36(5): 903–913, doi: 10.1046/j.1529-8817.2000.99029.x
Lu Shimin, Liu Xingguo, Liu Chong, et al. 2020. Influence of photoinhibition on nitrification by ammonia-oxidizing microorganisms in aquatic ecosystems. Reviews in Environmental Science and Bio/Technology, 19(3): 531–542, doi: 10.1007/s11157-020-09540-2
Lücker S, Wagner M, Maixner F, et al. 2010. A Nitrospira metagenome illuminates the physiology and evolution of globally important nitrite-oxidizing bacteria. Proceedings of the National Academy of Sciences of the United States of America, 107(30): 13479–13484, doi: 10.1073/pnas.1003860107
Luo Haiwei, Tolar B B, Swan B K, et al. 2014. Single-cell genomics shedding light on marine Thaumarchaeota diversification. The ISME Journal, 8(3): 732–736, doi: 10.1038/ismej.2013.202
MacIsaac J J, Dugdale R C. 1969. The kinetics of nitrate and ammonia uptake by natural populations of marine phytoplankton. Deep Sea Research and Oceanographic Abstracts, 16(1): 45–57, doi: 10.1016/0011-7471(69)90049-7
Martens-Habbena W, Berube P M, Urakawa H, et al. 2009. Ammonia oxidation kinetics determine niche separation of nitrifying Archaea and Bacteria. Nature, 461(7266): 976–979, doi: 10.1038/nature08465
Masson-Delmotte V, Zhai Panmao, Pirani A, et al. 2021. Climate Change 2021: The Physical Science Basis. Contribution of Working Group I to the Sixth Assessment Report of the Intergovernmental Panel on Climate Change. Cambridge: Cambridge University Press, doi: 10.1017/9781009157896
Mdutyana M, Marshall T, Sun Xin, et al. 2022a. Controls on nitrite oxidation in the upper Southern Ocean: insights from winter kinetics experiments in the Indian sector. Biogeosciences, 19(14): 3425–3444, doi: 10.5194/bg-19-3425-2022
Mdutyana M, Sun Xin, Burger J M, et al. 2022b. The kinetics of ammonium uptake and oxidation across the Southern Ocean. Limnology and Oceanography, 67(4): 973–991, doi: 10.1002/lno.12050
Mdutyana M, Thomalla S J, Philibert R, et al. 2020. The seasonal cycle of nitrogen uptake and nitrification in the Atlantic Sector of the Southern Ocean. Global Biogeochemical Cycles, 34(7): e2019GB006363, doi: 10.1029/2019GB006363
Merbt S N, Stahl D A, Casamayor E O, et al. 2012. Differential photoinhibition of bacterial and archaeal ammonia oxidation. FEMS Microbiology Letters, 327(1): 41–46, doi: 10.1111/j.1574-6968.2011.02457.x
Morris J J, Rose A L, Lu Zhiying. 2022. Reactive oxygen species in the world ocean and their impacts on marine ecosystems. Redox Biology, 52: 102285, doi: 10.1016/j.redox.2022.102285
Murray A E, Wu Keying, Moyer C L, et al. 1999. Evidence for circumpolar distribution of planktonic Archaea in the Southern Ocean. Aquatic Microbial Ecology, 18(3): 263–273, doi: 10.3354/ame018263
Newell S E, Fawcett S E, Ward B B. 2013. Depth distribution of ammonia oxidation rates and ammonia-oxidizer community composition in the Sargasso Sea. Limnology and Oceanography, 58(4): 1491–1500, doi: 10.4319/lo.2013.58.4.1491
Olson R J. 1981. 15N tracer studies of the primary nitrite maximum. Journal of Marine Research, 39(2): 203–226
Orsi A H, Whitworth T, Nowlin W D. 1995. On the meridional extent and fronts of the Antarctic Circumpolar Current. Deep-Sea Research Part Ⅰ: Oceanographic Research Papers, 42(5): 641–673, doi: 10.1016/0967-0637(95)00021-w
Painter S C. 2011. On the significance of nitrification within the euphotic zone of the subpolar North Atlantic (Iceland basin) during summer 2007. Journal of Marine Systems, 88(2): 332–335, doi: 10.1016/j.jmarsys.2011.05.001
Peng Xuefeng, Fawcett S E, van Oostende N, et al. 2018. Nitrogen uptake and nitrification in the subarctic North Atlantic Ocean. Limnology and Oceanography, 63(4): 1462–1487, doi: 10.1002/lno.10784
Peng Xuefeng, Fuchsman C A, Jayakumar A, et al. 2016. Revisiting nitrification in the Eastern Tropical South Pacific: a focus on controls. Journal of Geophysical Research: Oceans, 121(3): 1667–1684, doi: 10.1002/2015jc011455
Petrou K, Kranz S A, Trimborn S, et al. 2016. Southern Ocean phytoplankton physiology in a changing climate. Journal of Plant Physiology, 203: 135–150, doi: 10.1016/j.jplph.2016.05.004
Proctor C, Coupel P, Casciotti K, et al. 2023. Light, ammonium, pH, and phytoplankton competition as environmental factors controlling nitrification. Limnology and Oceanography, 68(7): 1490–1503, doi: 10.1002/lno.12359
Qin Wei, Amin S A, Martens-Habbena W, et al. 2014. Marine ammonia-oxidizing archaeal isolates display obligate mixotrophy and wide ecotypic variation. Proceedings of the National Academy of Sciences of the United States of America, 111(34): 12504–12509, doi: 10.1073/pnas.1324115111
Raes E J, Bodrossy L, van de Kamp J, et al. 2018. Oceanographic boundaries constrain microbial diversity gradients in the South Pacific Ocean. Proceedings of the National Academy of Sciences of the United States of America, 115(35): EB266–EB275, doi: 10.1073/pnas.1719335115
Raes E J, van de Kamp J, Bodrossy L, et al. 2020. N2 fixation and new insights into nitrification from the ice-edge to the equator in the South Pacific Ocean. Frontiers in Marine Science, 7: 389, doi: 10.3389/fmars.2020.00389
Rees A P, Woodward E M S, Joint I. 2006. Concentrations and uptake of nitrate and ammonium in the Atlantic Ocean between 60°N and 50°S. Deep-Sea Research Part Ⅱ: Topical Studies in Oceanography, 53(14–16): 1649–1665, doi: 10.1016/j.dsr2.2006.05.008
Santoro A E, Buchwald C, Knapp A N, et al. 2021. Nitrification and Nitrous Oxide production in the offshore waters of the Eastern Tropical South Pacific. Global Biogeochemical Cycles, 35(2): e2020GB006716, doi: 10.1029/2020gb006716
Santoro A E, Dupont C L, Richter R A, et al. 2015. Genomic and proteomic characterization of “Candidatus Nitrosopelagicus brevis”: an ammonia-oxidizing archaeon from the open ocean. Proceedings of the National Academy of Sciences of the United States of America, 112(4): 1173–1178, doi: 10.1073/pnas.1416223112
Santoro A E, Richter R A, Dupont C L. 2019. Planktonic marine archaea. Annual Review of Marine Science, 11: 131–158, doi: 10.1146/annurev-marine-121916-063141
Santoro A E, Saito M A, Goepfert T J, et al. 2017. Thaumarchaeal ecotype distributions across the equatorial Pacific Ocean and their potential roles in nitrification and sinking flux attenuation. Limnology and Oceanography, 62(5): 1984–2003, doi: 10.1002/lno.10547
Sarthou G, Bucciarelli E, Chever F, et al. 2011. Labile Fe(Ⅱ) concentrations in the Atlantic sector of the Southern Ocean along a transect from the subtropical domain to the Weddell Sea Gyre. Biogeosciences, 8(9): 2461–2479, doi: 10.5194/bg-8-2461-2011
Shafiee R T, Snow J T, Zhang Qiong, et al. 2019. Iron requirements and uptake strategies of the globally abundant marine ammonia-oxidising archaeon, Nitrosopumilus maritimus SCM1. The ISME Journal, 13(9): 2295–2305, doi: 10.1038/s41396-019-0434-8
Shiozaki T, Ijichi M, Fujiwara A, et al. 2019. Factors regulating nitrification in the Arctic Ocean: potential impact of sea ice reduction and ocean acidification. Global Biogeochemical Cycles, 33(8): 1085–1099, doi: 10.1029/2018gb006068
Shiozaki T, Ijichi M, Isobe K, et al. 2016. Nitrification and its influence on biogeochemical cycles from the equatorial Pacific to the Arctic Ocean. The ISME Journal, 10(9): 2184–2197, doi: 10.1038/ismej.2016.18
Sigman D M, Casciotti K L, Andreani M, et al. 2001. A bacterial method for the nitrogen isotopic analysis of nitrate in seawater and freshwater. Analytical Chemistry, 73(17): 4145–4153, doi: 10.1021/ac010088e
Sintes E, De Corte D, Haberleitner E, et al. 2016. Geographic distribution of Archaeal Ammonia Oxidizing ecotypes in the Atlantic Ocean. Frontiers in Microbiology, 7: 77, doi: 10.3389/fmicb.2016.00077
Smith J M, Casciotti K L, Chavez F P, et al. 2014a. Differential contributions of archaeal ammonia oxidizer ecotypes to nitrification in coastal surface waters. The ISME Journal, 8(8): 1704–1714, doi: 10.1038/ismej.2014.11
Smith J M, Chavez F P, Francis C A. 2014b. Ammonium uptake by phytoplankton regulates nitrification in the sunlit ocean. PLoS One, 9(9): e108173, doi: 10.1371/journal.pone.0108173
Smith J M, Damashek J, Chavez F P, et al. 2016. Factors influencing nitrification rates and the abundance and transcriptional activity of ammonia-oxidizing microorganisms in the dark northeast Pacific Ocean. Limnology and Oceanography, 61(2): 596–609, doi: 10.1002/lno.10235
Smith A J R, Nelson T, Ratnarajah L, et al. 2022. Identifying potential sources of iron-binding ligands in coastal Antarctic environments and the wider Southern Ocean. Frontiers in Marine Science, 9: 948772, doi: 10.3389/fmars.2022.948772
Smith A J R, Ratnarajah L, Holmes T M, et al. 2021. Circumpolar deep water and shelf sediments support late summer microbial iron remineralization. Global Biogeochemical Cycles, 35(11): e2020GB006921, doi: 10.1029/2020gb006921
Sow S L S, Brown M V, Clarke L J, et al. 2022. Biogeography of Southern Ocean prokaryotes: a comparison of the Indian and Pacific sectors. Environmental Microbiology, 24(5): 2449–2466, doi: 10.1111/1462-2920.15906
Tagliabue A, Mtshali T, Aumont O, et al. 2012. A global compilation of dissolved iron measurements: focus on distributions and processes in the Southern Ocean. Biogeosciences, 9(6): 2333–2349, doi: 10.5194/bg-9-2333-2012
Talley L D, Pickard G L, EmeryW J, et al. 2011. Descriptive Physical Oceanography. Pittsburgh: Academic Press
Tolar B B, Powers L C, Miller W L, et al. 2016a. Ammonia oxidation in the ocean can be inhibited by nanomolar concentrations of hydrogen peroxide. Frontiers in Marine Science, 3: 237, doi: 10.3389/fmars.2016.00237
Tolar B B, Reji L, Smith J M, et al. 2020. Time series assessment of Thaumarchaeota ecotypes in Monterey Bay reveals the importance of water column position in predicting distribution-environment relationships. Limnology and Oceanography, 65(9): 2041–2055, doi: 10.1002/lno.11436
Tolar B B, Ross M J, Wallsgrove N J, et al. 2016b. Contribution of ammonia oxidation to chemoautotrophy in Antarctic coastal waters. The ISME Journal, 10(11): 2605–2619, doi: 10.1038/ismej.2016.61
Valdés V, Fernandez C, Molina V, et al. 2018. Nitrogen excretion by copepods and its effect on ammonia-oxidizing communities from a coastal upwelling zone. Limnology and Oceanography, 63(1): 278–294, doi: 10.1002/lno.10629
Vichi M, Pinardi N, Masina S. 2007. A generalized model of pelagic biogeochemistry. for the global ocean ecosystem. Part Ⅰ: theory. Journal of Marine Systems, 64(1–4): 89–109, doi: 10.1016/j.jmarsys.2006.03.006
Wan Xianhui, Sheng Huaxia, Dai Minhan, et al. 2018. Ambient nitrate switches the ammonium consumption pathway in the euphotic ocean. Nature Communications, 9(1): 915, doi: 10.1038/s41467-018-03363-0
Wan Xianhui, Sheng Huaxia, Dai Minhan, et al. 2023. Epipelagic nitrous oxide production offsets carbon sequestration by the biological pump. Nature Geoscience, 16(1): 29–36, doi: 10.1038/s41561-022-01090-2
Ward B B. 2011a. Nitrification in the ocean. In: Ward B B, Daniel J A, Martin G K, eds. Nitrification. Washington: Academic Press, 323–345, doi: 10.1128/9781555817145.ch13
Ward B B. 2011b. Chapter thirteen—measurement and distribution of nitrification rates in the oceans. Methods in Enzymology, 486: 307–323, doi: 10.1016/b978-0-12-381294-0.00013-4
Williams G D, Nicol S, Aoki S, et al. 2010. Surface oceanography of BROKE-West, along the Antarctic margin of the south-west Indian Ocean (30°E–80°E). Deep-Sea Research Part Ⅱ: Topical Studies in Oceanography, 57(9–10): 738–757, doi: 10.1016/j.dsr2.2009.04.020
Xu Min Nina, Li Xiaolin, Shi Dalin, et al. 2019. Coupled effect of substrate and light on assimilation and oxidation of regenerated nitrogen in the euphotic ocean. Limnology and Oceanography, 64(3): 1270–1283, doi: 10.1002/lno.11114
Yool A, Martin A P, Fernández C, et al. 2007. The significance of nitrification for oceanic new production. Nature, 447(7147): 999–1002, doi: 10.1038/nature05885
Zakem E J, Al-Haj A, Church M J, et al. 2018. Ecological control of nitrite in the upper ocean. Nature Communications, 9(1): 1206, doi: 10.1038/s41467-018-03553-w
Zakem E J, Bayer B, Qin Wei, et al. 2022. Controls on the relative abundances and rates of nitrifying microorganisms in the ocean. Biogeosciences, 19(23): 5401–5418, doi: 10.5194/bg-19-5401-2022
Zhang Yao, Qin Wei, Hou Lei, et al. 2020. Nitrifier adaptation to low energy flux controls inventory of reduced nitrogen in the dark ocean. Proceedings of the National Academy of Sciences of the United States of America, 117(9): 4823–4830, doi: 10.1073/pnas.1912367117
Zu Yongcan, Gao Libao, Guo Guijun, et al. 2022. Changes of circumpolar deep water between 2006 and 2020 in the south-west Indian Ocean, East Antarctica. Deep-Sea Research Part Ⅱ: Topical Studies in Oceanography, 197: 105043, doi: 10.1016/j.dsr2.2022.105043
Lingfang Fan, Min Chen, Zifei Yang, Minfang Zheng, Yusheng Qiu. Alleviated photoinhibition on nitrification in the Indian Sector of the Southern Ocean[J]. Acta Oceanologica Sinica, 2024, 43(7): 52-69. doi: 10.1007/s13131-024-2379-7
Lingfang Fan, Min Chen, Zifei Yang, Minfang Zheng, Yusheng Qiu. Alleviated photoinhibition on nitrification in the Indian Sector of the Southern Ocean[J]. Acta Oceanologica Sinica, 2024, 43(7): 52-69. doi: 10.1007/s13131-024-2379-7
Figure 1. Sampling locations, bathymetry, and circulation in the Indian sector of the Southern Ocean, 62°−68°S and 30°−80°E. Sections C3, C4, C5, C6, and C7 are located in the Cosmonaut Sea, and Sections C8, C9, and P1 are located in the Cooperation Sea. All dots represent CTD observation and nutrient sampling sites. Yellow dots indicate nitrification rate measurements in situ and in the dark. The two yellow underlines indicate sites where substrate kinetic experiments for nitrification under light and dark conditions were performed. Oceanographic features highlighted include the Southern Antarctic Circumpolar Current Front (SACCF, 1.8℃ isotherm, brown line), the Southern Boundary of the upper CDW (SB, 1.5℃ isotherm, red line), and the Antarctic Slope Current (purple line) (Orsi et al., 1995). Dark blue circular arrows indicate the Antarctic Divergence zone (AD) between the SACCF and SB, with a large number of mesoscale eddies (Talley et al., 2011). The eastern boundary of the Weddell Gyre is marked by a green line with an arrow. The Prydz Bay Gyre is marked by a gray dashed circle (Heywood et al., 1999). The location of the Cape Darnley Polynyas (CDP) is marked off the Mawson Coast. The isobaths at 500 m, 1000 m, 3000 m, and 4000 m are represented by khaki, black dashed, turquoise, and blue lines, respectively.
Figure 2. In-situ nitrification rates in different water masses above 500 m depth. a. Potential temperature (θ) versus salinity at sampling sites. The light grey curves represent the contours of potential density anomalies referenced to zero pressure (kg/m3). The dashed red lines along the x- and y-axes represent the surface freezing point (−1.89℃) and the salinity 34.65 contours. The water masses in the upper 500 m include Antarctic Surface Water (AASW), Winter Residual Water (WW), Thermocline Water (TCW), Circumpolar Deep Water (CDW), and Low-Salinity Shelf Water (LSSW). The characteristic range of potential temperature and salinity for each water mass is marked with black rectangles and lines. The detailed information and classification of water masses are given in the Text S1. b. The in situ nitrification rate [NRin situ, nmol/(L·d), in terms of N] in each water mass, its average ± standard deviation (SD) is shown in the upper left corner.
Figure 3. Profiles of apparent oxygen utilization (AOU), ${{\mathrm{NH}}_4^+} $, ${{\mathrm{NO}}_2^-} $, ${{\mathrm{NO}}_3^-} $, and nitrification rate (NR) in situ and under dark conditions in the upper 500 m water column. The yellow highlighted area indicates the depth at which the maximum value occurs. Black dashed lines in e and f represent 0.1% PAR depth. The legend below the plot shows the color and symbol representing each sampling site.
Figure 4. Nitrification rate as a function of total ${{\mathrm{NH}}_4^+} $ concentration in substrate enrichment experiments at Sites C9-09 (a) and C9-05 (b). The samples for nitrification incubation at Site C9-09 were collected from 25 m (open square) and 200 m (solid square), and those at Site C9-05 were collected from 60 m (open square) and 200 m (solid square). The red and black dots and lines represent data obtained in situ [50%, 10%, and 0.1% photosynthetically active radiation (PAR)] and in the dark, respectively. The dashed and solid curves represent the fitting results of the M-M equation at p < 0.05 level for the data of 25 m/60 m and 200 m, respectively. Note that NRin situ at 25 m from Site C9-09 does not fit the Michaelis-Menten (M-M) curve, but is linearly positively correlated (slope = 0.0051, R2 = 0.98, p = 0.0002), reflecting the unsaturated state of the substrate.
Figure 5. Light inhibition on nitrification. a. Spatial variation of site averages of nitrification rates (NRavg, nmol/(L·d), in terms of N) under in situ (yellow bar) and dark conditions (grey bar). The brown, red, and purple lines show the Southern Antarctic Circumpolar Current (ACC) Front (SACCF, 1.8℃ isotherm), Southern Boundary of ACC (SB, 1.5℃ isotherm), and Antarctic Slope Current, respectively. b. Profiles of mean NRin situ (yellow dots) and NRdark (dark grey dots) at depth are shown with their respective error bars for all sites. The Light Inhibition calculated from the difference between mean NRin situ and NRdark is represented by horizon blue bars with light blue error bars. Note that a break is set at a depth of 122 m for better visualization. c. The relationship between NRin situ and NRdark under paired incubation experiments. The linear fit equation (red circles and dark red line) has a slope of 1.22, and the linear fit equation (blue triangles and dark blue line with 95% confidence band between double dashed blue lines) has a slope of 1.13 at low chlorophyll a (Chl-a) levels. The black solid line represents the 1:1 line.
Figure 6. The relationship between on-site nitrification rate and environmental factors. a. Relationship between nitrification rate in darkness (NRdark) and apparent oxygen consumption (AOU). The NRdark in the upper 100 m water column increases exponentially with the increase of AOU (dark red circle). No correlation was observed between the two at the depth of 200−500 m due to the low available substrate (black square). b. Relationship between depth-integrated nitrification rate (DINR) and primary productivity (PP). Results in situ and the dark are shown in red and black, respectively.
Figure 7. Light is the primary limiting factor for nitrification compared to ammonium in the epipelagic zone. a. Relationship between nitrification rate (NR) and total ${{\mathrm{NH}}_4^+} $ concentration under different photosynthetically active radiation (PAR). Data obtained at different light intensities are represented by different colors. b. The change of photosensitivity index (PI) value with tracer addition at Sites C9-09 and C9-05. The data at 25 m and 200 m at Site C9-09 are represented by solid pink squares and hollow squares, respectively. The data at 60 m and 200 m at Site C9-05 are represented by solid yellow circles and hollow circles, respectively. The pink arrow marks the most significant decrease in PI values under dark and 50% PAR conditions.
Figure 8. Nitrification substrate affinity (α) and its variation in our study sites and the global ocean. a. Comparison of α values under light (white bars) and dark (gray bars) conditions at Sites C9-09 and C9-05. Compared with light, the folds of α increase in the dark in the same layer marked with blue arrows and numbers. A negative correlation was observed between α and photosynthetically active radiation (PAR) (slope = −0.12, R2 = 0.66, p = 0.0145). b. The relationships between αlight and αdark. Data from our study sites, the Western North Pacific Ocean (WNP) and the East China Sea (ECS) (Xu et al., 2019) are represented by red and dark green open squares, and dark green open triangle, respectively. Linear fit lines and their 95% confidence are plotted, with red and dark green lines for our study sites and WNP, respectively. c. Profiles of α in the global ocean. The α-value data include those from our study sites, the South China Sea (SCS) (Wan et al., 2018), the Hood Canal in Puget Sound (Horak et al., 2013), the WNP (Zhang et al., 2020), the Indian sector south of Africa (Mdutyana et al., 2022b), the eastern Equatorial South Pacific (ETSP) (Peng et al., 2016), the Sargasso Sea (Newell et al., 2013), the WNP and the ECS (Xu et al., 2019). Data for summer, autumn, winter, and spring are represented in red, yellow, blue, and green, respectively. Filled and open symbols represent data under dark and light conditions, respectively. d. Relationship between αdark and ${{\mathrm{NH}}_4^+}_{\mathrm{amb}} $ in summer, winter, and the Southern Hemisphere oceans, shown in red, blue, and black, respectively. Data from winter were sparse and discrete, resulting in poor fitted correlation (p > 0.1). e. Variation of α with latitude in the global ocean. The absolute values of the slopes (|slope|) and p-values of the fitted equations for the Southern and Northern Hemisphere oceans are shown.
Figure 9. Relationship between nitrification rate (NR) and upwelling intensity indicators. a. Spatial variation of nitrate anomaly at 100 m. b. Spatial variation of temperature anomaly at 100 m. c. Spatial variation of salinity anomaly at 100 m. d. Spatial variation of NRin situ at 100 m. e. Spatial variation of NRdark at 100 m. f. Spatial variation of ΔNR (NRdark minus NRin situ) at 100 m. g. Relationship between NR and ${{\mathrm{NO}}_3^-} $ concentration. Data under in situ and dark conditions are represented by red and black open circles, respectively. h. Relationship between NR and nitrate anomaly at 100 m. Data under in situ and dark conditions are represented by red and black open triangles, respectively.
Figure 10. Depth-averaged profiles of nitrification rate in situ light (NRin situ) and in darkness (NRdark) and photoinhibition alleviation between upwelling and non-upwelling sites. NRin situ for upwelling and non-upwelling sites are indicated by solid pink triangles and solid blue circles, respectively. NRdark for upwelling and non-upwelling sites are indicated by open triangles and circles, respectively. The percent alleviation from photoinhibition calculated from the difference between the percent inhibition of upwelling and non-upwelling sites is represented by green horizontal bars with dark green error bars. Note that a break is set at a depth of 122 m for better visualization.
Figure 11. Conceptual diagram for the mechanism of photoinhibition alleviation and nitrification promotion in the summer Cosmonaut and Cooperation seas of the Indian Sector in the Southern Ocean.


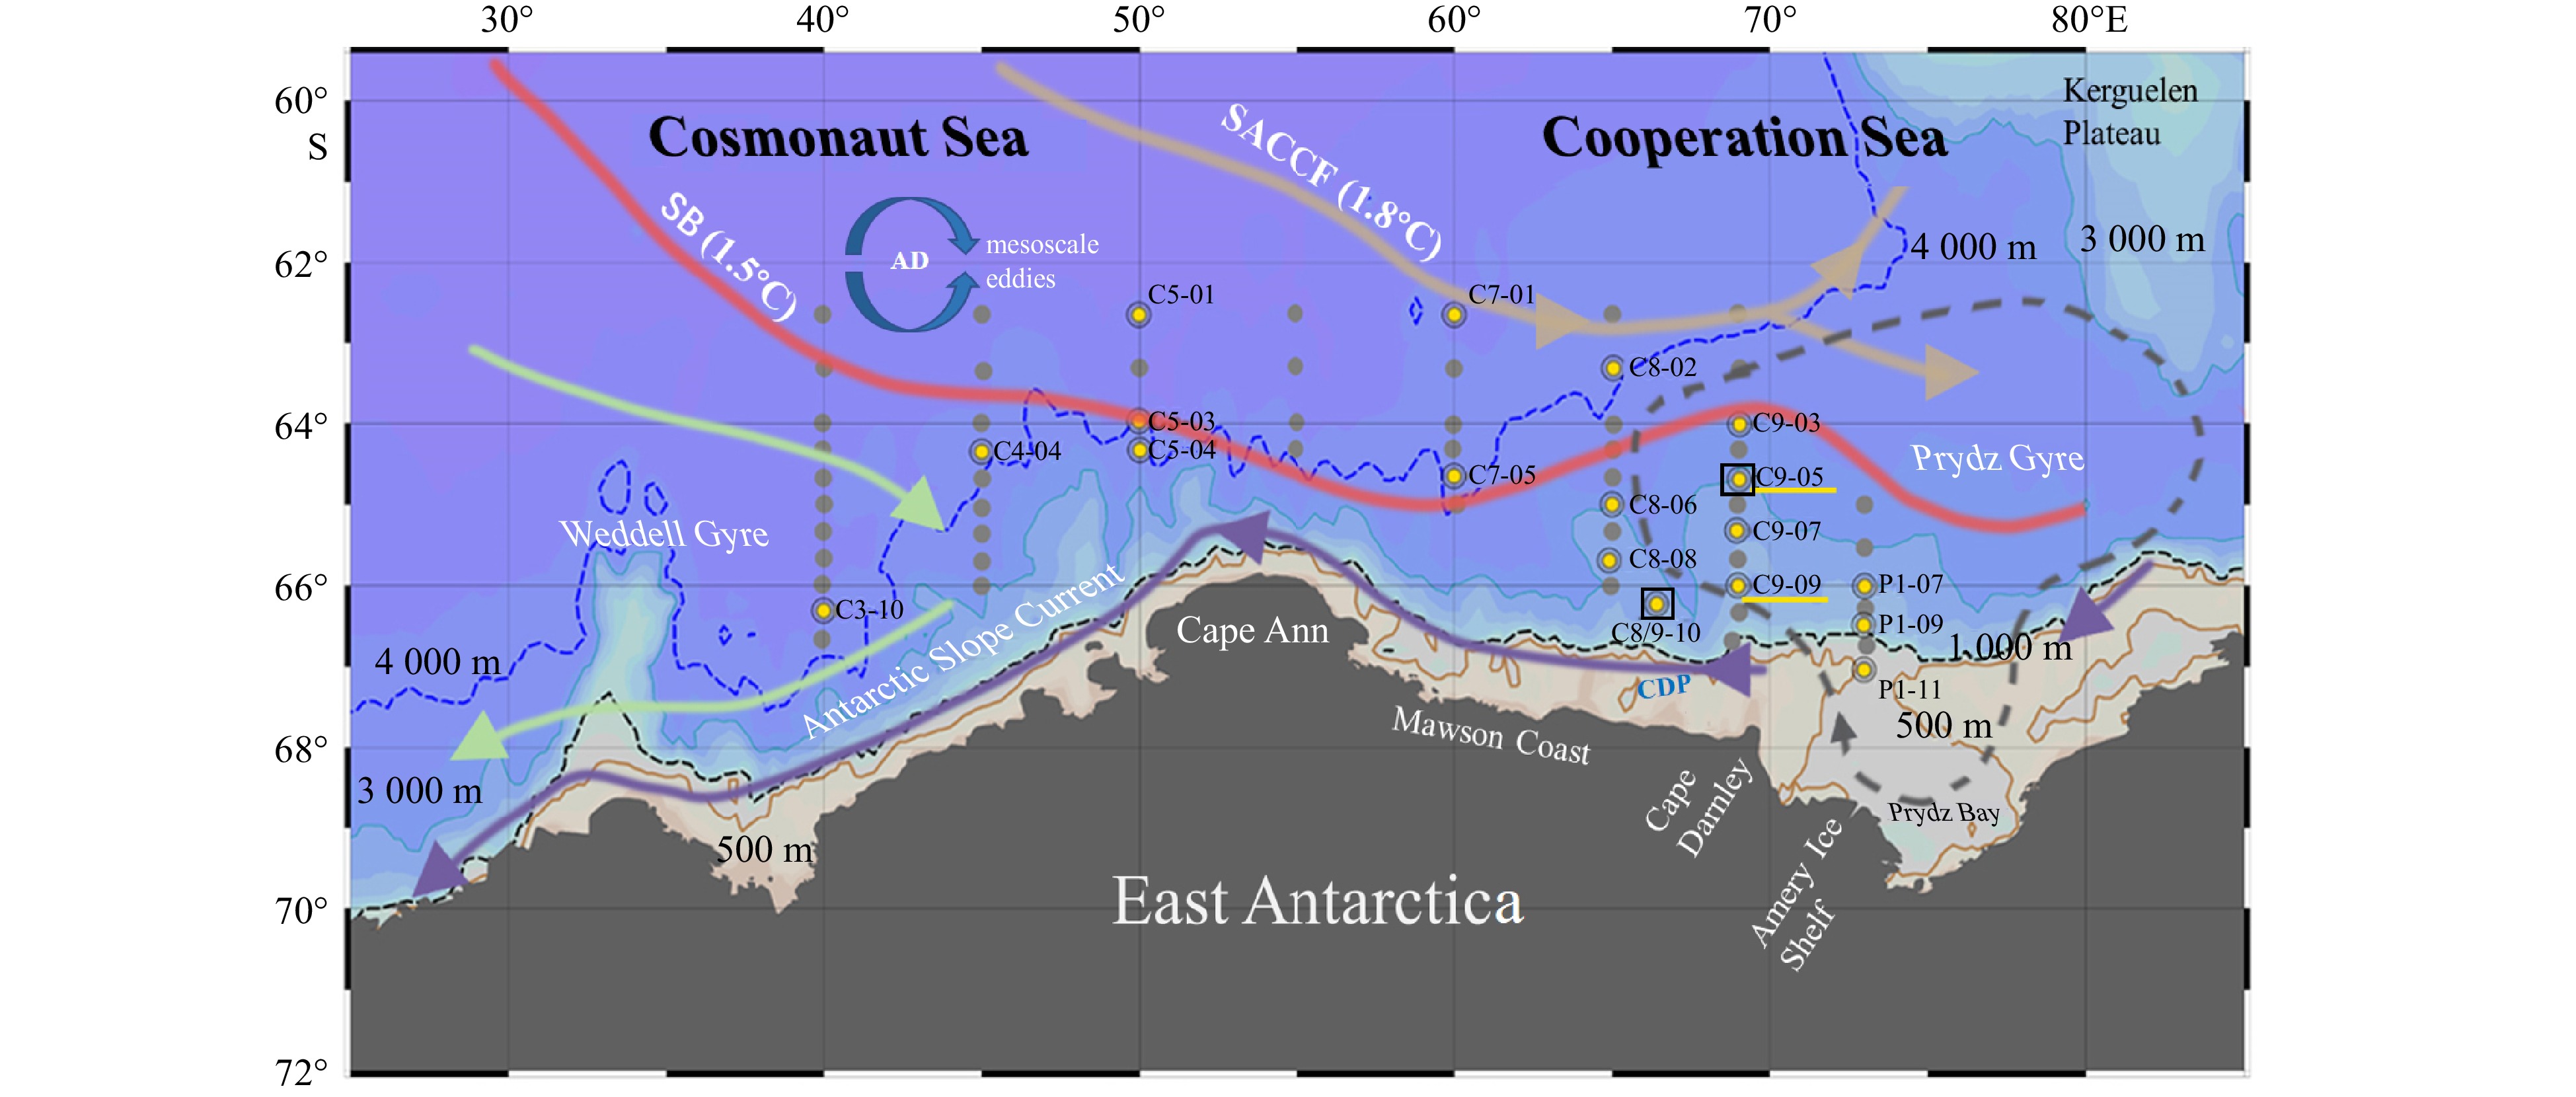
 DownLoad:


 DownLoad:


