Regina Kolzenburg, Federica Ragazzola, Laura Tamburello, Katy R. Nicastro, Christopher D. McQuaid, Gerardo I. Zardi. Photosynthetic response to a winter heatwave in leading and trailing edge populations of the intertidal red alga Corallina officinalis (Rhodophyta)[J]. Acta Oceanologica Sinica, 2024, 43(7): 70-77. doi: 10.1007/s13131-023-2275-6
Citation:
Regina Kolzenburg, Federica Ragazzola, Laura Tamburello, Katy R. Nicastro, Christopher D. McQuaid, Gerardo I. Zardi. Photosynthetic response to a winter heatwave in leading and trailing edge populations of the intertidal red alga Corallina officinalis (Rhodophyta)[J]. Acta Oceanologica Sinica, 2024, 43(7): 70-77. doi: 10.1007/s13131-023-2275-6
Regina Kolzenburg, Federica Ragazzola, Laura Tamburello, Katy R. Nicastro, Christopher D. McQuaid, Gerardo I. Zardi. Photosynthetic response to a winter heatwave in leading and trailing edge populations of the intertidal red alga Corallina officinalis (Rhodophyta)[J]. Acta Oceanologica Sinica, 2024, 43(7): 70-77. doi: 10.1007/s13131-023-2275-6
Citation:
Regina Kolzenburg, Federica Ragazzola, Laura Tamburello, Katy R. Nicastro, Christopher D. McQuaid, Gerardo I. Zardi. Photosynthetic response to a winter heatwave in leading and trailing edge populations of the intertidal red alga Corallina officinalis (Rhodophyta)[J]. Acta Oceanologica Sinica, 2024, 43(7): 70-77. doi: 10.1007/s13131-023-2275-6
Umeå Marine Sciences Centre, Umeå University, 905 71 Norrbyn, Sweden
2.
University of Portsmouth, Institute of Marine Science, Portsmouth PO49LY, UK
3.
Stazione Zoologica Anton Dohrn, Genova Marine Center, Genova 16126, Italy
4.
Stazione Zoologica Anton Dohrn, Sicily Marine Center, Palermo 90149, Italy
5.
Department of Zoology and Entomology, Rhodes University, Makhanda (Grahamstown) 6139, South Africa
6.
Centre of Marine Sciences, University of Algarve, Faro 8005-139, Portugal
7.
Laboratoire d’Océanologie et de Géosciences, Université de Lille, Lille 59000, France
8.
Université de Caen Normandie, Laboratoire de Biologie des Organismes et des Ecosystèmes Aquatiques, Caen 14032, France
Funds:
The Fundação para a Ciência e Tecnologia (FCT-MEC, Portugal) under contract No. UIDB/04326/2020 awarded to Gerardo Zardi; the South African Research Chairs Initiative (SARChI) of the Department of Science and Technology and the National Research Foundation of South Africa under contract No. 64801 awarded to Christopher McQuaid; the Fund of European Union ’s Horizon 2020 Research and Innovation Programme under the Marie Skłodowska-Curie contract No. 101034329; the WINNINGNormandy Program supported by the Normandy Region for Gerardo Zardi.
Marine heatwaves (MHWs) caused by anthropogenic climate change are becoming a key driver of change at the ecosystem level. Thermal conditions experienced by marine organisms across their distribution, particularly towards the equator, are likely to approach their physiological limits, resulting in extensive mortality and subsequent changes at the population level. Populations at the margins of their species’ distribution are thought to be more sensitive to climate-induced environmental pressures than central populations, but our understanding of variability in fitness-related physiological traits in trailing versus leading-edge populations is limited. In a laboratory simulation study, we tested whether two leading (Iceland) and two trailing (Spain) peripheral populations of the intertidal macroalga Corallina officinalis display different levels of maximum potential quantum efficiency (Fv/Fm) resilience to current and future winter MHWs scenarios. Our study revealed that ongoing and future local winter MHWs will not negatively affect leading-edge populations of C. officinalis, which exhibited stable photosynthetic efficiency throughout the study. Trailing edge populations showed a positive though non-significant trend in photosynthetic efficiency throughout winter MHWs exposure. Poleward and equatorward populations did not produce significantly different results, with winter MHWs having no negative affect on Fv/Fm of either population. Additionally, we found no long-term regional or population-level influence of a winter MHWs on this species’ photosynthetic efficiency. Thus, we found no statistically significant difference in thermal stress responses between leading and trailing populations. Nonetheless, C. officinalis showed a trend towards higher stress responses in southern than northern populations. Because responses rest on a variety of local population traits, they are difficult to predict based solely on thermal pressures.
Over the last century, more intense, more frequent, and longer-lasting marine heatwaves (MHWs), defined as prolonged periods of anomalously high temperatures, have had increasingly severe effects on the structure of marine communities and ecosystems globally, affecting the sustainability of the goods and services they provide (IPCC, 2014, 2021, 2022; Oliver et al., 2018, Laufkötter et al., 2020).
Until now, most research on MHWs has focused on extreme summer temperatures that exceed the tolerances of entire species. However, it is important to note that temperatures significantly higher than the average climate can occur at any time of the year (Hobday et al., 2016), and both winter and summer MHWs are expected to increase in frequency and duration (Oliver et al., 2018). In addition, it is crucial to recognise that many terrestrial and aquatic groups (such as corals, Berkelmans and Willis, 1999; crustaceans, Layne et al., 1987; fish, Bulger and Tremaine, 1985; insects, Hu and Appel, 2004; molluscs, Chapple et al., 1998; plants, Badger et al., 1982; seaweeds, Lüning, 1984) have demonstrated a reduction in thermal tolerance due to acclimatization to colder temperatures. As a result, not only summer MHWs but also those occurring in winter could have significant effects on the physiology, phenology, and competitive interactions of organisms (Atkinson et al., 2020).
MHWs can take place throughout the entire distributional range of a species, potentially affecting central and both edge populations. According to the “abundant-centre” hypothesis (Brown, 1984), a species is expected to exhibit its highest abundances towards the centre of its distribution, declining toward the range edges, although support, particularly for the genetic predictions of the hypothesis, is sometimes weak (Sagarin and Gaines, 2002; Eckert et al., 2008; Zardi et al., 2015; Ntuli et al., 2020). Leading and trailing edge populations live towards the limits of suitable conditions and the species’ tolerances (Whittaker, 1956; Brussard, 1984; Kolzenburg, 2022), and can be geographically isolated from central and continuous populations (Bridle and Vines, 2007; Bertocci et al., 2011). The predicted decrease in genetic diversity in edge populations appears to be supported for many but not all species (Eckert et al., 2008) as genetic diversity can be influenced by many other factors (e.g. latitude, ecological environmental gradients, population size, phylogeographic history; Yang et al., 2016).
Leading and trailing edge populations are expected to experience conditions close to the limits of a species’ tolerances, experiencing temporal variability that will result in these limits being exceeded in some years (Sexton et al., 2009). Investigating and comparing populations at the edges of a species distribution provides an understanding of the factors that shape species ranges and how spatial variation in fitness translates to population-level differences in abundance (Sexton et al., 2009; Araújo et al., 2014; Guo, 2014). Consequently, leading and trailing edge boundaries can act as testing grounds for the investigation of the conditions under which populations can adapt, or fail to adapt, to new and temporary changes in environmental conditions (Sexton et al., 2009).
Macroalgal species and populations display great variety in their responses to elevated temperature conditions (Lima et al., 2007; Straub et al., 2019). Furthermore, most studies of the effects of MHWs on these habitat-forming organisms have focussed on warm-edge populations, where thermal limits are expected to be exceeded under summer conditions (Bennett et al., 2015; King et al., 2019). At the same time, most centre and cold-edge populations are largely unaffected (Jones et al., 2010; Smale et al., 2019). Seasonal acclimatisation is common in temperate macroalgae, allowing the maximisation of performance over a wide range of temperatures (Davison, 1987; Dudgeon et al., 1990; Kübler and Davison, 1993; Padilla-Gamino and Carpenter, 2007). We test the hypothesis that such seasonality in physiology results in lower thermal tolerance in winter and thus increased vulnerability to winter MHWs. We examined an aspect of the photophysiological responses (Fv/Fm or ratio of variable to maximum fluorescence) of leading and trailing edge populations of C. officinalis to a simulated winter MHWs. We used ambient and predicted sea surface temperature (SST) scenarios (Representative Concentration Pathway (RCP) 8.5, IPCC, 2014) and included natural thermal tidal fluctuations experienced by the populations at their sites of origin.
2.
Materials and methods
2.1
Specimen collection
We sampled two populations of C. officinalis in each of two regions: Spain (January 2020) and Iceland (February 2020) while they were submerged in channels and crevices during or close to the lowest low tide in the respective month. We used published genetic data (Tavares et al., 2018; Kolzenburg et al., 2019) to identify southern (or trailing edge, SP) and northern (or leading edge, NP) populations. Trailing edge populations were from the Northwest coast of Spain: southern population 1: O’Carreiro 42.476386°N, 8.938735°W and southern population 2: Tragove 42.52444°N, 8.82772°W), which are approximately 10 km apart. Leading edge populations were from the Southwest coast of Iceland: northern population 1: Þorlákshöfn 63.844167°N, 21.373833°W, and northern population 2: Stafnes South 63.968444°N, 22.750861°W), which are approximately 70 km apart. Specimens were kept in the dark, using temperature-insulated containers to maintain near-ambient temperature, and were transported to the Institute of Marine Sciences of the University of Portsmouth, UK, within a maximum of 2 d after collection, with frequent changes of water after collection until arrival. Only specimens without visible damage, bleaching or epiphytes were used in the experimental phase.
2.2
Culturing conditions
Individuals (individual = pebble with approximately 2 g algal wet weight of the collected populations were carefully secured to pebbles following Kolzenburg et al. (2019), recreating natural growth conditions. Specimens of the two populations from a given region were kept in the same aquarium to ensure identical temperature conditions and were differentiated by colour-coding the pebbles for each population using coloured yarn. Aquaria were set up in a closed water bath system.
Twice a week, 50% of the aquarium water was replaced with fresh seawater. Water baths (n = 6) were temperature controlled by a chiller (TK-2000 chiller, cooling capacity: 870 W, 800 L/h, TECO) to maintain the desired temperatures. The remaining two water baths (total n = 8) were passively temperature controlled using a coil system fed by water pumped from the corresponding regulated water bath.
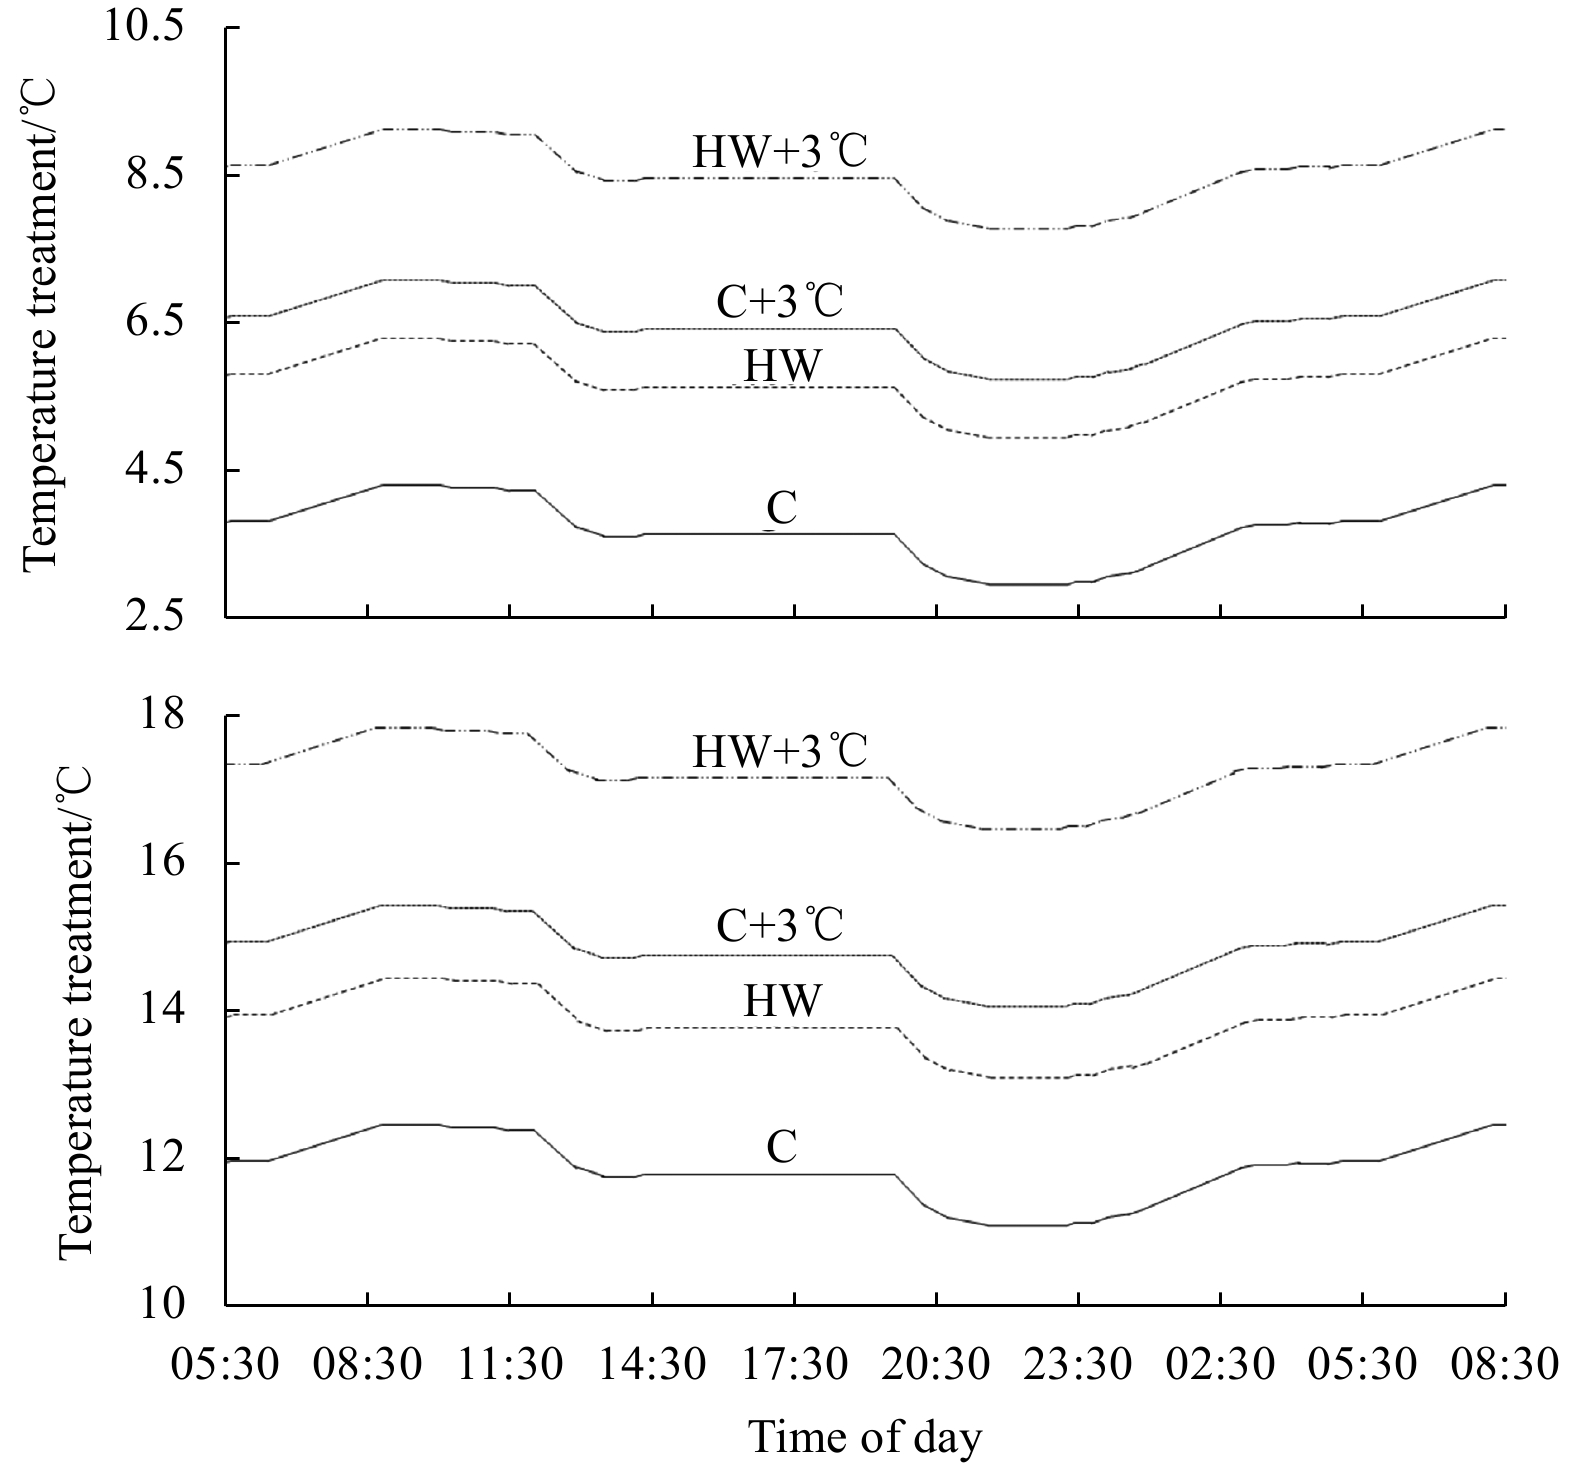
The system was set to a light/dark cycle, representing sunrise and sunset at the time of sampling, controlled by TMC AQUABEAM 600 ultima reef white lights with cloud function. Light conditions were (h:min) 8:10/15:50 and 9:20/14:40 for NP and SP, respectively at an in situ intensity of 60 μmol/(m2·s) and 170 μmol/(m2·s) photons for NP and SP, respectively, measured during sampling. Sunset and sunrise were mimicked by a slow increase and decrease of light intensities over 1 h. A temperature tidal cycle (3.0℃ and 1.0℃, for NP and SP, respectively, Fig. 1), following tide times present during field sampling, was reconstructed for all treatments within each 24 h tidal temperature cycle.
Figure
1.
Planned daily tidal variations for northern margin populations (top) and southern margin populations (bottom) in the experimental design for the 4 treatments (Control: C, Heatwave: HW, elevated temperature: C+3℃; and heatwave during elevated temperature: HW+3℃). Fluctuations resemble daily average temperature fluctuations and times in historic data. Figure re-drawn and amended after Rendina et al. (2019).
Adjustable air diffusers were installed in each aquarium. Salinity (CO310-1 portable salinity probe; accuracy: 0.2%, resolution: 0.1. VWR, Leicestershire, UK) and pH (HQ30d portable multi-parameter meter, PHC301, accuracy: ±0.02; HACH, Manchester, UK) were measured twice a week on National Bureau of Standards (NBS) scale for all replicates to ensure constant conditions during the experiment. A temperature data logger (HOBO UA-002-64 pendant temperature/light data logger; accuracy: 0.47℃, resolution: 0.1℃; Tempcon, Arundel, UK) was placed in each aquarium for continuous logging.
2.3
Marine heatwave calculations
The duration and intensity of an average MHW were calculated for NP and SP following the definition of Hobday et al. (2016), i.e., temperatures exceeding the 90th percentile of the average sea surface temperature (SST) for a minimum of 5 consecutive days in any 30 days over the last 30 years. Records of coastal SST, for the winter months (December to February) in relatively close proximity to each location, were obtained from databases from the following institutions:
(1) location: Reykjavik, Marine and Freshwater Research Institute (https://sjora.hafro.is/), Iceland;
(2) location: Villagarcia, MeteoGalicia: Ministry of the Environment, Territory and Infrastructures – Xunta de Galicia, Spain,1q.
For NP and SP data sets, respectively.
Calculations for MHWs resulted in an average duration of 9 d and 11 d MHW, with an SST increase of 2.0℃ and 1.8℃ above the average for NP and SP, respectively.
2.4
Experimental design
Initial acclimation to laboratory conditions under temperatures measured at the respective sampling sites lasted 14 d, before exposure to temperature increase and simulated heatwaves after Day 14 of the experiment (Figs 2, S1 and S2). Two individuals for each of the two populations from the same region were placed in separate 4 L aquaria and three aquaria were randomly assigned to one of four treatments. After exposure, they were cultured for a further 23 d and 25 d, depending on the average duration of the MHW for NP and SP, respectively (Figs 2, S1 and S2).
Figure
2.
Planned temperature variations in northern margin populations (grey) and southern margin populations (black) in 4 treatments (Control: C, heatwave: HW, elevated temperature: C+3℃ and heatwave during elevated temperature: HW+3℃). The key time points during the experiment: before the heatwave (bHW), after the heatwave (aHW) and after the recovery (recovery) phases are indicated as open circles and with abbreviations. Figure re-drawn and amended after Rendina et al. (2019).
Treatments were designed to simulate present temperature conditions (Control, C); heatwaves under present conditions (heatwave, HW); average future conditions (raised temperature, C+3℃), and heatwaves under future temperature conditions (future heatwave, HW+3℃). Control conditions were set to in situ temperatures measured during sampling (4.3℃ and 12.1℃ for NP and SP, respectively) and future temperature conditions were simulated by raising the present temperature by 3℃, according to IPCC (2014) forecasts.
The acclimation to elevated temperature for treatment C+3℃ was conducted over 7 d with a slow increase of ~1℃ over 2 d.
Four phases defined the measurement periods in the experiment (Fig. 2): (1) before heatwave (bHW; Days 21–28 with measurements starting at Days 28 (=t0) and performed every other day), (2) during the heatwave (dHW; Days 29–37 (t1–t9) and Days 29–39 (t1–t11), for NP and SP, respectively), (3); after heatwave (aHW; Days 38 (t10) and Days 40 (t12), for NP and SP, respectively), (4) a 14-d recovery period following the heatwave treatment (Recovery; Days 38–51 (t10–t23) and Days 40–53 (t12–t25) for NP and SP, respectively).
2.5
Photophysiological measurements
Photosynthetic variables were measured before and every other day throughout the heatwave and recovery period. A Junior Pulse-amplitude modulated (PAM) Chlorophyll Fluorometer (Walz, Germany) was used to determine the maximum potential quantum efficiency of Photosystem II (Fv/Fm). This entailed a saturation pulse intensity of 8, approximating 420 μmol/(m2·s)photons, a saturation pulse length of 0.8 s and an amplification factor (gain) of 1 in combination with the software WinControl-3 (Walz, Germany), each morning before “sunrise” in the aquaria to ensure dark acclimation.
2.6
Data analysis
Analyses of covariance (ANCOVA) were used to evaluate the effects of temperature increase and heatwaves on individuals from different populations from northern and southern regions, taking into account a potential tank effect, as a result of both populations from each region being placed in the same aquaria (Underwood, 1997).
The analyses included the factors region (fixed, with two levels, northern and southern populations), population (random, with two levels, nested in region), temperature increase (fixed, with two levels, Control and C+3℃, orthogonal to all other factors), and heatwave (fixed, with two levels, HW and HW+3℃, orthogonal to all other factors), while tank (random, 24 levels) was included as a covariate. Analyses of the Fv/Fm were run for measurements taken before (t0), early (t2) or later (8 d after the beginning of experimental treatments, at t8) during the heatwave, early after the end of the heatwave (5 d after the end of experimental treatments, at t14 and t16 for NP and SP, respectively), and at the end of the recovery phase (t22 and t24 for NP and SP, respectively). The analysis at the end of the recovery phase was run separately for each region, including the factors population, temperature increase, heatwave, and the covariate tank. Normality of residuals was tested with Shapiro-Wilk test, homogeneity of variances are verified with Levene’s test, and the homogeneity of regression slopes are checked before running the analyses (Underwood, 1997). Estimated marginal means were calculated for post-hoc multiple comparisons of the means with Bonferroni multiple testing correction, when appropriate. The analyses were run in R, using the package rstatix (Kassambara, 2021).
Linear mixed-effect models (LME) were used to evaluate if populations fully recovered after the heatwave, as the method accounts for the correlation among repeated measures of the same individual before and after the experimental treatment (Bolker et al., 2009). The model included the fixed factors region (fixed, with two levels, NP and SP), temperature increase (fixed, with two levels, Control and C+3℃, orthogonal to all other factors), heatwave (fixed, with two levels, HW and HW+3℃, orthogonal to all other factors), time (fixed, with two levels, before the heatwave and at the end of the recovery phase, orthogonal to all other factors), and 1 tank|replicate as random effect. This analysis did not include population as a factor, to avoid the non-independence between levels, as individuals of the two populations from each region were placed in the same tank. The significance of the fixed factors was assessed using the Wald test (Zuur et al., 2007; Crawley, 2012). Model assumptions were assessed by visually inspecting plots of residuals vs. fitted values. The model was fitted using the function lmer in the R package lme4 (Bates et al., 2015). For detailed results of the statistical analyses, see Tables S1 and S2 in the supplementary information.
3.
Results
After acclimation and before exposure to elevated temperature and/or MHW conditions, no significant differences among replicates assigned to different experimental treatments were detected (Table S1, t0).
Differences among populations were clear from the beginning of the exposure (t2; Þorlákshöfn (NP2) and Stafnes South (NP1): P = 0.0016, Stafnes South vs O’Carreiro (SP2) P < 0.001, O’Carreiro vs Tragove (SP1) P = 0.0049; Tables S1 and S2, Fig. S3). Soon after the exposure to experimental treatments (t2), the interaction temperature × heatwave was close to significant (ANCOVA, P = 0.058). Edge populations showed different response times after the start of a winter MHW. Southern, trailing-edge populations responded quickly to exposure to a winter MHW, with a clearer upward trend from the beginning of the MHW, while northern, leading-edge populations showed no obvious effect (Figs 3 and 4).
Figure
3.
Successive Fv/Fm measurements (mean ± SE) before (t14), throughout the heatwave (grey highlighted) and recovery phases in northern margin Population 1 (top) and Population 2 (bottom). Black, red, grey and yellow lines represent Control (C), heatwave (HW), elevated temperature (C+3℃) and Heatwave in elevated temperature (HW+3℃) treatments, respectively.
Figure
4.
Successive Fv/Fm measurements (mean ± SE) before (t14), throughout the heatwave (grey highlighted) and recovery phases in southern margin Population 1 (top) and Population 2 (bottom). Black, red, grey and yellow lines represent Control (C), heatwave (HW), elevated temperature (C+3℃) and heatwave in elevated temperature (HW+3℃) treatments, respectively.
After prolonged exposure to the winter MHW and temperature increase (t8), the effects of temperature increase, region and population became evident, with no significant interactions among these factors (Table S1). The ranking of the populations was similar to that observed since the beginning of experimental treatments, two populations showed consistent significant differences (NP1 vs SP2, P < 0.001 on t2 and t8; Table S2, Fig. S3). MHW exposure had no significant effects on any population at t8. The difference between current and increased temperature was not obvious from the graphs, but as this result was derived from a covariance analysis, any such an effect could have been masked by a tank effect that was apparent only at t8 (ANCOVA, P = 0.019). Another trend during MHW exposure found in NP1 and, to a lesser degree, SP1 was a generally more depressed response to HW and HW+3℃ treatments than to C and C+3℃ treatments.
Both leading and trailing edge populations showed an initial trend of reduction in Fv/Fm rates immediately at the start of the recovery phase. Farther into the recovery period (t16), significant differences were detected among populations exposed to different experimental treatments (ANCOVA, P = 0.016, Fig. S4). Although post-hoc comparisons did not differentiate populations among levels of temperature increase × heatwave (Table S3), the pattern was consistent through time during the recovery phase (t12–t16, analyses not shown).
Additionally, values for HW+3℃ generally lay below those for HW after the MHW exposure for NP1 and SP1 (though not NP2 or SP2), with the difference being stronger for NP1 than SP1. During the recovery phase after MHW exposure, Fv/Fm values for NP1 were generally depressed under C+3℃ and HW+3℃ treatments compared to the non-temperature-elevated treatments. However, NP2 did not show such clear trends in its response (Fig. 3). There was a reduction from the beginning to the end of the recovery for all but the C treatment. All treatments showed non-significantly higher Fv/Fm values at t10, the beginning of the recovery phase; rates then dropped through the following 4 d, after which they seem to recover. Similar to leading-edge populations during recovery, the second trailing edge population, SP2, did not reflect the trend of the other southern population SP1; its response to temperature treatments was clear, not significantly lower than the C during the MHW exposure phase. Overall, the responses of SP2 to all treatments were more variable during the recovery phase than those of SP1. Ultimately, no obvious or statistically significant post-MHW effect could be determined for either SP1 or SP2.
No significant difference was found between t0 at the start of the experiment and t22 or t24 for NP and SP, respectively, at the end of the 14-d recovery phase (Figs 3 and 4, Tables S4 and S5). This verifies the full recovery of all populations after exposure to a winter MHW.
4.
Discussion
We found no negative effect of a winter MHW on C. officinalis with, unexpectedly, no difference between leading and trailing edge populations, rejecting our hypothesis of increased vulnerability of these populations to MHWs during winter as compared to during summer (Rendina et al., 2019). A remarkable capacity for recovery was observed for both leading and trailing populations, with no stark reduction or increase of Fv/Fm values from before MHW exposure compared to the end of the recovery phase.
The average length of winter MHWs was 2 d and 4 d longer, for northern and southern populations respectively than that of a summer MHW (7 d) experienced by central populations (Rendina et al., 2019). Resilience of leading and trailing edge populations to the exposure to winter MHWs, not only under present but also under future predicted thermal SST conditions, indicates that these populations may already be well adapted to high winter temperature fluctuations in their locations of origin (Kim et al., 2018; Kolzenburg et al., 2022). As part of the daily cycle, these organisms are also exposed to abiotic stresses such as desiccation, direct sunlight, and fluctuations in oxygen availability (Hampe and Petit, 2005; Egilsdottir et al., 2013; Williamson et al., 2014). In addition, microclimatic variability in the intertidal is vast, with local influences on the physiology, structure and distribution of intertidal organisms (Helmuth et al., 2002).
Rendina et al. (2019) found significant negative effects of predicted future temperatures combined with a summer MHW on the physiology (photosynthesis, respiration and light and dark calcification) of central populations of C. officinalis. Our data support those findings, but suggest that populations from both regions, in contrast, may be resilient to future winter temperature conditions and future winter MHWs (as well as the combination of both), despite their exposure to narrower annual sea surface temperature variation than central populations (Kolzenburg et al., 2022). Southern populations showed a positive trend in Fv/Fm ratios under all conditions. This trend was not significant, however, and so does not conclusively indicate local adaptation or enhanced response potential to temperature rise in trailing edge populations. Further studies are required to test whether this could be indicative of a critical capacity to adapt to forecasted rises in SST coupled with increases in the frequency and intensity of winter as well as summer MHWs.
Photosynthetic efficiency, measured as Fv/Fm, was reduced during exposure to future temperatures, either ambient or a future winter MHW, in all four tested populations, demonstrating high thermal sensitivity of photosynthetic performance, a process known to be generally temperature-dependent (Crafts-Brandner and Salvucci, 2002), under winter conditions. At first these findings may suggest low resilience and little local adaptation to extreme temperature events with little capacity to tolerate exposure to winter MHWs under a predicted SST increase of 3℃ (IPCC, 2014). Full recovery of all populations under all conditions following an extended recovery period, however, suggests instead a high capacity for resilience in the face of thermal stress.
While we present photophysiological measurements of the efficiency and thermal plasticity of the first stage of photosynthesis and respiration, the electron transport efficiency of Photosystem II, measured as Fv/Fm, however, understanding the full physiological resilience of these leading and trailing edge populations to future MHWs requires additional information on photosynthesis and respiration as well as light and dark calcification rates.
To date, the only study offering insight into the photophysiology of articulated intertidal coralline alga species across their distribution in the NE Atlantic is one by Williamson et al. (2018). Similarly, studies on the initial phase of the photosynthetic light reaction (Fv/Fm) of macroalgae and the effects of extreme temperatures have only recently emerged.
The considerable variety displayed in responses to elevated temperature conditions among and within populations indicated the need to incorporate the full geographical distribution of species, including central and more peripheral populations in studies of species’ vulnerability to MHWs. A comparative study of southern (trailing) and northern (leading) edge populations of Fucus vesiculosus and Zostera marina by Mota et al. (2018) showed higher thermal resistance and recovery in southern populations of F. vesiculosus but the opposite for northern and southern populations of Z. marina. Although we found no significant difference in the response of leading and trailing margins, the positive trend in Fv/Fm ratios in trailing edge but not leading edge populations suggests similar intraspecific differentiation between southern and northern populations of C. officinalis in their responses to MHW conditions.
Acknowledgements
All the authors would like to thank the technical staff (Marc Martin, Jenny Mackellar and Dr Graham Malyon) of the Institute of Marine Science (University of Portsmouth) for their extraordinary support during the COVID-19 lockdowns. Without them, we would not have been able to run the experiment.
Open Access
This article is licensed under a Creative Commons Attribution 4.0 International License, which permits use, sharing, adaptation, distribution and reproduction in any medium or format, as long as you give appropriate credit to the original author(s) and the source, provide a link to the Creative Commons licence, and indicate if changes were made. The images or other third party material in this article are included in the article's Creative Commons licence, unless indicated otherwise in a credit line to the material. If material is not included in the article's Creative Commons licence and your intended use is not permitted by statutory regulation or exceeds the permitted use, you will need to obtain permission directly from the copyright holder. To view a copy of this licence, visit http://creativecommons.org/licenses/by/4.0/.
Araújo R, Serrão E A, Sousa-Pinto I, et al. 2014. Spatial and temporal dynamics of fucoid populations (Ascophyllum nodosum and Fucus serratus): a comparison between central and range edge populations. PloS One, 9(3): 92177, doi: 10.1371/journal.pone.0092177
Atkinson J, King N G, Wilmes S B, et al. 2020. Summer and winter marine heatwaves favor an invasive over native seaweeds. Journal of Phycology, 56(6): 1591–1600, doi: 10.1111/jpy.13051
Badger M R, Björkman O, Armond P A. 1982. An analysis of photosynthetic response and adaptation to temperature in higher plants: temperature acclimation in the desert evergreen Nerium oleander L. Plant, Cell and Environment, 5: 85–99
Bates D, Maechler M, Bolker B, et al. 2015. Fitting linear mixed-effects models using lme4. Journal of Statistical Software, 67(1): 1–48
Bennett S, Wernberg T, Arackal Joy B, et al. 2015. Central and rear-edge populations can be equally vulnerable to warming. Nature Communications, 6: 10280, doi: 10.1038/ncomms10280
Berkelmans R, Willis B L. 1999. Seasonal and local spatial patterns in the upper thermal limits of corals on the inshore Central Great Barrier Reef. Coral Reefs, 18: 219–28, doi: 10.1007/s003380050186
Bertocci I, Araújo R, Vaselli S, et al. 2011. Marginal populations under pressure: spatial and temporal heterogeneity of Ascophyllum nodosum and associated assemblages affected by human trampling in Portugal. Marine Ecology Progress Series, 439: 73–82, doi: 10.3354/meps09328
Bolker B M, Brooks M E, Clark C J, et al. 2009. Generalize linear mixed models: a practical guide for ecology and evolution. Trends in Ecology and Evolution, 24(3): 127–135, doi: 10.1016/j.tree.2008.10.008
Bridle J R, Vines T H. 2007. Limits to evolution at range margins: when and why does adaptation fail?. Trends in Ecology and Evolution, 22(3): 140–147
Brody H M. 2004. Phenotypic Plasticity: Functional and Conceptual Approaches. Oxford: Oxford University Press
Brown J H. 1984. On the relationship between abundance and distribution of species. The American Naturalist, 124(2): 255–279, doi: 10.1086/284267
Brussard P F. 1984. Geographic patterns and environmental gradients: the central-marginal models in Drosophila revisited. Annual Review of Ecology Systematics, 15: 25–64, doi: 10.1146/annurev.es.15.110184.000325
Bulger A J, Tremaine S C. 1985. Magnitude of seasonal effects on heat tolerance in Fundulus heteroclitus. Physiological Zoology, 58: 197–204, doi: 10.1086/physzool.58.2.30158567
Chapple J P, Smerdon G R, Berry R J, et al. 1998. Seasonal changes in stress-70 protein levels reflect thermal tolerance in the marine bivalve Mytilus edulis L. Journal of Experimental Marine Biology and Ecology, 229: 53–68, doi: 10.1016/S0022-0981(98)00040-9
Charpy-Roubaud C, Sournia A. 1990. The comparative estimation of phytoplanktonic, microphytobenthic and microphytobenthic primary production in the oceans. Marine Microbial Food Webs, 4: 31–57
Crawley M J. 2012. The R Book. Chichester, West Sussex, United Kingdom: Wiley
Crafts-Brandner S J, Salvucci M E. 2002. Sensitivity of photosynthesis in a C4 plant, maize, to heat stress. Plant physiology, 129(4): 1773–1780, doi: 10.1104/pp.002170
Davison I R. 1987. Adaptation of photosynthesis in Laminaria saccharina (Phaeophyta) to changes in growth temperature. Journal of Phycology, 23: 273–83, doi: 10.1111/j.1529-8817.1987.tb04135.x
Dudgeon S R, Davison I R, Vadas R L. 1990. Freezing tolerance in the intertidal red algae Chondrus crispus and Mastocarpus stellatus: relative importance of acclimation and adaptation. Marine Biology, 106: 36–427, doi: 10.1007/BF01344323
Eckert C G, Samis K E, Lougheed S C. 2008. Genetic variation across species’ geographical ranges: The central-marginal hypothesis and beyond. Molecular Ecology, 17: 1170–1188, doi: 10.1111/j.1365-294X.2007.03659.x
Egilsdottir H, Noisette F, Noel L M-L J, et al. 2013. Effects of pCO2 on physiology and skeletal mineralogy in a tidal pool coralline alga Corallina elongata. Marine Biology, 160: 2103–2112.
Foster M S. 2001. Rhodoliths: between rocks and soft places. Journal of Phycology, 37: 659–667, doi: 10.1046/j.1529-8817.2001.00195.x
Fredriksen S. 2003. Food web studies in a Norwegian kelp forest based on stable isotope (δ13C and δ15N) analysis. Marine Ecology Progress Series, 260: 71–81, doi: 10.3354/meps260071
Guo Q. 2014. Central-marginal population dynamics in species invasions. Frontiers in Ecology and Evolution, 2: 23.
Hampe A, Petit R J. 2005. Conserving biodiversity under climate change: the rear edge matters. Ecology letters, 8(5): 461–467, doi: 10.1111/j.1461-0248.2005.00739.x
Helmuth B, Harley C D, Halpin P M, et al. 2002. Climate change and latitudinal patterns of intertidal thermal stress. Science, 298(5595): 1015–1017, doi: 10.1126/science.1076814
Hind K R, Gabrielson P W, Lindstrom S C, et al. 2014. Misleading morphologies and the importance of sequencing type specimens for resolving coralline taxonomy (Corallinales, Rhodophyta): Pachyarthron cretaceum is Corallina officinalis. Journal of Phycology, 50(4): 760–764, doi: 10.1111/jpy.12205
Hobday A J, Alexander L, Perkins S, et al. 2016. A hierarchical approach to defining marine heatwaves. Progress in Oceanography, 141: 227–238, doi: 10.1016/j.pocean.2015.12.014
Hu X P, Appel A G. 2004. Seasonal variation of critical thermal limits and temperature tolerance in Formosan and Eastern subterranean termites (Isoptera: Rhinotermitidae). Environmental Entomology, 33: 197–205, doi: 10.1603/0046-225X-33.2.197
IPCC, 2014. Climate Change 2014: Synthesis Report. Contribution of Working Groups I, II and III to the Fifth Assessment Report of the Intergovernmental Panel on Climate Change [Core Writing Team, R. K. Pachauri, L. A. Meyer (eds.)]. pp. Geneva, Switzerland, IPCC: 151
IPCC, 2021. Climate Change 2021: The Physical Science Basis. Contribution of Working Group I to the Sixth Assessment Report of the Intergovernmental Panel on Climate Change [Masson-Delmotte V, Zhai P, Pirani A, et al. (eds.)]. Cambridge University Press.
IPCC, 2022. Summary for Policymakers [Pörtner H-O, Roberts D C, Poloczanska E S, et al. (eds.)]. In: Climate Change 2022: Impacts, Adaptation, and Vulnerability. Contribution of Working Group II to the Sixth Assessment Report of the Intergovernmental Panel on Climate Change. Cambridge University Press.
Jones S J, Lima F P, Wethey D S. 2010. Rising environmental temperatures and biogeography: Poleward range contraction of the blue mussel, Mytilus edulis L. , in the western Atlantic. Journal of Biogeography, 37: 2243–2259
Kassambara A. 2021. Pipe-friendly framework for basic statistical tests (Version 0.7). https://cran.r-project.org/web/packages/ rstatix/index.html[2021-06-13/2022-09-27]
Kim J H, Min J, Kang E J, et al. 2018. Elevated temperature and changed carbonate chemistry: effects on calcification, photosynthesis, and growth of Corallina officinalis (Corallinales, Rhodophyta). Phycologia, 57(3): 280–286, doi: 10.2216/17-71.1
King N G, McKeown N J, Smale D A, et al. 2019. Evidence for different thermal ecotypes in range centre and trailing edge kelp populations. Journal of Experimental Marine Biology and Ecology, 514: 10–17
Kolzenburg R, 2022. The direct influence of climate change on marginal populations: a review. Aquatic Sciences, 84(2): 1–20
Kolzenburg R, Coaten D J, Ragazzola F. 2022. Physiological characterisation of the calcified alga Corallina officinalis (Rhodophyta) from the leading to trailing edge in the Northeast Atlantic. European Journal of Phycology, 58(1): 83–98
Kolzenburg R, Nicastro K R, McCoy S J, et al. 2019. Understanding the margin squeeze: Differentiation in fitness-related traits between central and trailing edge populations of Corallina officinalis. Ecology and Evolution, 9(10): 5787–5801, doi: 10.1002/ece3.5162
Kübler J E, Davison I R. 1993. High-temperature tolerance of photosynthesis in the red alga Chondrus crispus. Marine Biology, 117: 327–35, doi: 10.1007/BF00345678
Laufkötter C, Zscheischler J, Frölicher T L. 2020. High-impact marine heatwaves attributable to human-induced global warming. Science, 369(6511): 1621–1625, doi: 10.1126/science.aba0690
Layne J R Jr, Claussen D L, Manis M L. 1987. Effects of acclimation temperature, season, and time of day on the critical thermal maxima and minima of the crayfish Orconectes rusticus. Journal of Thermal Biology, 12: 183–7, doi: 10.1016/0306-4565(87)90001-5
Lima F P, Ribeiro P A, Queiroz N, et al. 2007. Do distributional shifts of northern and southern species of algae match the warming pattern?. Global Change Biology, 13(12): 2592–2604.
Lüning K. 1984. Temperature tolerance and biogeography of seaweeds: the marine algal flora of Helgoland (North Sea) as an example. Helgoläander Meeresuntersuchungen, 38: 305–17.
Magill C L, Maggs C A, Johnson M P, et al. 2019. Sustainable Harvesting of the Ecosystem Engineer Corallina officinalis for Biomaterials. Frontiers in Marine Science, 6: 285, doi: 10.3389/fmars.2019.00285
Meteo. 2021. Ministry of the Environment, Territory and Infrastructures - Xunta de Galicia, accessed 30 March 2021, http://www2.meteogalicia.gal/galego/observacion/plataformas/platHistorico.asp?Nest=15100&red=102
Mineur F, Arenas F, Assis J, et al. 2015. European seaweeds under pressure: Consequences for communities and ecosystem functioning. Journal of Sea Research, 98: 91–108, doi: 10.1016/j.seares.2014.11.004
Mota C F, Engelen A H, Serrao E A, et al. 2018. Differentiation in fitness-related traits in response to elevated temperatures between leading and trailing edge populations of marine macrophytes. PloS One, 13(9): 0203666
Ntuli N N, Nicastro K R, Zardi G I, et al. 2020. Rejection of the genetic implications of the “Abundant Centre Hypothesis” in marine mussels. Scientific Reports, 10: 604, doi: 10.1038/s41598-020-57474-0
Oliver E C, Donat M G, Burrows M T, et al. 2018. Longer and more frequent marine heatwaves over the past century. Nature Communications, 9(1): 1324, doi: 10.1038/s41467-018-03732-9
Padilla-Gamino J L, Carpenter R C. 2007. Seasonal acclimatization of Asparagopsis taxiformis (Rhodophyta) from different biogeographic regions. Limnology and Oceanography, 52: 833–42, doi: 10.4319/lo.2007.52.2.0833
Ragazzola F, Foster L C, Form A U, et al. 2013. Phenotypic plasticity of coralline algae in a high CO2 world. Ecology and Evolution, 3(10): 3436–3446, doi: 10.1002/ece3.723
Rendina F, Bouchet P J, Appolloni L, et al. 2019. Physiological response of the coralline alga Corallina officinalis L. to both predicted long-term increases in temperature and short-term heatwave events. Marine Environmental Research, 150: 104764, doi: 10.1016/j.marenvres.2019.104764
Saada G, Nicastro K R, Jacinto R, et al. 2016. Taking the heat: distinct vulnerability to thermal stress of central and threatened peripheral lineages of a marine macroalga. Diversity and Distributions, 22(10): 1060–1068, doi: 10.1111/ddi.12474
Sagarin R D, Gaines S D. 2002. The ‘abundant centre’ distribution: to what extent is it a biogeographical rule?. Ecology Letters, 5(1): 137–147
Sexton J P, McIntyre P J, Angert A L, et al. 2009. Evolution and ecology of species range limits. Annual Review of Ecology, Evolution and Systematics, 40: 415–436
Smale D A, Wernberg T, Oliver E C J, et al. 2019. Marine heatwaves threaten global biodiversity and the provision of ecosystem services. Nature Climate Change, 9(4): 306–312, doi: 10.1038/s41558-019-0412-1
Steller D L, Riosmena-Rodríguez R, Foster M S, et al. 2003. Rhodolith bed diversity in the Gulf of California: the importance of rhodolith structure and consequences of disturbance. Aquatic conservation: Marine and Freshwater Ecosystems, 13(S1): S5–S20, doi: 10.1002/aqc.564
Straub S C, Wernberg T, Thomsen M S, et al. 2019. Resistance, extinction, and everything in between—The diverse responses of seaweeds to marine heatwaves. Frontiers in Marine Science, 6: 763, doi: 10.3389/fmars.2019.00763
Tavares A I, Nicastro K R, Kolzenburg R, et al. 2018. Isolation and characterization of nine microsatellite markers for the red alga Corallina officinalis. Molecular Biology Reports, 45(6): 2791–2794
Underwood A J. 1997. Experiments in Ecology. Their Logical Design and Interpretation Using Analysis of Variance. Cambridge University Press: Cambridge
Whittaker R H. 1956. Vegetation of the Great Smoky Mountains. Ecological Monographs, 26: 2–80
Williamson C J, Brodie J, Goss B, et al. 2014. Corallina and Ellisolandia (Corallinales, Rhodophyta) photophysiology over daylight tidal emersion: interactions with irradiance, temperature and carbonate chemistry. Marine Biology, 161: 2051–2068, doi: 10.1007/s00227-014-2485-8
Williamson C J, Perkins R, Yallop M L, et al. 2018. Photoacclimation and photoregulation strategies of Corallina (Corallinales, Rhodophyta) across the NE Atlantic. European Journal of Phycology, 53(3): 290–306, doi: 10.1080/09670262.2018.1442586
Yang A, Dick C W, Yao X, et al. 2016. Impacts of biogeographic history and marginal population genetics on species range limits: a case study of Liriodendron chinense. Scientific Reports, 6(1): 25632, doi: 10.1038/srep25632
Zardi G I, Nicastro K R, Serrão E A, et al. 2015. Closer to the rear edge: Ecology and genetic diversity down the core-edge gradient of a marine macroalga. Ecosphere, 6(2): 1–25
Zuur A F, Ieno E N, Smith G M. 2007. Analysing Ecological Data. Vol 680. New York: Springer
Regina Kolzenburg, Federica Ragazzola, Laura Tamburello, Katy R. Nicastro, Christopher D. McQuaid, Gerardo I. Zardi. Photosynthetic response to a winter heatwave in leading and trailing edge populations of the intertidal red alga Corallina officinalis (Rhodophyta)[J]. Acta Oceanologica Sinica, 2024, 43(7): 70-77. doi: 10.1007/s13131-023-2275-6
Regina Kolzenburg, Federica Ragazzola, Laura Tamburello, Katy R. Nicastro, Christopher D. McQuaid, Gerardo I. Zardi. Photosynthetic response to a winter heatwave in leading and trailing edge populations of the intertidal red alga Corallina officinalis (Rhodophyta)[J]. Acta Oceanologica Sinica, 2024, 43(7): 70-77. doi: 10.1007/s13131-023-2275-6
Figure 1. Planned daily tidal variations for northern margin populations (top) and southern margin populations (bottom) in the experimental design for the 4 treatments (Control: C, Heatwave: HW, elevated temperature: C+3℃; and heatwave during elevated temperature: HW+3℃). Fluctuations resemble daily average temperature fluctuations and times in historic data. Figure re-drawn and amended after Rendina et al. (2019).
Figure 2. Planned temperature variations in northern margin populations (grey) and southern margin populations (black) in 4 treatments (Control: C, heatwave: HW, elevated temperature: C+3℃ and heatwave during elevated temperature: HW+3℃). The key time points during the experiment: before the heatwave (bHW), after the heatwave (aHW) and after the recovery (recovery) phases are indicated as open circles and with abbreviations. Figure re-drawn and amended after Rendina et al. (2019).
Figure 3. Successive Fv/Fm measurements (mean ± SE) before (t14), throughout the heatwave (grey highlighted) and recovery phases in northern margin Population 1 (top) and Population 2 (bottom). Black, red, grey and yellow lines represent Control (C), heatwave (HW), elevated temperature (C+3℃) and Heatwave in elevated temperature (HW+3℃) treatments, respectively.
Figure 4. Successive Fv/Fm measurements (mean ± SE) before (t14), throughout the heatwave (grey highlighted) and recovery phases in southern margin Population 1 (top) and Population 2 (bottom). Black, red, grey and yellow lines represent Control (C), heatwave (HW), elevated temperature (C+3℃) and heatwave in elevated temperature (HW+3℃) treatments, respectively.


 DownLoad:


 DownLoad:


