Figure
1.
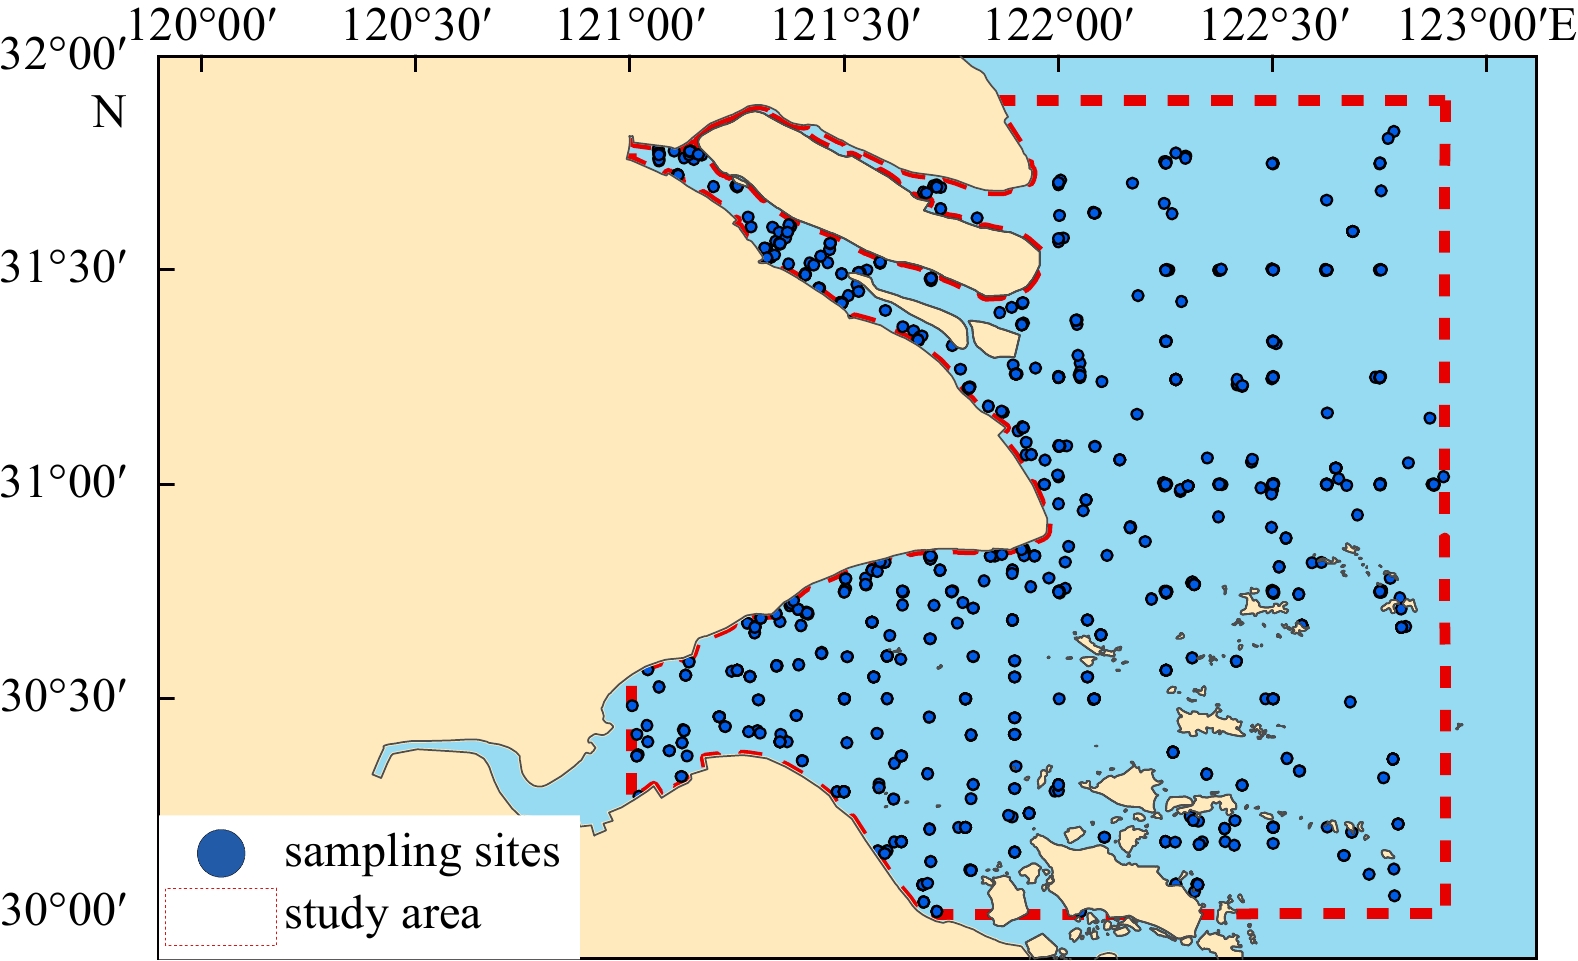
Location of the Changjiang River Estuary and adjacent waters.
| Citation: | Lu Yang, Yujia Zhang, Xiaoli Wang, Qiulu Wang, Long He, Xiao Li. Spatiotemporal changes of biogenic elements in the Changjiang River Estuary and adjacent waters in summer over the last decade[J]. Acta Oceanologica Sinica, 2023, 42(1): 83-90. doi: 10.1007/s13131-022-2104-3

|
The biogenic elements such as nitrogen (N), phosphorus (P), and silicon (Si) in the seawater are essential nutrients for the growth and reproduction of phytoplankton, and play a very critical role in marine ecosystem functioning (Boyce et al., 2010; Falco et al., 2010; Yang et al., 2015). Suitable biogenic elements can maintain the balance of the marine ecosystem, while the lack or surplus of biogenic elements will lead to a lack of nutrition or eutrophication of the seawater, making the marine ecosystem unbalanced and biological communities changed, as well as leading to marine ecological disasters and the exhaustion of economic species (Anderson et al., 2002; Xiao et al., 2018).
The estuary areas have been well recognized as areas of high biological productivity and interfaces of material transportation and transformation between land and ocean (Furuya et al., 2003; Bianchi and Allison, 2009). As China’s largest estuary, the Changjiang River Estuary is endowed with unique geographic location, monsoon and circulation conditions and complex estuarine ecosystem (Chen et al., 2015; Dai et al., 2016; Lu et al., 2017). Continuous runoff transports abundant biogenic elements into the estuary, forming the basis for the survival and development of marine lives. Since 1980s, with the ever-expanding population and economic aggregation in the Changjiang River Basin, the nutrients have experienced a drastic increase (Li et al., 2007; Chen et al., 2011; Wang and Cao, 2012; Yang et al., 2015), leading to the exacerbation of harmful algal and the alternation of phytoplankton community (Zhou et al., 2008; Wang and Wu, 2009; Jiang et al., 2014; Xiao et al., 2018). While in recent years, due to the strengthening of ecological protection, the amounts of pollutants have been gradually under control (Liang et al., 2016). In this study, the long-term changes of surface biogenic elements during the summer of 2008−2016 were analyzed by grids, to explore the spatial and temporal characteristics. Meanwhile the relationship with chlorophyll a (Chl-a) was further analyzed to discuss the impact of biogenic elements on phytoplankton community.
In this study, a square area (30.0°−31.9°N, 121.0°−122.9°E) was selected in the Changjiang River Estuary and adjacent waters (Fig. 1). A 9-year time series of surface seawater data in the summer (from June to August) of 2008−2016 were obtained from the Chinese National Marine Environmental Monitoring Program by different monitoring institutions. There were 995 samples in total, with an average of 111 samples per year. Stations were located irregularly in space, and were not all the same between years, but could basically cover all the study area.
Samples for the concentrations of nutrients (including
In this study, data were analyzed by 0.1°×0.1° grid using ArcGIS 10.3.1, considering different sites and numbers between years. The data were first preprocessed into grids, the value of each grid represented the average value of data inside.
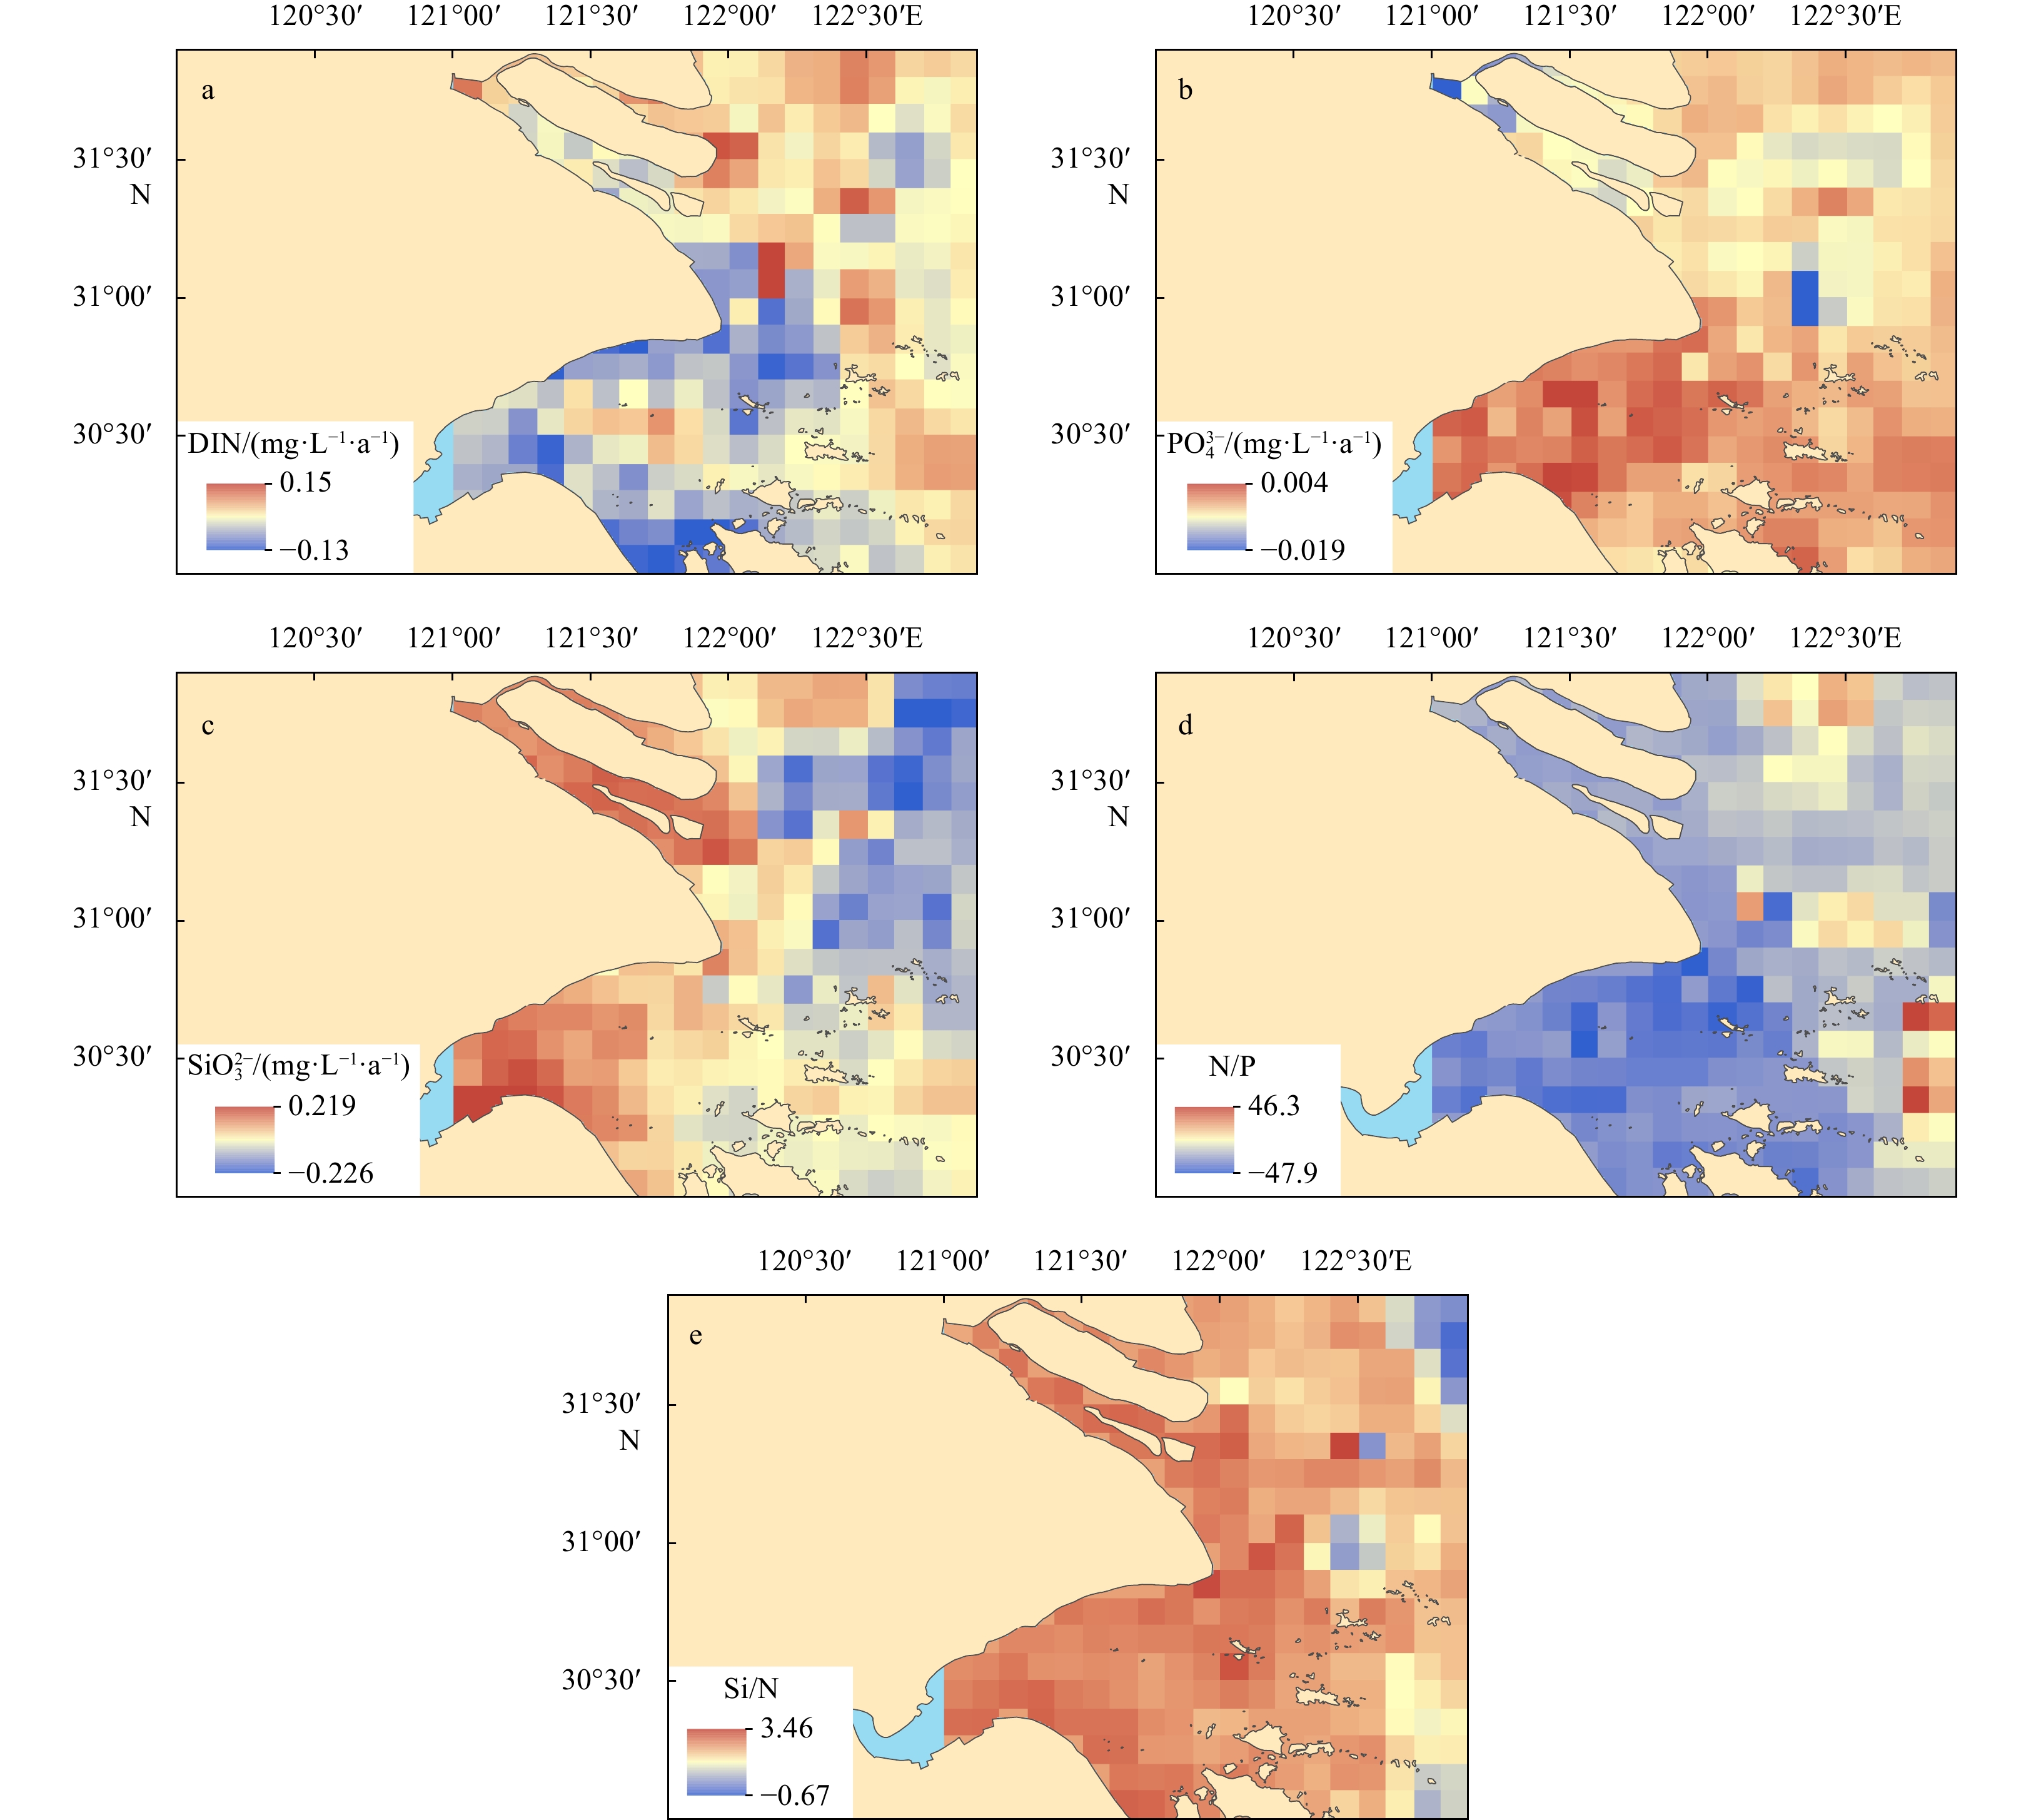
The temporal trend of biogenic elements was quantitated by the linear regression method, and the slope was calculated to show the trend and changing extent. Positive values indicated an increasing trend, while negative values indicated a decreasing trend. The absolute values represented the changing extent, in which higher values indicated a greater change.
The relationship between biogenic elements and Chl-a was analyzed by the grey correlation analysis (Tosun, 2006), taking the following steps:
First, the original data were normalized by the mean method.
| $$ {x}_{i}\left(k\right)=\frac{{X}_{i}\left(k\right)}{\dfrac{1}{n}\displaystyle\sum _{k=1}^{n}{X}_{i}\left(k\right)}, $$ | (1) |
for the factors negatively related to Chl-a (i.e., DIN,
| $$ {x}_{j}\left(k\right)=\frac{{\max}\left({X}_{j}\left(k\right)\right)-{X}_{j}\left(k\right)}{\dfrac{1}{n}\displaystyle\sum _{k=1}^{n}{X}_{j}\left(k\right)}, $$ | (2) |
where xi(k) and xj(k) are normalized, and Xi(k) and Xj (k) are original.
Secondly, the correlation coefficient
| $$ {\varepsilon }_{0i}\left(k\right)=\frac{{\varDelta}_{\min}+\rho {\varDelta}_{\max}}{{\varDelta}_{0i}\left(k\right)+\rho {\varDelta}_{\max}}, $$ | (3) |
where Δ0i (k) = |x0(k) − xi(k)|, x0(k) denotes the reference sequence, and xi(k) denotes the comparability sequence. ρ is distinguishing or identification coefficient which is between 0 and 1 (taking 0.5). Δmax and Δmin are the maximum and minimum values of Δ0i (k), respectively.
Finally, the grey correlation degree was calculated as the average value of the grey correlation coefficient, which was defined as follows:
| $$ {r}_{i}=\frac{1}{n}\sum _{k=1}^{n}{\varepsilon }_{0i}\left(k\right), $$ | (4) |
where ri is the grey relational grade which represents the level of correlation between the reference sequence and the comparability sequence. If a particular comparability sequence is more important than the other comparability sequences to the reference sequence, then the grey correlation degree for that comparability sequence and reference sequence will be higher than others.
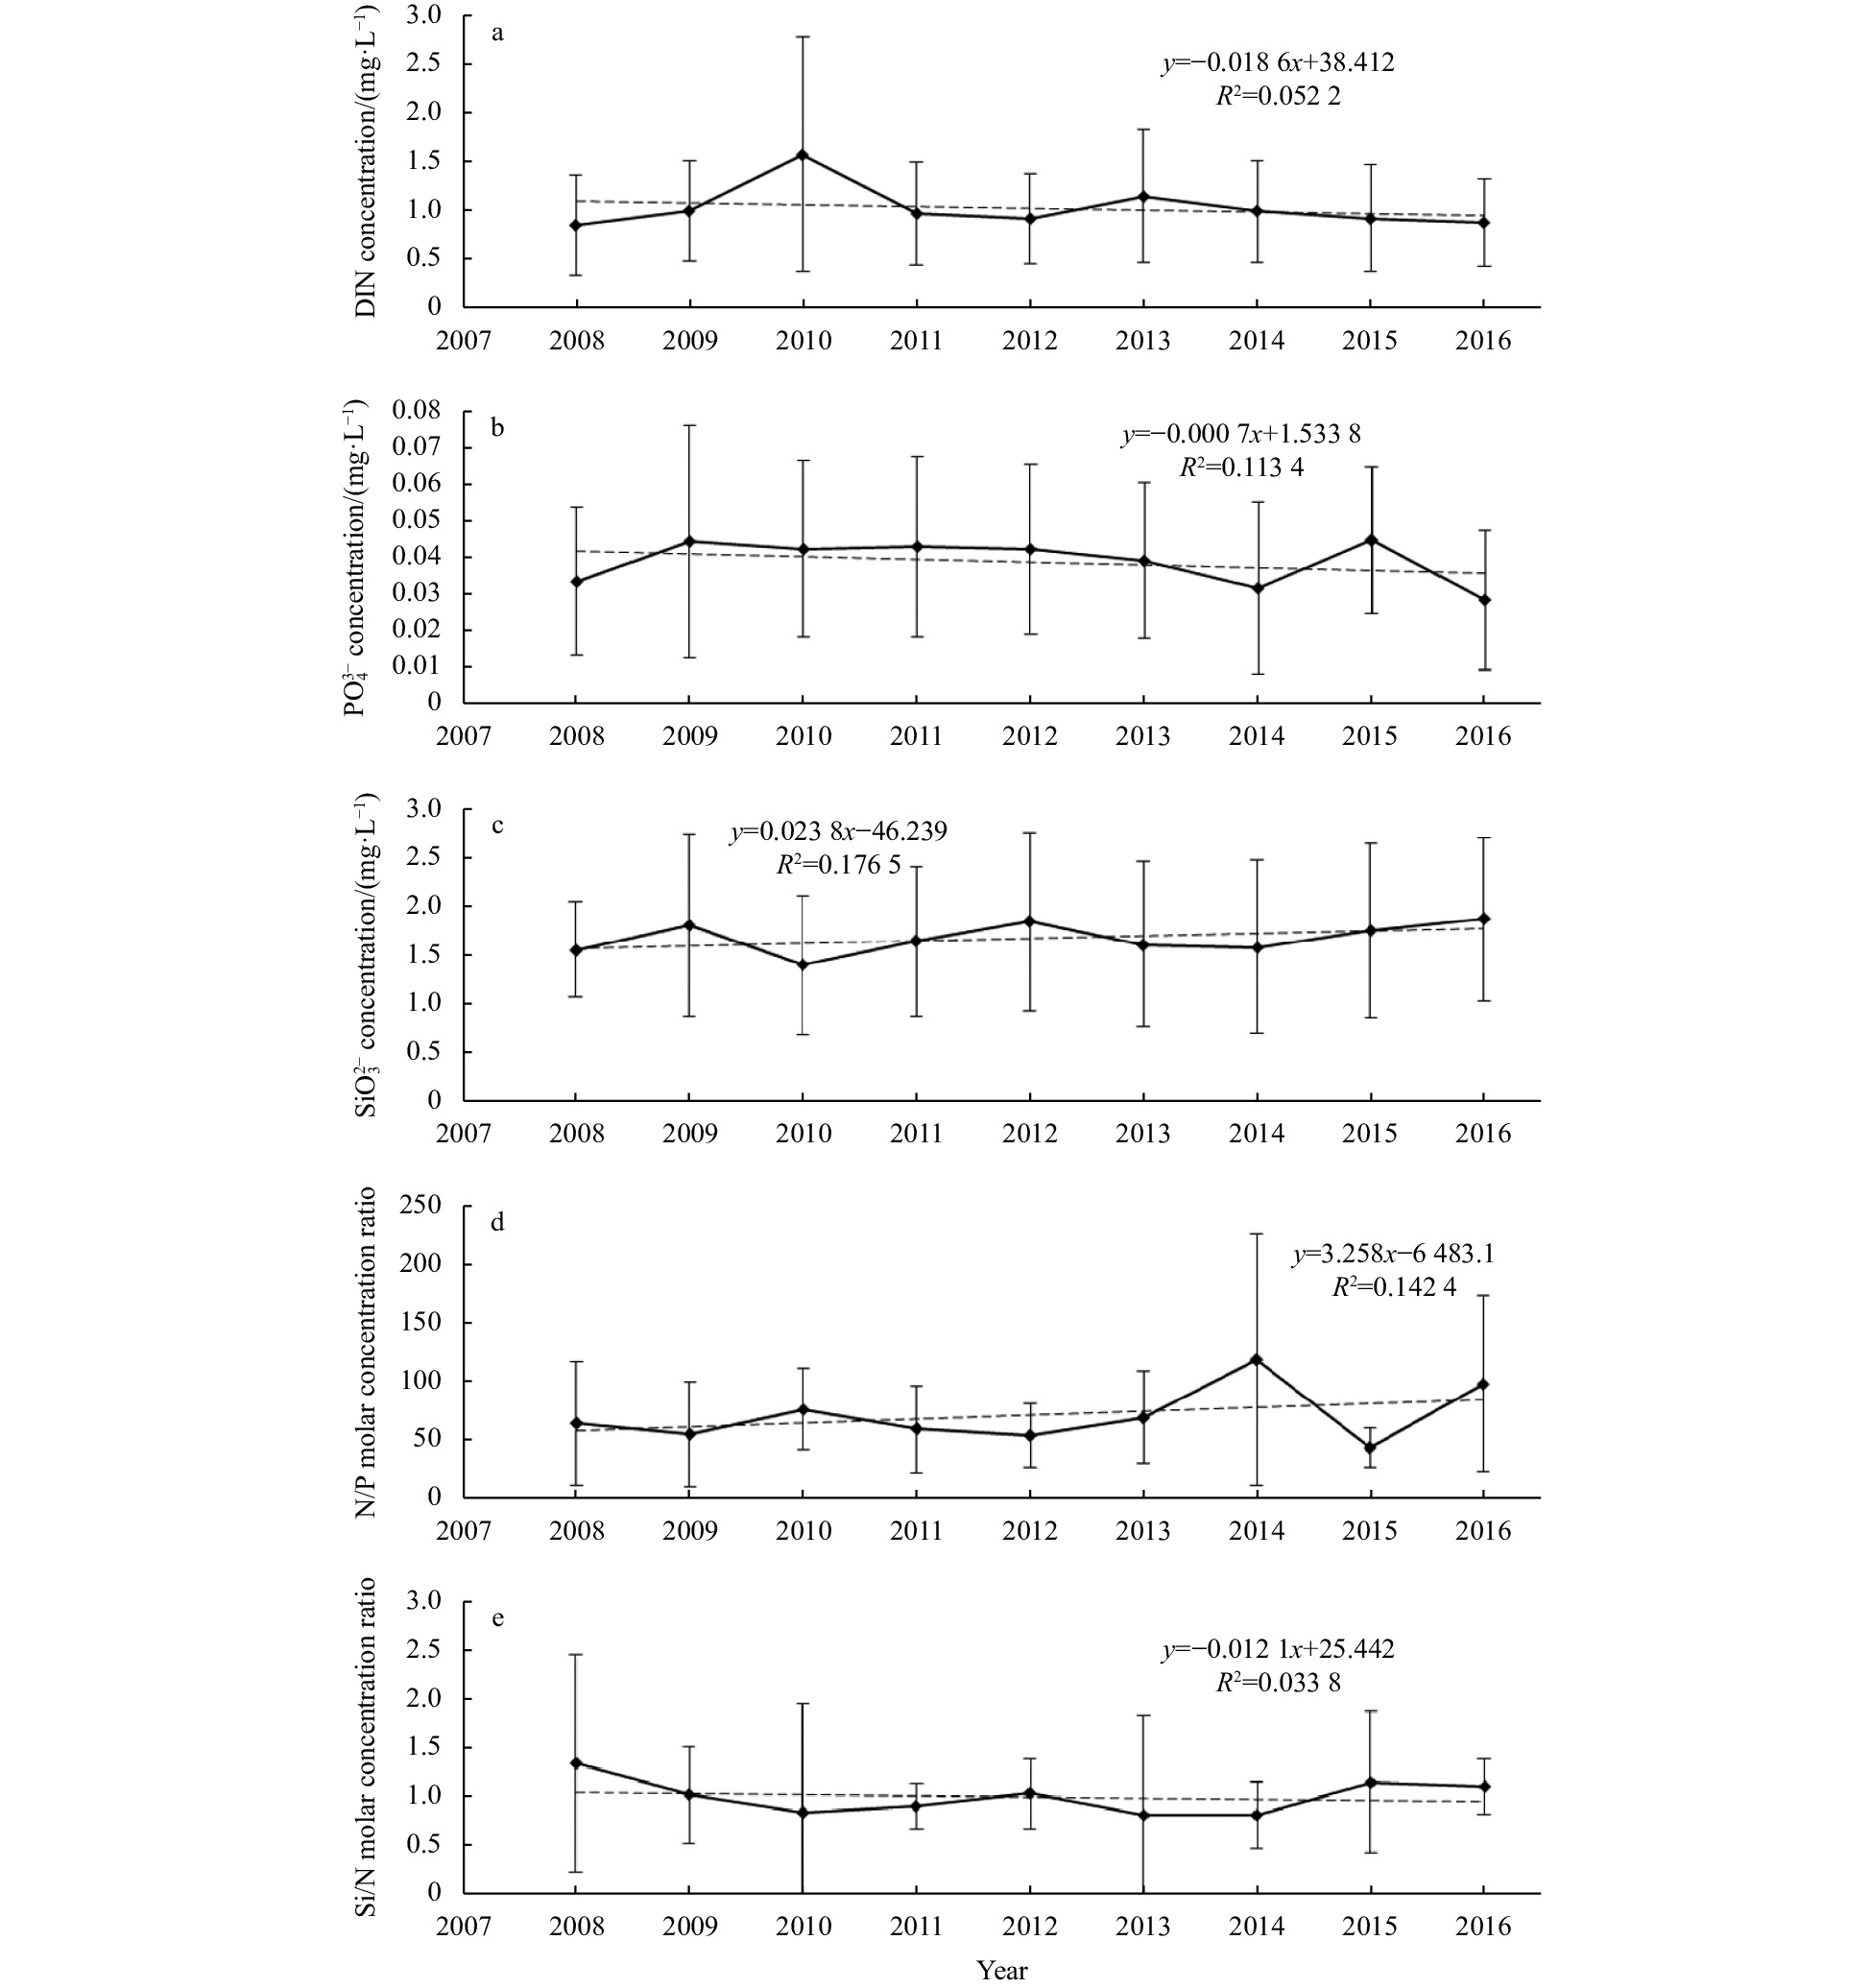
The annual mean concentrations of DIN,

The spatiotemporal changes of biogenic elements are shown in Fig. 3. The concentrations of DIN,

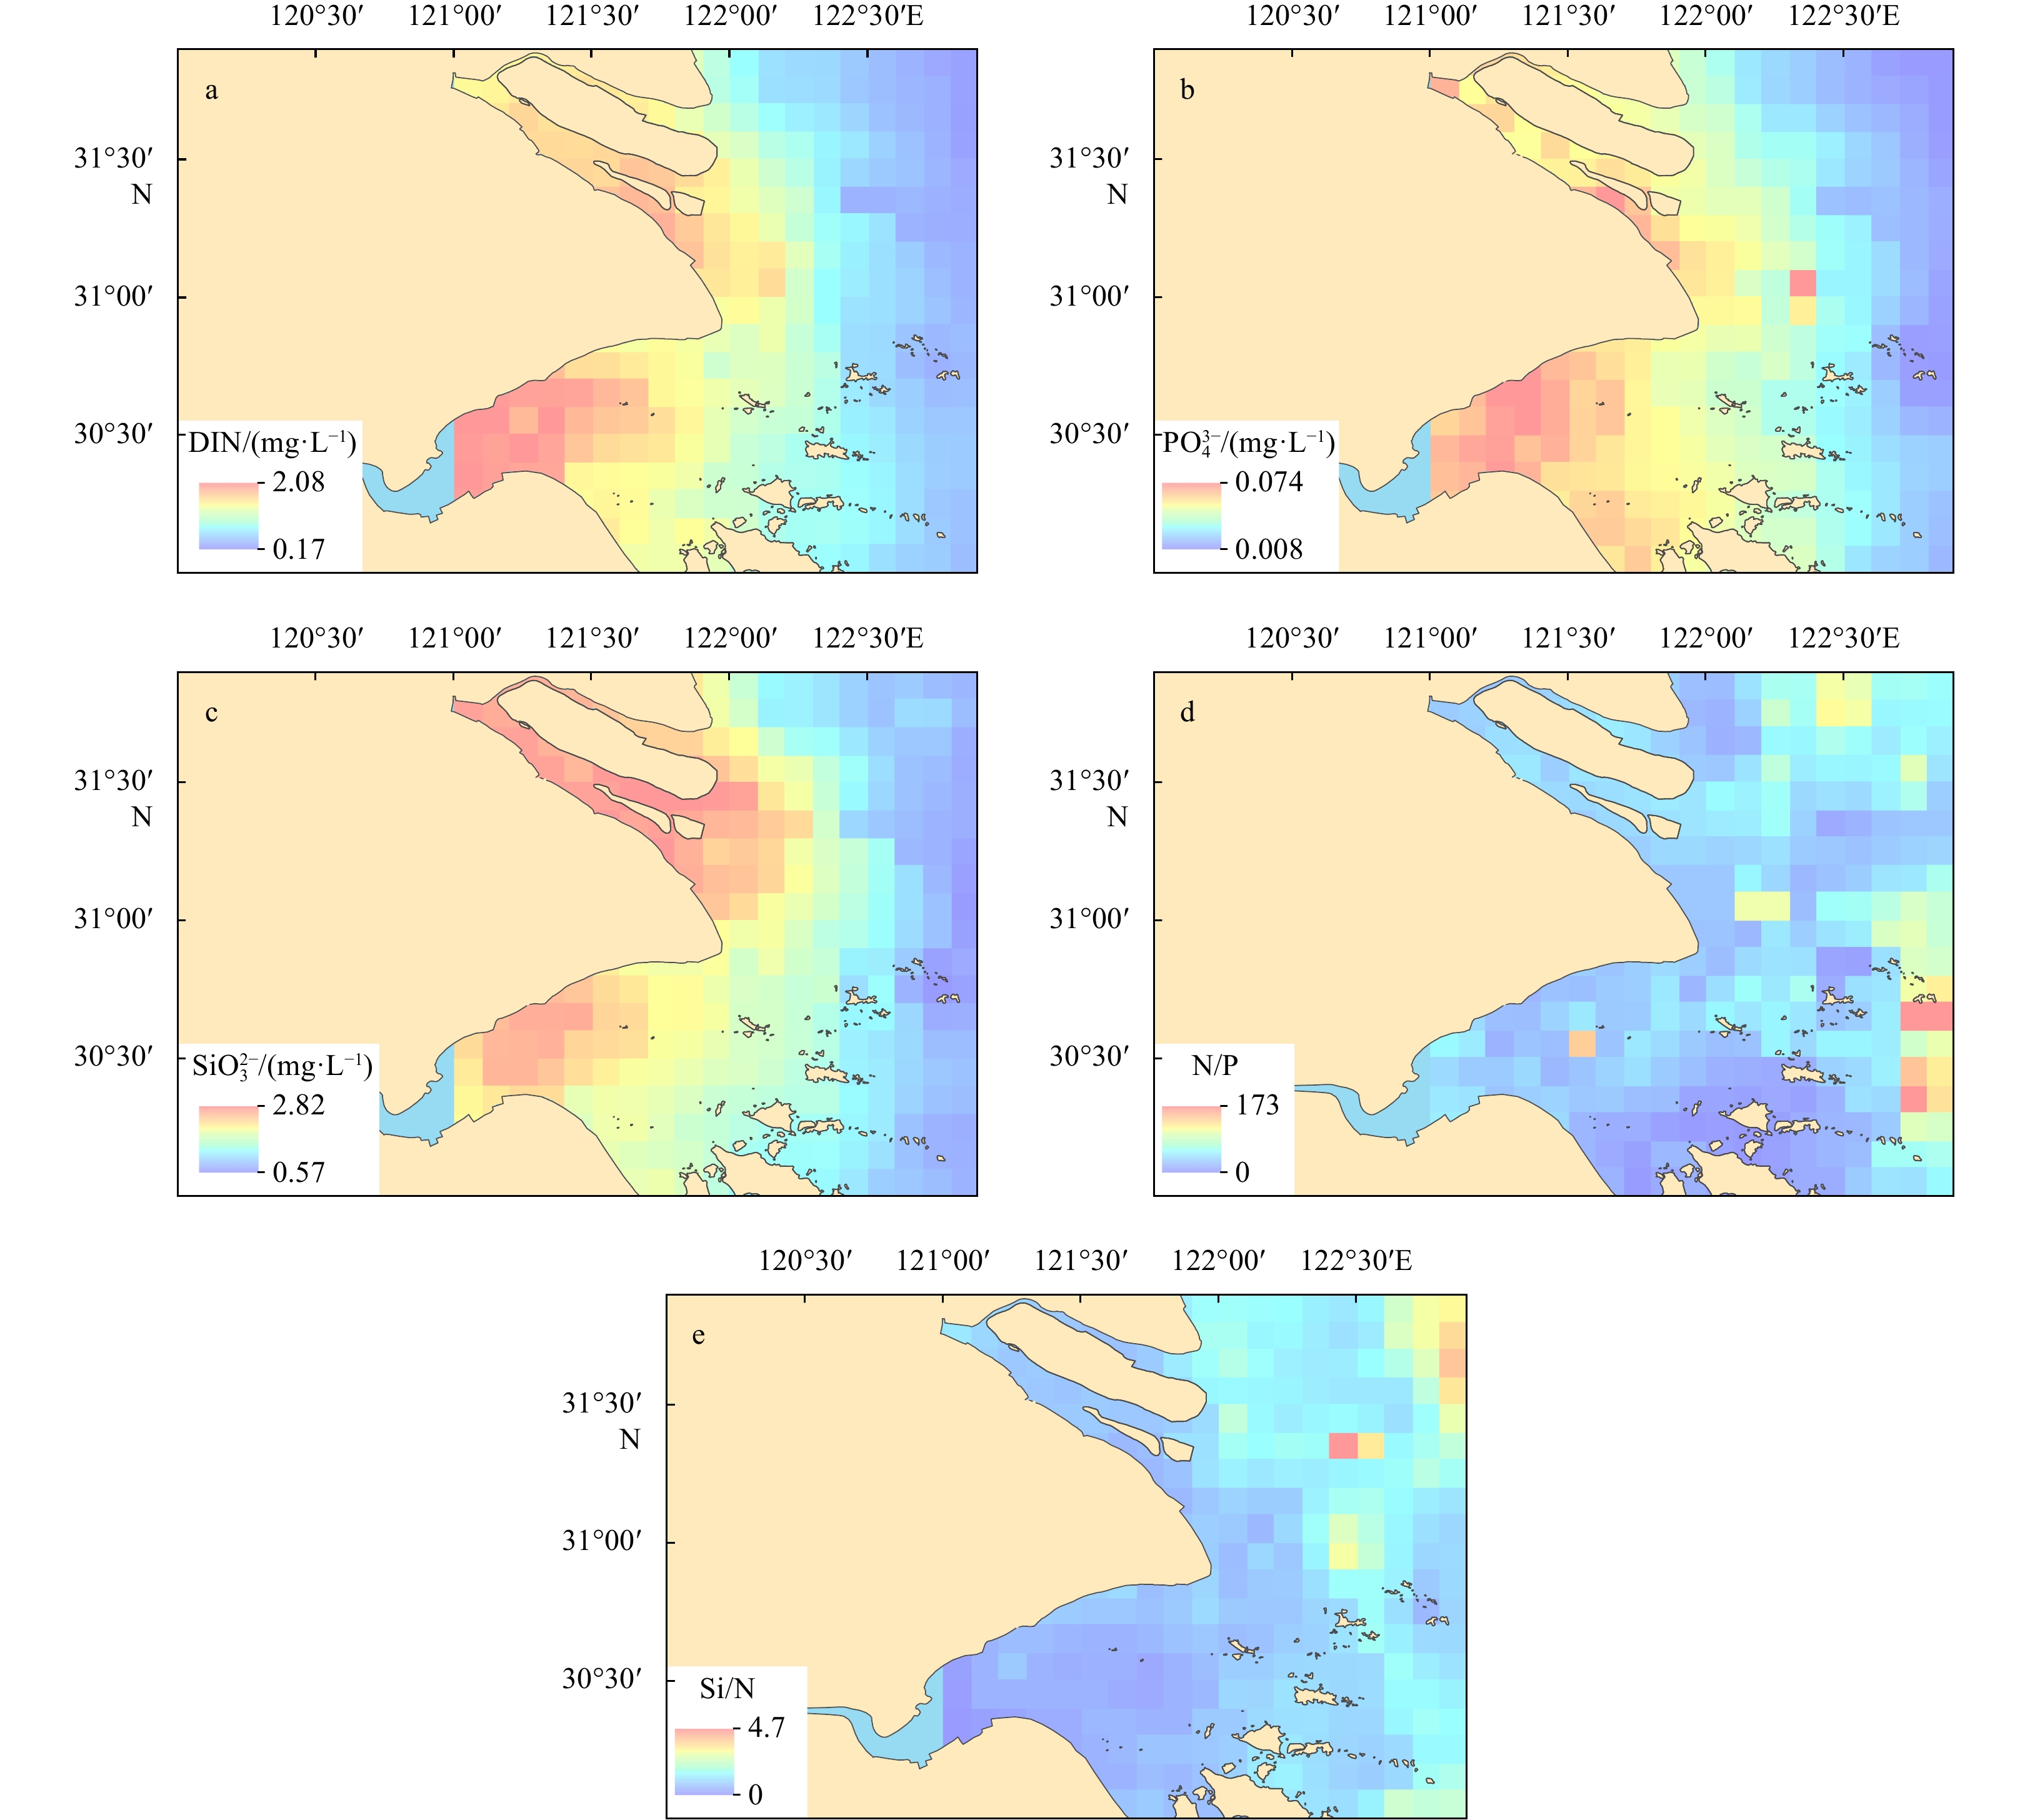
The spatial distributions of biogenic elements in the study area are shown in Fig. 3. Concentrations of biogenic elements (DIN,
In this study, concentrations of Chl-a were analyzed to study the relationship between Chl-a and biogenic elements. The spatial distribution of Chl-a was similar to those of N/P and Si/N (Figs 4 and 5). High-value areas were located in the far-shore waters on the eastern waters of Zhoushan Islands, while low-value areas were in the Changjiang River Estuary.


The grey correlation analysis was carried out among DIN,
| Factors | Grey correlation degree | Rank |
| DIN concentration | 0.744 | 4 |
| ${{\rm {PO}}_4^{3-}} $ concentration | 0.566 | 5 |
| ${{\rm {SiO}}_3^{2-}} $ concentration | 0.854 | 3 |
| N/P molar concentration ratio | 0.924 | 1 |
| Si/N molar concentration ratio | 0.922 | 2 |
 DownLoad:
CSV
DownLoad:
CSV
Since the 21st century, Chinese government has paid full attention on the ecological environment protection, and the total amounts of pollutants entering the river and the sea have been effectively controlled. Though the concentrations of DIN and
The concentration of
Historical research found that N/P in the study area was seriously uncoordinated since the late 1980s (Zhou et al., 2006; Wang and Cao, 2012; Yang et al., 2015). It increased from 14 in 1959, to the highest 580 in 1987 (Chen et al., 2011). By 2016, the average of N/P was still above 80, deviated significantly from the Redfield ratio (16). The uncoordination of N/P was mainly due to the excessively high concentrations of DIN (Wang et al., 2002; Yin et al., 2016). It may also relate to the decrease of sand and runoff of Changjiang River (Chen et al., 2011). The decrease of sand could cause the decrease of suspended materials in the Changjiang River, thus weakening the supplementation of N. Meantime, the decrease of runoff may result in the invasion of Taiwan Warm Current, strengthening the supplementation of P. Si/N showed the trend of decrease, attributed for the decrease of Si and the increase of N (Yang et al., 2015).
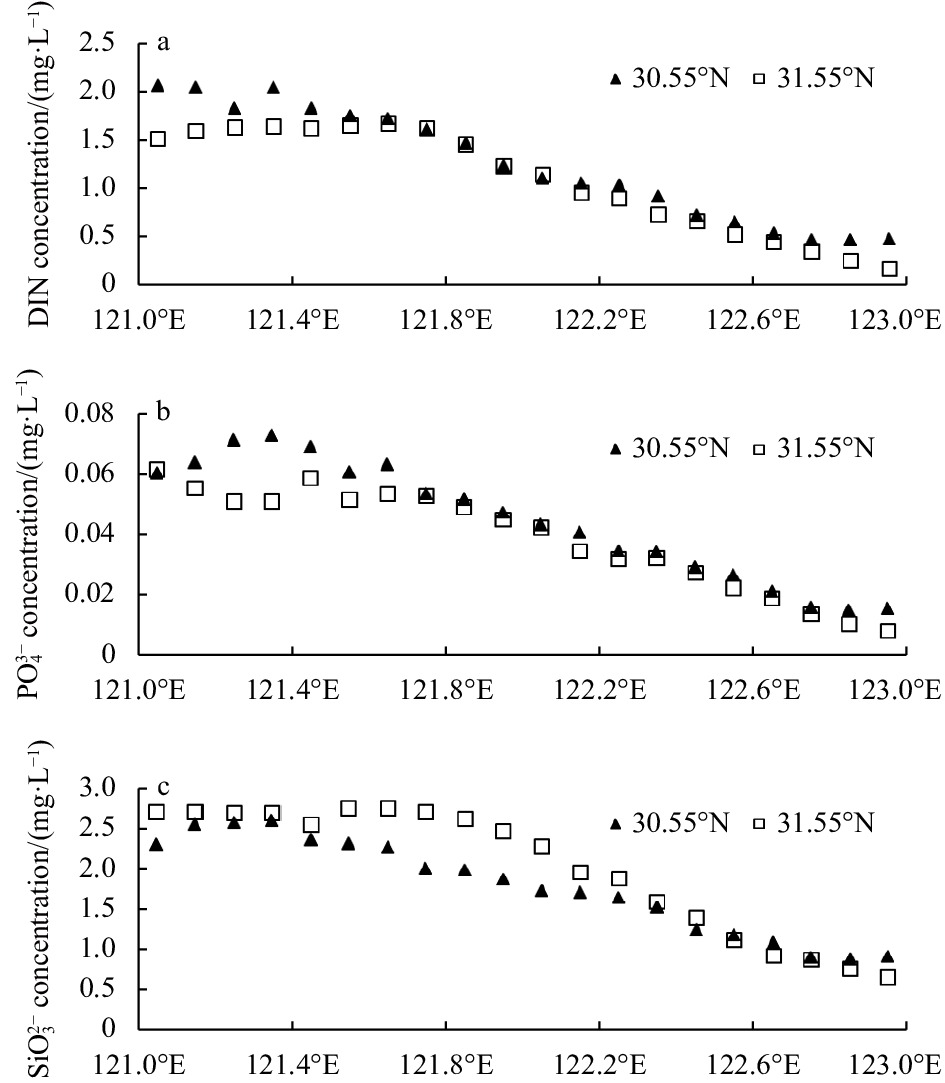
The study area is mainly influenced by the eastern Taiwan Warm Current system and the western coastal current system (Sun, 2006). The concentrations of DIN,

The distributions of N/P, Si/N and Chl-a all showed similar patterns, which increased from near-shore waters to far-shore waters. Through the grey correlation analysis, we also found that N/P and Si/N had a closer correlation with Chl-a, compared with DIN,
In the study area, N/P far exceeded the Redfield ratio, and Si/N fluctuated between the upper and lower Redfield ratios. It was generally believed that potential P limitation occurred when N/P>22 and Si/P>22, potential N limitation occurred when N/P<10 and Si/P>1, and potential Si limitation occurred when Si/N<1 and Si/P<10 (Justić et al., 1995). Accordingly, the study area was generally in a state of potential P limitation (Table 2) (Wang et al., 2013; Ye et al., 2015), especially on the southeast side of study area with N/P above 100 and Si/P above 50. As this area is where the famous Zhoushan fishing ground is located, plankton is distributed in large quantities, resulting in excessive consumption of P in the area, and N/P was much higher than the input area of biogenic elements in the Changjiang River Estuary and Hangzhou Bay. The spatial distribution of Chl-a (Fig. 5) also confirmed this. Phosphorus transported to the far-shore waters was greatly absorbed and utilized by phytoplankton, causing potential P limitation in this area (Gao et al., 2004; Wang and Cao, 2012; Wang et al., 2016).
| Year | N limitation | P limitation | Si limitation |
| 2008 | 0.3% | 98.0% | 0.6% |
| 2009 | 0.8% | 93.8% | 2.0% |
| 2010 | 0 | 86.3% | 0 |
| 2011 | 0 | 99.2% | 0 |
| 2012 | 0 | 96.9% | 0 |
| 2013 | 0.3% | 97.8% | 0.3% |
| 2014 | 0 | 99.7% | 0 |
| 2015 | 0.3% | 91.9% | 0.3% |
| 2016 | 0 | 99.2% | 0 |
DownLoad:
CSV
The variations of biogenic elements could result in the variations of phytoplankton bloom dynamics. The study area has always been high-incidence areas of red tides in China. During 2008−2016, 5.8 red tide events were recorded annually, of which the most was 12 times in 2008, and the least was 2 times in 2011 (State Oceanic Administration, 2008−2016) (Fig. 7). Many studies have pointed out that the imbalance of regional biogenic elements was one of the important reasons for severe eutrophication and frequent occurrence of red tides (Gao et al., 2004). Judging from the dominant red tide species, 4 out of 5 red tide events in 2010 were caused by diatoms and only one was caused by dinoflagellates, while in 2016, 4 out of 7 red tide events were caused by dinoflagellates and only 2 were diatoms. The total amount of dinoflagellates red tide has exceeded 50% in 9 a. Studies found that the species of dinoflagellates in the phytoplankton community in the Changjiang River Estuary increased significantly compared with diatoms (Jiang et al., 2014; Lin and Li, 2017). In general, diatoms are the dominant species due to their rapid growth and strong competitiveness when the biogenic elements are sufficient; dinoflagellates are more likely to be the dominant species under P-limited conditions (Örnólfsdóttir et al., 2004; Liang et al., 2016; Xiao et al., 2018). When P is depleted in the environment and N is still relatively sufficient, the dinoflagellates can adapt to the environment with lower biogenic elements content thus blooming in large quantities, and triggering the succession of dominant red tide species (Wang and Cao, 2012; Li et al., 2015).

This paper analyzes the spatiotemporal changes of surface biogenic elements in the Changjiang River Estuary and adjacent waters during the summer of 2008−2016, and main conclusions are as follows:
During the summer of 2008~2016, the surface biogenic elements in the study area were generally stable. The concentrations of DIN and
Concentrations of biogenic elements (DIN,
The biogenic elements behaved conservatively in the Changjiang River Estuary, and nonconservatively in the Hangzhou Bay. Concentrations of biogenic elements (DIN,
The distributions of N/P, Si/N and Chl-a all showed similar patterns, which increased from near-shore waters to far-shore waters. Compared with the absolute values of biogenic elements, the correlation between the structure of biogenic elements and Chl-a was closer, indicating the important influence of phytoplankton on the structure of biogenic elements in the study area.
N/P far exceeded the Redfield ratio, while Si/N fluctuated around the Redfield ratio. The study area was generally in a state of potential P limitation, and could have potential impact on the phytoplankton community, triggering the shift of red tide dominant species from diatoms to dinoflagellates.
|
Anderson D M, Glibert P M, Burkholder J M. 2002. Harmful algal blooms and eutrophication: nutrient sources, composition, and consequences. Estuaries, 25(4): 704–726. doi: 10.1007/BF02804901
|
|
Bianchi T S, Allison M A. 2009. Large-river delta-front estuaries as natural “recorders” of global environmental change. Proceedings of the National Academy of Sciences of the United States of America, 106(20): 8085–8092. doi: 10.1073/pnas.0812878106
|
|
Boyce D G, Lewis M R, Worm B. 2010. Global phytoplankton decline over the past century. Nature, 466(7306): 591–596. doi: 10.1038/nature09268
|
|
Chen Dong, Dai Zhijun, Xu Ren, et al. 2015. Impacts of anthropogenic activities on the Changjiang (Yangtze) estuarine ecosystem (1998–2012). Acta Oceanologica Sinica, 34(6): 86–93. doi: 10.1007/s13131-015-0679-7
|
|
Chen Huimin, Sun Chengxing, Wu Yanqing. 2011. Analysis of trend of nutrient structure and influencing factors in Changjiang Estuary and its adjacent sea during 23 years. Marine Environmental Science (in Chinese), 30(4): 551–553,563
|
|
Chen Hongtao, Yu Zhigang, Yao Qingzheng, et al. 2010. Nutrient concentrations and fluxes in the Changjiang Estuary during summer. Acta Oceanologica Sinica, 29(2): 107–119. doi: 10.1007/s13131-010-0029-8
|
|
Dai Zhijun, Fagherazzi S, Mei Xuefei, et al. 2016. Decline in suspended sediment concentration delivered by the Changjiang (Yangtze) River into the East China Sea between 1956 and 2013. Geomorphology, 268: 123–132. doi: 10.1016/j.geomorph.2016.06.009
|
|
Falco S, Niencheski L F, Rodilla M, et al. 2010. Nutrient flux and budget in the Ebro Estuary. Estuarine, Coastal and Shelf Science, 87(1): 92–102
|
|
Furuya K, Hayashi M, Yabushita Y, et al. 2003. Phytoplankton dynamics in the East China Sea in spring and summer as revealed by HPLC-derived pigment signatures. Deep-Sea Research Part II: Topical Studies in Oceanography, 50(2): 367–387. doi: 10.1016/S0967-0645(02)00460-5
|
|
Gao Shengquan, Chen Jianfang, Jin Haiyan, et al. 2011. Characteristics of nutrients and eutrophication in the Hangzhou Bay and its adjacent waters. Journal of Marine Sciences (in Chinese), 29(3): 36–47
|
|
Gao Shengquan, Lin Yan, Jin Mingming, et al. 2004. Distribution features of nutrients and nutrient structure in the East China Sea and the Yellow Sea in spring and autumn. Donghai Marine Science (in Chinese), 22(4): 38–50
|
|
Jiang Zhibing, Liu Jingjing, Chen Jianfang, et al. 2014. Responses of summer phytoplankton community to drastic environmental changes in the Changjiang (Yangtze River) Estuary during the past 50 years. Water Research, 54: 1–11. doi: 10.1016/j.watres.2014.01.032
|
|
Justić D, Rabalais N N, Turner R E. 1995. Stoichiometric nutrient balance and origin of coastal eutrophication. Marine Pollution Bulletin, 30(1): 41–46. doi: 10.1016/0025-326X(94)00105-I
|
|
Li Yali, Shen Zhiliang, Xian Weiwei, et al. 2015. Structure characteristics of nutrients and their restrictive effect on phytoplankton in the Yangtze River Estuary. Marine Sciences (in Chinese), 39(4): 125–134
|
|
Li Maotian, Xu Kaiqin, Watanabe M, et al. 2007. Long-term variations in dissolved silicate, nitrogen, and phosphorus flux from the Yangtze River into the East China Sea and impacts on estuarine ecosystem. Estuarine, Coastal and Shelf Science, 71(1–2): 3–12
|
|
Liang Cui, Xian Weiwei, Shen Zhiliang. 2016. Analysis of trends and influencing factors of nitrogen and phosphate in the Yangtze River Estuary in spring over the last few years. Periodical of Ocean University of China (in Chinese), 46(3): 82–90
|
|
Lin Mei, Li Yang. 2017. Interdecadal variation of phytoplankton assemblage in Changjiang River Estuary in spring. Oceanologia et Limnologia Sinica (in Chinese), 48(2): 303–311
|
|
Lu Wenhai, Xiang Xianquan, Yang Lu, et al. 2017. The temporal-spatial distribution and changes of dissolved oxygen in the Changjiang Estuary and its adjacent waters for the last 50 a. Acta Oceanologica Sinica, 36(5): 90–98. doi: 10.1007/s13131-017-1063-6
|
|
Örnólfsdóttir E B, Lumsden S E, Pinckney J L. 2004. Nutrient pulsing as a regulator of phytoplankton abundance and community composition in Galveston Bay, Texas. Journal of Experimental Marine Biology and Ecology, 303(2): 197–220. doi: 10.1016/j.jembe.2003.11.016
|
|
Redfield A C, Ketchum B H, Richards F A. 1963. The influence of organisms on the composition of the sea water. In: Hill M N, ed. The Sea. New York: Interscience Publishers, 26–77
|
|
Sharp J H. 2003. Long Term Nutrient Trends and Phytoplankton Response in Delaware Estuary, USA. Dallas: Crown Press
|
|
State Oceanic Administration. 2008–2016. Bulletin of China Marine Environmental Status (in Chinese). Beijing: State Oceanic Administration
|
|
Sun Xiangping. 2006. Oceanography of China Seas (in Chinese). Beijing: China Ocean Press
|
|
Tosun N. 2006. Determination of optimum parameters for multi-performance characteristics in drilling by using grey relational analysis. The International Journal of Advanced Manufacturing Technology, 28(5): 450–455
|
|
Wang Jiangtao, Cao Jing. 2012. Variation and effect of nutrient on phytoplankton community in Changjiang Estuary during last 50 years. Marine Environmental Science (in Chinese), 31(3): 310–315
|
|
Wang Wentao, Cao Xihua, Yuan Yongquan, et al. 2016. Variation and controlling factor of nutrient distribution in Changjiang River Estuary and adjacent areas in 2012. Oceanologia et Limnologia Sinica (in Chinese), 47(4): 804–812
|
|
Wang Kui, Chen Jianfang, Jin Haiyan, et al. 2013. Nutrient structure and limitation in Changjiang River Estuary and adjacent East China Sea. Haiyang Xuebao (in Chinese), 35(3): 128–136
|
|
Wang Jinhui, Wu Jianyong. 2009. Occurrence and potential risks of harmful algal blooms in the East China Sea. Science of the Total Environment, 407(13): 4012–4021. doi: 10.1016/j.scitotenv.2009.02.040
|
|
Wang Baodong, Zhan Run, Zang Jiaye. 2002. Distributions and transportation of nutrients in Changjiang River Estuary and its adjacent sea areas. Haiyang Xuebao (in Chinese), 24(1): 53–58
|
|
Xiang Xianquan, Lu Wenhai, Xu Yan, et al. 2018. Study on temporal-spatial distribution and changes of dissolved oxygen in the Yellow Sea from 1965 to 2014. Indian Journal of Geo-Marine Sciences, 47(12): 2442–2453
|
|
Xiao Wupeng, Liu Xin, Irwin A J, et al. 2018. Warming and eutrophication combine to restructure diatoms and dinoflagellates. Water Research, 128: 206–216. doi: 10.1016/j.watres.2017.10.051
|
|
Yang Bin, Cao Lu, Liu Sumei, et al. 2015. Biogeochemistry of bulk organic matter and biogenic elements in surface sediments of the Yangtze River Estuary and adjacent sea. Marine Pollution Bulletin, 96(1–2): 471–484
|
|
Ye Ran, Liu Yanyun, Cui Yongping, et al. 2015. Temporal and spatial distributions of nutrient structure and limitation on phytoplankton in the East China Sea. Oceanologia et Limnologia Sinica (in Chinese), 46(2): 311–320
|
|
Yin Yan’e, Shen Anglv, Zhou Jin, et al. 2016. Analysis on the environmental factors and dissolved inorganic nitrogen in the Changjiang (Yangtze River) Estuary and in the adjacent East China Sea in spring and summer. Ecology and Environmental Sciences (in Chinese), 25(2): 272–278
|
|
Zhou Junli, Liu Zhengtao, Meng Wei, et al. 2006. The characteristics of nutrients distribution in the Yangtze River Estuary. Research of Environmental Sciences (in Chinese), 19(6): 139–144
|
|
Zhou Mingjiang, Shen Zhiliang, Yu Rencheng. 2008. Responses of a coastal phytoplankton community to increased nutrient input from the Changjiang (Yangtze) River. Continental Shelf Research, 28(12): 1483–1489. doi: 10.1016/j.csr.2007.02.009
|

Figures(7) / Tables(2)

Supported by:
Beijing Renhe Information Technology Co. Ltd

Lu Yang, Yujia Zhang, Xiaoli Wang, Qiulu Wang, Long He, Xiao Li. Spatiotemporal changes of biogenic elements in the Changjiang River Estuary and adjacent waters in summer over the last decade[J]. Acta Oceanologica Sinica, 2023, 42(1): 83-90. doi: 10.1007/s13131-022-2104-3

| Factors | Grey correlation degree | Rank |
| DIN concentration | 0.744 | 4 |
| ${{\rm {PO}}_4^{3-}} $ concentration | 0.566 | 5 |
| ${{\rm {SiO}}_3^{2-}} $ concentration | 0.854 | 3 |
| N/P molar concentration ratio | 0.924 | 1 |
| Si/N molar concentration ratio | 0.922 | 2 |
DownLoad:
CSV
| Year | N limitation | P limitation | Si limitation |
| 2008 | 0.3% | 98.0% | 0.6% |
| 2009 | 0.8% | 93.8% | 2.0% |
| 2010 | 0 | 86.3% | 0 |
| 2011 | 0 | 99.2% | 0 |
| 2012 | 0 | 96.9% | 0 |
| 2013 | 0.3% | 97.8% | 0.3% |
| 2014 | 0 | 99.7% | 0 |
| 2015 | 0.3% | 91.9% | 0.3% |
| 2016 | 0 | 99.2% | 0 |
DownLoad:
CSV
| Factors | Grey correlation degree | Rank |
| DIN concentration | 0.744 | 4 |
| ${{\rm {PO}}_4^{3-}} $ concentration | 0.566 | 5 |
| ${{\rm {SiO}}_3^{2-}} $ concentration | 0.854 | 3 |
| N/P molar concentration ratio | 0.924 | 1 |
| Si/N molar concentration ratio | 0.922 | 2 |
| Year | N limitation | P limitation | Si limitation |
| 2008 | 0.3% | 98.0% | 0.6% |
| 2009 | 0.8% | 93.8% | 2.0% |
| 2010 | 0 | 86.3% | 0 |
| 2011 | 0 | 99.2% | 0 |
| 2012 | 0 | 96.9% | 0 |
| 2013 | 0.3% | 97.8% | 0.3% |
| 2014 | 0 | 99.7% | 0 |
| 2015 | 0.3% | 91.9% | 0.3% |
| 2016 | 0 | 99.2% | 0 |
 DownLoad:


 DownLoad: