

Figure
1.
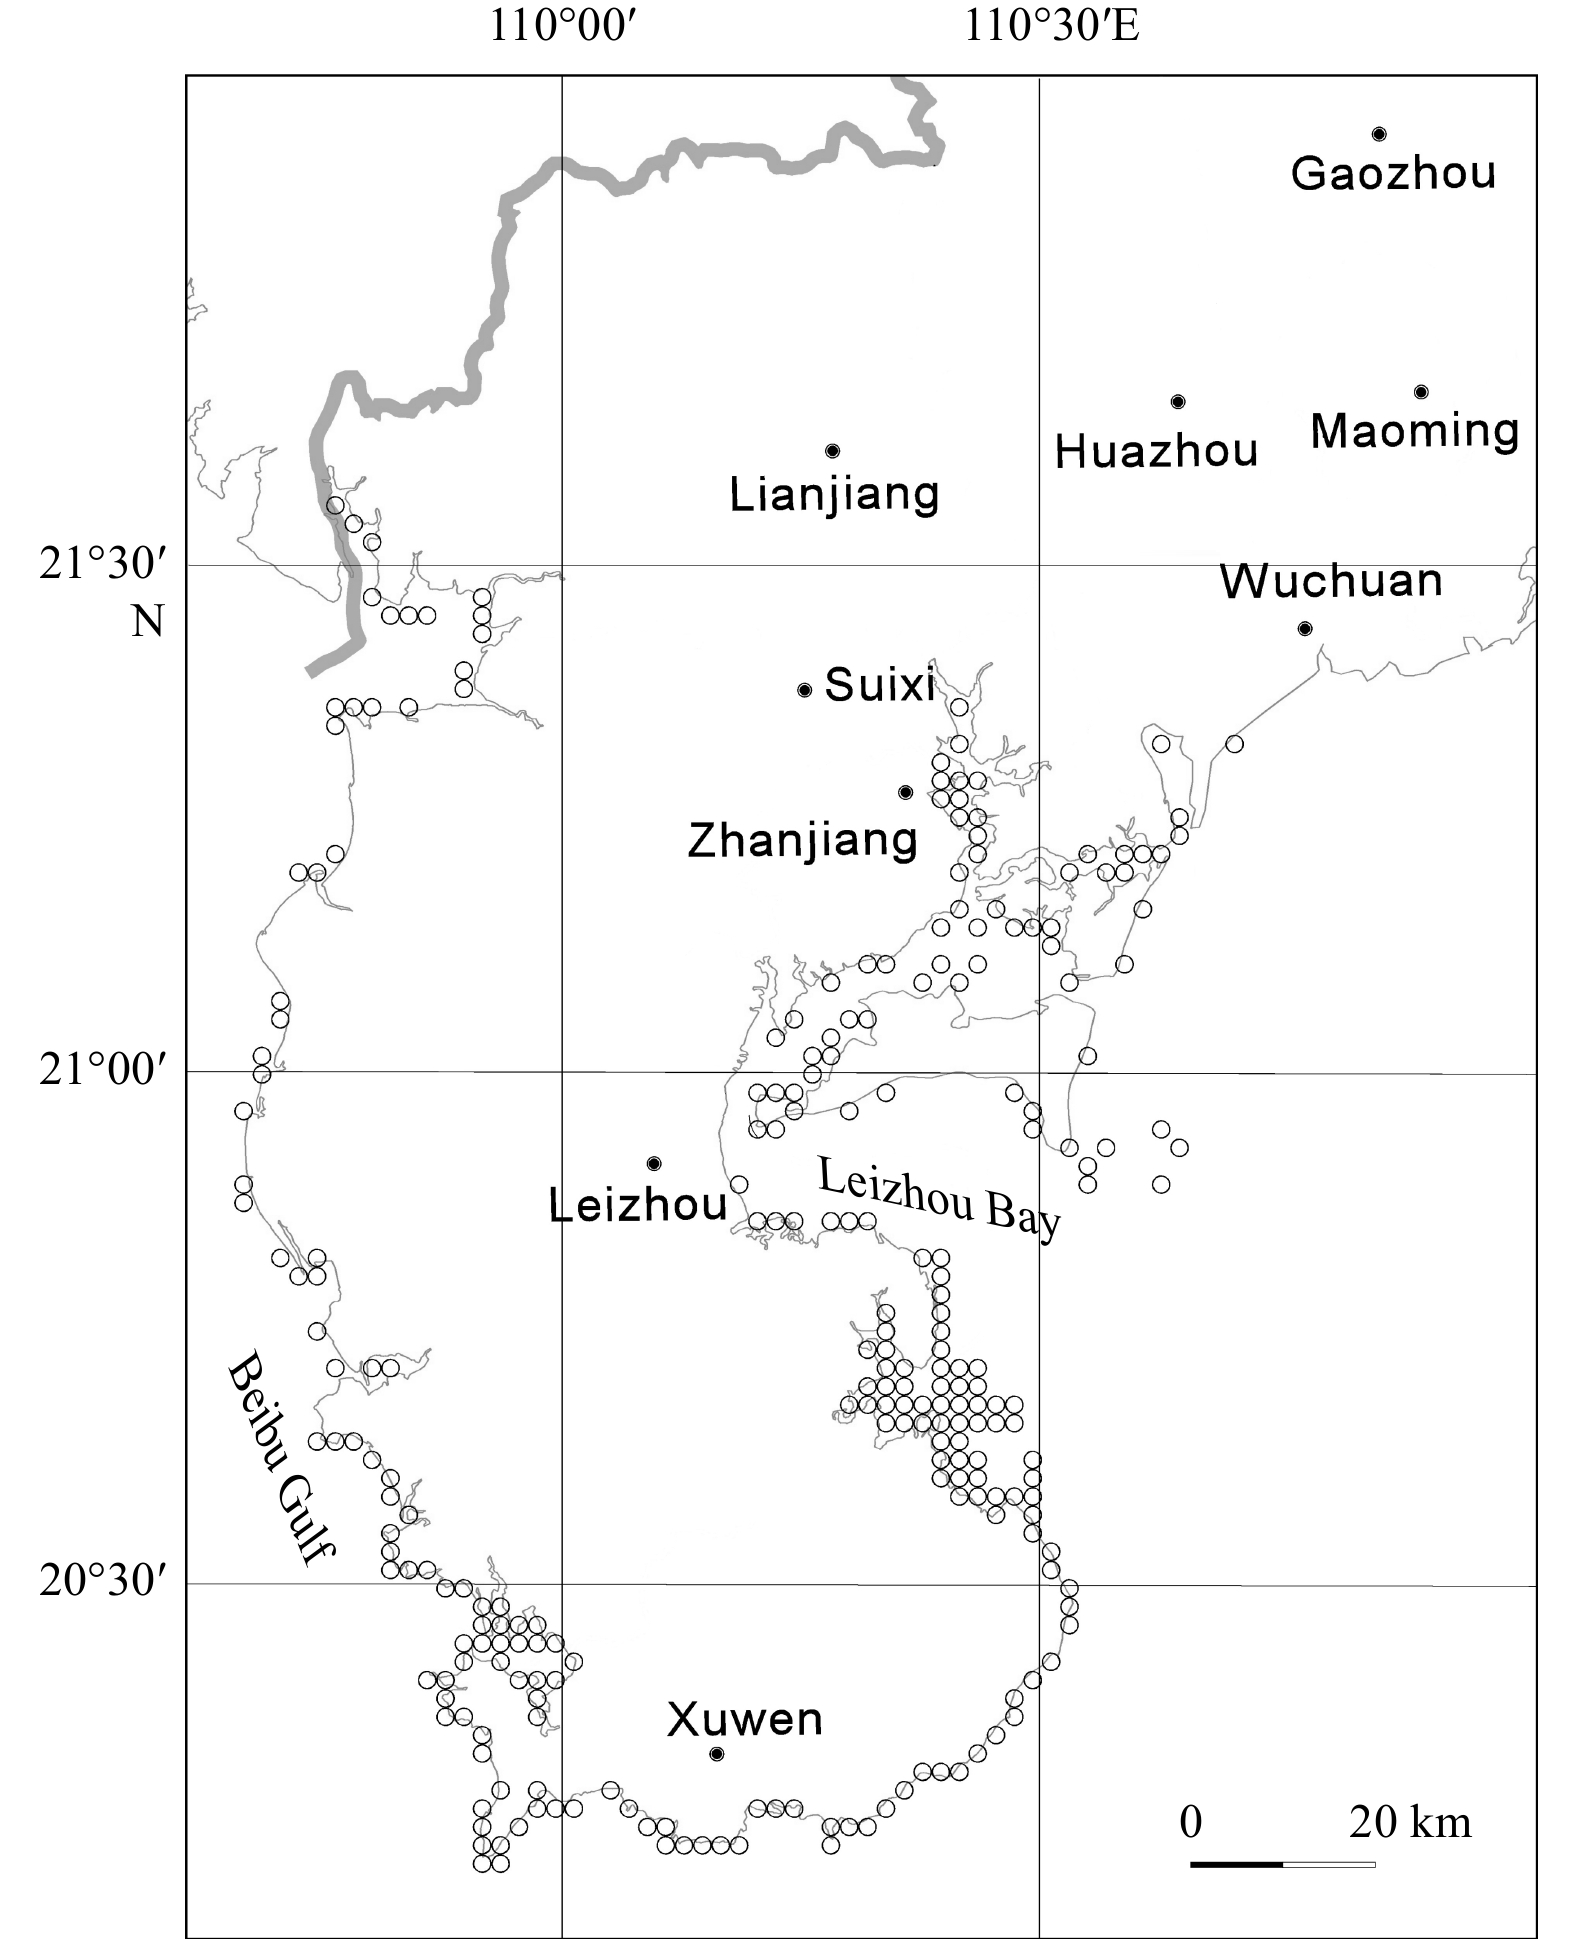
Map of the Leizhou Peninsula and the sampling points in this study (blank circles).
| Citation: | Tingting Li, Lili Jia, Xin Zhu, Min Xu, Xinchang Zhang. Distribution and risk assessment of heavy metals in surface sediments of coastal mudflats on Leizhou Peninsula, China[J]. Acta Oceanologica Sinica, 2023, 42(1): 25-34. doi: 10.1007/s13131-022-2101-6

|
Mudflats are found in the tidal zone where strong land-sea interactions exist. They are influenced by multiple factors such as tides, waves, rivers, geological formations, and climate change, and play a vital role in maintaining the dynamic balance between sea and land. The mudflat environmental changes are closely related to coastal economic development and social progress, and have a big significance in maintaining regional and global ecosystem balance (Bastami et al., 2014; Cui et al., 2016; Gao and Chen, 2012; Kulkarni et al., 2018). Mudflats are also the primary sources, sinks, and converters of various pollutants, playing a critical role in the prevention and control of water pollution as well as elemental cycling (Gao and Li, 2012; Wang et al., 2013; Wu et al., 2014).
Environmental pollution has led to increasing degradation of ecosystem service functions in coastal mudflat wetlands. As typical cumulative pollutants, heavy metal elements have substantial biological toxicity and pose persistent threats to human health and the ecological environment (Cai et al., 2003, 2019a, b; Tang et al., 2008; Chen et al., 2015; Zhang et al., 2019; Wang et al., 2020). In 1986, China conducted the first national survey of coastal zone and seabed resources (Xi, 2004). Since 2002, the China Geological Survey has conducted environmental geochemical studies of heavy metals in various media such as soil, rock, sediment, and atmospheric fallout on a national scale (Xi, 2007). This has also involved the study of heavy metals in the coastal zone (Xi, 2005). The State Oceanic Administration of China conducted a special study on the pre-evaluation of an offshore marine comprehensive survey, which covered the investigation of heavy metals in offshore sediments (Jiang et al., 2015; Chai et al., 2019; Huang et al., 2020). However, these previous studies were national large-scale survey studies, which have the shortcomings of fewer samples and lack of representativeness. Lacking of sufficient studies on hotspot areas could not well support the reasonable exploitation and ecological protection of local mudflats.
The Leizhou Peninsula is surrounded by sea on three sides. Its 1 556 km long coastline ranks the first among prefecture-level cities in China, accounting for 46% of the coastline of Guangdong Province and 10% of that for the country (Fig. 1). Offshore mudflats are rich in resources. The area of mudflats that can soon be exploited is 99.56×10⁴ km2, accounting for about 48% of the province and 5% of the country. The development of mudflats has prompted a new boom in land development. Irrational development could destroy and waste resources, cause ecological degradation, and hinder or destroy the productivity of the mudflat system. It is of foremost importance to study and explore the rational development and utilization of seabed resources to promote the harmonious development of society, economy, and the environment in coastal areas. However, research on the mudflats of the Leizhou Peninsula has been restricted to small areas and limited numbers of organic pollutants. Systematic research on the overall regional geochemical characteristics and the changing geochemical patterns of hazardous elements is lacking (Zhang et al., 2012; Gan et al., 2013; Li et al., 2014; Yang et al., 2020). The study of environmental geochemistry in the Leizhou Peninsula coastal mudflats is beneficial for promoting the local ecological and sustainable development, and can provide an effective basis for the development and utilization of mudflat resources.
The aim of this study is to understand the characteristics, sources, and pollution risks of six heavy metals (As, Cd, Cr, Cu, Hg, and Pb) in surface sediments of the coastal mudflats on Leizhou Peninsula. The study is based upon the following hypotheses: (1) concentrations of the selected heavy metals are low; (2) these heavy metals are derived from similar sources; (3) anthropogenic influences on the presence of the analyzed heavy metals are minimal. To test these hypotheses, surface sediment samples are studied using mathematical statistics, correlation analysis, and factor analysis.
The Leizhou Peninsula, located at the intersection of Guangdong, Guangxi, and Hainan provinces, is in the southernmost part of mainland China and the southwestern part of Guangdong Province (Fig. 1). It is surrounded by the South China Sea to the east, the Qiongzhou Strait to the south, and the Beibu Gulf to the west. The geographical coordinates are 20°12′N to 21°55′N, 109°39′E to 110°57′E. The administrative area covers three cities, two counties, and four districts, with a total population of 7.14 million. Xuwen coastal mudflats are wide and flat with an available farming area of 130 km2, equivalent to 18% of the county’s arable land area. The intertidal area covers 169.7 km2, of which 145.3 km2 is mangrove, 66.5 km2 can be cultured and 51.5 km2 can be cultured at the 10 m isobaths, which is a unique condition for the development of mariculture. In addition, Leizhou City is rich in salt resources, owing to its long coastline, abundant sunshine, warm temperatures, and high evaporation. These features provide unique resource advantages for the development of the salt industry.
Sample collection was conducted according to the Specification for Multi-Target Regional Geochemical Surveys (Ministry of Land and Resources of the People's Republic of China, 2015). Sampling depths were 0–20 cm and original sample weights were greater than 1 000 g. To avoid cross-contamination, each sample was packed in a sealed polyethylene bag and stored frozen in a cooler for transport to the laboratory for analysis. We collected 257 samples from the study area (Fig. 1).
Samples were analyzed by the Guangdong Geological Experimental Testing Center. The samples were fully dried in a <45℃ constant temperature drying oven. After drying, they were crushed by a non-polluting corundum disc machine, ground, and washed with quartz sand and samples to be processed before the next sample processing batch. Samples were sieved (200 mesh sieve) to retain particle sizes ≤0.074 mm. Processed and qualified samples were divided into separate aliquots according to the requirements of the planned analytical methods.
Cd and Pb were analyzed by inductively coupled plasma mass spectrometry (ICP-MS) with a Nexion 300X instrument. The samples were weighed to 0.2500 g in a polytetrafluoroethylene crucible, decomposed with HCl-HNO3-HF-HClO4, heated in sections on an electric heating plate until the white smoke was exhausted, boiled with 5 mL double dilution (1+1) of aqua regia, cooled and fixed in a 25 mL plastic cuvette, and diluted 10 times. The final concentration was determined by direct reading of ICP-MS with Rh as the internal standard.
Cr and Cu were analyzed by ionophore spectrometry (ICP-OES) with Optima 8300DV. The sample was weighed to 0.2500 g in a polytetrafluoroethylene crucible, decomposed with HCl-HNO3-HF-HClO4, heated in sections on an electric heating plate until the white smoke was exhausted, boiled with 5 mL (1+1) aqua regia, cooled and fixed in a 25 mL plastic cuvette, shaken well, and the ICP-OES concentration was determined by direct reading.
As and Hg were analyzed by atomic fluorescence spectrometry (AFS) using an AFS-XGY-1011A. The sample was weighed to 0.2500 g in a plastic colorimetric tube, decomposed in an (1+1) aqua regia water bath, fixed to 25 mL, reduced by potassium borohydride, and the concentration determined by cold atomic fluorescence (AFS) for Hg. For As, the sample solution was divided and reduced by thiourea-ascorbic acid, hydrogenated by potassium borohydride, and the concentration determined by hydride atomic fluorescence (HG-AFS).
The enrichment factor method is widely used to study and identify heavy metal pollution sources and distinguish between natural and anthropogenic contributions. However, its background value selection is particularly important. In this study, the elemental content in the soil of Leizhou Peninsula was used as its reference element background value (Hanson, 2013; Costa-Böddeker et al., 2017; Pignotti et al., 2018). As the same with many previous studies, Al (Al2O3) was selected as the reference element. The EF was calculated according to Eq. (1):
| $$ {\rm{EF}}=\left[\frac{{C}_{n}/{C}_{{\rm{Al}}}}{{B}_{n}/{B}_{{\rm{Al}}}}\right] , $$ | (1) |
where, Cn is the heavy metal element of the sample concentration (mg/kg), CAl is the sample Al (Al2O3) concentration (%); Bn is the reference heavy metal element concentration (mg/kg), and BAl is the reference Al (Al2O3) concentration (%).
It is generally accepted that EF<0.5 indicates no or zero contamination. When 0.5<EF≤1.5, there is no or weak contamination, indicating that trace metals are mainly from crustal contribution. Moderate contamination is indicated when 1.5<EF≤5, and trace metals are mostly provided by non-crustal sources. When 5<EF≤20, there is significant contamination, indicating a greater anthropogenic influence. When EF>20, samples are highly contaminated, indicating a high degree of anthropogenic contamination (Liu et al., 2014).
In 1980, the Swedish scholar Hakanson proposed the potential ecological risk index method (Hakanson, 1980) (Table 1). The potential risk caused by water pollution is mainly influenced by four factors: heavy metal concentration in sediment, metal pollutant species, metal toxicity level, and the sensitivity of water bodies to metal pollution (Sadiq et al., 2003; Wang et al., 2016, 2019). The calculation method is as follows:
| Er | RI | |||
| Grading criteria | Ecological risk level | Grading criteria | Ecological risk level | |
| Er<40 | low | RI<150 | low | |
| 40≤Er<80 | moderate | 150≤RI<300 | moderate | |
| 80≤Er<160 | high | 300≤RI<600 | high | |
| 160≤Er<320 | very high | RI≥600 | very high | |
| Er≥320 | extremely high | |||
| Note: Er: ecological risk; RI is the combined potential ecological pollution index. | ||||
 DownLoad:
CSV
DownLoad:
CSV
| $$ {{C}_{{\rm{f}}}}^{i} = {{C}_{{\rm{s}}}}^{i} / {{C}_{{\rm{n}}}}^{i}, $$ | (2) |
| $$ {\rm{Er}}^i= {{\rm{T}}_{\rm{r}}}^{i}\cdot {{C}_{{\rm{f}}}}^{i}, $$ | (3) |
| $$ {\rm{RI}}= \sum {\rm{Er}}^i=\sum {{\rm{T}}_{\rm{r}}}^{i}\cdot {{C}_{{\rm{f}}}}^{i} , $$ | (4) |
where
We can see that in the Leizhou Peninsula mudflat surface sediments, the concentration of As element ranges from 0.48 μg/g to 21.90 μg/g, with an average concentration of 5.34 μg/g. Concentration of As decreases according to the following order: Lianjiang City, Zhanjiang City, Xuwen County, Leizhou City, Suixi County, and Wuchuan City. The As concentration in Lianjiang City is the greatest, with a mean value of 8.33 μg/g, higher than that of East China coastal mudflat surface sediments. The concentration of As is lower than the limit value of the marine sediment quality class I standard. However, there are individual points in Zhanjiang City, and the concentration range is between Marine Sediment Standards I−II (Figs 2 and 3) (Table 2).


| Area | Parameter | As/(μg·g−1) | Cd/(μg·g−1) | Cr/(μg·g−1) | Cu/(μg·g−1) | Hg/(ng·g−1) | Pb/(μg·g−1) |
| All region | mean value | 5.34 | 0.055 | 57.40 | 14.39 | 0.021 | 14.92 |
| range | 0.48−21.90 | 0.004−1.22 | 0.76−309.00 | 0.13−102.00 | 0.002−0.130 | 2.80−69.50 | |
| Suixi County | mean value | 3.72 | 0.06 | 17.07 | 5.45 | 0.020 | 14.71 |
| range | 0.78−6.05 | 0.02−0.30 | 0.85−62.70 | 0.83−26.00 | 0.002−0.029 | 2.80−69.50 | |
| Leizhou City | mean value | 4.93 | 0.04 | 65.56 | 15.52 | 0.020 | 12.01 |
| range | 0.67−14.00 | 0.004−0.16 | 0.88−309.00 | 0.13−85.20 | 0.003−0.099 | 2.80−42.50 | |
| Xuwen County | mean value | 5.25 | 0.05 | 77.09 | 19.53 | 0.020 | 13.13 |
| range | 0.48−18.90 | 0.02−0.09 | 4.70−298.00 | 1.15−102.00 | 0.002−0.110 | 4.50−30.10 | |
| Zhanjiang City | mean value | 5.92 | 0.04 | 35.36 | 8.82 | 0.020 | 18.07 |
| range | 0.71−21.90 | 0.02−0.15 | 0.76−170.00 | 0.78−52.20 | 0.002−0.130 | 4.40−56.90 | |
| Lianjiang City | mean value | 8.33 | 0.29 | 37.14 | 11.40 | 0.040 | 31.01 |
| range | 1.52−19.10 | 0.04−1.22 | 4.18−76.30 | 3.55−19.80 | 0.010−0.076 | 8.60−61.30 | |
| Wuchuan City | mean value | 2.96 | 0.03 | 9.30 | 2.95 | 0.004 | 13.98 |
| range | 0.81−4.94 | 0.02−0.04 | 5.06−14.70 | 1.87−4.30 | 0.003−0.006 | 7.20−20.10 | |
| East China coastal mudflats (Zhang et al., 2017) | mean value | 8.11 | 0.09 | 70.03 | 18.90 | 0.030 | 23.05 |
| range | 1.10−27.20 | 0.02−1.43 | 4.20−230.00 | 2.90−370.00 | 0.010−0.580 | 0.50−85.80 | |
| Marine sediment standards I-II-III (General Administration of Quality Supervision, Inspection and Quarantine of the People’s Republic of China, 2004) | limited value | 20−65−93 | 0.5−1.5−5.0 | 80−150−270 | 35−100−200 | 0.2−0.5−1.0 | 60−130−250 |
DownLoad:
CSV
The concentration of elemental Cd ranges from 0.004 μg/g to 1.22 μg/g, with an average value at 0.055 μg/g. The Cd concentration in Suixi County is 0.06 μg/g and slightly higher than the regional average. This is near the average concentration of elemental Cd in the upper continental crust (UCC), mainly as a result of the weathering of regional rocks. The average concentration of elemental Cd in the remaining municipalities (counties) was lower than the marine sediment quality Standard I. There is only one point in Lianjiang City where the concentration range is between Marine Sediment Standards I and II.
The elemental Cr concentration ranges from 0.76 μg/g to 309 μg/g, with an average of 57.40 μg/g. Among them, the lowest average Cr concentration (9.30 μg/g) is found in Wuchuan City. The highest average Cr concentration is from Xuwen County, and exceeds the standard limit value of marine sediment quality of elemental Cr Standard III, indicating a certain indication of pollution. The average concentration of elemental Cr in Leizhou Peninsula is slightly higher than the average concentration in the East China coastal mudflats.
The average Cu concentration ranges from 0.13 μg/g to 102 μg/g, with an average of 14.39 μg/g. The average Cu concentration is the lowest (2.95 μg/g) in Wuchuan City. Elevated concentrations are noted in Xuwen County, Leizhou City, and Zhanjiang City. The coastal mudflats of Xuwen County demonstrate the highest average Cu concentration at 19.53 μg/g. It is higher than the average Cu concentration in coastal mudflats and UCC in East China, and near the limits of the national marine sediment environmental quality Cu Standard I.
The elemental Hg concentration ranges from 0.002 ng/g to 0.130 ng/g, with an average of 0.021 ng/g. The surface sediments of Lianjiang City coastal mudflats contain the highest average Hg concentration at 0.040 ng/g. The average Hg concentration found in the coastal mudflats for all of the cities and counties in the study area is low, and none exceeded the national environmental quality standards for marine sediments element Hg Standard I.
The elemental Pb concentration ranges from 2.80 μg/g to 69.50 μg/g, with an average of 14.92 μg/g. Leizhou City has the lowest average Pb concentration (12.01 μg/g), while Lianjiang City has the highest average concentration (31.01 μg/g). The concentrations are higher than those of the East China coastal mudflat sediments.
The SPSS Pearson correlation analysis was used to correlate the heavy metals in the surface mudflat sediments of the coastal cities and counties in Leizhou Peninsula. The correlations of each city (county) existed at the p<0.01 and p<0.05 levels, indicating that the heavy metals in the surface mudflat sediments of each province have some similar sources.
The loadings of heavy metal elements for each principal factor were obtained by principal component analysis and orthogonal rotation with great variance for the surface sediments from the beaches in each city (county) of the Leizhou Peninsula (Table 3). The percentages of eigenvalues for each principal factor showed that the first two principal factors have accounted for 83.3% of the total information of the correlation between variables.
| Leizhou City | Lianjiang City | Suixi County | Wuchuan City | Xuwen County | Zhanjiang City | |||||||||
| F1 | F2 | F1 | F1 | F1 | F2 | F1 | F2 | F1 | ||||||
| As | 0.680 | 0.612 | 0.938 | 0.987 | 0.935 | 0.071 | 0.571 | 0.708 | 0.861 | |||||
| Cd | 0.870 | −0.026 | 0.815 | 0.969 | 0.686 | 0.633 | 0.859 | 0 | 0.805 | |||||
| Cr | 0.899 | −0.279 | 0.952 | 0.994 | 0.954 | 0.183 | 0.909 | −0.159 | 0.923 | |||||
| Cu | 0.888 | −0.348 | 0.977 | 0.992 | 0.910 | 0.033 | 0.858 | −0.405 | 0.922 | |||||
| Hg | 0.847 | −0.265 | 0.983 | 0.997 | −0.083 | 0.900 | 0.822 | −0.297 | 0.857 | |||||
| Pb | 0.728 | 0.538 | 0.980 | 0.993 | 0.657 | 0.677 | 0.627 | 0.529 | 0.915 | |||||
| Eigenvalue | 4.046 | 0.934 | 5.331 | 5.865 | 4.022 | 1.209 | 3.679 | 1.059 | 4.663 | |||||
| Eigenvalue percentage/% | 67.729 | 15.566 | 88.849 | 97.745 | 67.039 | 20.154 | 61.617 | 17.650 | 77.720 | |||||
DownLoad:
CSV
Tables 3 and 4 show that the analyzed six heavy metal elements from Leizhou City coastal surface mudflat sediments represent 83.3% of the information according to the two principal component eigenvalues response. The contribution of the first principal component is 67.73%, which indicates that the factor variables have high positive loadings on the concentrations of Cr, Cd, Cu, and Hg. Because there is a pronounced positive correlation between these four toxic metals, their sources may be the same. The contribution of the second principal component is 15.57%. The variables included in this factor are As and Pb. Among them, the correlation coefficients of As and other elements are less than 0.49, indicating a relatively weak symbiotic relationship. Pb shows a substantial negative correlation with other elements.
| As | Cd | Cr | Cu | Hg | Pb | ||
| Leizhou City | As | 1 | −0.136 | 0.492** | 0.427** | 0.383** | −0.010 |
| Cd | 1 | −0.245* | −0.152 | 0.700** | 0.014 | ||
| Cr | 1 | 0.905** | 0.762** | −0.078 | |||
| Cu | 1 | 0.752** | −0.156 | ||||
| Hg | 1 | −0.167 | |||||
| Pb | 1 | ||||||
| Lianjiang City | As | 1 | −0.310 | 0.946** | 0.902** | 0.896** | 0.454* |
| Cd | 1 | −0.366 | −0.386 | 0.818** | −0.003 | ||
| Cr | 1 | 0.962** | 0.910** | 0.441* | |||
| Cu | 1 | 0.944** | 0.425 | ||||
| Hg | 1 | 0.984** | |||||
| Pb | 1 | ||||||
| Suixi County | As | 1 | −0.146 | 0.958** | 0.906** | 0.980** | 0.551** |
| Cd | 1 | −0.224 | −0.147 | 0.950** | 0.186 | ||
| Cr | 1 | 0.946** | 0.996** | 0.579** | |||
| Cu | 1 | 0.995** | 0.525** | ||||
| Hg | 1 | 0.991** | |||||
| Pb | 1 | ||||||
| Wuchuan City | As | 1 | −0.440 | 0.856** | 0.846** | 0.066 | 0.552* |
| Cd | 1 | −0.704** | −0.483 | 0.369 | −0.651** | ||
| Cr | 1 | 0.869** | 0.110 | 0.748** | |||
| Cu | 1 | 0.064 | 0.575* | ||||
| Hg | 1 | 0.427 | |||||
| Pb | 1 | ||||||
| Xuwen County | As | 1 | 0.523** | 0.433** | 0.234* | 0.217* | 0.510** |
| Cd | 1 | −0.052 | −0.044 | 0.221* | 0.409** | ||
| Cr | 1 | 0.890** | −0.114 | 0.466** | |||
| Cu | 1 | −0.101 | 0.312** | ||||
| Hg | 1 | 0.435** | |||||
| Pb | 1 | ||||||
| Zhanjiang City | As | 1 | 0.584** | 0.709** | 0.729** | 0.638** | 0.886** |
| Cd | 1 | −0.075 | −0.082 | 0.593** | 0.667** | ||
| Cr | 1 | 0.918** | −0.172 | 0.819** | |||
| Cu | 1 | −0.183 | 0.748** | ||||
| Hg | 1 | 0.706** | |||||
| Pb | 1 | ||||||
| Note: ** indicates a significant correlation at the 0.01 level; * indicates a significant correlation at the 0.05 level. | |||||||
DownLoad:
CSV
The six analyzed heavy metals in Lianjiang City comprise 88.8% of the information according to one principal component eigenvalue response. The high factor loading and good correlation indicate that the heavy metals in the mudflat surface sediments of the region are closely co-occurring and have similar geochemical behavior characteristics.
The six analyzed heavy metals in Suixi County comprise 97.7% of the information according to one principal component eigenvalue response. All elements have high positive loadings and good correlations, indicating that they are of the same origin.
The six analyzed heavy metals in Wuchuan City represent 87.2% of the information according to two principal component eigenvalues responses. The contribution of the first principal component is 67.04%, indicating that the factor variables have high positive loadings on Cu, As, and Cr concentrations. These three toxic metals are significantly and positively correlated with each other and have homology. The contribution of the second principal component is 20.15%. This factor contained variables such as Hg and Cr, which may mainly originate from industrial wastewater.
The six analyzed heavy metals in Xuwen County comprise 89.3% of the information according to two principal component eigenvalues. The contribution of the first principal component is 61.62%, suggesting that the factor variables have high positive loadings on the contents of Cd, Cr, Cu, and Hg. Because there are significant positive correlations among these four toxic metals, they may have the same source. The contribution of the second principal component is 17.65%. The variables included in this factor are As and Pb, which have good correlations and are closely co-occurring. However, the factor loading for Cd in the second principal component is 0. This indicates that the source of Cd is different from the other analyzed toxic metals and requires further study.
The six analyzed heavy metals in Zhanjiang City comprise 77.72% of the information according to one principal component eigenvalue response. All six elements have high positive loadings and good correlations, indicating that these elements are closely symbiotic and of the same origin.
According to the EF formula, the EF values of heavy metals in the surface sediments of coastal mudflats in each city and county of Leizhou Peninsula are calculated. The anthropogenic influence on heavy metals in Leizhou Peninsula coastal mudflat surface sediments may be arranged in increasing order as: Hg, Cu, Cr, Pb, Cd, and As (Table 5).
| As | Cd | Cr | Cu | Hg | Pb | |
| Leizhou City | 4.53 | 2.52 | 2.65 | 2.06 | 0.70 | 2.34 |
| Lianjiang City | 1.90 | 3.44 | 0.66 | 0.78 | 0.51 | 1.59 |
| Suixi County | 4.43 | 4.11 | 1.38 | 1.49 | 0.75 | 3.30 |
| Wuchuan City | 4.25 | 2.00 | 1.03 | 1.19 | 0.25 | 3.52 |
| Xuwen County | 4.83 | 1.95 | 2.96 | 2.27 | 0.65 | 2.30 |
| Zhanjiang City | 4.95 | 2.78 | 1.59 | 1.53 | 0.64 | 3.17 |
DownLoad:
CSV
The EF values for Hg range from 0.5 to 1.5, indicating that Hg in the surface sediments mainly comes from crustal contributions rather than pollution sources. The Cr and Cu EF values in Lianjiang City also range from 0.5 to 1.5, indicating that the coastal mudflats of Lianjiang City are not contaminated by Cr and Cu. The As, Cd, Cr, Cu, and Pb EF values in the remaining cities and counties are between 1.5 and 5. These values represent moderate levels of pollution, indicating that the presence of these five heavy metals is affected to some extent by human activities. Among them, the As EF values in Zhanjiang City are the greatest, approaching the lower limits of significant pollution, followed by those in Xuwen County, Leizhou City, Suixi County, and Wuchuan City. The EF values for Cd in the Suixi County are elevated and near the lower limit value for significant pollution. This means that As pollution in coastal mudflat surface sediments of Xuwen County, Leizhou City, Suixi County, and Wuchuan City is more serious than that of other heavy metal elements, and Cd pollution is more serious in coastal mudflat surface sediments of Suixi County. This may be related to the rapid development of the introduction of industrial projects (Vane et al., 2009).
Based on the results of the combined-factor potential ecological risk parameter RI, the ecological risk posed by the six analyzed heavy metals to the mudflat of Leizhou Peninsula decreases according to the following order: Cd, As, Hg, Pb, Cu, and Cr. The Eri values of As, Cu, Pb, Cr, and Hg range from 0.46 to 24.64 (all less than 40), indicating that all five heavy metals are of low ecological risk. The Eri of Cd is 43.09 (between 40 and 80), indicating that it is of moderate ecological risk. The Eri values of Cd in Lianjiang City are between 80 and 160, which represents a high ecological risk requiring further attention. In terms of the overall potential ecological risk index RI, the RI value in Lianjiang City is greater than 150 owing to the high contribution of Cd, showing a moderate ecological risk. The RI values in the rest of the cities and counties in the study area are less than 150, indicating low ecological risk. The evaluation of potential ecological risk indicates that the surface sediments of coastal mudflats in Lianjiang City are of moderate ecological risk, while the surface sediments of coastal mudflats in other cities and counties within the study area remain at levels of low ecological risk (Fig. 4, Table 6).

| Eri | RI | Grade | ||||||
| As | Cd | Cr | Cu | Hg | Pb | |||
| Leizhou City | 14.60 | 22.44 | 3.22 | 6.47 | 12.29 | 3.73 | 62.76 | low |
| Lianjiang City | 24.64 | 145.02 | 1.82 | 4.75 | 24.40 | 9.63 | 210.26 | moderate |
| Suixi County | 11.02 | 30.36 | 0.84 | 2.27 | 10.40 | 4.57 | 59.45 | low |
| Wuchuan City | 8.75 | 14.54 | 0.46 | 1.23 | 2.27 | 4.34 | 31.58 | low |
| Xuwen County | 15.52 | 25.06 | 3.79 | 8.14 | 13.84 | 4.08 | 70.43 | low |
| Zhanjiang City | 17.52 | 21.09 | 1.74 | 3.68 | 13.51 | 5.61 | 63.14 | low |
| Average | 15.34 | 43.09 | 1.98 | 4.42 | 12.79 | 5.33 | − | − |
| Note: − represents no data. | ||||||||
DownLoad:
CSV
The overall concentrations of the six analyzed heavy metals (As, Cd, Cr, Cu, Hg, and Pb) in Leizhou Peninsula coastal mudflat surface sediments remain within acceptable regulatory limits. However, there are local points of elevated concentrations, indicating anthropogenic pollution.
Based on the concentrations of the six analyzed heavy metals, surface sediments of coastal mudflats on Leizhou Peninsula have some similar sources. However, the combinations of these heavy metal concentrations vary. The decreasing order of anthropogenic influence is determined to be As, Cd, Pb, Cr, Cu, and Hg. The presence of Hg is attributed primarily to crustal contributions rather than pollution sources. Similarly, the presence of Cr and Cu in Lianjiang City coastal mudflat surface sediments is also mainly from natural rather than pollution sources. The EF values for As, Cd, Cr, Cu, and Pb in the surface sediments of coastal mudflats from the remaining cities (counties) in the study area are between 1.5 and 5 (moderate pollution), indicating that the occurrence of these heavy metals is influenced by human activities.
According to the potential ecological risk index method, the ecological risk of the six analyzed heavy metals to the beaches of Leizhou Peninsula may be arranged in decreasing order as: Cd, As, Hg, Pb, Cu, and Cr. Concentrations of Cd in the surface sediments of coastal beaches of Lianjiang City indicate a high ecological risk and warrant further attention. However, the concentrations of the other analyzed metals in surface sediments of coastal beaches from other cities and counties in the study area pose only a low ecological risk.
Next, we will carry out eco-geochemical research in areas with high ecological risk. The purpose of the further work is to identify the migration and transformation pathways of heavy metal elements between water, sediment and organisms. We will also use isotopic dating and mineralogy to study the source and adsorption mechanism of heavy metals. We will also propose ecological effect evaluation, development trend prediction, and ecological hazard warning for the sustainable economic and social development of the study area.
Acknowledgements: We thank the staff of the geochemical investigation team of basic farmland in the lower reaches of the Pearl River of Guangdong Geological Survey Institute for their efforts.|
Bastami K D, Bagheri H, Kheirabadi V, et al. 2014. Distribution and ecological risk assessment of heavy metals in surface sediments along southeast coast of the Caspian Sea. Marine Pollution Bulletin, 81(1): 262–267. doi: 10.1016/j.marpolbul.2014.01.029
|
|
Cai Lizhe, Tam N F Y, Wong T W Y, et al. 2003. Using benthic macrofauna to assess environmental quality of four intertidal mudflats in Hong Kong and Shenzhen Coast. Acta Oceanologica Sinica, 22(2): 309–319
|
|
Cai Limei, Wang Qiushuang, Luo Jie, et al. 2019a. Heavy metal contamination and health risk assessment for children near a large Cu-smelter in central China. Science of the Total Environment, 650: 725–733. doi: 10.1016/j.scitotenv.2018.09.081
|
|
Cai Limei, Wang Qiushuang, Wen Hanhui, et al. 2019b. Heavy metals in agricultural soils from a typical township in Guangdong Province, China: Occurrences and spatial distribution. Ecotoxicology and Environmental Safety, 168: 184–191. doi: 10.1016/j.ecoenv.2018.10.092
|
|
Chai Mingwei, Ding Huan, Shen Xiaoxue, et al. 2019. Contamination and ecological risk of polybrominated diphenyl ethers (PBDEs) in surface sediments of mangrove wetlands: A nationwide study in China. Environmental Pollution, 249: 992–1001. doi: 10.1016/j.envpol.2019.02.044
|
|
Chen Haiyang, Teng Yanguo, Lu Sijin, et al. 2015. Contamination features and health risk of soil heavy metals in China. Science of the Total Environment, 512–513: 143–153
|
|
Costa-Böddeker S, Hoelzmann P, Thuyên L X, et al. 2017. Ecological risk assessment of a coastal zone in Southern Vietnam: Spatial distribution and content of heavy metals in water and surface sediments of the Thi Vai Estuary and Can Gio Mangrove Forest. Marine Pollution Bulletin, 114(2): 1141–1151. doi: 10.1016/j.marpolbul.2016.10.046
|
|
Cui Baoshan, He Qiang, Gu Binhe, et al. 2016. China’s coastal wetlands: understanding environmental changes and human impacts for management and conservation. Wetlands, 36(1): 1–9. doi: 10.1007/s13157-015-0709-4
|
|
Gan Huayang, Lin Jinqin, Liang Kai, et al. 2013. Selected trace metals (As, Cd and Hg) distribution and contamination in the coastal wetland sediment of the northern Beibu Gulf, South China Sea. Marine Pollution Bulletin, 66(1–2): 252–258
|
|
Gao Xuelu, Chen Chen-Tung Arthur. 2012. Heavy metal pollution status in surface sediments of the coastal Bohai Bay. Water Research, 46(6): 1901–1911. doi: 10.1016/j.watres.2012.01.007
|
|
Gao Xuelu, Li Peimiao. 2012. Concentration and fractionation of trace metals in surface sediments of intertidal Bohai Bay, China. Marine Pollution Bulletin, 64(8): 1529–1536. doi: 10.1016/j.marpolbul.2012.04.026
|
|
General Administration of Quality Supervision, Inspection and Quarantine of the People's Republic of China. 2004. GB 18668-2002 Marine sediment quality (in Chinese). Beijing: Standards Press of China, 1–245
|
|
Hakanson L. 1980. An ecological risk index for aquatic pollution control. A sedimentological approach. Water Research, 14(8): 975–1001. doi: 10.1016/0043-1354(80)90143-8
|
|
Hasan A B, Kabir S, Reza A H M S, et al. 2013. Enrichment factor and geo-accumulation index of trace metals in sediments of the ship breaking area of Sitakund Upazilla (Bhatiary-Kumira), Chittagong, Bangladesh. Journal of Geochemical Exploration, 125: 130–137. doi: 10.1016/j.gexplo.2012.12.002
|
|
Huang Chong, Zhang Chenchen, Liu Qingsheng, et al. 2020. Land reclamation and risk assessment in the coastal zone of China from 2000 to 2010. Regional Studies in Marine Science, 39: 101422. doi: 10.1016/j.rsma.2020.101422
|
|
Jiang Tingting, Pan Jinfen, Pu Xinming, et al. 2015. Current status of coastal wetlands in China: Degradation, restoration, and future management. Estuarine, Coastal and Shelf Science, 164: 265–275
|
|
Kulkarni R, Deobagkar D, Zinjarde S. 2018. Metals in mangrove ecosystems and associated biota: A global perspective. Ecotoxicology and Environmental Safety, 153: 215–228. doi: 10.1016/j.ecoenv.2018.02.021
|
|
Li Feng, Lin Jinqin, Liang Yanyan, et al. 2014. Coastal surface sediment quality assessment in Leizhou Peninsula (South China Sea) based on SEM-AVS analysis. Marine Pollution Bulletin, 84(1–2): 424–436
|
|
Liu Jinling, Wu Hao, Feng Jianxiang, et al. 2014. Heavy metal contamination and ecological risk assessments in the sediments and zoobenthos of selected mangrove ecosystems, South China. Catena, 119: 136–142. doi: 10.1016/j.catena.2014.02.009
|
|
Ministry of Land and Resources of the People’s Republic of China. 2015. DZ/T 0258-2014 Specification of multi-purpose regional geochemical survey (1: 250 000) (in Chinese). Beijing: Standards Press of China, 1–45
|
|
Pignotti E, Guerra R, Covelli S, et al. 2018. Sediment quality assessment in a coastal lagoon (Ravenna, NE Italy) based on SEM-AVS and sequential extraction procedure. Science of the Total Environment, 635: 216–227. doi: 10.1016/j.scitotenv.2018.04.093
|
|
Sadiq R, Husain T, Bose N, et al. 2003. Distribution of heavy metals in sediment pore water due to offshore discharges: an ecological risk assessment. Environmental Modelling & Software, 18(5): 451–461
|
|
Tang Yijie, Fang Zhanqiang, Yu Shixiao. 2008. Heavy metals, polycyclic aromatic hydrocarbons and organochlorine pesticides in the surface sediments of mangrove swamps from coastal sites along the Leizhou Peninsula, South China. Acta Oceanologica Sinica, 27(1): 42–53
|
|
Vane C H, Harrison I, Kim A W, et al. 2009. Organic and metal contamination in surface mangrove sediments of South China. Marine Pollution Bulletin, 58(1): 134–144. doi: 10.1016/j.marpolbul.2008.09.024
|
|
Wang Qiang, Hong Hualong, Yang Dan, et al. 2020. Health risk assessment of heavy metal and its mitigation by glomalin-related soil protein in sediments along the South China coast. Environmental Pollution, 263: 114565. doi: 10.1016/j.envpol.2020.114565
|
|
Wang Dan, Meng Xin, Zhang Hong, et al. 2016. Pollution analysis and ecological risk assessment of heavy metals in sediments of Liangzi Lake. Acta Scientiae Circumstantiae (in Chinese), 36(6): 1901–1909
|
|
Wang Shuailong, Xu Xiangrong, Sun Yuxin, et al. 2013. Heavy metal pollution in coastal areas of South China: A review. Marine Pollution Bulletin, 76(1–2): 7–15
|
|
Wang Zaosheng, Yin Lei, Qin Xiaohai, et al. 2019. Integrated assessment of sediment quality in a coastal lagoon (Maluan Bay, China) based on AVS-SEM and multivariate statistical analysis. Marine Pollution Bulletin, 146: 476–487. doi: 10.1016/j.marpolbul.2019.07.005
|
|
Wu Qihang, Tam N F Y, Leung J Y S, et al. 2014. Ecological risk and pollution history of heavy metals in Nansha mangrove, South China. Ecotoxicology and Environmental Safety, 104: 143–151. doi: 10.1016/j.ecoenv.2014.02.017
|
|
Xi Xiaohuan. 2004. Eco-geochemical research and eco-geochemical evaluation. Geophysical and Geochemical Exploration (in Chinese), 28(1): 10–15
|
|
Xi Xiaohuan. 2005. Multi-purpose regional geochemical survey and ecogeochemistry: new direction of quaternary research and application. Quaternary Sciences (in Chinese), 25(3): 269–274
|
|
Xi Xiaohuan. 2007. Multipurpose comprehensive geological survey: the strategic choice of exploration geochemistry in 21st century. Geophysical and Geochemical Exploration (in Chinese), 31(4): 283–288
|
|
Yang Guohuan, Song Xinli, Song Zhiguang. 2020. Trophic level and heavy metal pollution of Sardinella albella in Liusha Bay, Beibu Gulf of the South China Sea. Marine Pollution Bulletin, 156: 111204. doi: 10.1016/j.marpolbul.2020.111204
|
|
Zhang Ming, Bao Zhengyu, Chen Guoguang, et al. 2017. Characteristics and risks of heavy metals content in surface sediment of tidal flat areas in Eastern China. Environmental Science (in Chinese), 38(11): 4513–4524
|
|
Zhang Zaiwang, Fang Zhanqiang, Li Jialiang, et al. 2019. Copper, zinc, manganese, cadmium and chromium in crabs from the mangrove wetlands in Qi’ao Island, South China: Levels, bioaccumulation and dietary exposure. Watershed Ecology and the Environment, 1: 26–32. doi: 10.1016/j.wsee.2019.09.001
|
|
Zhang Wenfeng, Liu Xueping, Cheng Hefa, et al. 2012. Heavy metal pollution in sediments of a typical mariculture zone in South China. Marine Pollution Bulletin, 64(4): 712–720. doi: 10.1016/j.marpolbul.2012.01.042
|


Figures(4) / Tables(6)

Supported by:
Beijing Renhe Information Technology Co. Ltd

Tingting Li, Lili Jia, Xin Zhu, Min Xu, Xinchang Zhang. Distribution and risk assessment of heavy metals in surface sediments of coastal mudflats on Leizhou Peninsula, China[J]. Acta Oceanologica Sinica, 2023, 42(1): 25-34. doi: 10.1007/s13131-022-2101-6

| Er | RI | |||
| Grading criteria | Ecological risk level | Grading criteria | Ecological risk level | |
| Er<40 | low | RI<150 | low | |
| 40≤Er<80 | moderate | 150≤RI<300 | moderate | |
| 80≤Er<160 | high | 300≤RI<600 | high | |
| 160≤Er<320 | very high | RI≥600 | very high | |
| Er≥320 | extremely high | |||
| Note: Er: ecological risk; RI is the combined potential ecological pollution index. | ||||
DownLoad:
CSV
| Area | Parameter | As/(μg·g−1) | Cd/(μg·g−1) | Cr/(μg·g−1) | Cu/(μg·g−1) | Hg/(ng·g−1) | Pb/(μg·g−1) |
| All region | mean value | 5.34 | 0.055 | 57.40 | 14.39 | 0.021 | 14.92 |
| range | 0.48−21.90 | 0.004−1.22 | 0.76−309.00 | 0.13−102.00 | 0.002−0.130 | 2.80−69.50 | |
| Suixi County | mean value | 3.72 | 0.06 | 17.07 | 5.45 | 0.020 | 14.71 |
| range | 0.78−6.05 | 0.02−0.30 | 0.85−62.70 | 0.83−26.00 | 0.002−0.029 | 2.80−69.50 | |
| Leizhou City | mean value | 4.93 | 0.04 | 65.56 | 15.52 | 0.020 | 12.01 |
| range | 0.67−14.00 | 0.004−0.16 | 0.88−309.00 | 0.13−85.20 | 0.003−0.099 | 2.80−42.50 | |
| Xuwen County | mean value | 5.25 | 0.05 | 77.09 | 19.53 | 0.020 | 13.13 |
| range | 0.48−18.90 | 0.02−0.09 | 4.70−298.00 | 1.15−102.00 | 0.002−0.110 | 4.50−30.10 | |
| Zhanjiang City | mean value | 5.92 | 0.04 | 35.36 | 8.82 | 0.020 | 18.07 |
| range | 0.71−21.90 | 0.02−0.15 | 0.76−170.00 | 0.78−52.20 | 0.002−0.130 | 4.40−56.90 | |
| Lianjiang City | mean value | 8.33 | 0.29 | 37.14 | 11.40 | 0.040 | 31.01 |
| range | 1.52−19.10 | 0.04−1.22 | 4.18−76.30 | 3.55−19.80 | 0.010−0.076 | 8.60−61.30 | |
| Wuchuan City | mean value | 2.96 | 0.03 | 9.30 | 2.95 | 0.004 | 13.98 |
| range | 0.81−4.94 | 0.02−0.04 | 5.06−14.70 | 1.87−4.30 | 0.003−0.006 | 7.20−20.10 | |
| East China coastal mudflats (Zhang et al., 2017) | mean value | 8.11 | 0.09 | 70.03 | 18.90 | 0.030 | 23.05 |
| range | 1.10−27.20 | 0.02−1.43 | 4.20−230.00 | 2.90−370.00 | 0.010−0.580 | 0.50−85.80 | |
| Marine sediment standards I-II-III (General Administration of Quality Supervision, Inspection and Quarantine of the People’s Republic of China, 2004) | limited value | 20−65−93 | 0.5−1.5−5.0 | 80−150−270 | 35−100−200 | 0.2−0.5−1.0 | 60−130−250 |
DownLoad:
CSV
| Leizhou City | Lianjiang City | Suixi County | Wuchuan City | Xuwen County | Zhanjiang City | |||||||||
| F1 | F2 | F1 | F1 | F1 | F2 | F1 | F2 | F1 | ||||||
| As | 0.680 | 0.612 | 0.938 | 0.987 | 0.935 | 0.071 | 0.571 | 0.708 | 0.861 | |||||
| Cd | 0.870 | −0.026 | 0.815 | 0.969 | 0.686 | 0.633 | 0.859 | 0 | 0.805 | |||||
| Cr | 0.899 | −0.279 | 0.952 | 0.994 | 0.954 | 0.183 | 0.909 | −0.159 | 0.923 | |||||
| Cu | 0.888 | −0.348 | 0.977 | 0.992 | 0.910 | 0.033 | 0.858 | −0.405 | 0.922 | |||||
| Hg | 0.847 | −0.265 | 0.983 | 0.997 | −0.083 | 0.900 | 0.822 | −0.297 | 0.857 | |||||
| Pb | 0.728 | 0.538 | 0.980 | 0.993 | 0.657 | 0.677 | 0.627 | 0.529 | 0.915 | |||||
| Eigenvalue | 4.046 | 0.934 | 5.331 | 5.865 | 4.022 | 1.209 | 3.679 | 1.059 | 4.663 | |||||
| Eigenvalue percentage/% | 67.729 | 15.566 | 88.849 | 97.745 | 67.039 | 20.154 | 61.617 | 17.650 | 77.720 | |||||
DownLoad:
CSV
| As | Cd | Cr | Cu | Hg | Pb | ||
| Leizhou City | As | 1 | −0.136 | 0.492** | 0.427** | 0.383** | −0.010 |
| Cd | 1 | −0.245* | −0.152 | 0.700** | 0.014 | ||
| Cr | 1 | 0.905** | 0.762** | −0.078 | |||
| Cu | 1 | 0.752** | −0.156 | ||||
| Hg | 1 | −0.167 | |||||
| Pb | 1 | ||||||
| Lianjiang City | As | 1 | −0.310 | 0.946** | 0.902** | 0.896** | 0.454* |
| Cd | 1 | −0.366 | −0.386 | 0.818** | −0.003 | ||
| Cr | 1 | 0.962** | 0.910** | 0.441* | |||
| Cu | 1 | 0.944** | 0.425 | ||||
| Hg | 1 | 0.984** | |||||
| Pb | 1 | ||||||
| Suixi County | As | 1 | −0.146 | 0.958** | 0.906** | 0.980** | 0.551** |
| Cd | 1 | −0.224 | −0.147 | 0.950** | 0.186 | ||
| Cr | 1 | 0.946** | 0.996** | 0.579** | |||
| Cu | 1 | 0.995** | 0.525** | ||||
| Hg | 1 | 0.991** | |||||
| Pb | 1 | ||||||
| Wuchuan City | As | 1 | −0.440 | 0.856** | 0.846** | 0.066 | 0.552* |
| Cd | 1 | −0.704** | −0.483 | 0.369 | −0.651** | ||
| Cr | 1 | 0.869** | 0.110 | 0.748** | |||
| Cu | 1 | 0.064 | 0.575* | ||||
| Hg | 1 | 0.427 | |||||
| Pb | 1 | ||||||
| Xuwen County | As | 1 | 0.523** | 0.433** | 0.234* | 0.217* | 0.510** |
| Cd | 1 | −0.052 | −0.044 | 0.221* | 0.409** | ||
| Cr | 1 | 0.890** | −0.114 | 0.466** | |||
| Cu | 1 | −0.101 | 0.312** | ||||
| Hg | 1 | 0.435** | |||||
| Pb | 1 | ||||||
| Zhanjiang City | As | 1 | 0.584** | 0.709** | 0.729** | 0.638** | 0.886** |
| Cd | 1 | −0.075 | −0.082 | 0.593** | 0.667** | ||
| Cr | 1 | 0.918** | −0.172 | 0.819** | |||
| Cu | 1 | −0.183 | 0.748** | ||||
| Hg | 1 | 0.706** | |||||
| Pb | 1 | ||||||
| Note: ** indicates a significant correlation at the 0.01 level; * indicates a significant correlation at the 0.05 level. | |||||||
DownLoad:
CSV
| As | Cd | Cr | Cu | Hg | Pb | |
| Leizhou City | 4.53 | 2.52 | 2.65 | 2.06 | 0.70 | 2.34 |
| Lianjiang City | 1.90 | 3.44 | 0.66 | 0.78 | 0.51 | 1.59 |
| Suixi County | 4.43 | 4.11 | 1.38 | 1.49 | 0.75 | 3.30 |
| Wuchuan City | 4.25 | 2.00 | 1.03 | 1.19 | 0.25 | 3.52 |
| Xuwen County | 4.83 | 1.95 | 2.96 | 2.27 | 0.65 | 2.30 |
| Zhanjiang City | 4.95 | 2.78 | 1.59 | 1.53 | 0.64 | 3.17 |
DownLoad:
CSV
| Eri | RI | Grade | ||||||
| As | Cd | Cr | Cu | Hg | Pb | |||
| Leizhou City | 14.60 | 22.44 | 3.22 | 6.47 | 12.29 | 3.73 | 62.76 | low |
| Lianjiang City | 24.64 | 145.02 | 1.82 | 4.75 | 24.40 | 9.63 | 210.26 | moderate |
| Suixi County | 11.02 | 30.36 | 0.84 | 2.27 | 10.40 | 4.57 | 59.45 | low |
| Wuchuan City | 8.75 | 14.54 | 0.46 | 1.23 | 2.27 | 4.34 | 31.58 | low |
| Xuwen County | 15.52 | 25.06 | 3.79 | 8.14 | 13.84 | 4.08 | 70.43 | low |
| Zhanjiang City | 17.52 | 21.09 | 1.74 | 3.68 | 13.51 | 5.61 | 63.14 | low |
| Average | 15.34 | 43.09 | 1.98 | 4.42 | 12.79 | 5.33 | − | − |
| Note: − represents no data. | ||||||||
DownLoad:
CSV
| Er | RI | |||
| Grading criteria | Ecological risk level | Grading criteria | Ecological risk level | |
| Er<40 | low | RI<150 | low | |
| 40≤Er<80 | moderate | 150≤RI<300 | moderate | |
| 80≤Er<160 | high | 300≤RI<600 | high | |
| 160≤Er<320 | very high | RI≥600 | very high | |
| Er≥320 | extremely high | |||
| Note: Er: ecological risk; RI is the combined potential ecological pollution index. | ||||
| Area | Parameter | As/(μg·g−1) | Cd/(μg·g−1) | Cr/(μg·g−1) | Cu/(μg·g−1) | Hg/(ng·g−1) | Pb/(μg·g−1) |
| All region | mean value | 5.34 | 0.055 | 57.40 | 14.39 | 0.021 | 14.92 |
| range | 0.48−21.90 | 0.004−1.22 | 0.76−309.00 | 0.13−102.00 | 0.002−0.130 | 2.80−69.50 | |
| Suixi County | mean value | 3.72 | 0.06 | 17.07 | 5.45 | 0.020 | 14.71 |
| range | 0.78−6.05 | 0.02−0.30 | 0.85−62.70 | 0.83−26.00 | 0.002−0.029 | 2.80−69.50 | |
| Leizhou City | mean value | 4.93 | 0.04 | 65.56 | 15.52 | 0.020 | 12.01 |
| range | 0.67−14.00 | 0.004−0.16 | 0.88−309.00 | 0.13−85.20 | 0.003−0.099 | 2.80−42.50 | |
| Xuwen County | mean value | 5.25 | 0.05 | 77.09 | 19.53 | 0.020 | 13.13 |
| range | 0.48−18.90 | 0.02−0.09 | 4.70−298.00 | 1.15−102.00 | 0.002−0.110 | 4.50−30.10 | |
| Zhanjiang City | mean value | 5.92 | 0.04 | 35.36 | 8.82 | 0.020 | 18.07 |
| range | 0.71−21.90 | 0.02−0.15 | 0.76−170.00 | 0.78−52.20 | 0.002−0.130 | 4.40−56.90 | |
| Lianjiang City | mean value | 8.33 | 0.29 | 37.14 | 11.40 | 0.040 | 31.01 |
| range | 1.52−19.10 | 0.04−1.22 | 4.18−76.30 | 3.55−19.80 | 0.010−0.076 | 8.60−61.30 | |
| Wuchuan City | mean value | 2.96 | 0.03 | 9.30 | 2.95 | 0.004 | 13.98 |
| range | 0.81−4.94 | 0.02−0.04 | 5.06−14.70 | 1.87−4.30 | 0.003−0.006 | 7.20−20.10 | |
| East China coastal mudflats (Zhang et al., 2017) | mean value | 8.11 | 0.09 | 70.03 | 18.90 | 0.030 | 23.05 |
| range | 1.10−27.20 | 0.02−1.43 | 4.20−230.00 | 2.90−370.00 | 0.010−0.580 | 0.50−85.80 | |
| Marine sediment standards I-II-III (General Administration of Quality Supervision, Inspection and Quarantine of the People’s Republic of China, 2004) | limited value | 20−65−93 | 0.5−1.5−5.0 | 80−150−270 | 35−100−200 | 0.2−0.5−1.0 | 60−130−250 |
| Leizhou City | Lianjiang City | Suixi County | Wuchuan City | Xuwen County | Zhanjiang City | |||||||||
| F1 | F2 | F1 | F1 | F1 | F2 | F1 | F2 | F1 | ||||||
| As | 0.680 | 0.612 | 0.938 | 0.987 | 0.935 | 0.071 | 0.571 | 0.708 | 0.861 | |||||
| Cd | 0.870 | −0.026 | 0.815 | 0.969 | 0.686 | 0.633 | 0.859 | 0 | 0.805 | |||||
| Cr | 0.899 | −0.279 | 0.952 | 0.994 | 0.954 | 0.183 | 0.909 | −0.159 | 0.923 | |||||
| Cu | 0.888 | −0.348 | 0.977 | 0.992 | 0.910 | 0.033 | 0.858 | −0.405 | 0.922 | |||||
| Hg | 0.847 | −0.265 | 0.983 | 0.997 | −0.083 | 0.900 | 0.822 | −0.297 | 0.857 | |||||
| Pb | 0.728 | 0.538 | 0.980 | 0.993 | 0.657 | 0.677 | 0.627 | 0.529 | 0.915 | |||||
| Eigenvalue | 4.046 | 0.934 | 5.331 | 5.865 | 4.022 | 1.209 | 3.679 | 1.059 | 4.663 | |||||
| Eigenvalue percentage/% | 67.729 | 15.566 | 88.849 | 97.745 | 67.039 | 20.154 | 61.617 | 17.650 | 77.720 | |||||
| As | Cd | Cr | Cu | Hg | Pb | ||
| Leizhou City | As | 1 | −0.136 | 0.492** | 0.427** | 0.383** | −0.010 |
| Cd | 1 | −0.245* | −0.152 | 0.700** | 0.014 | ||
| Cr | 1 | 0.905** | 0.762** | −0.078 | |||
| Cu | 1 | 0.752** | −0.156 | ||||
| Hg | 1 | −0.167 | |||||
| Pb | 1 | ||||||
| Lianjiang City | As | 1 | −0.310 | 0.946** | 0.902** | 0.896** | 0.454* |
| Cd | 1 | −0.366 | −0.386 | 0.818** | −0.003 | ||
| Cr | 1 | 0.962** | 0.910** | 0.441* | |||
| Cu | 1 | 0.944** | 0.425 | ||||
| Hg | 1 | 0.984** | |||||
| Pb | 1 | ||||||
| Suixi County | As | 1 | −0.146 | 0.958** | 0.906** | 0.980** | 0.551** |
| Cd | 1 | −0.224 | −0.147 | 0.950** | 0.186 | ||
| Cr | 1 | 0.946** | 0.996** | 0.579** | |||
| Cu | 1 | 0.995** | 0.525** | ||||
| Hg | 1 | 0.991** | |||||
| Pb | 1 | ||||||
| Wuchuan City | As | 1 | −0.440 | 0.856** | 0.846** | 0.066 | 0.552* |
| Cd | 1 | −0.704** | −0.483 | 0.369 | −0.651** | ||
| Cr | 1 | 0.869** | 0.110 | 0.748** | |||
| Cu | 1 | 0.064 | 0.575* | ||||
| Hg | 1 | 0.427 | |||||
| Pb | 1 | ||||||
| Xuwen County | As | 1 | 0.523** | 0.433** | 0.234* | 0.217* | 0.510** |
| Cd | 1 | −0.052 | −0.044 | 0.221* | 0.409** | ||
| Cr | 1 | 0.890** | −0.114 | 0.466** | |||
| Cu | 1 | −0.101 | 0.312** | ||||
| Hg | 1 | 0.435** | |||||
| Pb | 1 | ||||||
| Zhanjiang City | As | 1 | 0.584** | 0.709** | 0.729** | 0.638** | 0.886** |
| Cd | 1 | −0.075 | −0.082 | 0.593** | 0.667** | ||
| Cr | 1 | 0.918** | −0.172 | 0.819** | |||
| Cu | 1 | −0.183 | 0.748** | ||||
| Hg | 1 | 0.706** | |||||
| Pb | 1 | ||||||
| Note: ** indicates a significant correlation at the 0.01 level; * indicates a significant correlation at the 0.05 level. | |||||||
| As | Cd | Cr | Cu | Hg | Pb | |
| Leizhou City | 4.53 | 2.52 | 2.65 | 2.06 | 0.70 | 2.34 |
| Lianjiang City | 1.90 | 3.44 | 0.66 | 0.78 | 0.51 | 1.59 |
| Suixi County | 4.43 | 4.11 | 1.38 | 1.49 | 0.75 | 3.30 |
| Wuchuan City | 4.25 | 2.00 | 1.03 | 1.19 | 0.25 | 3.52 |
| Xuwen County | 4.83 | 1.95 | 2.96 | 2.27 | 0.65 | 2.30 |
| Zhanjiang City | 4.95 | 2.78 | 1.59 | 1.53 | 0.64 | 3.17 |
| Eri | RI | Grade | ||||||
| As | Cd | Cr | Cu | Hg | Pb | |||
| Leizhou City | 14.60 | 22.44 | 3.22 | 6.47 | 12.29 | 3.73 | 62.76 | low |
| Lianjiang City | 24.64 | 145.02 | 1.82 | 4.75 | 24.40 | 9.63 | 210.26 | moderate |
| Suixi County | 11.02 | 30.36 | 0.84 | 2.27 | 10.40 | 4.57 | 59.45 | low |
| Wuchuan City | 8.75 | 14.54 | 0.46 | 1.23 | 2.27 | 4.34 | 31.58 | low |
| Xuwen County | 15.52 | 25.06 | 3.79 | 8.14 | 13.84 | 4.08 | 70.43 | low |
| Zhanjiang City | 17.52 | 21.09 | 1.74 | 3.68 | 13.51 | 5.61 | 63.14 | low |
| Average | 15.34 | 43.09 | 1.98 | 4.42 | 12.79 | 5.33 | − | − |
| Note: − represents no data. | ||||||||
 DownLoad:


 DownLoad:


