Linyu Wang, Fuqiang Wang, Zuozhi Chen, Ying Wu. The influence of lipid-extraction on the δ13C of mesopelagic and demersal fish in the South China Sea: modification and application of lipid normalization models[J]. Acta Oceanologica Sinica, 2023, 42(1): 35-43. doi: 10.1007/s13131-022-2045-x
Citation:
Linyu Wang, Fuqiang Wang, Zuozhi Chen, Ying Wu. The influence of lipid-extraction on the δ13C of mesopelagic and demersal fish in the South China Sea: modification and application of lipid normalization models[J]. Acta Oceanologica Sinica, 2023, 42(1): 35-43. doi: 10.1007/s13131-022-2045-x
Linyu Wang, Fuqiang Wang, Zuozhi Chen, Ying Wu. The influence of lipid-extraction on the δ13C of mesopelagic and demersal fish in the South China Sea: modification and application of lipid normalization models[J]. Acta Oceanologica Sinica, 2023, 42(1): 35-43. doi: 10.1007/s13131-022-2045-x
Citation:
Linyu Wang, Fuqiang Wang, Zuozhi Chen, Ying Wu. The influence of lipid-extraction on the δ13C of mesopelagic and demersal fish in the South China Sea: modification and application of lipid normalization models[J]. Acta Oceanologica Sinica, 2023, 42(1): 35-43. doi: 10.1007/s13131-022-2045-x
The influence of lipid-extraction on the δ13C of mesopelagic and demersal fish in the South China Sea: modification and application of lipid normalization models
State Key Laboratory of Estuarine and Coastal Research, East China Normal University, Shanghai 200241, China
2.
Pilot National Laboratory for Marine Science and Technology (Qingdao), Qingdao 266237, China
3.
South China Sea Fisheries Research Institute, Chinese Academy of Fishery Sciences, Guangzhou 100141, China
Funds:
the National Natural Science Foundation of China under contract Nos 42090043 and 41876074; the National Basic Research Program (973 Program) of China under contract No. 2014CB441502.
Mesopelagic fish, the most important daily vertically migrating community in the oceans, are characterized by high lipid content which may obscure the interpretation of stable isotopes analysis. Demersal fish, which are important consumers in the food web dominated by mesopelagic fish, also have a high lipid content. Here we collected 127 fish samples from the South China Sea and evaluated the effect of lipid contents on δ13C of mesopelagic and demersal fish. In lipid-extracted mesopelagic fish, the C/N content ratio (<5.5) shows a clear correlation with Δδ13C (the offset of bulk and lipid-extracted δ13C values), especially in non-migratory and semi-migratory species; these values were less correlation in demersal fish. Based on our results, we suggest that mesopelagic and demersal fish in different regions of the South China Sea should be studied separately using appropriate correction models and less fit for the traditional model. Moreover, the C/N content ratio should be used cautiously for establishing the lipid normalization model, especially for the fish in migratory mesopelagic fish and demersal fish. Our results also reveal that mesopelagic fish across nearby regions could be analyzed together. The new models described here can be applied in future studies of mesopelagic and demersal fish in the South China Sea.
Mesopelagic fish dominate (in number and biomass) among open ocean teleostean fish. Most mesopelagic fish exhibit the behavioral trait of daily vertical migration through the water as a refuge against predators during the day and in pursuit of food at night (Olivar et al., 2012; Sutton, 2013). These fish play substantial roles in the active carbon transport process in the water column by carrying ingested zooplankton downward to deeper zones. Thus, these fish are a key factor in the open ocean food-webs and carbon flux (Irigoien et al., 2014). To satisfy the energy requirement for daily vertical migration, mesopelagic fish have a higher content of lipids, with indispensable functions in energy store and buoyancy (Catul et al., 2011; Hudson et al., 2014; Stowasser et al., 2009b; Wang et al., 2019a). Moreover, other mesopelagic fish groups, including non-migrant planktivores, and piscivores, and semi-migrant piscivores, are also essential in indirect carbon transport (Jónasdóttir et al., 2015). Mesopelagic fish also play an important role in marine food webs by providing food resources for the demersal fish (Richards et al., 2019).
To eliminate the lipid effect and avoid time-consuming chemical extraction, the lipid normalization model has been recommended as the main method of sample standardization (Weldrick et al., 2019). There are two principal models typically used in studying the relationship between δ13C and C/N content ratio in mesopelagic fish (Flynn and Kloser, 2012; Olivar et al., 2019; Valls et al., 2014). A non-linear model, proposed by McConnaughey and Mcroy (1979), focuses on the study of Δδ13C (the difference in δ13C values before and after lipid removal) in marine invertebrates and vertebrates. The linear model proposed by Post et al. (2007) is based on the relationship between Δδ13C and C/N content ratio. Lipids are extracted from fish with a C/N content ratio larger than 3.5 because such tissues are generally regarded as rich in lipid content (Cloyed and Eason, 2016; Post et al., 2007). Although there is a preferable relativity between C/N content ratio and Δδ13C, the Post’s model is based on aquatic animals with low lipid content (mainly lower than 20%) relative to mesopelagic fish (Post et al., 2007). Moreover, the effect of lipids on 13C, C/N ratio, and Δδ13C in tissues vary considerably due to different statuses (Bowen et al., 1987; Fagan et al., 2011). Therefore, there is a demand for more robust lipid-correction models for mesopelagic fish, especially when the C/N content ratio is low level and the lipid content is high (Cloyed and Eason, 2016; Cloyed et al., 2020; McClain-Counts et al., 2017; Post et al., 2007).
The South China Sea (SCS) is the largest marginal sea in the western tropical Pacific Ocean with complex physicochemical environments (Su, 2004; Zhang et al., 2018). The physical and biological environments in the northern slope and central SCS are complex (Gong et al., 2015b; Li et al., 2011; Lin and Lin, 2006; Yu et al., 2016). The different aquatic environments where mesopelagic fish reside lead to a different relationship between the C/N content ratio and δ13C (Hu et al., 2000). It is currently unclear whether using the existing correction models will affect the results of lipid correction in the fish in these regions. An analysis of trophic interactions among mesopelagic fish in the SCS using stable isotopes has suggested that the effect of lipid content in stable carbon isotopes must be considered (Svensson et al., 2014; Wang et al., 2019a). Additionally, the connection between the C/N content ratio and lipid content indicates the necessity of mathematical normalization methods to account for the effect of lipids on δ13C levels.
In summary, a lipid normalization model should be constructed by extracting a sample subset in cases of highly variable lipid content in mesopelagic fish. Therefore, we hypothesize that using the existing linear model from aquatic organisms with different lipid content cannot completely explain the data or disclose the true isotopic changes that fish undergo in different regions. To verify these hypotheses, we compare the δ13C values by chemical extraction with the results of the mathematical correction of mesopelagic and demersal fish in the SCS and present the mathematical normalization models for these fish. In particular, we survey the relationship between C/N content ratio, lipid content and Δδ13C values to conduct a systematic study on mesopelagic and demersal fish in the north slope and mid-western of the SCS.
2.
Materials and methods
2.1
Sample collection and preparation
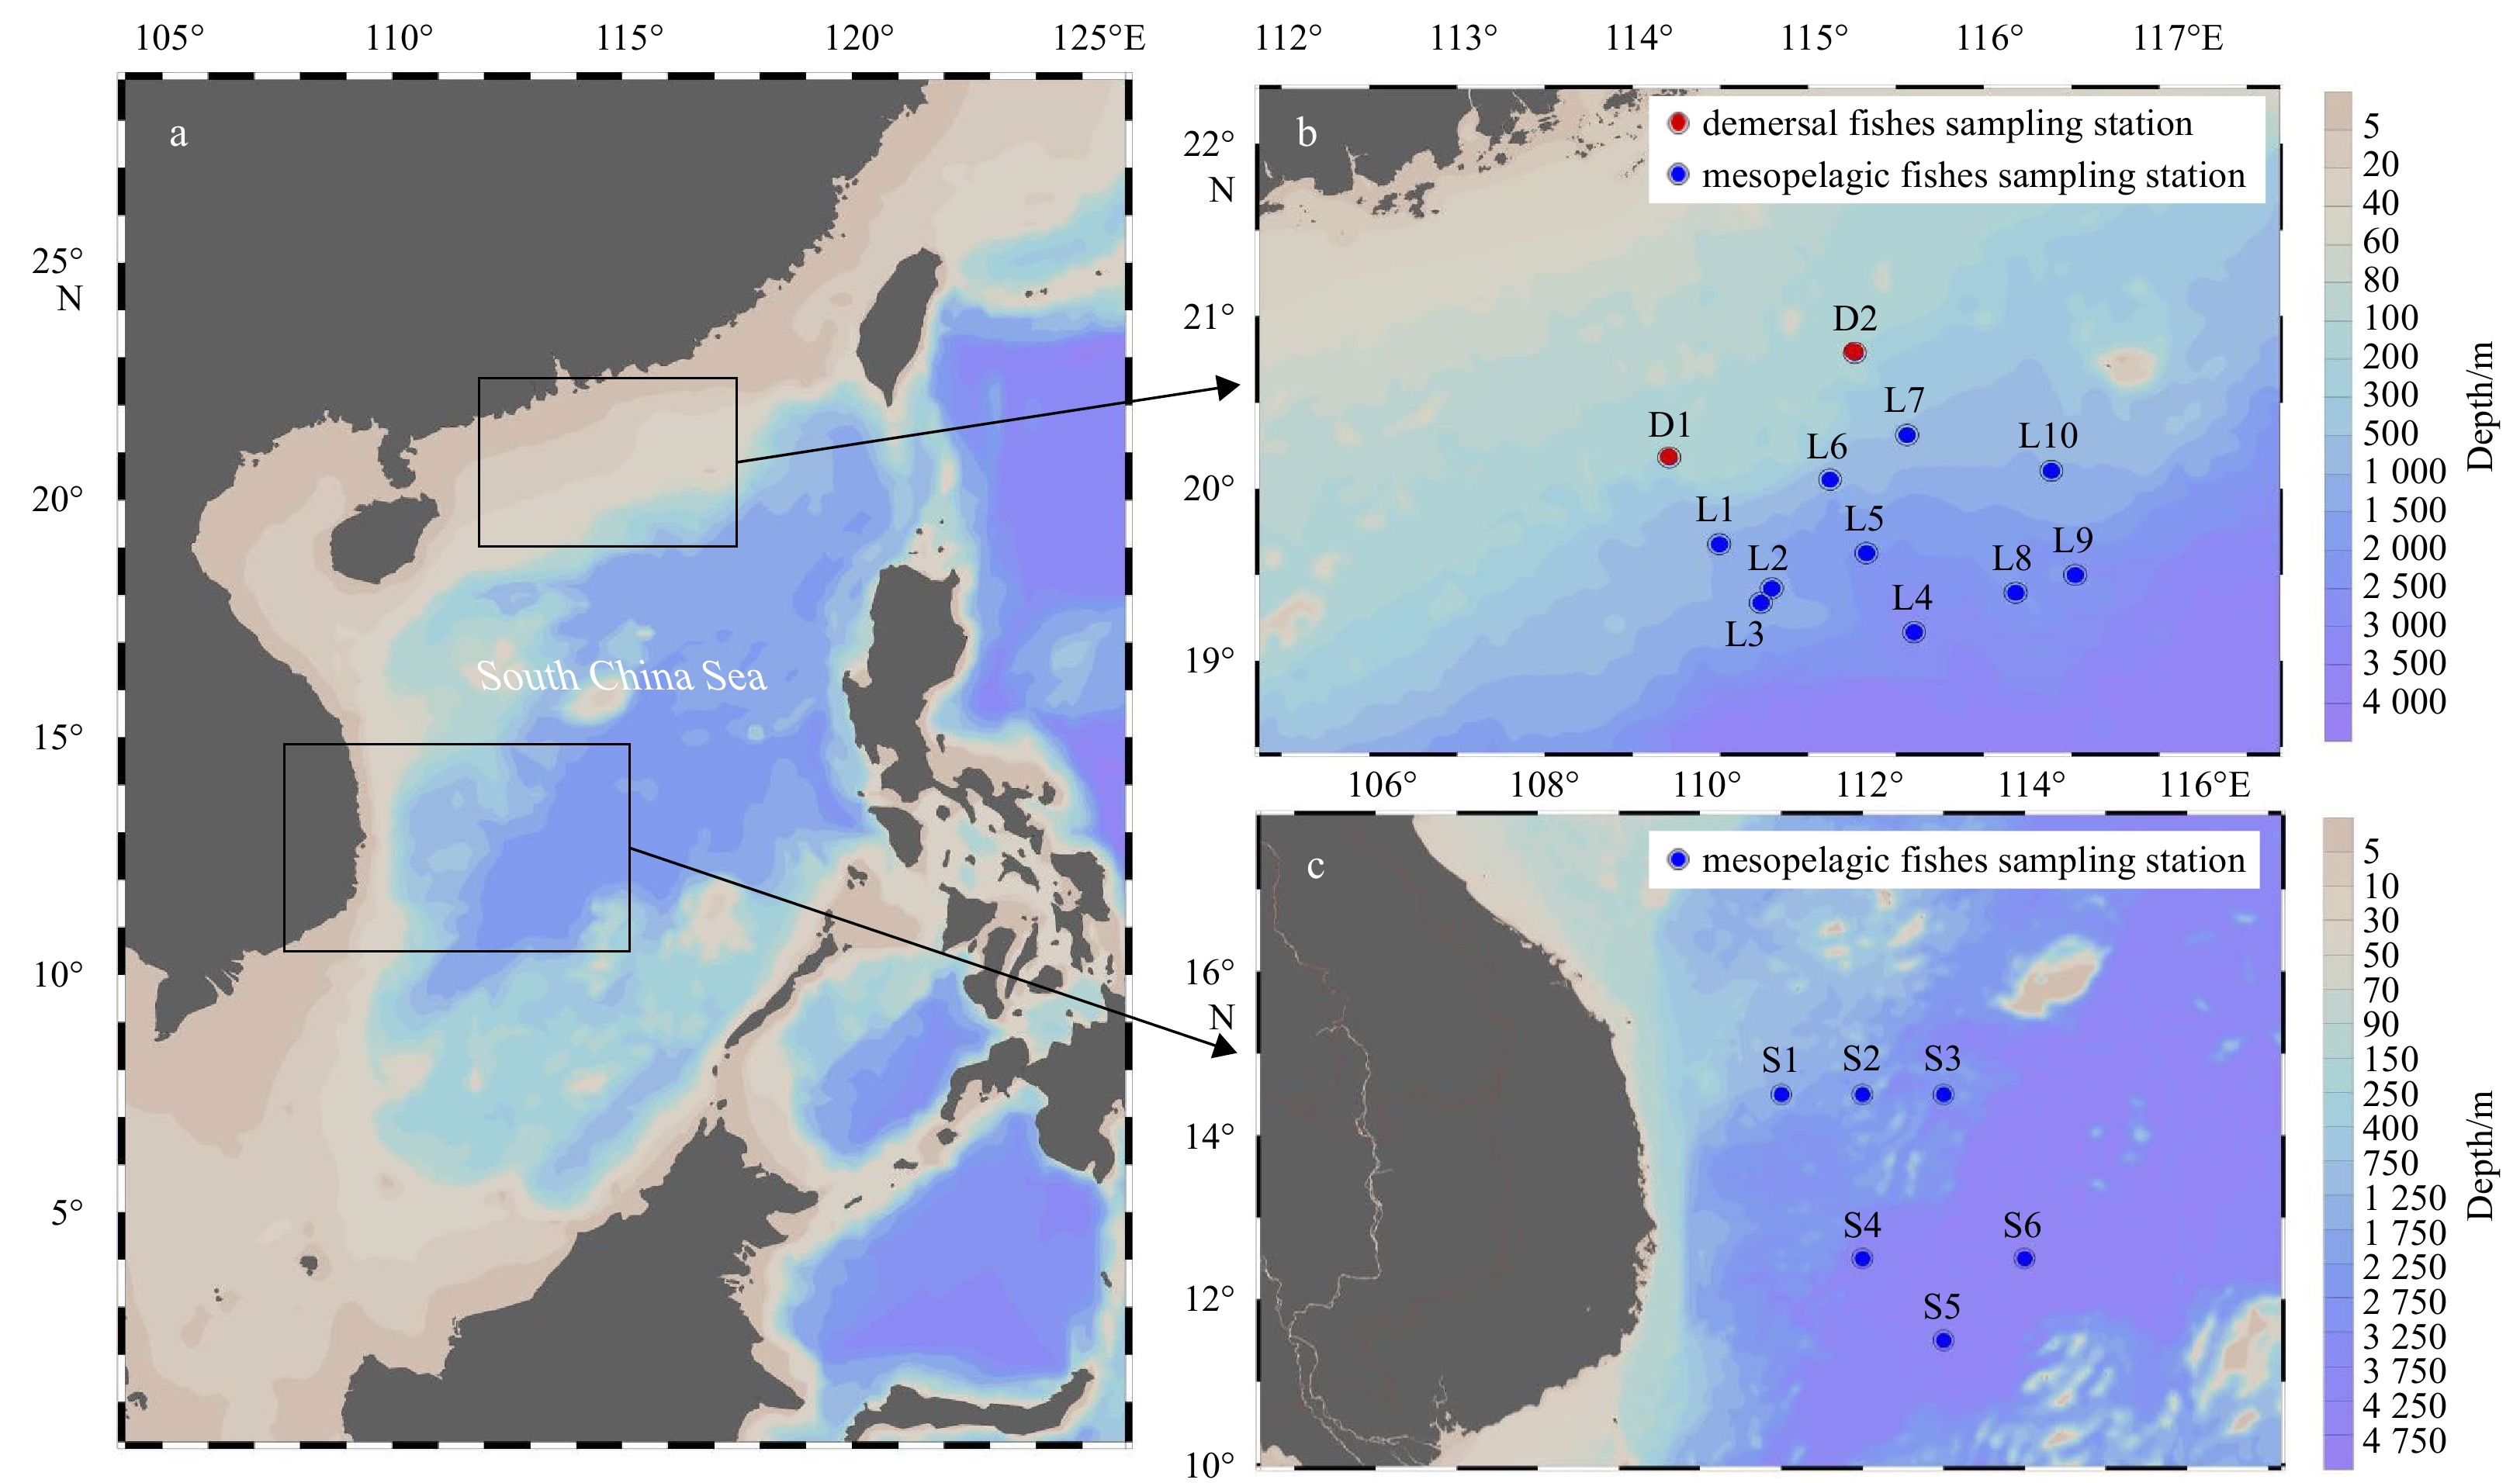
Fish samples were collected from the continental slope of the SCS during four cruises carried out in October 2014, June 2015 and March 2017, and from the mid-western SCS in October 2016 (Fig. 1; Table 1). The mesopelagic fish samples were obtained using a mid-layer trawl with a mouth perimeter 136.10 m and a headrope length 50.85 m with a trawling speed 3.4–4.5 m/s in 60–120 min. The demersal fish were caught using a bottom trawl with a mouth perimeter 110 m and a headrope length 87.16 m with a trawling speed 3.4–4.1 m/s in 60–120 min.
Figure
1.
Map of sample collection regions in the South China Sea (SCS) (a): the north slope of the SCS (b); the mid-western SCS (c). L1–L10 represent sampling sites of mesopelagic fish on the northern slope of the SCS; D1 and D2 are sampling sites of demersal fish in the continental shelf area and shrimp farm zone of the SCS; S1–S6 represent sampling sites in the mid-western SCS.
Preliminary catch analysis was performed on board. All specimens were identified, counted, measured, and recorded. Sampling details are described in Zhang et al. (2019). All obvious large specimens and rare species were removed with proportional subsamples. The obtained samples were divided into equal proportions to obtain sample subgroups for measurement. Each specimen and its feeding habits were identified using morphological characteristics and guides to “The Fish of the Japanese Archipelago” (Masuda et al., 1984), “Fish of Taiwan” (Shen, 1993), “Fauna Sinica: Osteichthyes (Myctophiformes, Cetomimiformes and Osteoglossiformes)” (Chen, 2002), “Review of Fish of South China Sea” (Sun and Chen, 2013), and “Marine Fish of China” (Chen and Zhang, 2015). Based on the growth and development logistic curve, the initial sexual maturity body length in mesopelagic fish is larger than 50 mm (Catul et al., 2011; Jin et al., 2011; Gong et al., 2015a; Kong et al., 2016). A total of 127 individuals were used in the subsequent analyses with about 50 mm (43.9–59.1 mm) body length for similar physiological status.
The skin and scales from each sample were removed. And the muscle tissues of samples were taken from the anterior dorsal region. The muscle tissue samples were lyophilized in a freeze dryer (LOC-1, Christ, Germany) and stored at −40℃ until further analysis (Cui et al., 2015). The dried muscle samples were grounded using a mortar and pestle to ensure homogeneity.
2.2
Lipid extraction and stable isotope analysis
The lipid content was determined from a known quantity of tissue extracted using a dichloromethane-methanol solvent system (2:1 v/v, including 0.01% butylated hydroxytoluene) based on Floch’s method (Folch et al., 1957, Wan et al., 2010). Approximately 15 mL of dichloromethane:methanol (2:1) was added to 100 mg of the sample. The mixture was extracted and centrifuged (3000 r/min, 10 min). The supernatant was transferred to the flask with a pipette. The solution was evaporated to dryness under an N2 flow at indoor temperature and weighed. The lipid content was calculated as the percentage of the mass of freeze-dried tissue without lipid extraction (Svensson et al., 2014). The extracted tissue has been dried under a stream of N2 at room temperature for measuring the 13C value. The bulk sample carbon isotope (δ13Cbulk) was detected using the EA-IRMS (Finngan Delt plus XP, Thermo-Fisher, Germany) after weighing 0.2 mg of the freeze-dried sample and placing it in a tin capsule. The extraction carbon isotope (δ13Cextraction) was detected by weighting 0.2 mg of the lipid-extracted samples with the same detector method. We measured the C/N content ratio of the fish samples at the same time. The C/N content ratio was expressed as a mass ratio of carbon to nitrogen (C/Nmass) by comparing total organic carbon (TOC) to the total nitrogen (TN) of samples without lipid extraction. The carbon isotope standard used pseudobolite standard from South Carolina, USA (Cherel et al., 2010). Isotope ratios were expressed in the difference between the isotope ratio of a sample and that of an international standard as the following formula (Svensson et al., 2014):
where [13C] and [12C] mean the contents of 13C and 12C. The standard deviations of isotopic measurements were less than 0.1‰ at ten sample intervals using the carbon isotope standard.
2.3
Lipid normalizing model
In this study, a mathematical normalization model was performed to determine whether C/Nmass can be used to predict the effect of lipid contents on δ13C values. This is typically achieved using Δδ13C against the C/Nmass of the sample without lipid extraction to “correct” bulk samples. The lipid normalizing formula proposed by Post et al. (2007) indicated that there was a positive linear relation between C/Nmass and Δδ13C:
A relatively popular formula termed “lipid normalized” δ13C/‰ was presented by McConnaughey and McRoy (1979), which mainly focused on Δδ13C of marine invertebrates and vertebrates. It was described as follows:
where L represents lipid content (percentage of dry weight) of the sample, D is the depletion of 13C (‰) in lipid relative to protein and assigned as 6‰. According to Eqs (3) and (4), Δδ13C can be combined and transformed as the following formula:
Data were presented as the mean±one standard deviation (SD) when more than one sample was analyzed. Paired t-tests were performed to test the effect of lipid extraction. The significant differences in data are expressed using Pearson correlation coefficients. One-way analysis of variance (ANOVA) was used to test for significant differences in mesopelagic fish with different patterns. Results associated with P-values less than 0.05 were considered statistically significant, and P-values higher than 0.05 were not statistically significant. Our systematic error measurement of the instrument was ±0.1‰, which we accounted for to test the accuracy of the corrected model. Data analyses and linear fitting were conducted using the statistical software Origin 2019b (9.26).
3.
Results
In this study, 127 fish from the SCS were analyzed. Standard body length had no relevance to lipid content (P=0.15). The Δδ13Ctheory was calculated using a linear normalization model (Post et al., 2007) and then compared with Δδ13Cextraction (difference between the bulk and chemical lipid-extracted δ13C). The result was 29.9% Δδ13C values in the error range (dots in dash area, Fig. 2). The δ13C values of 87% lipid-extracted samples were more negative than the theoretical values (Fig. 2). Additionally, the results showed a certain difference in normalization values between different groups (Fig. 2).
Figure
2.
The difference between Δδ13Cextraction and Δδ13Ctheory in four groups of fish in the SCS. Δδ13Cextraction: the difference between bulk and lipid-extracted δ13C. Δδ13Ctheory: Δδ13C was calculated using the lipid normalization model (Post et al., 2007). Grey area: ±0.2‰ error range.
3.1
Lipid content, C/Nmass, total organic carbon, and total nitrogen
There were significant differences among lipid content, C/Nmass, TN and TOC in the four groups (P<0.01, Fig. 3). Significant differences in lipid content and C/Nmass were found between mesopelagic fish (30.7%±6.4%) and demersal fish (19.6%±7.7%, P<0.01). The C/Nmass ratios of mesopelagic fish varied from 2.6 to 5.7 (mostly from 3.0 to 5.5), which was higher than demersal fish at Site D2 (3.1±0.2, P<0.01) and Site D1 (3.5±0.4, P<0.01). Two mesopelagic fish species (Melamphaes simus, Stomias nebulosus) had a C/Nmass higher than 5.5. The lipid content, C/Nmass and TOC of demersal fish, differed significantly between the two sites (P<0.01, Table 2). However, the δ13C has a larger deviation at Site D2 than at Site D1 (Table 2).
Figure
3.
The percentage of lipid content, total nitrogen (TN), and total organic carbon (TOC) in mesopelagic and demersal fish in the South China Sea (SCS).
Table
2.
Mean±SD lipid content, carbon content to nitrogen content ratios (C/Nmass), total nitrogen content (TN), total organic carbon content (TOC), and Δδ13C (the difference between bulk and lipid-extracted δ13C) in four regions of the SCS. Pearson correlation coefficient tested the correlation between lipid content and C/Nmass, C/Nmass and Δδ13C
Region
Lipid content/%
C/Nmass
TN/%
TOC/%
Δδ13C/‰
Lipid content vs. C/Nmass
C/Nmass vs. Δδ13C
P
Pearson corr.
P
Pearson corr.
North slope
30.4±6.6
3.7±0.6
10.5±1.0
40.7±5.0*
0.9±0.7*
< 0.01
0.38
< 0.01
0.77
Mid-west
31.7±5.9
3.7±0.6
9.2±1.0*
32.9±3.2*
1.2±0.6
0.69
−0.09
< 0.01
0.95
Site D1
16.7±6.9
3.5±0.4
12.8±2.1
43.8±5.9
0.4±0.2
< 0.01
0.86
< 0.01
0.84
Site D2
24.5±6.8
3.1±0.2
12.1±0.3
37.5±1.6
0.9±0.2
0.06
0.53
0.03
0.57
Note: *represents a significant difference in ANOVA for different migration habits in mesopelagic fish with significant value P<0.05.
For the mesopelagic fish, there were significant differences between these two regions in terms of TN and TOC (P<0.01), but there was no significant difference in lipid content (P=0.39). The migratory fish had a higher lipid content (31.0%±7.0%) and lower C/Nmass (3.8±0.6) and TOC content (39.6%±4.9%) compared to non-migratory fish (lipid content: 29.0%±5.4%, C/Nmass: 4.1±0.4 and TOC content: 42.6%±4.0%) and semi-migratory fish (lipid content: 28.7%±6.7%, C/Nmass: 4.2±0.8 and TOC content: 45.3%±3.8%). These groups differed significantly in their TOC content (ANOVA, P<0.01), but there was no significant difference in C/Nmass (ANOVA, P=0.22) and TN content (ANOVA, P=0.39). There was no significant difference in C/Nmass in fish with different migratory habits in mesopelagic fish in the mid-western SCS (ANOVA, P=0.10).
3.2
Lipid normalization
We applied C/Nmass with Δδ13C of all samples to establish a lipid normalization model (${\Delta }{\delta }^{13}{{\rm{C}}} = -1.87 + 0.73{\times {\rm{C}}/{\rm{N}}}_{{\rm{mass}}}$, R2=0.49, P<0.01) , in which only 26.8% of the data was in the error range ±0.2‰ between the theoretical value and the extraction value. We also examined the utility of C/Nmass for predicting the lipid content and found that there was no significant correlation between lipid content and δ13C of mesopelagic fish in the mid-west SCS (P=0.69) and demersal fish at Site D2 (P=0.06). However, C/Nmass and δ13C were highly correlated in each group (Table 2). The best-fitting result of mesopelagic fish was set up in two groups based on geographical location, including the northern and the mid-western SCS. In the north (Fig. 4a) and mid-west (Fig. 4b), 62.3% and 79.2% of the data were in the error range ±0.2‰, respectively. The correlation of lipid content and C/Nmass was poor among vertical migration species (R2=0.52) compared to the non-migrated species (R2=0.72) and semi-migrated species (R2=0.93). In the mid-west, mesopelagic fish had a great correlation in vertical migration species (R2=0.84), non-migrated species (R2=0.77), and semi-migrated species (R2=0.99) when we divided mesopelagic fish by migration behaviors and reconstructed the correlation model using C/Nmass and lipid content.
Figure
4.
The linear relationship between C/Nmass and Δδ13C of mesopelagic fish in the northern (a), mid-western (b), and demersal fish (c) in two sites of the South China Sea (SCS). Grey area: 95% confidence interval.
In demersal fish, the linear relationship between C/Nmass and Δδ13C had a better fit at Site D1 (R2=0.70, P<0.01) than Site D2 (R2=0.43, P=0.01) (Fig. 4c). The Δδ13C values of the demersal fish in the Site D2 were higher than those in the Site D1 (P<0.01). The C/Nmass of the fish in Site D1 (3.5±0.3) was significantly higher than that in Site D2 (3.1±0.2, P<0.01). Compared to C/Nmass, there was a better correlation between lipid and Δδ13C. A total of 94.6% of Δδ13C values in the two sites were in the error range ±0.2‰.
In the comparative literature, the C/Nmass of mesopelagic fish in the incubation period in this research and liver tissue was typically greater than 5.5 (Satterfield and Finney, 2002; Wang et al., 2009).
Figure
5.
The non-linear relationship between C/Nmass and Δδ13C of mesopelagic fish in the northern, mid-western and demersal fish in the South China Sea (SCS).
On average, using the existing linear lipid correction model causes different deviations in four regions in the SCS (Fig. 2) when considering the significant difference in lipid content between mesopelagic fish (30.7%±6.4%) and demersal fish (19.6%±7.7%). Other studies on mesopelagic and demersal fish found similar content differences, suggesting that lipid content on δ13C may differ between these two groups, which need to be discussed separately (Saito and Murata, 1998; Catul et al., 2011). Thus, our results revealed that the sample classification needed to be considered when many fish samples in the SCS were used for lipid calibration with significant differences in lipid content (Abrantes et al., 2012; Hoffman and Sutton, 2010; Logan et al., 2010). Further, we analyzed two specific groups in detail to discuss whether there was a need for further division in each group.
Regarding demersal fish, the influence of biological factors needs to be considered when C/Nmass was lower than 3.5. This showed a greater bias between Δδ13Ctheory and Δδ13Cextraction at Site D2 (blue dots in Fig. 2) than that at Site D1 (green dots in Fig. 2). The high lipid content did not lead to an increase in C/Nmass values (Table 2). The demersal fish at Site D2 presented higher lipid content and lower TOC content than that at Site D1, leading to lower C/Nmass. Previous research suggested that lipid content had little influence on the δ13C values when C/Nmass was lower than 3.5, which was not performed in demersal fish (Post et al., 2007). The lipid effect on δ13C could not be ignored in demersal fish at Site D2 (Richard et al., 2019). The nutritional structure might be the reason, and lipid metabolism type, should be concerned in these sites because of the difference in TOC (Tocher, 2003). Future studies on lipid structure and metabolism requirements should be conducted to indicate the influence of lipid effect on δ13C.
Environmental conditions may exert important influences on the nutritional traits of marine organisms, which might lead to differences in carbon and nitrogen composition in mesopelagic fish (Molina-Valdivia et al., 2021). The northern region was mainly influenced by Pacific water masses, while the mid-western regions were mainly affected by upwelling water masses in different water environments (water temperatures and primary productivity) (Hu et al., 2000; Yu et al., 2016). The bias between Δδ13Ctheory and Δδ13Cextraction were higher in mesopelagic fish in the mid-west SCS (red dots in Fig. 2) than that in the northern SCS (black dots in Fig. 2). Meanwhile, the mesopelagic fish in the northern SCS had higher contents of TN and TOC with similar C/Nmass (Fig. 3). Thus, the mesopelagic fish in the mid-western and northern SCS should be lipid corrected separately. In particular, it was also worth noting that migrating behavior had to be considered during lipid correction, which may be attributed to their poor correlations in C/Nmass and lipid content in the mesopelagic fish in the northern SCS. This finding demonstrates that the migration strategies of fish should be considered during lipid correction (Svensson et al., 2014).
The C/Nmass ratios require special classification, with 3.7 being the main boundary for lipid correction (McClain-Counts et al., 2017; Quintana-Rizzo et al., 2015). Based on the non-linear relationship proposed by McConnaughey and Mcroy (1979) and Wang et al. (2009), we found that the non-linear relationship is more likely to reflect the relationship between C/Nmass and Δδ13C when the C/Nmass value was larger than 5.5 and the large C/Nmass could be samples of fish livers or samples in special life stage, which is also consistent with the results of other literatures after combining and analyzing the fish in the SCS and literature data (Logan et al., 2008; Yurkowski et al., 2015). The effect of lipid content on δ13C might differ in demersal fish at Site D2 and mesopelagic fish in the mid-western SCS. It was found that the existing C/Nmass results are mainly lower than 5.5 for mesopelagic fish in the muscle (Cherel et al., 2010; Hoffman and Sutton, 2010; Valls et al., 2014; Richards et al., 2019). For some specific species, classification may be required for eliminating the lipid effect on δ13C by using non-linear model or lipid extraction, like Benthosemaglaciale (C/Nmass was 7.8±1.0) in Olivar et al. (2019). Although the approach classified in the same species and life period produced the least error, best fit, and smallest bias in the model prediction, these correction methods produced similar and well results under proper sample classification.
4.2
The variation of C/Nmass and lipid correction
The differences in the composition of lipids can lead to changes in C/Nmass (Yurkowski et al., 2015). The predictive ability of tested linear lipid correction models available in the literature for mesopelagic fish in the mid-west and demersal fish at Site D2 were poor (Fig. 2). Significance analysis results indicated that significant correlations in C/Nmass and Δδ13C, but no common inconsistency was found between lipids and C/Nmass (Table 2), which means C/Nmass cannot be a reasonable indicator of lipid content in the two groups (Fagan et al., 2011). The suggested models could not accurately predict lipid content from bulk C/Nmass. However, bulk C/Nmass had shown a significant correlation with Δδ13C, which can still eliminate δ13C deviation, except for the demersal fish at Site D2. The inconsistency between lipids and C/Nmass in these fish might reflect spurious results in lipid categories, like that carbon mostly be stored as glycogen in oysters, which has a high C/Nmass but is not depleted in 13C, as mentioned in Patterson and Carmichael (2016).
Previous studies considered that the δ13C values were lipid normalized following the model of Post et al. (2007) when C/Nmass was larger than 3.5 in mesopelagic fish (Valls et al., 2014; Olivar et al., 2019). However, lipid correction was not well performed when the C/Nmass of mesopelagic fish was mainly less than 3.5 (McClain-Counts et al., 2017), indicating that C/Nmass were different of mesopelagic fish in regions. The C/Nmass was fitted well with Δδ13C, when we divided mesopelagic fish into north and mid-west SCS for lipid correction by using C/Nmass to Δδ13C (Figs 4a, b), in which the slope and intercept of the lipid correction model in the north are similar to those of the existing linear models (Post et al., 2007). Nevertheless, the linear regression for mesopelagic fish in the mid-west of the SCS has higher slopes and intercepts, suggesting that the relationships between C/Nmass and lipid correction may differ regionally and could be predictable in mesopelagic fish. We recommend that relationships over different regions should be developed in situations where lipid prediction is needed, rather than directly relying on published models.
The C/Nmass values of the demersal fish at Site D2 in the SCS were slightly lower than those in the continental Site D1 (Fig. 4c). However, the Δδ13C value of the demersal fish at Site D2 was higher than that in the Site D1, which can be explained by the fact that high lipid composition could maintain its periodical physiological requirements (Tocher, 2003). However, high lipid content did not lead to an increase in C/Nmass. On the contrary, the C/Nmass values of the demersal fish with high lipid content were relatively low, leading to a poor linear relationship between the C/Nmass value and Δδ13C (Yurkowski et al., 2015). However, the fitting result at Site D1 had a lower slope and higher intercept than the model, suggesting that the change of δ13C could be underestimated when C/Nmass was low and be overestimated when the C/Nmass was getting larger in this region. A growing body of evidence suggests that relying on C/Nmass ratios to determine the necessity of lipid content is overly simplistic (Cloyed et al., 2020; Fagan et al., 2011; Patterson and Carmichael, 2016; Wilson et al., 2014). Thus, the C/Nmass is not always a good predictor of lipid content in these species at Site D2. In the demersal fish at Site D2, where sound relationships cannot be estimated, chemical treatment was the most suitable method to determine δ13C values, due to a better fitting curve between lipid and Δδ13C (Stowasser et al., 2009a). Mathematical methods did not perform consistently by using C/Nmass ratios in those species (De Lecea and De Charmoy, 2015).
Lipid, carbon, and nitrogen variations in muscle tissues were significant (Cloyed et al., 2020; Fagan et al., 2011). Thus, the C/Nmass is inappropriate for lipid correction in special fish. The effect of lipids on δ13C might need careful consideration when C/Nmass is less than 3.5. Several researchers only proceeded with lipid-extract tissues when C/Nmass was larger than 3.5 due to such tissues being generally lipid-rich (Olivar et al., 2019). Our results show that the influence of biological factors needs to be considered to a certain extent when C/Nmass was lower than 3.5. Thus, the C/Nmass should be used more cautiously when establishing the lipid normalization model for the demersal fish in the SCS (Cloyed et al., 2020). Lipid extraction is recommended in these fish.
The mesopelagic fish were analyzed in the SCS with the literature data based on the fitting models and non-linear correction model of McConnaughey and McRoy (1979) and Wang et al. (2009). The δ13C variation equaled to zero when C/Nmass was 3.02 and assumed a linear relationship when C/Nmass was less than 5.5 (Eq. (5)) (Wang et al., 2009). As for mesopelagic fish in the SCS, lipid had little effect on C/Nmass values when C/Nmass less than 3.3. When the C/Nmass was 3.3−5.5, the linear correction models can be used to correct δ13C values with similar species and close life stages to this study. When C/Nmass was larger than 5.5, it had a non-linear correlation between C/Nmass and Δδ13C and the δ13C values for samples, such as reproduction period fish and fish livers, which could be normalized by non-linear models (Wang et al., 2009).
5.
Conclusions
The lipid content varies between mesopelagic and demersal fish in the SCS. We should consider the lipid effect in stable carbon isotopes when studying the trophic interactions of these fish. It is essential to eliminate the effect of lipid content by separating the fish into different groups when using δ13C to study trophic interactions among these fish. Additionally, we establish the lipid normalization model with the relationship of the C/Nmass and Δδ13C. However, the C/Nmass should be used more cautiously, especially for migratory mesopelagic fish and demersal fish in the SCS. The samples have to be categorized according to geographical regions and trophic specificity. This indicates that the single mathematical normalization model is not appropriate for correcting lipids of the mesopelagic and demersal fish in different regions and lifestyles in the SCS. This might be because of the differences in a geographical area, metabolic mechanism and lipid class.
We recommend that our models are applied to similar regions and life stages. It is important to note that sex gender and life stage may influence stable isotope values, which also impact lipid correction due to the premise hypothesis of our study. Subsequent refinement experiments for these factors might be necessary for analyzing more specific samples. In addition, future studies of lipid normalization in particular regions are necessary to take account of more subtle effects, such as environmental factors (water depth, temperature, and other factors) and different lipid types in metabolic processes.
Acknowledgements
We thank Guosen Zhang for measuring stable isotopes. We greatly appreciate the help of the crew of the R/V Nan Feng.
Abrantes K G, Semmens J M, Lyle J M, et al. 2012. Normalisation models for accounting for fat content in stable isotope measurements in salmonid muscle tissue. Marine Biology, 159(1): 57–64. doi: 10.1007/s00227-011-1789-1
Bowen W D, Boness D J, Oftedal O T. 1987. Mass transfer from mother to pup and subsequent mass loss by the weaned pup in the hooded seal, Cystophora cristata. Canadian Journal of Zoology, 65(1): 1–8. doi: 10.1139/z87-001
Catul V, Gauns M, Karuppasamy P K. 2011. A review on mesopelagic fishes belonging to family Myctophidae. Reviews in Fish Biology and Fisheries, 21(3): 339–354. doi: 10.1007/s11160-010-9176-4
Chen Suzhi. 2002. Fauna Sinica: Ostichthyes (Myctophiformmes, Cetomimiformes and Osteoglossiformes) (in Chinese). Beijing: Science Press, 1–304
Chen Dagang, Zhang Meizhao. 2015. Marine Fishes of China (in Chinese). Qingdao: China Ocean University Press, 1–2152
Cherel Y, Fontaine C, Richard P, et al. 2010. Isotopic niches and trophic levels of myctophid fishes and their predators in the Southern Ocean. Limnology & Oceanography, 55(1): 324–332. doi: 10.4319/lo.2010.55.1.0324
Cloyed C S, Dacosta K P, Hodanbosi M R, et al. 2020. The effects of lipid extraction on δ13C and δ15N values and use of lipid-correction models across tissues, taxa and trophic groups. Methods in Ecology and Evolution, 11(6): 751–762. doi: 10.1111/2041-210x.13386
Cloyed C S, Eason P K. 2016. Different ecological conditions support individual specialization in closely related, ecologically similar species. Evolutionary Ecology, 30(3): 379–400. doi: 10.1007/s10682-016-9825-8
Colaço A, Giacomello E, Porteiro F, et al. 2013. Trophodynamic studies on the Condor seamount (Azores, Portugal, North Atlantic). Deep-Sea Research Part II: Topical Studies in Oceanography, 98: 178–189. doi: 10.1016/j.dsr2.2013.01.010
Cui Ying, Wu Ying, Xu Zhaoli, et al. 2015. Potential dietary influence on the stable isotopes and fatty acid composition of migratory anchovy (Coilia mystus) around the Changjiang Estuary. Journal of the Marine Biological Association of the United Kingdom, 95(1): 193–205. doi: 10.1017/S0025315414000873
De Lecea A M, De Charmoy L. 2015. Chemical lipid extraction or mathematical isotope correction models: Should mathematical models be widely applied to marine species?. Rapid Communications in Mass Spectrometry, 29(21): 2013–2025. doi: 10.1002/rcm.7310
DeNiro M J, Epstein S. 1977. Mechanism of carbon isotope fractionation associated with lipid synthesis. Science, 197(4300): 261–263. doi: 10.1126/science.327543
Eduardo L N, Bertrand A, Mincarone M M, et al. 2021. Distribution, vertical migration, and trophic ecology of lanternfishes (Myctophidae) in the Southwestern Tropical Atlantic. Progress in Oceanography, 199: 102695. doi: 10.1016/j.pocean.2021.102695
Fagan K A, Koops M A, Arts M T, et al. 2011. Assessing the utility of C:N ratios for predicting lipid content in fishes. Canadian Journal of Fisheries and Aquatic Sciences, 68(2): 374–385. doi: 10.1139/f10-119
Fanelli E, Cartes J E, Papiol V. 2011. Food web structure of deep-sea macrozooplankton and micronekton off the Catalan slope: Insight from stable isotopes. Journal of Marine Systems, 87(1): 79–89. doi: 10.1016/j.jmarsys.2011.03.003
Flynn A J, Kloser R J. 2012. Cross-basin heterogeneity in lanternfish (family Myctophidae) assemblages and isotopic niches (δ13C and δ15N) in the southern Tasman Sea abyssal basin. Deep-Sea Research Part I: Oceanographic Research Papers, 69: 113–127. doi: 10.1016/j.dsr.2012.07.007
Folch J, Lees M, Stanley G H S. 1957. A simple method for the isolation and purification of total lipides from animal tissues. The Journal of Biological Chemistry, 226(1): 497–509. doi: 10.1016/S0021-9258(18)64849-5
Gong Yuyan, Chen Zuozhi, Zhang Jun, et al. 2015a. Feeding habits of Diaphus chrysorhynchus from continental slope region in northern South China Sea in autumn. South China Fisheries Science, 11(5): 90–99. doi: 10.3969/j.issn.2095-0780.2015.05.011
Gong Chenglin, Wang Yingmin, Xu Shang, et al. 2015b. The northeastern South China Sea margin created by the combined action of down-slope and along-slope processes: Processes, products and implications for exploration and paleoceanography. Marine & Petroleum Geology, 64: 233–249. doi: 10.1016/j.marpetgeo.2015.01.016
Hoffman J C, Sierszen M E, Cotter A M. 2015. Fish tissue lipid-C:N relationships for correcting δ13C values and estimating lipid content in aquatic food-web studies. Rapid Communications in Mass Spectrometry, 29(21): 2069–2077. doi: 10.1002/rcm.7367
Hoffman J C, Sutton T T. 2010. Lipid correction for carbon stable isotope analysis of deep-sea fishes. Deep-Sea Research Part I: Oceanographic Research Papers, 57(8): 956–964. doi: 10.1016/j.dsr.2010.05.003
Hu Jianyu, Kawamura H, Hong Huasheng, et al. 2000. A review on the currents in the South China Sea: seasonal circulation, South China Sea warm current and Kuroshio intrusion. Journal of Oceanography, 56(6): 607–624. doi: 10.1023/A:1011117531252
Hudson J M, Steinberg D K, Sutton T T, et al. 2014. Myctophid feeding ecology and carbon transport along the northern Mid-Atlantic Ridge. Deep-Sea Research Part I: Oceanographic Research Papers, 93: 104–116. doi: 10.1016/j.dsr.2014.07.002
Irigoien X, Klevjer T A, Røstad A, et al. 2014. Large mesopelagic fishes biomass and trophic efficiency in the open ocean. Nature Communications, 5: 3271. doi: 10.1038/ncomms4271
Jin Haiwei, Xue Lijian, Pan Guoliang, et al. 2011. Feeding habits of Benthosema pterotum in the East China Sea and southern part of Yellow Sea. Marine Fisheries, 33(4): 368–377. doi: 10.3969/j.issn.1004-2490.2011.04.002
Jónasdóttir S H, Visser A W, Richardson K, et al. 2015. Seasonal copepod lipid pump promotes carbon sequestration in the deep North Atlantic. Proceedings of the National Academy of Sciences of the United States of America, 112(39): 12122–12126. doi: 10.1073/pnas.1512110112
Kong Xiaolan, Jiang Yane, Gong Yuyan, et al. 2016. A preliminary study on fishery biology of Ceratoscopelus warmingii in the central and northern South China Sea. South China Fisheries Science, 12(4): 117–124. doi: 10.3969/j.issn.2095-0780.2016.04.015
Layman C A, Arrington D A, Montaña C G, et al. 2007. Can stable isotope ratios provide for community-wide measures of trophic structure?. Ecology, 88(1): 42–48. doi: 10.1890/0012-9658(2007)88[42:CSIRPF]2.0.CO;2
Li Kaizhi, Yin Jianqiang, Huang Liangmin, et al. 2011. Distribution and abundance of thaliaceans in the northwest continental shelf of South China Sea, with response to environmental factors driven by monsoon. Continental Shelf Research, 31(9): 979–989. doi: 10.1016/j.csr.2011.03.004
Lin Mao, Lin Rongcheng. 2006. Seasonal abundance and distribution of pelagic tunicates (Chordata: Thaliacea) in the central South China Sea. Acta Oceanologica Sinica, 25(3): 148–156
Logan J M, Jardine T D, Miller T J, et al. 2008. Lipid corrections in carbon and nitrogen stable isotope analyses: comparison of chemical extraction and modelling methods. Journal of Animal Ecology, 77(4): 838–846. doi: 10.1111/j.1365-2656.2008.01394.x
Masuda H, Amaoka K, Araga C, et al. 1984. The Fishes of the Japanese Archipelago. Tokyo: Tokal University Press, 1–374
McClain-Counts J P, Demopoulos A W J, Ross S W. 2017. Trophic structure of mesopelagic fishes in the Gulf of Mexico revealed by gut content and stable isotope analyses. Marine Ecology, 38(4): e12449. doi: 10.1111/maec.12449
McConnaughey T, Mcroy C P. 1979. Food-web structure and the fractionation of carbon isotopes in the Bering Sea. Marine Biology, 53(3): 257–262. doi: 10.1007/bf00952434
Molina-Valdivia V, Bustos C A, Castillo M I, et al. 2021. Oceanographic influences on the early life stages of a mesopelagic fish across the Chilean Patagonia. Progress in Oceanography, 195: 102572. doi: 10.1016/j.pocean.2021.102572
Newsome S D, Chivers S J, Kowalewski M B. 2018. The influence of lipid-extraction and long-term DMSO preservation on carbon (δ13C) and nitrogen (δ15N) isotope values in cetacean skin. Marine Mammal Science, 34(2): 277–293. doi: 10.1111/mms.12454
Newsome S D, Clementz M T, Koch P L. 2010. Using stable isotope biogeochemistry to study marine mammal ecology. Marine Mammal Science, 26(3): 509–572. doi: 10.1111/j.1748-7692.2009.00354.x
Olivar M P, Bernal A, Molí B, et al. 2012. Vertical distribution, diversity and assemblages of mesopelagic fishes in the western Mediterranean. Deep-Sea Research Part I: Oceanographic Research Papers, 62: 53–69. doi: 10.1016/j.dsr.2011.12.014
Olivar M P, Bode A, López-Pérez C, et al. 2019. Trophic position of lanternfishes (Pisces: Myctophidae) of the tropical and equatorial Atlantic estimated using stable isotopes. ICES Journal of Marine Science, 76(3): 649–661. doi: 10.1093/icesjms/fsx243
Park H J, Park T H, Lee C I, et al. 2018. Ontogenetic shifts in diet and trophic position of walleye pollock, Theragra chalcogramma, in the western East Sea (Japan Sea) revealed by stable isotope and stomach content analyses. Fisheries Research, 204: 297–304. doi: 10.1016/j.fishres.2018.03.006
Patterson H K, Carmichael R H. 2016. The effect of lipid extraction on carbon and nitrogen stable isotope ratios in oyster tissues: Implications for glycogen-rich species. Rapid Communications in Mass Spectrometry, 30(24): 2594–2600. doi: 10.1002/rcm.7759
Peterson B J, Fry B. 1987. Stable isotopes in ecosystem studies. Annual Review of Ecology & Systematics, 18(1): 293–320. doi: 10.1146/annurev.es.18.110187.001453
Post D M, Layman C A, Arrington D A, et al. 2007. Getting to the fat of the matter: models, methods and assumptions for dealing with lipids in stable isotope analyses. Oecologia, 152(1): 179–189. doi: 10.1007/s00442-006-0630-x
Quintana-Rizzo E, Torres J J, Ross S W, et al. 2015. δ13C and δ15N in deep-living fishes and shrimps after the Deepwater Horizon oil spill, Gulf of Mexico. Marine Pollution Bulletin, 94(1–2): 241–250. doi: 10.1016/j.marpolbul.2015.02.002
Richards T M, Gipson E E, Cook A, et al. 2019. Trophic ecology of meso- and bathypelagic predatory fishes in the Gulf of Mexico. ICES Journal of Marine Science, 76(3): 662–672. doi: 10.1093/icesjms/fsy074
Saito H, Murata M. 1998. Origin of the monoene fats in the lipid of midwater fishes: relationship between the lipids of myctophids and those of their prey. Marine Ecology Progress Series, 168: 21–33. doi: 10.3354/meps168021
Satterfield F R, Finney B P. 2002. Stable isotope analysis of Pacific salmon: insight into trophic status and oceanographic conditions over the last 30 years. Progress in Oceanography, 53(2–4): 231–246,
Shen Shih-chieh. 1993. Fishes of Taiwan (in Chinese). Taipei: National Taiwan University, 1–960
Stowasser G, McAllen R, Pierce G J, et al. 2009a. Trophic position of deep-sea fish—Assessment through fatty acid and stable isotope analyses. Deep-Sea Research Part I: Oceanographic Research Papers, 56(5): 812–826. doi: 10.1016/j.dsr.2008.12.016
Stowasser G, Pond D W, Collins M A. 2009b. Using fatty acid analysis to elucidate the feeding habits of Southern Ocean mesopelagic fish. Marine Biology, 156(11): 2289–2302. doi: 10.1007/s00227-009-1256-4
Su Jilan. 2004. Overview of the South China Sea circulation and its influence on the coastal physical oceanography outside the Pearl River Estuary. Continental Shelf Research, 24(16): 1745–1760. doi: 10.1016/j.csr.2004.06.005
Sun Dianrong, Chen Zheng. 2013. Review of Fishes of South China Sea: Volume One (in Chinese). Beijing: China Ocean Press, 1–606
Sutton T T. 2013. Vertical ecology of the pelagic ocean: classical patterns and new perspectives. Journal of Fish Biology, 83(6): 1508–1527. doi: 10.1111/jfb.12263
Svensson E, Freitas V, Schouten S, et al. 2014. Comparison of the stable carbon and nitrogen isotopic values of gill and white muscle tissue of fish. Journal of Experimental Marine Biology & Ecology, 457: 173–179. doi: 10.1016/j.jembe.2014.04.014
Tocher D R. 2003. Metabolism and functions of lipids and fatty acids in teleost fish. Reviews in Fisheries Science, 11(2): 107–184. doi: 10.1080/713610925
Valls M, Olivar M P, Fernández de Puelles M L, et al. 2014. Trophic structure of mesopelagic fishes in the western Mediterranean based on stable isotopes of carbon and nitrogen. Journal of Marine Systems, 138: 160–170. doi: 10.1016/j.jmarsys.2014.04.007
Wan Ruijing, Wu Ying, Huang Liang, et al. 2010. Fatty acids and stable isotopes of a marine ecosystem: study on the Japanese anchovy (Engraulis japonicus) food web in the Yellow Sea. Deep-Sea Research Part II: Topical Studies in Oceanography, 57(11–12): 1047–1057,
Wang Fuqiang, Wu Ying, Chen Zuozhi, et al. 2019a. Trophic interactions of mesopelagic fishes in the South China Sea illustrated by stable isotopes and fatty acids. Frontiers in Marine Science, 5: 522. doi: 10.3389/fmars.2018.00522
Wang Fuqiang, Wu Ying, Cui Ying, et al. 2019b. δ13C and fatty acid composition of mesopelagic fishes in the South China Sea and their influence factors. Chemistry and Ecology, 35(9): 788–804. doi: 10.1080/02757540.2019.1651844
Wang Na, Wu Ying, Zhang Jing. 2009. Comparison and unification of carbon stable isotope ratios in specific aquatic biota. Communications in Nonlinear Science and Numerical Simulation, 14(5): 2502–2506. doi: 10.1016/j.cnsns.2008.05.015
Weldrick C K, Trebilco R, Swadling K M. 2019. Can lipid removal affect interpretation of resource partitioning from stable isotopes in Southern Ocean pteropods?. Rapid Communications in Mass Spectrometry, 33(6): 569–578. doi: 10.1002/rcm.8384
Yu Jie, Chen Guobao, Zhang Kui, et al. 2016. Vertical distribution of summer chlorophyll a concentration in the middle South China Sea. South China Fisheries Science, 12(4): 1–8
Yurkowski D J, Hussey N E, Semeniuk C, et al. 2015. Effects of lipid extraction and the utility of lipid normalization models on δ13C and δ15N values in Arctic marine mammal tissues. Polar Biology, 38(2): 131–143. doi: 10.1007/s00300-014-1571-1
Zhang Yi, Li Jie, Cheng Xuhua, et al. 2018. Community differentiation of bacterioplankton in the epipelagic layer in the South China Sea. Ecology and Evolution, 8(10): 4932–4948. doi: 10.1002/ece3.4064
Zhang Jun, Wang Xinliang, Jiang Yane, et al. 2019. Species composition and biomass density of mesopelagic nekton of the South China Sea continental slope. Deep-Sea Research Part II: Topical Studies in Oceanography, 167: 105–120. doi: 10.1016/j.dsr2.2018.06.008
Linyu Wang, Fuqiang Wang, Zuozhi Chen, Ying Wu. The influence of lipid-extraction on the δ13C of mesopelagic and demersal fish in the South China Sea: modification and application of lipid normalization models[J]. Acta Oceanologica Sinica, 2023, 42(1): 35-43. doi: 10.1007/s13131-022-2045-x
Linyu Wang, Fuqiang Wang, Zuozhi Chen, Ying Wu. The influence of lipid-extraction on the δ13C of mesopelagic and demersal fish in the South China Sea: modification and application of lipid normalization models[J]. Acta Oceanologica Sinica, 2023, 42(1): 35-43. doi: 10.1007/s13131-022-2045-x
Table
2.
Mean±SD lipid content, carbon content to nitrogen content ratios (C/Nmass), total nitrogen content (TN), total organic carbon content (TOC), and Δδ13C (the difference between bulk and lipid-extracted δ13C) in four regions of the SCS. Pearson correlation coefficient tested the correlation between lipid content and C/Nmass, C/Nmass and Δδ13C
Region
Lipid content/%
C/Nmass
TN/%
TOC/%
Δδ13C/‰
Lipid content vs. C/Nmass
C/Nmass vs. Δδ13C
P
Pearson corr.
P
Pearson corr.
North slope
30.4±6.6
3.7±0.6
10.5±1.0
40.7±5.0*
0.9±0.7*
< 0.01
0.38
< 0.01
0.77
Mid-west
31.7±5.9
3.7±0.6
9.2±1.0*
32.9±3.2*
1.2±0.6
0.69
−0.09
< 0.01
0.95
Site D1
16.7±6.9
3.5±0.4
12.8±2.1
43.8±5.9
0.4±0.2
< 0.01
0.86
< 0.01
0.84
Site D2
24.5±6.8
3.1±0.2
12.1±0.3
37.5±1.6
0.9±0.2
0.06
0.53
0.03
0.57
Note: *represents a significant difference in ANOVA for different migration habits in mesopelagic fish with significant value P<0.05.
Figure 1. Map of sample collection regions in the South China Sea (SCS) (a): the north slope of the SCS (b); the mid-western SCS (c). L1–L10 represent sampling sites of mesopelagic fish on the northern slope of the SCS; D1 and D2 are sampling sites of demersal fish in the continental shelf area and shrimp farm zone of the SCS; S1–S6 represent sampling sites in the mid-western SCS.
Figure 2. The difference between Δδ13Cextraction and Δδ13Ctheory in four groups of fish in the SCS. Δδ13Cextraction: the difference between bulk and lipid-extracted δ13C. Δδ13Ctheory: Δδ13C was calculated using the lipid normalization model (Post et al., 2007). Grey area: ±0.2‰ error range.
Figure 3. The percentage of lipid content, total nitrogen (TN), and total organic carbon (TOC) in mesopelagic and demersal fish in the South China Sea (SCS).
Figure 4. The linear relationship between C/Nmass and Δδ13C of mesopelagic fish in the northern (a), mid-western (b), and demersal fish (c) in two sites of the South China Sea (SCS). Grey area: 95% confidence interval.
Figure 5. The non-linear relationship between C/Nmass and Δδ13C of mesopelagic fish in the northern, mid-western and demersal fish in the South China Sea (SCS).


 DownLoad:


 DownLoad:


 DownLoad:


