Dong Li, Jun Zhao, Chenggang Liu, Jianming Pan, Ji Hu. Lateral downslope transport and tentative sedimentary organic carbon box model in the southern Yap Trench, western Pacific Ocean[J]. Acta Oceanologica Sinica, 2023, 42(1): 61-74. doi: 10.1007/s13131-022-2043-z
Citation:
Dong Li, Jun Zhao, Chenggang Liu, Jianming Pan, Ji Hu. Lateral downslope transport and tentative sedimentary organic carbon box model in the southern Yap Trench, western Pacific Ocean[J]. Acta Oceanologica Sinica, 2023, 42(1): 61-74. doi: 10.1007/s13131-022-2043-z
Dong Li, Jun Zhao, Chenggang Liu, Jianming Pan, Ji Hu. Lateral downslope transport and tentative sedimentary organic carbon box model in the southern Yap Trench, western Pacific Ocean[J]. Acta Oceanologica Sinica, 2023, 42(1): 61-74. doi: 10.1007/s13131-022-2043-z
Citation:
Dong Li, Jun Zhao, Chenggang Liu, Jianming Pan, Ji Hu. Lateral downslope transport and tentative sedimentary organic carbon box model in the southern Yap Trench, western Pacific Ocean[J]. Acta Oceanologica Sinica, 2023, 42(1): 61-74. doi: 10.1007/s13131-022-2043-z
Key Laboratory of Marine Ecosystem Dynamics, Second Institute of Oceanography, Ministry of Natural Resources, Hangzhou 310012, China
Funds:
The Scientific Research Fund of the Second Institute of Oceanography under contract Nos JG2011 and JG1516; the National Natural Science Foundation of China under contract No. 41606090; the National Basic Research Program (973 Program) of China under contract No. 2015CB755904.
Sediment collapse and subsequent lateral downslope migration play important roles in shaping the habitats and regulating sedimentary organic carbon (SOC) cycling in hadal trenches. In this study, three sediment cores were collected using a human-occupied vehicle across the axis of the southern Yap Trench (SYT). The total organic carbon (TOC) and total nitrogen (TN) contents, δ13C, radiocarbon ages, specific surface areas, and grain size compositions of sediments from three cores were measured. We explored the influence of the lateral downslope transport on the dispersal of the sediments and established a tentative box model for the SOC balance. In the SYT, the surface TOC content decreased with water depth and was decoupled by the funneling effect of the V-shaped hadal trench. However, the sedimentation (0.002 5 cm/a) and SOC accumulation rates (~0.038 g/(m2·a) (in terms of OC)) were approximately 50% higher in the deeper hadal region than in the abyssal region (0.001 6 cm/a and ~0.026 g/(m2·a) (in terms of OC), respectively), indicating the occurrence of lateral downslope transport. The fluctuating variations in the prokaryotic abundances and the SOC accumulation rate suggest the periodic input of surficial sediments from the shallow region. The similar average TOC (0.31%–0.38%), TN (0.06%–0.07%) contents, and SOC compositions (terrestrial OC (11%–18%), marine phytoplanktonic OC (45%–53%), and microbial OC (32%–44%)) of the three sites indicate that the lateral downslope transport has a significant mixing effect on the SOC composition. The output fluxes of the laterally transported SOC (0.44–0.56 g/(m2·a) (in terms of OC)) contributed approximately (47%–73%) of the total SOC input, and this proportion increased with water depth. The results of this study demonstrate the importance of lateral downslope transport in the spatial distribution and development of biomes.
Figure
1.
Conceptual model of the hadal trench (a); three topographic profiles of the Yap Trench (YT) (b); and locations of three push core sediments in the southern Yap Trench (SYT) (c, d). In a, the blue arrows indicate the organic carbon input pathways (e.g., the biological pump and lateral downslope current); the yellow shaded area represents the nepheloid layer; and the dark yellow sector represents the turbidity currents. In b and d, the red dots indicate the sample sites. In c and d, the brown lines indicate the positions of the seismic profiles in the YT. PHP: Philippine Plate; PAP: Pacific Plate; CAP: Caroline Plate; NA: Ngululu Atoll; YI: Yap Island; NYT: northern Yap Trench; SMT: southern Mariana Trench; SOT: Sorol Trough; WCR: West Caroline Rise; CIR: Caroline Island Ridge.
In trenches with intense plate activity and steep terrain, sediment collapse and subsequent gravitational sediment transport along the trench slope (vertical migration of sediments in the form of turbidity currents and nepheloid layers) occur (Li et al., 2020b; Schwestermann et al., 2021) (Fig. 1). These processes have been demonstrated to be the factors controlling the dispersal of the SOC along the trench wall and the rapid SOC accumulation at the bottom of the trench (Nozaki and Ohta, 1993; Oguri et al., 2013; Luo et al., 2017, 2018b; Bao et al., 2018; Li et al., 2020a; Schwestermann et al., 2021). However, research on this subject is scarce and the results are somewhat controversial.
For example, several studies have proposed that much more fresh material is delivered to the bottom of the trench (e.g., the higher fresh marine phytoplankton-derived chloropigment contents and 210Pb inventory in the Mariana Trench, Kermadec Trench, and Tonga Trench) (Turnewitsch et al., 2014; Ichino et al., 2015; Leduc et al., 2016; Luo et al., 2017; Schwestermann et al., 2021). In contrast, more recent studies suggest that tectonically triggered sediment collapse leads to the entrainment of old organic carbon (OC) or enhanced proportions of recalcitrant OC at the bottom of the trench (e.g., the Japan Trench and northern Yap Trench (NYT); Bao et al., 2018; Li et al., 2020b). These inconsistencies indicate that different lateral migration processes and diverse SOC sorting occur in hadal trenches. Large scale plate movement, seismic activity, and local topography may affect the strength and frequency of the flushing and winnowing events that dominate the lateral remobilization of trench sediments (Schwestermann et al., 2021). Thus, knowledge of OC transfer and deposition and quantitative estimations of the magnitude of the laterally transported OC and SOC balance are of great importance to fully understanding the physical and biological cycling of nutrients, and even the evolution of life in hadal trenches (Schwestermann et al., 2021).
The Yap Trench (YT) is located in the equatorial western Pacific Ocean, and it is the junction between the Philippine Plate, the Pacific Plate, and the Caroline Plate (Fig. 1c). Due to plate subduction, the YT has a fairly steep trench wall and experiences occasional seismic activity, which induces sediment collapse and gravity currents. This is demonstrated by the appearance of calcareous oozes in the deep part of the trench (http://earthquake.usgs.gov/earthquakes/search/; Yang et al., 2018; Yue et al., 2018; Li et al., 2020a). Since in-situ observations are difficult to carry out due to technological limitations (Glud et al., 2013, 2021; Liu and Peng, 2019), the organic geochemical indicators and their fingerprints recorded in the hadal sediments become ideal tools for studying the phenomena and processes that occur in hadal trenches (Luo et al., 2017, 2018a, 2019; Li et al., 2020b, 2021; Xiao et al., 2020a).
In order to quantitatively evaluate the effect of lateral downslope transport process on the SOC source to sink processes in hadal trench, three sediment push-cores were collected from different depths in sides of the southern YT (SYT) using the manned submersible vehicle bathyscaph Jiaolong. The sedimentary grain size composition, specific surface area (SSA), total organic carbon (TOC) and total nitrogen (TN) contents, as well as isotopic composition (13C and 14C) were analyzed. A three end-member model was used to quantitatively track the dispersal of the different OC sources. In addition, based on radiocarbon dating and a fitting formula, a SOC box model that includes burial, re-mineralization, downslope migration, and primary production sinking fluxes was developed. This work will contribute to a comprehensive understanding of the SOC cycling patterns in hadal trenches by comparing the SOC transport, deposition, and burial in three adjacent trenches (i.e., the SYT, NYT, and southern Mariana Trench (SMT)).
2.
Materials and methods
2.1
Study area and samples
The YT can be spatially divided into southern and northern sections based on the location of the YT relative to the Caroline Ridge and the Sorol Trough (Xia et al., 2020), i.e., where the three tectonic plates collide with each other (around 9.5°N, 138.5°E) (Yang et al., 2018) (Fig. 1). A periodic internal tide, inertial currents, and counterclockwise circulation have been observed in the northern and southern parts of the YT, and the bottom current in the northern segment has a much higher velocity, especially on the landward trench slope (Liu et al., 2018; field observations). The shallow earthquakes (epicenter shallower than 10 km) in the NYT are stronger (~46% of earthquakes with magnitude>5) and more frequent than those in the SYT (~17%) (http://earthquake.usgs.gov/earthquakes/search/; Xia et al., 2020) (Table 1). Moreover, compared to the fairly smooth slope of the SYT, there are more folds (e.g., slope breaks and local uplift on the landward slope and in horsts and grabens on the oceanward trench slope) in the NYT due to the different frictional surfaces of the obducting and subducting plates (Xia et al., 2020) (Fig. 1). The mean slope of the trench wall increases by around 40% from the NYT (mean of ~4.8°) to the SYT (mean of ~6.7°) (Zhang et al., 2019).
Table
1.
Summary of earthquake events in the southern and northern Yap Trenches (SYT and NYT), southern Mariana Trench (SMT), and Japan Trench since 1900 AD (data from http://earthquake.usgs.gov/earthquakes/search/, United States Geological Survey Earthquake Hazards Program). The data in parentheses represents the proportion of shallow earthquakes
Magnitude 5–6
Magnitude 6–7
Magnitude>7
Average proportion of shallow earthquakes
SYT (7.0°–9.5°N)
20 (20%)
7 (14%)
2 (0)
17% (5/29)
NYT (9.5°–11.5°N)
23 (43%)
1 (100%)
0
46% (11/24)
SMT (10.5°–13.0°N)
519 (6%)
34 (12%)
3 (0)
6% (35/556)
Japan Trench (34.0°–41.0°N)
1 434 (11%)
271 (10%)
45 (4%)
11% (187/1 750)
Note: The data in parentheses represent the proportion of shallow earthquakes (epicenters shallower than 10 km).
In this study, three sediment push-cores were collected across the axis of the SYT using the manned submersible vehicle bathyscaph Jiaolong aboard the R/V Xiangyanghong 09 during the cruises of the 38th China's Oceanic Expeditions in June 2017. The in-situ collection using the controlled mechanical arm of the bathyscaph minimized the sediment disturbance (field sampling photos are shown in Fig. S1), which was unavoidable in most previous studies (Luo et al., 2017, 2018b). In this study, Core DIVE149 (8.06°N, 137.55°E, 4 993 m deep, 14 cm long) was collected from the shallow western edge of the SYT. Core DIVE151 (8.04°N, 137.63°E, 6 582 m deep, 21 cm long) was collected from a deeper region on the landward trench wall. Core DIVE152 (8.02°N, 137.84°E, 6 681 m deep, 18 cm long) was collected from a deeper region on the ocean-ward trench wall (Figs 1b, d). These cores were sliced at 1−2 cm intervals and stored at −20°C in a freezer onboard the ship prior to further laboratory analysis.
2.2
Analytical methods
The analytical methods used to obtain the bulk data have been described in previous studies and have been proven to be suitable for analysis of hadal sediments (Li et al., 2020a, b). Briefly, the wet density of the sediment was calculated by dividing the wet mass by the volume of the wet sediment. The dry density was calculated by dividing the dry mass by the volume of the dry sediment. The moisture content was defined as the weight percentage of the water in the wet sample. The grain-size composition of the unground sediments was determined using a laser particle size analyzer (Mastersizer 3000, Malven Instruments Ltd., UK) following the method proposed by Hu et al. (2009), with a precision of ±3% (n=6). Particles with size>63 μm were classified as sand, the 4–63 μm particles were classified as silt, and the <4 μm particles were classified as clay. Following the method of Waterson and Canuel (2008) with slight modifications, the SSA of the precombusted sediments (350°C for 12 h) was conducted using the multi-point Brunauer-Emmett-Teller method and an automatic surface analyzer (3H-2000PS1, Beishide Instrument Technology Co., Ltd., China). After the removal of the carbonate fraction by fumigation with hydrochloric acid vapor following the procedure of Li et al. (2011), the TOC content (analytical precision of ±0.02 wt.%, n=6), TN content (analytical precision of ±0.01 wt.%, n=6), and the 13C stable isotope compositions of OC were determined using a Flash EA 1112 HT nitrogen/carbon analyzer (Thermo Electron SPA, USA) interfaced with a DELTA V Advantage continuous flow isotope ratio mass spectrometer (Thermo Finnigan Instruments, USA). The 13C/12C ratios (precision of ±0.1‰, n=6) are reported using δ notation (δ13C) in units of per mil (‰) relative to the Vienna Pee Dee Belemnite (V-PDB) standard.
The radiocarbon analyses of the bulk organic carbon from the surface and bottom layers of the core sediments (the lengths of cores DIVE149, DIVE151 and DIVE152 are 14 cm, 21 cm and 18 cm, respectively) obtained from the study area were conducted at the Beta Analytic Radiocarbon Dating Laboratory (Miami, FL, USA). After complete removal of the carbonate from the sediment samples, the SOC was combusted to CO2 and converted to graphite, and analyzed using a 250 keV NEC single-stage accelerator mass spectrometer (AMS). The 14C-AMS ages were converted to calendar years before the present (a BP, relative to 1950 AD) using the MARINE 13 database (including the global marine reservoir correction) and the 2013 INTCal program calibration curve (Talma and Vogel, 1993; Reimer et al., 2013). The radiocarbon values are reported as Δ14C (‰), and the calibrated age is in a BP.
2.3
Sediment chronology
Compared with other seismically active hadal trenches (e.g., the Japan Trench and the SMT), the frequency of the seismic activity in the YT is much lower (Table 1). For example, the frequency of earthquake events with a magnitude greater than 6.0 was approximately 10 and 27 times lower than those of the Mariana Trench and Japan Trench, respectively (http://earthquake.usgs.gov/earthquakes/search/). The influence of severe earthquake-induced sediment migration and its impact on the disturbance of the sedimentary sequence is considered to be limited in the study area (Li et al., 2020a), which is consistent with the infrequent fluctuations in the wet density (Fig. 2a, 9.5 cm in Core DIVE149). A significant contribution of 14C-dead terrestrial soil-derived OC is unlikely based on the absence of large-scale terrestrial land runoff near the SYT (Li et al., 2020b). In addition, the terrestrial OC is fairly steady and its reservoir effect should be limited (Fig. 3). Furthermore, the sediment cores used in this study were collected in-situ using a mechanical arm, this could avoid dozens of centimeters of sediment disturbance induced by a gravity column or a box-type sampler. Under this circumstance, despite its uncertainties, the average sedimentation rate of the trench sediment core can be approximately calculated based on the linear interpolation of the radiocarbon ages of the surface and bottom control points (Table 2). This method has been successfully applied in hadal environments (e.g., the Mariana Trench and Yap Trench; Luo et al., 2018b; Li et al., 2020b).
Figure
2.
Vertical distribution of the bulk data for the sites. TOC is total organic carbon; MGS, the median grain size; TN, total nitrogen; C/N, the ratio of total carbon content vs. total nitrogen content; SSA, specific surface area. The blue squares, red dots, and green triangles represent the sediment samples from Cores DIVE149, DIVE151, and DIVE152, respectively.
Figure
3.
Vertical profiles of the organic carbon (OC) proportions (P) (a, b, c) and contents (d, e, f) of the marine, terrestrial, and microorganism-reworked OC, respectively, in the southern Yap Trench (SYT) obtained using the Monte Carlo simulation (error bar: ±SD). The blue squares, red dots, and green triangles represent the sediment samples from Cores DIVE149, DIVE151, and DIVE152, respectively.
The three end-member mixing model that uses the δ13C and molar C/N ratio (total organic carbon content vs. total nitrogen content) as source markers has been successfully applied to hadal trenches (Li et al., 2020a), and the details of its applicability are discussed in the supplementary materials (Fig. S2). The various proportions (including the mean relative contributions and standard deviations) of marine phytoplanktonic (OCmar), terrestrial vascular (OCterr), and microbe-reworked OC (OCmicro; including in-situ living microorganisms, dead organisms, debris, and utilized allochthonous OC) in the total SOC pool were quantitatively calculated. According to the method of Li et al. (2020b), the end-member C/N ratio values for the OCmar, OCterr, and OCmicro were set to 6.5±0.3, 14.6±0.8, and 3.7±0.2, respectively; and the δ13C end-member values for the OCmar, OCterr, and OCmicro were set to −20.0‰±1.0‰, −25.6‰±1.0‰, and −20.0‰±3.0‰, respectively.
The Monte Carlo simulation strategy was used to assess source variability and avoid errors that arise from the arbitrary assignment of end-member values (Andersson, 2011). In this simulation strategy, the end member values were not fixed and were assumed to follow a normal distribution with a given average and standard deviation. In addition, the calculated proportions of the three OC sources were described in terms of their means and standard deviations. The variations in the calculated mean proportions of each SOC source were 0.03% on average based on seven repetitions of the Monte Carlo simulation.
The statistical analysis was performed using SPSS 24 (IBM, Armonk, NY, USA). One-way analysis of the variance, Pearson correlation analysis, a two-tailed significance test, and R-mode cluster analysis were performed on a set of geochemical data (e.g., density, element contents, and grain size composition) to determine the internal relationships (e.g., correlation coefficients (r), associated levels of significance (p), and classification) in the data for the different regions (p<0.05). Detailed information of R-mode cluster analysis has been described in Hayward et al. (2004).
2.5
Development of the box model for the SOC balance
An approximate SOC box model for Sites DIVE149, DIVE151, DIVE152, and a hypothetical reference site (Sitebottom) located at the bottom of the SYT (a point chosen as the orthogonal point from Site DIVE151 to the trench axis, ~7 960 m) were established. This box model consists of five parts: the input flux of the primary production-derived phytoplankton OC (Fin-PP) and the potential terrestrial OC from the adjacent island (Fin-Terr), the output flux of the re-mineralized SOC (Fout-Re), the burial flux of the SOC (Fbur), the flux of the laterally transported SOC along the trench wall (including the input and output fluxes in each cell, i.e., Fin-lateral and Fout-lateral), and the input and output fluxes of the horizontal migration of the SOC parallel to the trench axis in each cell (Fin-horizontal and Fout-horizontal). Fin-horizontal and Fout-horizontal are assumed to offset each other, so they were not calculated (Ichino et al., 2015).
2.5.1
Settling flux out of the euphotic layer
The marine snow derived OC and the terrigenous OC delivered from the adjacent islands are the initial sources of the SOC in the hadal trench (Fig. 1a). Since field measurements of Fin-PP and Fin-Terr were unavailable, the Fin-PP values of the phytoplankton derived OC of the sites in the deep SYT were calculated using the particulate organic carbon (POC) production rate in the euphotic layer (Lutz et al., 2007) and empirical algorithms:
where Cflux(Z) is the OC settling flux at a certain water depth (Z) in the deep ocean (Six and Maier-Reimer, 1996; Dymond et al., 1997; Tyrrell, 1999), and CPP is the marine primary production rate in a certain trench (~59 g/(m2·a) (in terms of OC) in the SMT and ~82 g/(m2·a) (in terms of OC) in the YT; data from Stewart and Jamieson (2018)). The Fin-Terr value of the terrestrial OC was approximately calculated as the average proportion of the terrestrial OC in the total OC pool of the shallowest sediment core (i.e., Core DIVE149 from the SYT).
2.5.2
Burial of the SOC
In this study, the SOC burial rate (Fbur) was defined as the mean accumulation rate of the last three layers of sediments in the core, which represents the asymptotic value at an infinite depth. The accumulation rates of the SOC in the SYT were calculated using the following equation:
where Raccumulate is the accumulation rate; TOCwet sediment was calculated from the TOC content of the dry sediment based on density. For Sitebottom, the burial rate of this site was calculated as the difference between the total input flux (i.e., the sum of Fin-PP and Fin-lateral for the two flanks of the trench) and the total output flux (Fout-Re) of the SOC.
Figure
4.
Relationships between the water depth and the DO uptake rate, and the water depth and the remineralization rate of the sedimentary organic carbon (SOC). The data for the Mariana and Tonga trenches is from Glud et al. (2013), Wenzhӧfer et al. (2016), Luo et al. (2018b), and Liu and Peng (2019). The dashed lines are the linear fitting curves with fitting formulas and a significance level of p<0.05. RSOC re-mineralization is the rate of SOC re-mineralization.
Recent studies have reported that the sediment oxygen consumption flux is dominated by the vertical settling flux of the primary production-derived OC and the SOC supply of the sediments (Luo et al., 2018b; Glud et al., 2021). Moreover, DO content (~5.1 mg/L), surface TOC content (~0.59% of SYT), δ13C of the SOC (~−20.0‰), and vertical settling flux of the primary production-derived OC (~0.56 g/(m2·a) (in terms of OC)) of the YT are similar to those of the SMT and the Tonga Trench (e.g., DO: ~5.9 mg/L; TOC: ~0.50%; δ13C:~−20.6‰; and primary production: ~0.55 g/(m2·a) (in terms of OC)) (Glud et al., 2013; Luo et al., 2018b; Stewart and Jamieson, 2018). Based on this, since field measurements of the benthic DO consumption in the SYT are unavailable, the empirical formula calculated for the SMT and the Tonga Trench was used in this study. The linear fitting equation is as follows:
The lateral downslope migration fluxes of the SOC (Fin-lateral and Fout-lateral) along the two flanks of the SYT were calculated from the difference between the total OC input and output fluxes. For Site DIVE149, Fin-lateral was assumed to be 0, and Fout-lateral was calculated using the following equation:
For Site DIVE151, Fin-lateral was assumed to be equal to the Fout-lateral for Site DIVE149, and Fout-lateral was calculated using the following equation:
Sitebottom receives the lateral SOC transport fluxes from the two flanks, so Fin-lateral was assumed to be the sum of the Fout-lateral values of Sites DIVE151 and DIVE152, and Fout-lateral was assumed to be 0 g/(m2·a) (in terms of OC).
3.
Results
3.1
Bulk sediment properties
The compositions of the bulk sediments in the SYT are presented in Fig. 2 and Tables S1–S3. Briefly, the fine-grained sediments (i.e., clay and silt) are dominant in the cores of SYT, and their proportions increase slightly from the trench edge site to the deeper regions. In contrast, the coarser sand-sized sediments only account for a small proportion and decrease with water depth. As for the vertical profiles of the grain size compositions, no remarkable variation is observed (Figs 2g–i). Correspondingly, the median grain size (MGS) sediments decrease in size from ~14 μm at the trench edge to ~7 μm in the deeper sites (p<0.01) (Tables S1–S3). As for the vertical profile of MGS, no obvious variation trend is observed among there cores. The shallowest trench edge site exhibits the strongest grain size composition fluctuations, compared to the other two cores in deeper hadal region (Figs 2f–i).
Similar to the grain size composition, the SSA values of the sites with deeper water depths (DIVE151: (42±4) m2/g; DIVE152: (42±8) m2/g) are slightly higher than those of shallower Site DIVE149 ((32±9) m2/g) (p<0.01) (Fig. 2j, Tables S1–S3). The SSA values are negatively correlated with the MGS in three sediment cores (r=−0.54, p<0.01). And similar with MGS, Site DIVE149 shows the strongest of SSA fluctuations among three sites. The wet density of the sediments ranges from (1.3±0.1) g/cm3 on the ocean-ward trench wall to (1.5±0.3) g/cm3 on the landward trench wall. Vertically, the wet density of the sediments from the three cores all exhibit gradual increases with depth, with a peak value existing at ~10 cm in Site DIVE149 (Fig. 2a). In comparison, the moisture contents (around (64%−70%)) and dry densities (around (0.4–0.6) g/cm3) of the sediments from the three sites are not significantly different (Tables S1–S3).
The average TOC contents in the sediments of Cores DIVE149, DIVE151, and DIVE152 are 0.38%±0.18%, 0.31%±0.08%, and 0.37%±0.09%, respectively (Tables S1–S3), and the TOC contents are not significantly different (p>0.05). There is a slight decrease in the TN content with water depth on the landward trench slope (from 0.07%±0.03% to 0.06%±0.01%, p<0.05) (Tables S1–S3). Both the TOC and TN contents decrease from the surface to a depth of ~10 cm and then remain constant with sediment depth (Figs 2b, c). This type of vertical profile of organic matter content is normal which could be attributed to its degradation process. Moreover, there are significant linear relationships between the TOC and TN contents in the study area (r=0.85, p<0.01), indicating they may share similar sources. The TOC and TN contents are both positively correlated with moisture contents and stable carbon isotope (δ13C) values, and negatively correlated with density of the sediments from three cores. And Site DIVE149 also shows the strongest content fluctuations among three sites.
The average molar C/N ratios increase from ~6.2 on the landward trench slope to ~7.0 on the ocean-ward slope (p<0.05) (Tables S1–S3). There is a slight decrease in the C/N ratio of the sediments at Site DIVE151, but there are no remarkable variations in the vertical trends in the sample of the other two cores (Fig. 2e). The δ13C values of the sediments from the three sites are not significantly different (p>0.05) (Tables S1–S3), and both exhibit increasingly depleted 13C values with sediment depth (Fig. 2d). The δ13C values are also significantly positively correlated with the C/N ratios (r=0.53, p<0.01) and Silt proportion (r=0.36, p<0.05).
3.2
Quantitative calculations of different SOC sources
The Monte-Carlo (MC) simulation results revealed that OCmar is the major component of the SOC in the SYT, while OCterr makes the smallest contribution (Figs 3a–c, Table S4). The contribution of the OCterr (Pterr) increases significantly from the steep landward trench slope to the ocean-ward trench slope (DIVE149: 11%±6%, DIVE151: 11%±3%, DIVE152: 18%±8%, p<0.05) (Fig. 3, Table S4), but there are no significant spatial differences in the proportions of the OCmar (Pmar, DIVE149: 45%±19%, DIVE151: 53%±13%, DIVE152: 50%±16%) and OCmicro (Pmicro, DIVE149: 44%±24%, DIVE151: 36%±15%, DIVE152: 32%±22%) among the three sites (p>0.05) (Fig. 3, Table S4).
The OC contents of the three sources were also calculated based on their relative contributions to the total SOC pool (Table S5), and they generally exhibit similar spatial variations with their proportions (Figs 3d–f). In terms of the vertical profiles of OC contents in the sediment cores, the allochthonous OC (i.e., OCmar and OCterr) decreases with depth, while the autochthonous OCmicro remains fairly constant with depth (Figs 3d–f). The sediment from shallower site on the trench edge has the greatest fluctuations of different sources of the SOC, especially for the OCmicro profiles (Figs 3c, f).
3.3
14C age, sedimentation, and accumulation rates of SOC
As is shown in Table 2, the calibrated 14C ages of the surface SOC generally increase with increasing depth (R2=0.99). Despite the presence of older 14C at greater water depths, the sedimentation rates are higher in the deeper regions (DIVE151: 0.0027 cm/a; DIVE153: 0.0023 cm/a) than in the shallower region along the trench edge (Site DIVE149: 0.001 6 cm/a) (Table 2). Moreover, the deeper regions ((0.035±0.008) g/(m2·a) (in terms of OC) at 6 681 m and (0.040±0.007) g/(m2·a) (in terms of OC) at 6 582 m) have higher mean accumulation rates than the trench edge region ((0.026±0.006) g/(m2·a) (in terms of OC) at 4 993 m) (Fig. 5). The accumulation rates of the three sediment cores all exhibit fluctuations, and the Site DIVE151 exhibits a quasi-cyclic pattern with a period of (2–4) cm (Fig. 5). The measured radiocarbon ages of surface sediments in the SYT were comparable with those reported in the adjacent NYT at similar water depth (Table 2; Li et al., 2020a). And the calculated sedimentation rates (0.001 6–0.002 7 cm/a) for three studying sites are also comparable with the reported data in the adjacent west Caroline ocean basin (~0.001 5 cm/a), the northern Yap Trench (~0.002 7 cm/a), and the southern Mariana Trench (e.g., Site BC11, 0.001 1 cm/a, Table S6).
Figure
5.
Vertical profiles of the sedimentary organic carbon (SOC) accumulation rates for Cores DIVE149 (blue squares), DIVE151 (red dots), and DIVE152 (green triangles).
The calculation results of the OC box model are shown in Fig. 6 and Table 3. Briefly, Fin-Terr accounts for ~11% the total settling flux in the SYT (this study), ~13% in the NYT and 14% in the SMT (recalculated from Li et al., 2020b; Luo et al., 2017). In the SYT, the total settling flux from the euphotic layer and the adjacent island decrease significantly from ~0.65 g/(m2·a) (in terms of OC) at Site DIVE149 to ~0.40 g/(m2·a) (in terms of OC) at Sitebottom. The burial rates of Sites DIVE149, DIVE151, and DIVE152 are similar (approximately 0.034 g/(m2·a) (in terms of OC), 0.032 g/(m2·a) (in terms of OC), and 0.033 g/(m2·a) (in terms of OC), respectively). For Sitebottom, the possible burial rate of this site is ~1.04 g/(m2·a) (in terms of OC), which is significantly higher than those in the shallower regions. However, this burial rate is still comparable to other studies, since the sedimentation rate at the bottom of the trench may be several orders of magnitude higher than that of the abyssal plain (Glud et al., 2013; Luo et al., 2018a, b; Bao et al., 2018). The re-mineralization rates of the SOC increase with water depth (Table 3). The Fin-lateral of the three sites also increase significantly from the shallow site to the bottom of the trench (Table 3).
Figure
6.
A tentative organic carbon (OC) box model for the southern Yap Trench (SYT). The units of these values are g/(m2·a) (in terms of OC); the white arrows represent the settling fluxes of the particulate organic carbon from the euphotic layer and the adjacent islands; the yellow arrows represent the re-mineralization fluxes of the sedimentary organic carbon (SOC); the black arrows represent the burial fluxes of the SOC; the red arrows represent the lateral downslope migration fluxes; Fin-PP and Fin-Terr are the input fluxes of the primary production-derived OC and the potential terrestrial OC from the euphotic layer and the adjacent island, respectively; Fout-Re is the output flux of the re-mineralized SOC; Fbur is the burial flux of the SOC; and Fin-lateral and Fout-lateral are the lateral downslope SOC transport input and output fluxes (vertical migration) along the trench wall in each cell. Due to the limitations of the equipment and technology, we did not sample the trench axis sediments, and the reference site located at the bottom of the SYT is a hypothetical site, i.e., a point chosen as the orthogonal point from Site DIVE151 to the trench axis.
Table
3.
Box model of organic carbon (OC) balance along the trench slope of the Yap Trench and the southern Mariana Trench
Trench
Location (slope gradient)
Site
Depth/m
Fin-Terr
Fin-PP
Fout-Re
Fbur
Fin-lateral
Fout-lateral
Plateral/total
Flateral-net
Southern Yap Trench
landward (~14.8°)
DIVE149
4 993
0.072
0.58
−0.18
−0.034
−
−0.44
−
−0.44
landward (~7.2°)
DIVE151
6 582
0.054
0.44
−0.34
−0.032
0.44
−0.56
47%
−0.12
oceanward (~8.9°)
DIVE152
6 681
0.054
0.43
−0.35
−0.033
0.44
−0.54
47%
−0.11
trench axis
Sitebottom
7 960
0.045
0.36
−0.48
−1.040
1.10
−
73%
−
Northern Yap Trench*
landward (~10°)
DIVE109
4 435
0.097
0.65
−0.12
−0.016
−
−0.61
−
−0.61
landward
DIVE111
6 775
0.064
0.43
−0.36
−0.003
0.61
−0.74
55%
−0.13
oceanward (~4.2°)
DIVE113
6 574
0.066
0.44
−0.34
−0.021
0.61
−0.76
55%
−0.15
trench axis
Sitebottom
7 635
0.057
0.38
−0.44
−1.500
1.50
−
77%
−
Southern Mariana Trench**
oceanward (~1.8°)
BC06
4 900
0.069
0.42
−0.17
−0.035
−
−0.29
−
−0.29
oceanward (~1.8°)
BC07
5 233
0.065
0.40
−0.20
−0.048
0.29
−0.50
38%
−0.21
oceanward (~1.8°)
SiteReference
6 032
0.056
0.35
−0.28
−0.100
0.50
−0.52
55%
−0.02
trench axis
SiteChallengerDeep
10 900
0.031
0.19
−0.77
−0.490
1.02
−
82%
−
Note: * data recalculated from Li et al. (2020); ** data recalculated from Glud et al. (2013), Luo et al. (2017b, 2018), and Liu and Peng (2019). Input: positive value; output: negative value; −: no data.; Fin-PP and Fin-Terr are the input fluxes of the primary production-derived OC and the potential terrestrial OC from the euphotic layer and the adjacent island, respectively; Fout-Re is the output flux of the re-mineralized sedimentary organic carbon (SOC); Fbur is the burial flux of the SOC; Fin-lateral and Fout-lateral are the lateral downslope transport (vertical migration) input and output fluxes of the SOC along the trench wall in each cell; Plateral/total is the contribution of the Fin-lateral to the total OC input flux at a certain site (ratio of Fin-lateral to the sum of Fin-Terr, Fin-PP, and Fin-lateral); Flateral-net is the net flux of the OC input and output through lateral downslope transport; and the positive and negative values represent the net input and output, respectively. Due to the limitations of the equipment and technology, we did not sample the trench axis sediments in the Yap Trench. Sitebottom are the reference sites located at the bottom of the southern Yap Trench and the northern Yap Trench (points chosen as the orthogonal points from the shallow site to the trench axis). SiteReference and SiteChallengerDeep are two studying sites located in the Mariana Trench (Glud et al., 2013).
4.1
Lateral downslope transport and its migration mode
A previous study demonstrated that sediment landslides can occur at any time if the sediment holding depth and minimum slope angle (at gradients of as low as 0.5°) are exceeded (Stewart and Jamieson, 2018). Despite the lower intensity and frequency of the shallow earthquakes in the SYT (Table 1), the flanks of the SYT (in-situ observation) are much steeper than those of the SMT and the Japan Trench (2.2°–4.3°) (Li et al., 2020a) (Table 3), and the trench slope of the SYT is also much smoother than the slopes of the NYT (Fig. 1b), the Japan Trench (Boston et al., 2017), and the Mariana Trench (Oakley et al., 2008; Liu et al., 2019b); therefore, the conditions are beneficial to the occurrence of sediment landslides.
Furthermore, the sedimentary environment is unstable, especially that of the surficial sediments in the shallow region, which have very high water contents (~83%; Tables S1–S3). This is supported by the larger number of clusters obtained for Site DIVE149 (Fig. 7). Although the SOC in the deeper region has a greater 14C age than that at the trench edge (Table 2), the average SOC content of the sediments at different water depths are comparable (Fig. 2b, Tables S1–S3), indicating that a process, i.e., downslope transport, has smoothed the expected decrease in the sedimentary TOC due to biodegradation at different water depth. In addition, the sedimentation rates and SOC accumulation rates are approximately 50% higher in the deeper regions of the SYT (Table 2), which is consistent with previous observations that the bottoms of hadal trenches contain more excess 210Pb (Glud et al., 2013; Leduc et al., 2016; Wenzhӧfer et al., 2016; Luo et al., 2019). These phenomena illustrate the physical convergence effect of the V-shaped trench wall on the dispersal of sedimentary particulates.
Figure
7.
R-mode cluster analysis: pedigree chart of the sediment layers in the southern Yap Trench. The three clusters identified by the cluster analysis are defined by the orange boxes with a distance of 8.
In contrast to the Japan Trench and the Mariana Trench, which experience frequent earthquakes, the primary mode of lateral transport in the SYT is through periodic lateral downslope migration of the surface sediments down the trench wall (Fig. 1a). A study of the Japan Trench revealed that tectonically triggered sediment accumulation resulted in a significantly increased SOC accumulation flux (~2 orders of magnitude) and wet density (~30% higher) compared to those of normally sinking deposits (Bao et al., 2018). However, compared to trenches with active shallow seismic activity, the intensity and frequency of the earthquakes in the SYT are an order of magnitude weaker and lower (Table 1), resulting in lower sedimentation rates (e.g., ~0.002 2 cm/a in the SYT, ~0.027 cm/a in the NYT, 0.02–0.075 cm/a in the SMT, and 0.05–0.90 cm/a in the Japan Trench) (Bao et al., 2018; Luo et al., 2018a, b; Li et al., 2020b) (Table S6).
In addition, there are no abrupt increases in the accumulation rates and wet density in the sediment cores from the deeper regions, indicating limited probability of the occurrence of a severe tectonically triggered downslope transport event. The allochthonous OC inputs from upper water column (e.g., primary production) may vary periodically (e.g., from seasonally to decadally and centennially). However, due to the long time scales (around thousands of years) of the sediment cores and active degradation of POC during the settling process in the water column, the final flux differences of the POC arriving at the sediments would be pretty small or even erased. Therefore, the influence of periodically varying allochthonous OC inputs on the vertical profiles of SOC and bacterial abundance therein would be limited. And in this study, the fluctuating prokaryotic abundance (Fig. S3) and SOC accumulation rate (Fig. 5) in the sediment core indicate a quasi-cyclic period with a 2–4 cm sediment thickness. For example, in Site DIVE151, the peak values in the fluctuations (e.g., 0.5 cm, 3.5 cm, 9.5 cm, and 15 cm) in the TOC and TN contents (Fig. 2 and Table S2) and the bacterial abundance (Fig. S3), as well as the valley values in the MGS and wet density fluctuations, may correspond to a landslide event (Figs 2 and S3). The valley values in the TOC and TN contents and the bacterial abundance in the sediment of Site DIVE151 (e.g., 2.5 cm, 4.5 cm, 8.5 cm, 13 cm, and 19 cm) may represent in-situ natural settling of the euphotic layers (Figs 2 and S3). And spontaneous sediment migration caused by the steeper trench slope may be the major reason for the periodic lateral downslope migration of the surface sediments in the SYT.
4.2
Dilution effect vs. funneling effect on surface TOC
Usually, due to the funnel-like shape of the hadal zone, the velocity of horizontal flow decreases with water depth (Glud et al., 2013; Li et al., 2020a; Turnewitsch et al., 2014). And due to the weaker hydrodynamic environment with water depth, the funnel-like shape of trench flanks and gravity segregation result in the preferential enrichment of low-density, small-sized material (e.g., biotic OC) on the bottom of the trench and the gentle oceanward trench slope, leading to increasing surface OC content from abyssal to hadal depths (Li et al., 2020b) according to Stokes’ law and hydrodynamic sorting processes (Wakeham et al., 2009; Li et al., 2014, 2020b; Wang et al., 2015). For the SYT, as was expected, the deeper regions have much higher clay contents associated with higher SSA values (p<0.05) (Fig. 2). However, enrichment of the surface TOC with greater water depth due to the funneling effect is absent in the SYT. Unexpectedly, the surface TOC content decreases with water depth. In addition, the similar average contents and compositions of the SOC in the three sediment cores demonstrate that the sediments are well mixed and the SOC in the SYT is poorly sorted (Figs 3a–c), which is not consistent with the results of former studies conducted in the SMT (Glud et al., 2013), NYT (Li et al., 2020b), and Izu-Bonin Trench (Wenzhöfer et al., 2016).
The dilution effect of the OC-depleted abiotic basalt debris formed by weathering processes on the SOC pool weakens the funneling effect of the surface OC in the SYT. Previous studies have shown that high-density volcanic basalt debris is the major component of the hadal sediments in the active submarine volcanic area in the trench plate bending zone (e.g., upper and middle landward slope) (Beliaev and Brueggeman, 1989; Brady and Gíslason, 1997; Nielsen and Fisk, 2010). Moreover, it is thought that the abundance of the basalt debris decreases with water depth based on the significant decrease in the dry densities of the sediments in the NYT (e.g., ~0.89 g/cm3 on the middle slope, ~0.60 g/cm3 on the lower slope of steep landward slope, and ~0.25 g/m3 on the gentle oceanward slope; Li et al., 2020a). However, there are no significant differences in the dry densities of the sediment from the three sites in the SYT (DIVE149: (0.59±0.42) g/m3, DIVE151: (0.51±0.13) g/m3, DIVE152: (0.41±0.08) g/m3; Fig. 2 and Tables S1−S3), which suggests good mixing and even dispersal of the volcanic basalt debris along the trench walls of the SYT. In particular, compared to those of the NYT, based on the much lower density in the SYT, the weaker shallow volcanic activity (Table 1) may reduce the production and inventory of the volcanic basalt debris, which limits the potential spatial variability of the basalt inventory.
In addition, the much lower velocity of the bottom current in the southern segment also indicates weaker hydrodynamic conditions compared to those in the NYT (Liu et al., 2018; and field observations). Moreover, the SYT has a smoother (e.g., less slope break, local uplift on the landward slope, and horsts and grabens in the oceanward trench slope; Xia et al., 2020) and steeper slope (~40%; Zhang et al., 2019) than the NYT (Fig. 1), which makes it easier for the collapsed sediments to reach the deeper region. In addition, the abiotic basalt-sourced particles can undergo continuous transformation (e.g., physical disintegration) during the lateral downslope transport, which further improves the buoyancy of the smaller basalt debris and promotes its long-distance transport. This speculation is further supported by the negative correlation between the TOC and clay contents in the deeper sites (p<0.05) and the fact that the clay content increases with water depth (Table S7). Moreover, similar SOC composition among three sediment cores also demonstrates limited effect of SOC sources on the funneling effect (Fig. 3). Consequently, the increasing dilution effect caused by the smaller basalt debris at greater water depths obscures the funneling effect of the surface OC in the SYT.
4.3
Poorly sorted SOC composition
Compared to the remarkable spatial heterogeneity of the SOC in the NYT (Li et al., 2020b), there are no significant spatial differences in the major component of the SOC (i.e., Pmar and Pmicro) among studying sites (p>0.05) in the SYT (Fig. 3, Table S4). And only the Pterr of sediment from the oceanward slope site is significantly higher than those from the landward trench slope (Figs 3b, e). As shown in Fig. 7, 71% of the sediment layers in the three sites were divided into the same cluster for a small enough distance (<8), indicating that the sediments in the SYT have similar compositions. In addition, a previous study also reported similar chlorophyll-a content vs. pheaophytin-a content ratios (18±1.6 and 20±6.5) and comparable OC inventories ((6 663±36) g/m2) and (6 119±889) g/m2)) of the sediments from the Tonga Trench edge (6 250 m) and axis (10 800 m) sites (Wenzhӧfer et al., 2016), which is also consistent with our findings.
Many processes contribute to the homogeneous SOC composition. The most important factors are the sedimentary environment created by the weak hydrodynamic conditions and the steep and smooth trench slope in the SYT, which significantly limit the hydrodynamic sorting effect. Another possible factor is the effect of the limited reworking capability of the hadal microbenthos on the SOC content and composition. For example, the abundance of benthic microorganisms in the SYT (106−108 gene copies per gram; Fu et al., 2020) is about 2–3 orders of magnitude lower than in neritic environments (e.g., the East China Sea, 109−1011 gene copies per gram; He et al., 2015). The SOC degradation rate constants and sediment oxygen consumption rates ((0.085−0.750) mmol/(m2·d) of hadal trenches (Glud et al., 2013; Wenzhӧfer et al., 2016; Luo et al., 2018b; Li et al., 2020a) are also significantly lower than those of neritic regions (SOC degradation rate constant k2: (0.0025–0.380) a−1; DO uptake ratios: 3.1–26.2 mmol/(m2·d)) (recalculated from Paetsch et al., 1992; Andrews et al., 1994; Zimmerman and Canuel, 2000; Li et al., 2015; Song et al., 2016). Moreover, the results of the degradation model indicate that the half-life of the residual OC (especially for the refractory OC, which represent the SOC reactivity) in the SYT ranges from 2 729 a to 5 134 a (Table S6), which is larger than the differences in the 14C ages of the surface sediments of three cores (Table 2), further suggesting delayed degradation during lateral transport.
4.4
Overall perspective on hadal SOC cycling
The overall framework of the OC balance in the hadal trench provides further insights into the physical and biogeochemical processes in this extreme environment. The contribution of the lateral downslope transport of OC to the nutrient supply has become increasingly important, and Plateral/total (ratio of Fin-lateral to the sum of Fin-Terr, Fin-PP, and Fin-lateral for a certain site) increases significantly from <40% in the abyssal region to ~64% at the bottom of the hadal trench (Table 3), which is consistent with the finding that 48%–84% of the OC in the sinking particles in the Japan Trench is derived from re-suspended sediments (Nakatsuka et al., 1997). This increase in Fin-lateral results in a significant increase in the Fbur in the middle and lower slope regions (Fig. 6, Table 3). However, due to the increasing heterotrophic microbial activity (Fout-Re, around two times higher at the bottom of the trench than at the shallower region), the decreasing natural POC sinking flux, and the increasing gradually trench slope (Yang et al., 2018), the Netlateral flux decreases significantly with water depth, from a net output of approximately 0.44 g/(m2·a) (in terms of OC) in the abyssal region to approximately 0.12 g/(m2·a) (in terms of OC) at depths of ~(6 582–6 681) m, and to a net input of approximately 1.1 g/(m2·a) (in terms of OC) at the trench axis site in the SYT (Fig. 6, Table 3). The positive Flateral-net (net flux of the OC input and output through lateral downslope transport) of the SiteReference in the SMT also indicates the entrapment of SOC (Table 3).
The seismic activity and gradients of the trench flanks are the most important factors affecting the strength of the lateral OC transport flux and the OC balance of the hadal trench. Although the gradient of the trench wall is much gentler than that of the SYT, due to the more intense shallow earthquakes in the SMT, its lateral OC transport flux is still comparable to that of the SYT (Table 3). Based on the more numerous shallow earthquakes and three times higher subduction rate in the NYT compared to the SYT (Xia et al., 2020), this more active plate movement acts as an important trigger of landslides in the overlying sediments and significantly promotes occasional landslides. Thus, the net lateral downslope transport flux ( Netlateral flux) and the proportion of the total OC input flux (Plateral/total) are much higher in the NYT than in the SYT (Table 3).
In addition, the gradient of the trench wall and the local topography, such as concave grabens and gentle slopes, have a positive effect on the accumulation of SOC and a negative effect on the exportation via lateral downslope transport. However, the steep slopes and convex horsts may enhance the downslope exportation of sediments. For instance, for the sites with similar water depths (DIVE149 vs. BC06, DIVE151 vs. SiteReference), the Fout-lateral and Flateral-net are approximately two times higher on the steep SYT slope than on the SMT slope, while the Fbur of the latter is much higher than that of the former (e.g., SiteReference vs. DIVE151 and SiteReference vs. DIVE152; Table 3). This is probably the reason for the higher benthic microorganism densities in the SYT (~4.4×10⁷ cells per gram; Fu et al., 2020) compared to the SMT (~0.7×10⁷ cells per gram; Glud et al., 2013). Moreover, as the gentleness of the trench slope generally increases with water depth (Fig. 1b), continuously laterally transported OC with a high availability (OC composition similar to that in the shallow trench edge region, which is favored for benthos) would lead to a larger and more rapidly replenished food supply in the deeper region (Fig. 6). This results in biological zonation and the development of a biodiversity hotspot for hadal benthos.
It should be noted that the OC balance described above is a preliminary estimate and involves some uncertainties. For example, the omission of the original Fout-lateral from the shallowest station may lead to underestimation of the lateral flux down the trench wall. The lack of regional topographic information for the trench flanks could also introduce uncertainties due to the existence of a topographic transformation (i.e., the existence of a transition region) where the net flux of the OC resulting from the lateral downslope transport changes from a net output (e.g., convex horsts) to a net input (e.g., concave grabens) (Table 3). The mixing effect of sediments may also influence the accuracy of calculated sedimentation rate and SOC accumulation rate. However, although this conceptual model was constructed based on ideal conditions, the calculation results of the vertical variation trends of the lateral transport flux and its proportion to the total OC input along the trench slope can reliably explain several of the unique phenomena in the hadal zone. In future studies, more accurate topographic investigate and higher resolution sample site layout along the trench flanks would help to better evaluation of the hadal OC budget.
5.
Conclusions
In this study, sedimentary grain size composition, SSA, total organic carbon (TOC) and total nitrogen (TN) contents, and isotopic composition (13C and 14C) of samples from three push cores collected from different depths insides of the SYT were analyzed, and a three end-member model was developed to investigate the lateral downslope transport process and to quantitatively evaluate its importance to the SOC source to sink processes in the hadal SYT. The results of this study enhance our understanding of the biogeochemical cycle of OC in hadal trenches. The main conclusions of this study are as follows.
The periodic migration of surface sediments down the trench wall caused by the steep trench slope is a major pathway for the input of particulate nutrients to the bottom of the trench. The dilution effect caused by basalt debris may obscure the funneling effect of the surface OC content. The sedimentary environment create by the weak hydrodynamic conditions and the steep trench slope contribute to the poorly sorted SOC composition along the trench flanks. The widely occurring lateral downslope transport process results in significant sediment accumulation at the bottom of the trench, and it has an important influence on the food supply (e.g., lateral transport flux of OC) and the shapes of the types of sediment substrate (e.g., soft or hard sediment substrate).
We developed a tentative SOC box model that indicates that the downslope SOC transport flux is comparable to the natural POC sinking flux from the euphotic layer. Its proportion of the total SOC input increases significantly with water depth. However, a transition region may exist on the trench flanks where the net lateral downslope OC transport flux changes from a net output to a net input. Seismic activity, the steepness of the trench flanks, and the local topography are the most important factors affecting the strength of the lateral downslope OC transport flux and the OC balance of the hadal trench. Gentle slopes and concave grabens promote the accumulation of SOC and weaken the exportation via lateral downslope transport; whereas steep slopes and convex horsts have the opposite effect. Thus, more accurate topographic information and a higher resolution sample site layout along the trench flanks will provide a better evaluation of the hadal OC budget. This study highlights the effects of the laterally transported OC on the shaping and development of biomes within the hadal trench.
Acknowledgements:
The authors would like to thank the crews of the R/V Xiangyanghong 10, Lulu Fu and Yu Zhen in Ocean University of China, Qiuhong Zhu, Xiaoze Guo, Bo Lu in Second Institute of Oceanography, Ministry of Natural Resources for their assistance with sample collection and the laboratory experiments. August Andersson is also thanked for kindly providing the Matlab script for the Monte-Carlo simulation.
Andersson A. 2011. A systematic examination of a random sampling strategy for source apportionment calculations. Science of the Total Environment, 412–413: 232–238,
Andrews J T, Milliman J D, Jennings A E, et al. 1994. Sediment thicknesses and Holocene glacial marine sedimentation rates in three East Greenland fjords (ca. 68°N). The Journal of Geology, 102(6): 669–683. doi: 10.1086/629711
Bao Rui, Strasser M, McNichol A P, et al. 2018. Tectonically-triggered sediment and carbon export to the hadal zone. Nature Communications, 9(1): 121–128. doi: 10.1038/s41467-017-02504-1
Beliaev G M, Brueggeman P L. 1989. Deep Sea Ocean Trenches and Their Fauna. Moscow: Nauka
Boston B, Moore G F, Nakamura Y, et al. 2017. Forearc slope deformation above the Japan Trench megathrust: implications for subduction erosion. Earth and Planetary Science Letters, 462: 26–34. doi: 10.1016/j.jpgl.2017.01.005
Brady P V, Gíslason S R. 1997. Seafloor weathering controls on atmospheric CO2 and global climate. Geochimica et Cosmochimica Acta, 61(5): 965–973. doi: 10.1016/S0016-7037(96)00385-7
Dymond J, Collier R, McManus J, et al. 1997. Can the aluminum and titanium contents of ocean sediments be used to determine the paleoproductivity of the oceans?. Paleoceanography, 12(4): 586–593. doi: 10.1029/97pa01135
Fu Lulu, Li Dong, Mi Tiezhu, et al. 2020. Characteristics of the archaeal and bacterial communities in core sediments from southern Yap Trench via in situ sampling by the manned submersible Jiaolong. Science of the Total Environment, 703: 134884. doi: 10.1016/j.scitotenv.2019.134884
Glud R N. 2008. Oxygen dynamics of marine sediments. Marine Biology Research, 4(4): 243–289. doi: 10.1080/17451000801888726
Glud R N, Berg P, Thamdrup B, et al. 2021. Hadal trenches are dynamic hotspots for early diagenesis in the deep sea. Communications Earth & Environment, 2: 21. doi: 10.1038/s43247-020-00087-2
Glud R N, Wenzhöfer F, Middelboe M, et al. 2013. High rates of microbial carbon turnover in sediments in the deepest oceanic trench on Earth. Nature Geoscience, 6(4): 284–288. doi: 10.1038/NGEO1773
Guan Hongxiang, Chen Linying, Luo Min, et al. 2019. Composition and origin of lipid biomarkers in the surface sediments from the southern Challenger Deep, Mariana Trench. Geoscience Frontiers, 10(1): 351–360. doi: 10.1016/j.gsf.2018.01.004
Hayward B W, Sabaa A, Grenfell H R. 2004. Benthic foraminifera and the late Quaternary (last 150 ka) paleoceanographic and sedimentary history of the Bounty Trough, east of New Zealand. Palaeogeography, Palaeoclimatology, Palaeoecology, 211(1–2): 59–93,
He Hui, Zhen Yu, Mi Tiezhu, et al. 2015. Community composition and distribution of sulfate- and sulfite-reducing prokaryotes in sediments from the Changjiang Estuary and adjacent East China Sea. Estuarine, Coastal and Shelf Science, 165: 75–85,
Hu Limin, Guo Zhigang, Feng Jialiang, et al. 2009. Distributions and sources of bulk organic matter and aliphatic hydrocarbons in surface sediments of the Bohai Sea, China. Marine Chemistry, 113(3–4): 197–211,
Ichino M C, Clark M R, Drazen J C, et al. 2015. The distribution of benthic biomass in hadal trenches: a modelling approach to investigate the effect of vertical and lateral organic matter transport to the seafloor. Deep-Sea Research Part I: Oceanographic Research Papers, 100: 21–33. doi: 10.1016/j.dsr.2015.01.010
Kitahashi T, Kawamura K, Kojima S, et al. 2013. Assemblages gradually change from bathyal to hadal depth: a case study on harpacticoid copepods around the Kuril Trench (north-west Pacific Ocean). Deep-Sea Research Part I: Oceanographic Research Papers, 74: 39–47. doi: 10.1016/j.dsr.2012.12.010
Leduc D, Rowden A A, Glud R N, et al. 2016. Comparison between infaunal communities of the deep floor and edge of the Tonga Trench: possible effects of differences in organic matter supply. Deep-Sea Research Part I: Oceanographic Research Papers, 116: 264–275. doi: 10.1016/j.dsr.2015.11.003
Leduc D, Rowden A A, Probert P K, et al. 2012. Further evidence for the effect of particle-size diversity on deep-sea benthic biodiversity. Deep-Sea Research Part I: Oceanographic Research Papers, 63: 164–169. doi: 10.1016/j.dsr.2011.10.009
Li Xinxin, Bianchi T S, Yang Zuosheng, et al. 2011. Historical trends of hypoxia in Changjiang River Estuary: applications of chemical biomarkers and microfossils. Journal of Marine Systems, 86(3–4): 57–68,
Li Jiwei, Chen Zhiyan, Li Xinxin, et al. 2021. The sources of organic carbon in the deepest ocean: implication from bacterial membrane lipids in the Mariana Trench Zone. Frontiers in Earth Science, 9: 653742. doi: 10.3389/feart.2021.653742
Li Dong, Yao Peng, Bianchi T S, et al. 2014. Organic carbon cycling in sediments of the Changjiang Estuary and adjacent shelf: implication for the influence of Three Gorges Dam. Journal of Marine Systems, 139: 409–419. doi: 10.1016/j.jmarsys.2014.08.009
Li Dong, Yao Peng, Bianchi T S, et al. 2015. Historical reconstruction of organic carbon inputs to the East China Sea inner-shelf: implications for anthropogenic activities and regional climate variability. The Holocene, 25(12): 1869–1881. doi: 10.1177/0959683615591358
Li Dong, Zhao Jun, Liu Chenggang, et al. 2020a. Comparison of sedimentary organic carbon loading in the Yap Trench and other marine environments. Journal of Oceanology and Limnology, 38(3): 619–633. doi: 10.1007/s00343-019-8365-9
Li Dong, Zhao Jun, Yao Peng, et al. 2020b. Spatial heterogeneity of organic carbon cycling in sediments of the northern Yap Trench: implications for organic carbon burial. Marine Chemistry, 223: 103813. doi: 10.1016/j.marchem.2020.103813
Liu Yongzhi, Liu Xuehai, Lv Xianqing, et al. 2018. Watermass properties and deep currents in the northern Yap Trench observed by the Submersible Jiaolong system. Deep-Sea Research Part I: Oceanographic Research Papers, 139: 27–42. doi: 10.1016/j.dsr.2018.06.001
Liu Shuangquan, Peng Xiaotong. 2019. Organic matter diagenesis in hadal setting: insights from the pore-water geochemistry of the Mariana Trench sediments. Deep-Sea Research Part I: Oceanographic Research Papers, 147: 22–31. doi: 10.1016/j.dsr.2019.03.011
Liu Yang, Wu Ziyin, Zhao Dineng, et al. 2019a. Construction of high-resolution bathymetric dataset for the Mariana Trench. IEEE Access, 7: 142441–142450. doi: 10.1109/access.2019.2944667
Liu Jiwen, Zheng Yanfen, Lin Heyu, et al. 2019b. Proliferation of hydrocarbon-degrading microbes at the bottom of the Mariana Trench. Microbiome, 7(1): 47. doi: 10.1186/s40168-019-0652-3
Luo Min, Algeo T J, Tong Hongpeng, et al. 2018a. More reducing bottom-water redox conditions during the Last Glacial Maximum in the southern Challenger Deep (Mariana Trench, western Pacific) driven by enhanced productivity. Deep-Sea Research Part II: Topical Studies in Oceanography, 155: 70–82. doi: 10.1016/j.dsr2.2017.01.006
Luo Min, Gieskes J, Chen Linying, et al. 2017. Provenances, distribution, and accumulation of organic matter in the southern Mariana Trench rim and slope: implication for carbon cycle and burial in hadal trenches. Marine Geology, 386: 98–106. doi: 10.1016/j.margeo.2017.02.012
Luo Min, Gieskes L, Chen Linying, et al. 2019. Sources, degradation, and transport of organic matter in the New Britain Shelf-Trench continuum, Papua New Guinea. Journal of Geophysical Research: Biogeosciences, 124(6): 1680–1695. doi: 10.1029/2018JG004691
Luo Min, Glud R N, Pan Binbin, et al. 2018b. Benthic carbon mineralization in hadal trenches: insights from in situ determination of benthic oxygen consumption. Geophysical Research Letters, 45(6): 2752–2760. doi: 10.1002/2017GL076232
Lutz M J, Caldeira K, Dunbar R B, et al. 2007. Seasonal rhythms of net primary production and particulate organic carbon flux to depth describe the efficiency of biological pump in the global ocean. Journal of Geophysical Research: Oceans, 112(C10): C10011. doi: 10.1029/2006JC003706
Nakatsuka T, Handa N, Harada N, et al. 1997. Origin and decomposition of sinking particulate organic matter in the deep water column inferred from the vertical distributions of its δ15N, δ13C and δ14C. Deep-Sea Research Part I: Oceanographic Research Papers, 44(12): 1957–1979. doi: 10.1016/S0967-0637(97)00051-4
Nielsen M E, Fisk M R. 2010. Surface area measurements of marine basalts: implications for the subseafloor microbial biomass. Geophysical Research Letters, 37(15): L15604. doi: 10.1029/2010GL044074
Nozaki Y, Ohta Y. 1993. Rapid and frequent turbidite accumulation in the bottom of Izu-Ogasawara Trench: chemical and radiochemical evidence. Earth and Planetary Science Letters, 120(3–4): 345–360,
Nunoura Y, Nishizawa M, Hirai M, et al. 2018. Microbial diversity in sediments from the bottom of the Challenger Deep, the Mariana Trench. Microbes and Environments, 33(2): 186–194. doi: 10.1264/jsme2.ME17194
Nunoura T, Takaki Y, Hirai M, et al. 2015. Hadal biosphere: insight into the microbial ecosystem in the deepest ocean on Earth. Proceedings of the National Academy of Sciences of the United States of America, 112(11): E1230–E1236. doi: 10.1073/pnas.1421816112
Oakley A J, Taylor B, Moore G F. 2008. Pacific Plate subduction beneath the central Mariana and Izu-Bonin fore arcs: new insights from an old margin. Geochemistry, Geophysics, Geosystems, 9(6): Q06003,
Oguri K, Kawamura K, Sakaguchi A, et al. 2013. Hadal disturbance in the Japan Trench induced by the 2011 Tohoku-Oki Earthquake. Scientific Reports, 3: 1915. doi: 10.1038/srep01915
Paetsch H, Botz R, Scholten J C, et al. 1992. Accumulation rates of surface sediments in the Norwegian-Greenland Sea. Marine Geology, 104(1–4): 19–30,
Reimer P J, Bard E, Bayliss A, et al. 2013. IntCal13 and Marine13 radiocarbon age calibration curves 0–50, 000 Years cal BP. Radiocarbon, 55(4): 1869–1887. doi: 10.2458/azu_js_rc.55.16947
Schauberger C, Glud R N, Hausmann B, et al. 2021. Microbial community structure in hadal sediments: high similarity along trench axes and strong changes along redox gradients. The ISME Journal, 15(12): 3455–3467. doi: 10.1038/s41396-021-01021-w
Schwestermann T, Eglinton T I, Haghipour N, et al. 2021. Event-dominated transport, provenance, and burial of organic carbon in the Japan Trench. Earth and Planetary Science Letters, 563: 116870. doi: 10.1016/j.jpgl.2021.116870
Shi Linlin, Zhang Xi, Xiao Wenjie, et al. 2020. Ontogenetic diet change of hadal amphipods in the New Britain Trench revealed by fatty acid biomarker and stable isotope ratio. Deep-Sea Research Part I: Oceanographic Research Papers, 160: 103276. doi: 10.1016/j.dsr.2020.103276
Six K D, Maier-Reimer E. 1996. Effects of plankton dynamics on seasonal carbon fluxes in an ocean general circulation model. Global Biogeochemical Cycles, 10(4): 559–583. doi: 10.1029/96gb02561
Song Guodong, Liu Sumei, Zhu Zhuoyi, et al. 2016. Sediment oxygen consumption and benthic organic carbon mineralization on the continental shelves of the East China Sea and the Yellow Sea. Deep-Sea Research Part II: Topical Studies in Oceanography, 124: 53–63. doi: 10.1016/j.dsr2.2015.04.012
Stewart H A, Jamieson A J. 2018. Habitat heterogeneity of hadal trenches: considerations and implications for future studies. Progress in Oceanography, 161: 47–65. doi: 10.1016/j.pocean.2018.01.007
Talma A S, Vogel J C. 1993. A simplified approach to calibrating 14C dates. Radiocarbon, 35(2): 317–322. doi: 10.1017/s0033822200065000
Tian Jiwei, Fan Lu, Liu Haodong, et al. 2018. A nearly uniform distributional pattern of heterotrophic bacteria in the Mariana Trench interior. Deep-Sea Research Part I: Oceanographic Research Papers, 142: 116–126. doi: 10.1016/j.dsr.2018.10.002
Turnewitsch R, Falahat S, Stehlikova J, et al. 2014. Recent sediment dynamics in hadal trenches: evidence for the influence of higher-frequency (tidal, near-inertial) fluid dynamics. Deep-Sea Research Part I: Oceanographic Research Papers, 90: 125–138. doi: 10.1016/j.dsr.2014.05.005
Tyrrell T. 1999. The relative influences of nitrogen and phosphorus on oceanic primary production. Nature, 400(6744): 525–531. doi: 10.1038/22941
Wakeham S G, Canuel E A, Lerberg E J, et al. 2009. Partitioning of organic matter in continental margin sediments among density fractions. Marine Chemistry, 115(3–4): 211–225,
Wang Jinpeng, Yao Peng, Bianchi T S, et al. 2015. The effect of particle density on the sources, distribution, and degradation of sedimentary organic carbon in the Changjiang Estuary and adjacent shelf. Chemical Geology, 402: 52–67. doi: 10.1016/j.chemgeo.2015.02.040
Waterson E J, Canuel E A. 2008. Sources of sedimentary organic matter in the Mississippi River and adjacent Gulf of Mexico as revealed by lipid biomarker and δ13CTOC analyses. Organic Geochemistry, 39(4): 422–439. doi: 10.1016/j.orggeochem.2008.01.011
Wenzhöfer F, Oguri K, Middelboe M, et al. 2016. Benthic carbon mineralization in hadal trenches: assessment by in situ O2 microprofile measurements. Deep-Sea Research Part I: Oceanographic Research Papers, 116: 276–286. doi: 10.1016/j.dsr.2016.08.013
Xia Chenglong, Zheng Yanpeng, Liu Baohua, et al. 2020. Geological and geophysical differences between the north and south sections of the Yap trench-arc system and their relationship with Caroline Ridge subduction. Geological Journal, 55(12): 7775–7789. doi: 10.1002/gj.3903
Xiao Wenjie, Wang Yasong, Liu Yongsheng, et al. 2020a. Predominance of hexamethylated 6-methyl branched glycerol dialkyl glycerol tetraethers in the Mariana Trench: source and environmental implication. Biogeosciences, 17(7): 2135–2148. doi: 10.5194/bg-17-2135-2020
Xiao Weijie, Xu Yunping, Haghipour N, et al. 2020b. Efficient sequestration of terrigenous organic carbon in the New Britain Trench. Chemical Geology, 533: 119446. doi: 10.1016/j.chemgeo.2019.119446
Xu Yunping, Wu Weichao, Xiao Wenjie, et al. 2020b. Intact ether lipids in trench sediments related to archaeal community and environmental conditions in the deepest ocean. Journal of Geophysical Research: Biogeosciences, 125(7): e2019JG005431. doi: 10.1029/2019JG005431
Yang Yaomin, Wu Shiguo, Gao Jinwei, et al. 2018. Geology of the Yap Trench: new observations from a transect near 10°N from manned submersible Jiaolong. International Geology Review, 60(16): 1941–1953. doi: 10.1080/00206814.2017.1394226
Yue Xin’an, Yan Yixin, Ding Haibing, et al. 2018. Biological geochemical characteristics of the sediments in the Yap Trench and its oceanographic significance. Periodical of Ocean University of China (in Chinese), 48(3): 88–96. doi: 10.16441/j.cnki.hdxb.20170145
Zhang Zhengyi, Dong Dongdong, Sun Weidong, et al. 2019. Subduction erosion, crustal structure, and an evolutionary model of the northern Yap Subduction zone: new observations from the latest geophysical survey. Geochemistry, Geophysics, Geosystems, 20(1): 166–182,
Zimmerman A R, Canuel E A. 2000. A geochemical record of eutrophication and anoxia in Chesapeake Bay sediments: anthropogenic influence on organic matter composition. Marine Chemistry, 69(1–2): 117–137,
Dong Li, Jun Zhao, Chenggang Liu, Jianming Pan, Ji Hu. Lateral downslope transport and tentative sedimentary organic carbon box model in the southern Yap Trench, western Pacific Ocean[J]. Acta Oceanologica Sinica, 2023, 42(1): 61-74. doi: 10.1007/s13131-022-2043-z
Dong Li, Jun Zhao, Chenggang Liu, Jianming Pan, Ji Hu. Lateral downslope transport and tentative sedimentary organic carbon box model in the southern Yap Trench, western Pacific Ocean[J]. Acta Oceanologica Sinica, 2023, 42(1): 61-74. doi: 10.1007/s13131-022-2043-z
Table
1.
Summary of earthquake events in the southern and northern Yap Trenches (SYT and NYT), southern Mariana Trench (SMT), and Japan Trench since 1900 AD (data from http://earthquake.usgs.gov/earthquakes/search/, United States Geological Survey Earthquake Hazards Program). The data in parentheses represents the proportion of shallow earthquakes
Magnitude 5–6
Magnitude 6–7
Magnitude>7
Average proportion of shallow earthquakes
SYT (7.0°–9.5°N)
20 (20%)
7 (14%)
2 (0)
17% (5/29)
NYT (9.5°–11.5°N)
23 (43%)
1 (100%)
0
46% (11/24)
SMT (10.5°–13.0°N)
519 (6%)
34 (12%)
3 (0)
6% (35/556)
Japan Trench (34.0°–41.0°N)
1 434 (11%)
271 (10%)
45 (4%)
11% (187/1 750)
Note: The data in parentheses represent the proportion of shallow earthquakes (epicenters shallower than 10 km).
Table
3.
Box model of organic carbon (OC) balance along the trench slope of the Yap Trench and the southern Mariana Trench
Trench
Location (slope gradient)
Site
Depth/m
Fin-Terr
Fin-PP
Fout-Re
Fbur
Fin-lateral
Fout-lateral
Plateral/total
Flateral-net
Southern Yap Trench
landward (~14.8°)
DIVE149
4 993
0.072
0.58
−0.18
−0.034
−
−0.44
−
−0.44
landward (~7.2°)
DIVE151
6 582
0.054
0.44
−0.34
−0.032
0.44
−0.56
47%
−0.12
oceanward (~8.9°)
DIVE152
6 681
0.054
0.43
−0.35
−0.033
0.44
−0.54
47%
−0.11
trench axis
Sitebottom
7 960
0.045
0.36
−0.48
−1.040
1.10
−
73%
−
Northern Yap Trench*
landward (~10°)
DIVE109
4 435
0.097
0.65
−0.12
−0.016
−
−0.61
−
−0.61
landward
DIVE111
6 775
0.064
0.43
−0.36
−0.003
0.61
−0.74
55%
−0.13
oceanward (~4.2°)
DIVE113
6 574
0.066
0.44
−0.34
−0.021
0.61
−0.76
55%
−0.15
trench axis
Sitebottom
7 635
0.057
0.38
−0.44
−1.500
1.50
−
77%
−
Southern Mariana Trench**
oceanward (~1.8°)
BC06
4 900
0.069
0.42
−0.17
−0.035
−
−0.29
−
−0.29
oceanward (~1.8°)
BC07
5 233
0.065
0.40
−0.20
−0.048
0.29
−0.50
38%
−0.21
oceanward (~1.8°)
SiteReference
6 032
0.056
0.35
−0.28
−0.100
0.50
−0.52
55%
−0.02
trench axis
SiteChallengerDeep
10 900
0.031
0.19
−0.77
−0.490
1.02
−
82%
−
Note: * data recalculated from Li et al. (2020); ** data recalculated from Glud et al. (2013), Luo et al. (2017b, 2018), and Liu and Peng (2019). Input: positive value; output: negative value; −: no data.; Fin-PP and Fin-Terr are the input fluxes of the primary production-derived OC and the potential terrestrial OC from the euphotic layer and the adjacent island, respectively; Fout-Re is the output flux of the re-mineralized sedimentary organic carbon (SOC); Fbur is the burial flux of the SOC; Fin-lateral and Fout-lateral are the lateral downslope transport (vertical migration) input and output fluxes of the SOC along the trench wall in each cell; Plateral/total is the contribution of the Fin-lateral to the total OC input flux at a certain site (ratio of Fin-lateral to the sum of Fin-Terr, Fin-PP, and Fin-lateral); Flateral-net is the net flux of the OC input and output through lateral downslope transport; and the positive and negative values represent the net input and output, respectively. Due to the limitations of the equipment and technology, we did not sample the trench axis sediments in the Yap Trench. Sitebottom are the reference sites located at the bottom of the southern Yap Trench and the northern Yap Trench (points chosen as the orthogonal points from the shallow site to the trench axis). SiteReference and SiteChallengerDeep are two studying sites located in the Mariana Trench (Glud et al., 2013).
Note: * data recalculated from Li et al. (2020); ** data recalculated from Glud et al. (2013), Luo et al. (2017b, 2018), and Liu and Peng (2019). Input: positive value; output: negative value; −: no data.; Fin-PP and Fin-Terr are the input fluxes of the primary production-derived OC and the potential terrestrial OC from the euphotic layer and the adjacent island, respectively; Fout-Re is the output flux of the re-mineralized sedimentary organic carbon (SOC); Fbur is the burial flux of the SOC; Fin-lateral and Fout-lateral are the lateral downslope transport (vertical migration) input and output fluxes of the SOC along the trench wall in each cell; Plateral/total is the contribution of the Fin-lateral to the total OC input flux at a certain site (ratio of Fin-lateral to the sum of Fin-Terr, Fin-PP, and Fin-lateral); Flateral-net is the net flux of the OC input and output through lateral downslope transport; and the positive and negative values represent the net input and output, respectively. Due to the limitations of the equipment and technology, we did not sample the trench axis sediments in the Yap Trench. Sitebottom are the reference sites located at the bottom of the southern Yap Trench and the northern Yap Trench (points chosen as the orthogonal points from the shallow site to the trench axis). SiteReference and SiteChallengerDeep are two studying sites located in the Mariana Trench (Glud et al., 2013).
Figure 1. Conceptual model of the hadal trench (a); three topographic profiles of the Yap Trench (YT) (b); and locations of three push core sediments in the southern Yap Trench (SYT) (c, d). In a, the blue arrows indicate the organic carbon input pathways (e.g., the biological pump and lateral downslope current); the yellow shaded area represents the nepheloid layer; and the dark yellow sector represents the turbidity currents. In b and d, the red dots indicate the sample sites. In c and d, the brown lines indicate the positions of the seismic profiles in the YT. PHP: Philippine Plate; PAP: Pacific Plate; CAP: Caroline Plate; NA: Ngululu Atoll; YI: Yap Island; NYT: northern Yap Trench; SMT: southern Mariana Trench; SOT: Sorol Trough; WCR: West Caroline Rise; CIR: Caroline Island Ridge.
Figure 2. Vertical distribution of the bulk data for the sites. TOC is total organic carbon; MGS, the median grain size; TN, total nitrogen; C/N, the ratio of total carbon content vs. total nitrogen content; SSA, specific surface area. The blue squares, red dots, and green triangles represent the sediment samples from Cores DIVE149, DIVE151, and DIVE152, respectively.
Figure 3. Vertical profiles of the organic carbon (OC) proportions (P) (a, b, c) and contents (d, e, f) of the marine, terrestrial, and microorganism-reworked OC, respectively, in the southern Yap Trench (SYT) obtained using the Monte Carlo simulation (error bar: ±SD). The blue squares, red dots, and green triangles represent the sediment samples from Cores DIVE149, DIVE151, and DIVE152, respectively.
Figure 4. Relationships between the water depth and the DO uptake rate, and the water depth and the remineralization rate of the sedimentary organic carbon (SOC). The data for the Mariana and Tonga trenches is from Glud et al. (2013), Wenzhӧfer et al. (2016), Luo et al. (2018b), and Liu and Peng (2019). The dashed lines are the linear fitting curves with fitting formulas and a significance level of p<0.05. RSOC re-mineralization is the rate of SOC re-mineralization.
Figure 5. Vertical profiles of the sedimentary organic carbon (SOC) accumulation rates for Cores DIVE149 (blue squares), DIVE151 (red dots), and DIVE152 (green triangles).
Figure 6. A tentative organic carbon (OC) box model for the southern Yap Trench (SYT). The units of these values are g/(m2·a) (in terms of OC); the white arrows represent the settling fluxes of the particulate organic carbon from the euphotic layer and the adjacent islands; the yellow arrows represent the re-mineralization fluxes of the sedimentary organic carbon (SOC); the black arrows represent the burial fluxes of the SOC; the red arrows represent the lateral downslope migration fluxes; Fin-PP and Fin-Terr are the input fluxes of the primary production-derived OC and the potential terrestrial OC from the euphotic layer and the adjacent island, respectively; Fout-Re is the output flux of the re-mineralized SOC; Fbur is the burial flux of the SOC; and Fin-lateral and Fout-lateral are the lateral downslope SOC transport input and output fluxes (vertical migration) along the trench wall in each cell. Due to the limitations of the equipment and technology, we did not sample the trench axis sediments, and the reference site located at the bottom of the SYT is a hypothetical site, i.e., a point chosen as the orthogonal point from Site DIVE151 to the trench axis.
Figure 7. R-mode cluster analysis: pedigree chart of the sediment layers in the southern Yap Trench. The three clusters identified by the cluster analysis are defined by the orange boxes with a distance of 8.


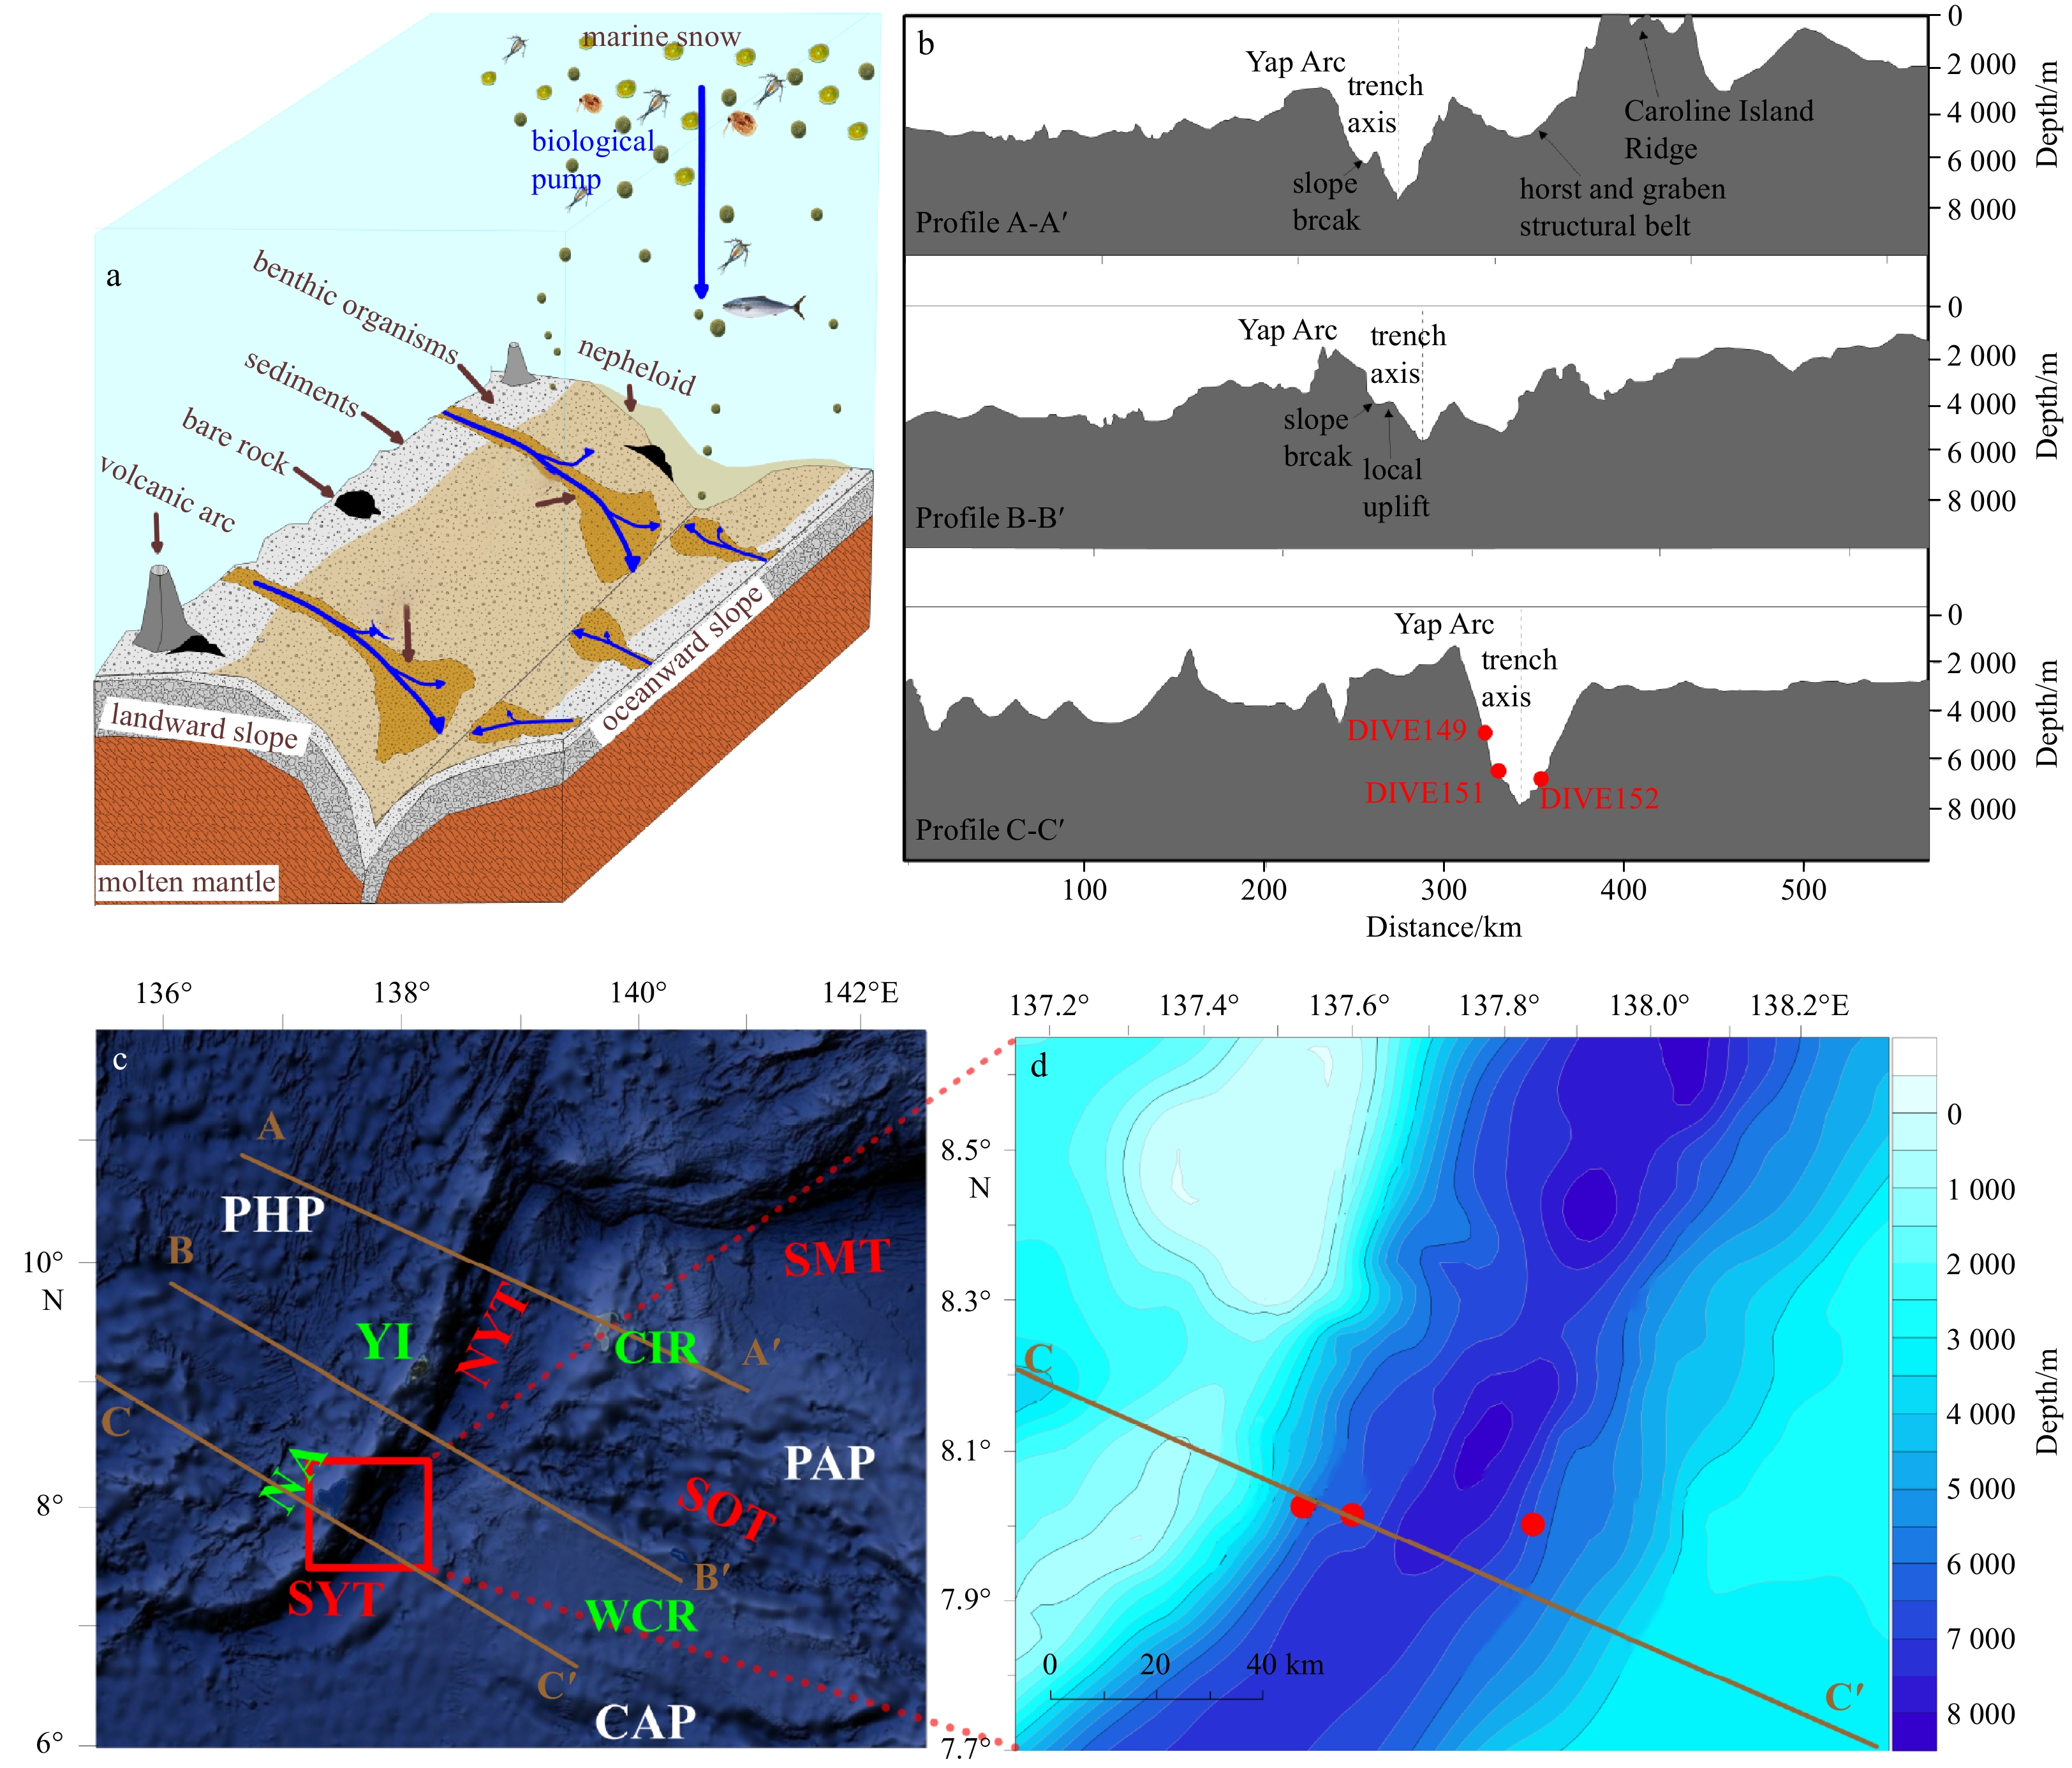
 DownLoad:
 DownLoad:


 DownLoad:


