Long Ma, Chenguang Liu, An Yang, Baohua Liu, Chenglong Xia. Characteristics of gravity anomalies and tectonic analysis of Enderby Land in East Antarctica and its adjacent areas[J]. Acta Oceanologica Sinica, 2023, 42(2): 94-103. doi: 10.1007/s13131-022-2029-x
Citation:
Long Ma, Chenguang Liu, An Yang, Baohua Liu, Chenglong Xia. Characteristics of gravity anomalies and tectonic analysis of Enderby Land in East Antarctica and its adjacent areas[J]. Acta Oceanologica Sinica, 2023, 42(2): 94-103. doi: 10.1007/s13131-022-2029-x
Long Ma, Chenguang Liu, An Yang, Baohua Liu, Chenglong Xia. Characteristics of gravity anomalies and tectonic analysis of Enderby Land in East Antarctica and its adjacent areas[J]. Acta Oceanologica Sinica, 2023, 42(2): 94-103. doi: 10.1007/s13131-022-2029-x
Citation:
Long Ma, Chenguang Liu, An Yang, Baohua Liu, Chenglong Xia. Characteristics of gravity anomalies and tectonic analysis of Enderby Land in East Antarctica and its adjacent areas[J]. Acta Oceanologica Sinica, 2023, 42(2): 94-103. doi: 10.1007/s13131-022-2029-x
First Institute of Oceanography, Ministry of Natural Resources, Qingdao 266061, China
2.
Key Laboratory of Marine Geology and Environment, Institute of Oceanology, Chinese Academy of Sciences, Qingdao 266071, China
3.
Laboratory for Marine Geology, Pilot National Laboratory for Marine Science and Technology (Qingdao), Qingdao 266237, China
4.
National Deep Sea Center, Ministry of Natural Resources, Qingdao 266237, China
5.
Naval Research Institute, Tianjin 300061, China
Funds:
The National Natural Science Foundation of China under contract No. 42006198; the Open Fund of the Key Laboratory of Marine Geology and Environment, Chinese Academy of Sciences under contract No. MGE2020KG02.
Enderby Land in East Antarctica and its adjacent areas, which are closely related to the Indian Plate in their geological evolution, have become one of the key zones for studies on how the Antarctic continent evolves. Based on the isostasy and flexure theories of the lithosphere and using the CRUST1.0 model as the depth constraint, this paper uses the gravity field model EIGEN-6C4 and topographic data to calculate the isostatic gravity anomalies of Enderby Land and its adjacent areas. Then, the crustal thickness of the study area is calculated, and three comprehensive geophysical interpretation profiles that vertically span the study area are plotted. The results show that the flexural isostatic gravity anomalies in Enderby Land and its adjacent areas are closely related to the regional tectonic setting, and the anomalies in different regions differ substantially, ranging from −50×10−5 m/s2 to 85×10−5 m/s2. A zone of high isostatic gravity anomalies (30×10−5–80×10−5 m/s2) is distributed outside the Cooperation Sea and Queen Maud Land, which may be plate remnants generated by early rifting. Except for the Kerguelen Plateau, which was formed by a hotspot and has a crustal thickness of 15 km, the thickness of the oceanic crust in other parts of the study area changes slightly by approximately 4–9 km, with the thinnest part being in Enderby Basin. The thickness of the inland crust along the coastline increases with the elevation, with the maximum thickness reaching 34 km. The isostatic gravity anomalies corresponding to the zone of high magnetic anomalies along the continental margin of Queen Maud Land are negative and small, with an isostatic adjustment trend indicating Moho surface uplift, and those on the edge of central Enderby Land are near zero, approaching the isostatic state, which may be caused by the magmatism at the early stage of rifting. The continental-oceanic boundary should be close to the contour line of the crustal thickness 10–12 km on the outer edge of the coastline.
During the early Cretaceous, with the splitting of the East Gondwana continent, the Antarctic continent was separated from the surrounding Australian, Indian, African and South American plates, and the continental margin of the cratons in the East Antarctic and ocean basins were gradually formed (McElhinny, 1970; Markl, 1974; Davis et al., 2019). Enderby Land in East Antarctica and its adjacent areas, located between 40°–80°E and 70°–60°S on the eastern edge of the Antarctic continent, were created when the edge of the East Indian Plate was separated from East Antarctica. The western part of the study area is extensively affected by fault belts, and there is a narrow continental shelf on the continental margin; the east part is affected by glaciers, so the width and scope of the continental shelf dramatically change (Stagg et al., 2004; Golynsky et al., 2013).
Figure
1.
Regional geological map of the study area. The terrain data are extracted from the ETOP01 model (Amante and Eakins, 2009), with a resolution of 1′×1′. The topographic data in local areas are supplemented by SRTM15_PLUS data (Tozer et al., 2019) with a resolution of 15″×15″, and the interval of elevation contours is 1 000 m. The main regional structures of the study are noted as: Queen Maud Land, Enderby Land, Mac. Robertson Land, Gunnerus Ridge, Cosmonauts Sea, Cooperation Sea, Enderby Basin, Kerguelen Plateau. The thick solid blue line represents the continental-oceanic boundary (COB) (Leitchenkov et al. 2014; Golynsky et al., 2013); the thick solid brown line represents the COB proposed by Davis et al. (2019); the thick solid red line is the Enderby Basin Anomaly (Gaina et al., 2007; Golynsky et al., 2007, 2013); the dashed black line is the boundary of Kerguelen Large Igneous Province (Golynsky et al., 2013). The same notation is used in the figures below.
There are different opinions on when the Enderby Basin was formed. Some believe that it was formed around 136 Ma (Davis et al., 2016), but the period of seafloor spreading between the Indian Plate and the Western Australian Plate occurred around 120.6–129.3 Ma according to interpretations of magnetic anomalies (Gee and Kent 2007; Williams et al., 2013). Marine geophysical investigations in the Enderby Basin and its adjacent areas and interpretations of related data can provide important data and a theoretical basis for relevant studies.
Many comprehensive studies have been conducted in this study area based on geological, geophysical and geochemical data (Golynsky et al., 2002, 2013; Gibbons et al., 2013). An Antarctic Continental Margin Magnetic Anomaly composed of broad offshore positive magnetic anomalies exists on the edge of the Antarctic continent and is parallel with the coastline. On this basis, the Enderby Basin Anomaly (EBA) has been identified. However, many scholars have argued about the causes of this anomaly. Some scholars have proposed that the EBA formed due to the strong action of magma on the passive continental margin (Hall, 1990; Holbrook et al., 1994; Gladczenko et al., 1998). Golynsky et al. (2013) regarded the EBA, which is approximately 450 km from the shoreline, as the continental-oceanic boundary (COB). According to gravity-seismic joint inversion data and the depth of the Moho surface, Davis et al. (2019) speculated that the COB should be 50–100 km north of the 1 000 m isobath and 150–300 km from the shoreline.
O’Donnell and Nyblade (2014) inverted the crustal thickness of the Antarctic continent based on the latest shared high-precision data and the Airy equilibrium gravity model, constrained by partial seismic sections, and contrasted it with the study of the African continent on the conjugate edge (Hansen et al., 2012; Ni and Helmberger, 2003). They proposed that the average crustal thickness of the East Antarctic craton plate is 40 km, and its structure is also affected by the abnormal orogeny of the middle and lower mantle. Ji et al. (2019) carried out 3D gravity inversion calculations based on AntGG (Scheinert et al., 2016) and Eigen-6C4 (Foerste et al., 2014) data, and the results show that the entire East Antarctic is dominated by high-density anomalies, locally affected by magma under-invasion, the strength of the lithosphere is reduced, forming a structural thinning area.
However, the current research on the crustal thickness of Antarctica is mainly carried out on the continent with a large scale, mainly on the deep crustal structure instead of focusing on the study area (Haeger and Kaban., 2019; Chen et al., 2018; Hansen et al., 2016; Lawrence et al., 2006). Few studies on gravity field inversion and dynamic characteristics have been conducted in the study area. The isostatic gravity anomalies are significant for exploring the interior structure and deep geodynamics of the lithosphere. Because the isostatic gravity anomaly can reflect the deviation of the actual crustal thickness from the isostatic crustal thickness and the characteristics of the lithospheric density. Meanwhile, the anomaly can overcome the positive correlation between free-air gravity anomalies and topography and the systematic effects between the Bouguer gravity anomaly and mountains and sea basins.
2.
Theory of isostasy and flexure of the lithosphere
The theory of lithospheric flexure shows how the elastic plate theory is applied in the lithosphere. As a rigid body with elastic properties, the lithosphere is deformed by loads on the surface of Earth. The Moho surface is part of the lithosphere, so it can also be deformed. In addition, there is a difference in the density on both sides of the Moho surface, which indicates that its deformation can inevitably cause gravity anomalies.
Te is the effective elastic thickness, E is the Young’s modulus, $ \sigma $ is the Poisson’s ratio, $ {\rho }_{\rm{m}} $ is the average mantle density, $ {\rho }_{\rm{c}} $ is the average crustal density, g is the acceleration of gravity, D is the rigidity of the lithosphere, h is the terrain, and w is the deflection.
After the Fourier transform, the following is obtained:
where k is the wave number, W (k) is the wave-number domain deflection, and H (k) is the wave-number domain depth. At this moment, using a fast method to calculate the gravity anomaly at the undulating interface (Parker, 1973), the gravity anomaly caused by the undulating interface w is
where G is the gravitational constant, T0 is the isostatic compensation depth, and F is the Fourier transform. The study area is characterized by substantial amounts of sea ice and sediment. To properly remove the gravity effect of ice and sediment, the density can be used as a reference to compensate for the material on the layer mentioned above to the corresponding terrain for terrain compensation and correction:
where hw is the seafloor elevation, his is the ice surface elevation, hice is the ice thickness, hs is the thickness of the sediment layer, and dice, dw, ds, and dcrust refer to the average densities of the ice layer, the water layer, the sediment layer, and the crust, respectively. Similarly, according to Eq. (6), the gravity effect caused by the terrain h after compensation and correction can be expressed as
where $ \Delta g $ is the free-air gravity anomaly.
Try different effective elastic thickness values Te to calculate the curvature of the compensation surface $h_{T_{\rm{e}}} $, then select different average compensation depth T0, subtract the Moho surface depth hCRUST1.0 of the CRUST1.0 (Laske et al., 2013), and calculate the root mean square :
Calculate to obtain the optimal average compensation depth T0 with the smallest RMS. On this basis, by calculating different effective elastic thickness values and comparing with the CRUST1.0, to obtain optimal Te and curvature of the compensation surface $h_{T_{\rm{e}}} $, finally acquire the Moho depth (H):
$$H=T_0+h_{{{T_{\rm{e}}}}} .$$
(10)
3.
Flexural isostatic correction
According to the theory of isostasy and flexure of the lithosphere, the optimal average compensation depth and effective elastic thickness can be calculated based on the terrain depth, crustal thickness and density difference. Then, the gravity effect caused by flexural deformation and the isostatic correction are calculated, and the isostatic correction is performed for the Bouguer gravity anomaly after removing the terrain gravity effect.
3.1
Data
The Southern Ocean has always been a key area for geophysical investigations. In recent years, scientists from different countries have carried out several comprehensive scientific investigations in this area and obtained a large amount of marine geophysical data. Nevertheless, due to a limited number of investigation voyages and data restrictions in this area, China has conducted few geophysical investigations in this area. The free-air gravity anomaly used in this paper is derived from the gravity field model EIGEN-6C4 (Foerste et al., 2014), and the height is 8 km (Fig. 2).
Figure
2.
Gravity anomaly and orographic gravity effect in Enderby Land and its adjacent areas. a. Free-air gravity anomaly, derived from the gravity field model EIGEN-6C4 (Foerste et al., 2014), and the height is 8 km, 10−5 m/s2. b. Compensated terrain, the average densities of the water layer, ice layer, upper sediment layer, and middle sediment layer were taken as 1.027 g/cm3, 0.917 g/cm3, 2.028 g/cm3, and 2.314 g/cm3, respectively (Table 1). The topography was converted by density ratio to equivalent complementary crustal terrain data, km. c. Terrain after compensation and correction, ice surface elevation minus water depth and ice thickness after plusing compensation terrain, km. d. Orographic gravity effect, gravity effect calculated by terrain after compensation and correction, 10−5 m/s2. e. Bouguer gravity anomaly, obtained by sbutracting orographic gravity effect from free-air gravity anomaly, 10−5 m/s2.
The data of the ice surface elevation and ice thickness in this paper are extracted from the ETOP01 model (Amante and Eakins, 2009), with a resolution of 1′×1′. The land and sea in the study area have great undulations. To ensure accuracy, the topographic data in local areas are supplemented by SRTM15_PLUS (Tozer et al., 2019) data with a resolution of 15″×15″. In addition, to reduce the influence of boundary effects, the topographic data are extended outward by 5°.
The density model of the water layer, ice layer, sediment layer in the study area can be obtained by combining the thickness of the sediment layer, the density distribution in the CRUST1.0 model, and the ETOP01 model parameters. The average density of the crust is 2.67 g/cm3, and the average density of the mantle is 3.27 g/cm3 (intercepting the model data in the study area to find that the crust in the study area is only divided into two layers: the upper sedimentary layer and the middle sedimentary layer, and there is no lower sedimentary layer. The specific parameters are shown in Table 1).
According to the above density parameter model, the average densities of water layer, ice layer, upper sedimentary layer and middle sedimentary layer were taken as 1.027 g/cm3, 0.917 g/cm3, 2.028 g/cm3, 2.314 g/cm3, respectively. The compensated terrain can be calculated according to Eq. (6):
The calculation results are shown in Figs 2b and c. The calculated orographic gravity effect after compensation and correction according to Eq. (8) is shown in Fig. 2d.
3.2
Calculation of isostatic compensation depth
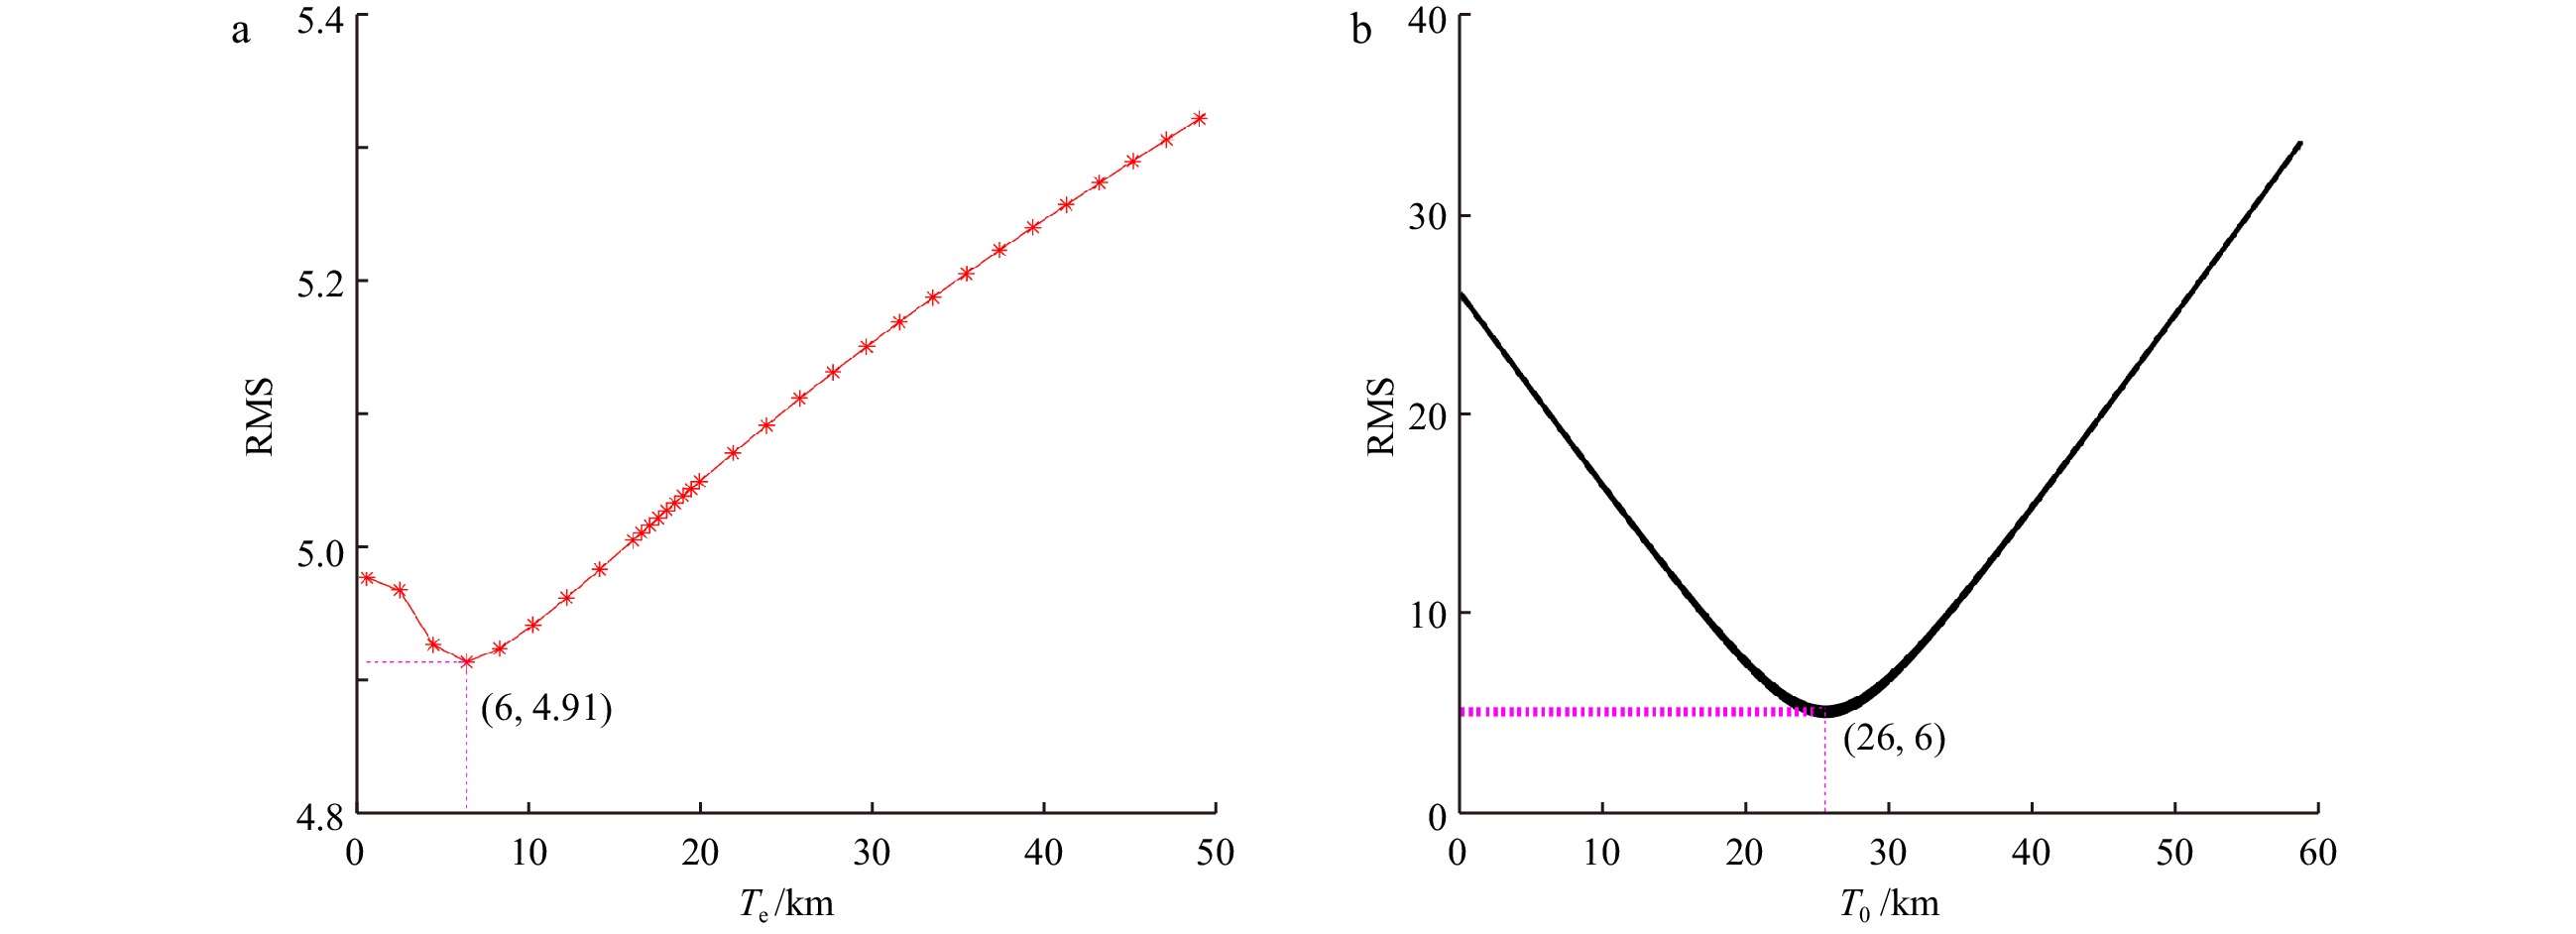
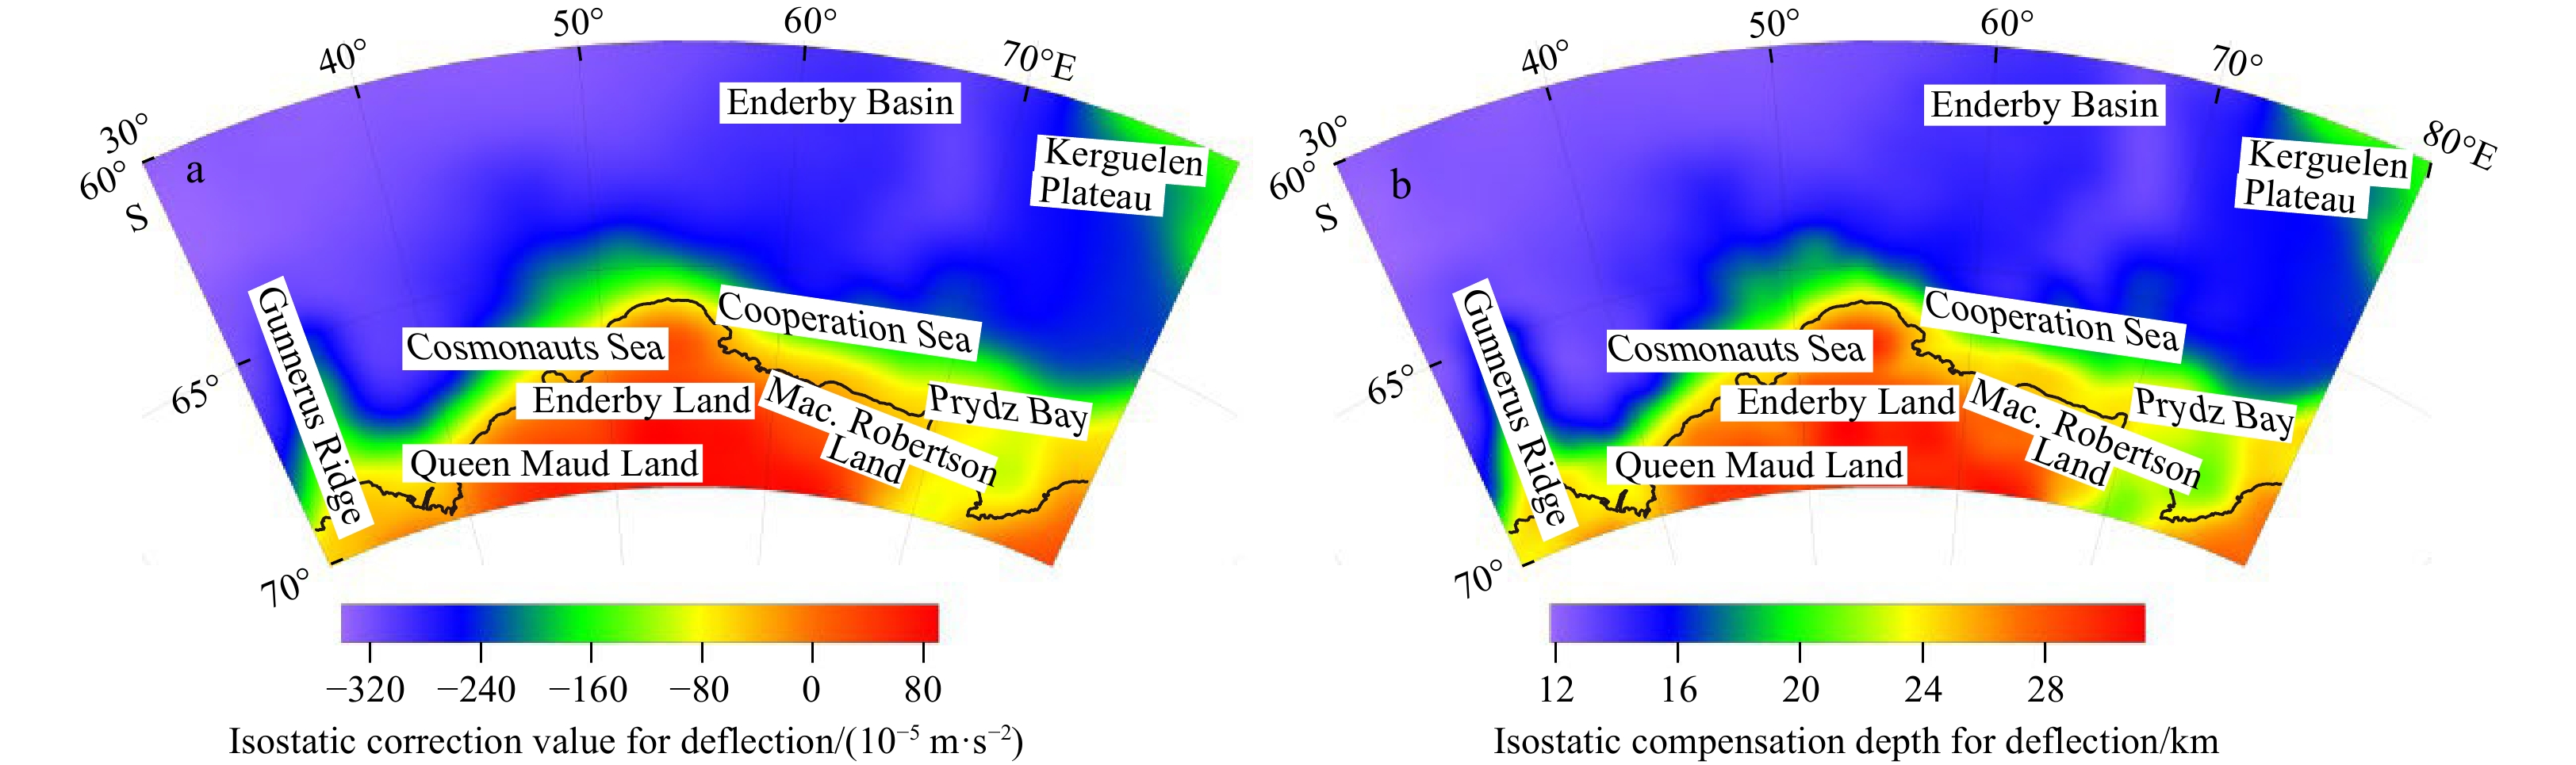
To reduce the influence of boundary effects, the boundaries in the four directions, i.e., east, south, west, and north, are extended outward by 5°. First, different effective elastic thicknesses can be used to calculate the curvature of the compensation surface. The test results show (Fig. 3a) that when the effective elastic thickness Te takes different values, the minimum root mean square (RMS) falls within the range where T0 is 25–27 km, which is consistent with the calculation result of the Airy model (Te=0). Therefore, the optimal average compensation depth T0 in this study area is 26 km. After T0 is determined, the results can be compared when Te takes different values. The minimum RMS of the isostatic compensation depth for deflection and the interpolation of CRUST1.0 is 4.91 km when Te is 6 km (Fig. 3a). According to the calculation results, at T0=26 km and Te=6 km (Fig. 3b), the isostatic correction (Fig. 4a) and the distribution of the isostatic compensation depth for deflection (Fig. 4b) can be calculated.
Figure
3.
Comparison between isostatic compensation depth and CRUST1.0 depth. a. Comparison of different effective elastic thicknesses, the minimum RMS is 4.91 with Te is 6 km. b. Comparison between mean compensation depth and CRUST1.0, the minimum RMS is 6 with T0 is 26 km.
Figure
4.
Isostatic correction and compensation depth. a. Isostatic correction value for deflection, gravity effect calculated by the substance between H and T0, 10−5m/s2. b. Isostatic compensation depth for deflection. The optimal average compensation depth T0=26 km. Calculated the curvature of compensation surface ${h}_{T_{\rm{e}}}$ with Te=6 km. The calculation result is the best fit with CRUST1.0, and the RMS is the smallest.
Isostatic gravity anomalies describe the isostatic state of the actual crust to identify the characteristics of lithospheric density (Zeng, 2005). According to isostatic theory, negative isostatic anomalies indicate that the density below the isostatic compensation surface is less than the normal mantle density. Therefore, the isostatic adjustment in the study area is a process of Moho surface uplift or mantle material upwelling. In contrast, positive isostatic anomalies are caused by a material “surplus” or a high density above the compensation surface. Thus, the adjustment is conducted through breakup of the lithosphere or sinking of the Moho surface (Wang et al., 2009; Zhang et al., 2020).
The isostatic gravity anomalies due to the deflection of Enderby Land and its adjacent areas fall within −50×10−5–85×10−5 m/s2 (Fig. 5). The results show that isostatic gravity anomalies are closely related to the regional tectonic setting and vary by region (Fig. 6). Negative isostatic anomalies appear in the nearshore areas of Gunnerus Ridge, Queen Maud Land, the Cooperation Sea, and parts of Prydz Bay, possibly because the actual crustal thickness in the study area is larger than the compensation depth. In particular, Gunnerus Ridge has the lowest isostatic gravity anomaly of −50×10−5 m/s2, which reflects the difference in the lithospheric fabric on the sea ridge and the isostatic adjustment trend of the Moho surface uplift.
Figure
5.
Flexural isostatic gravity anomalies (the solid blue, solid brown, solid red and dashed black line instructions are the same as in Fig. 1).
Figure
6.
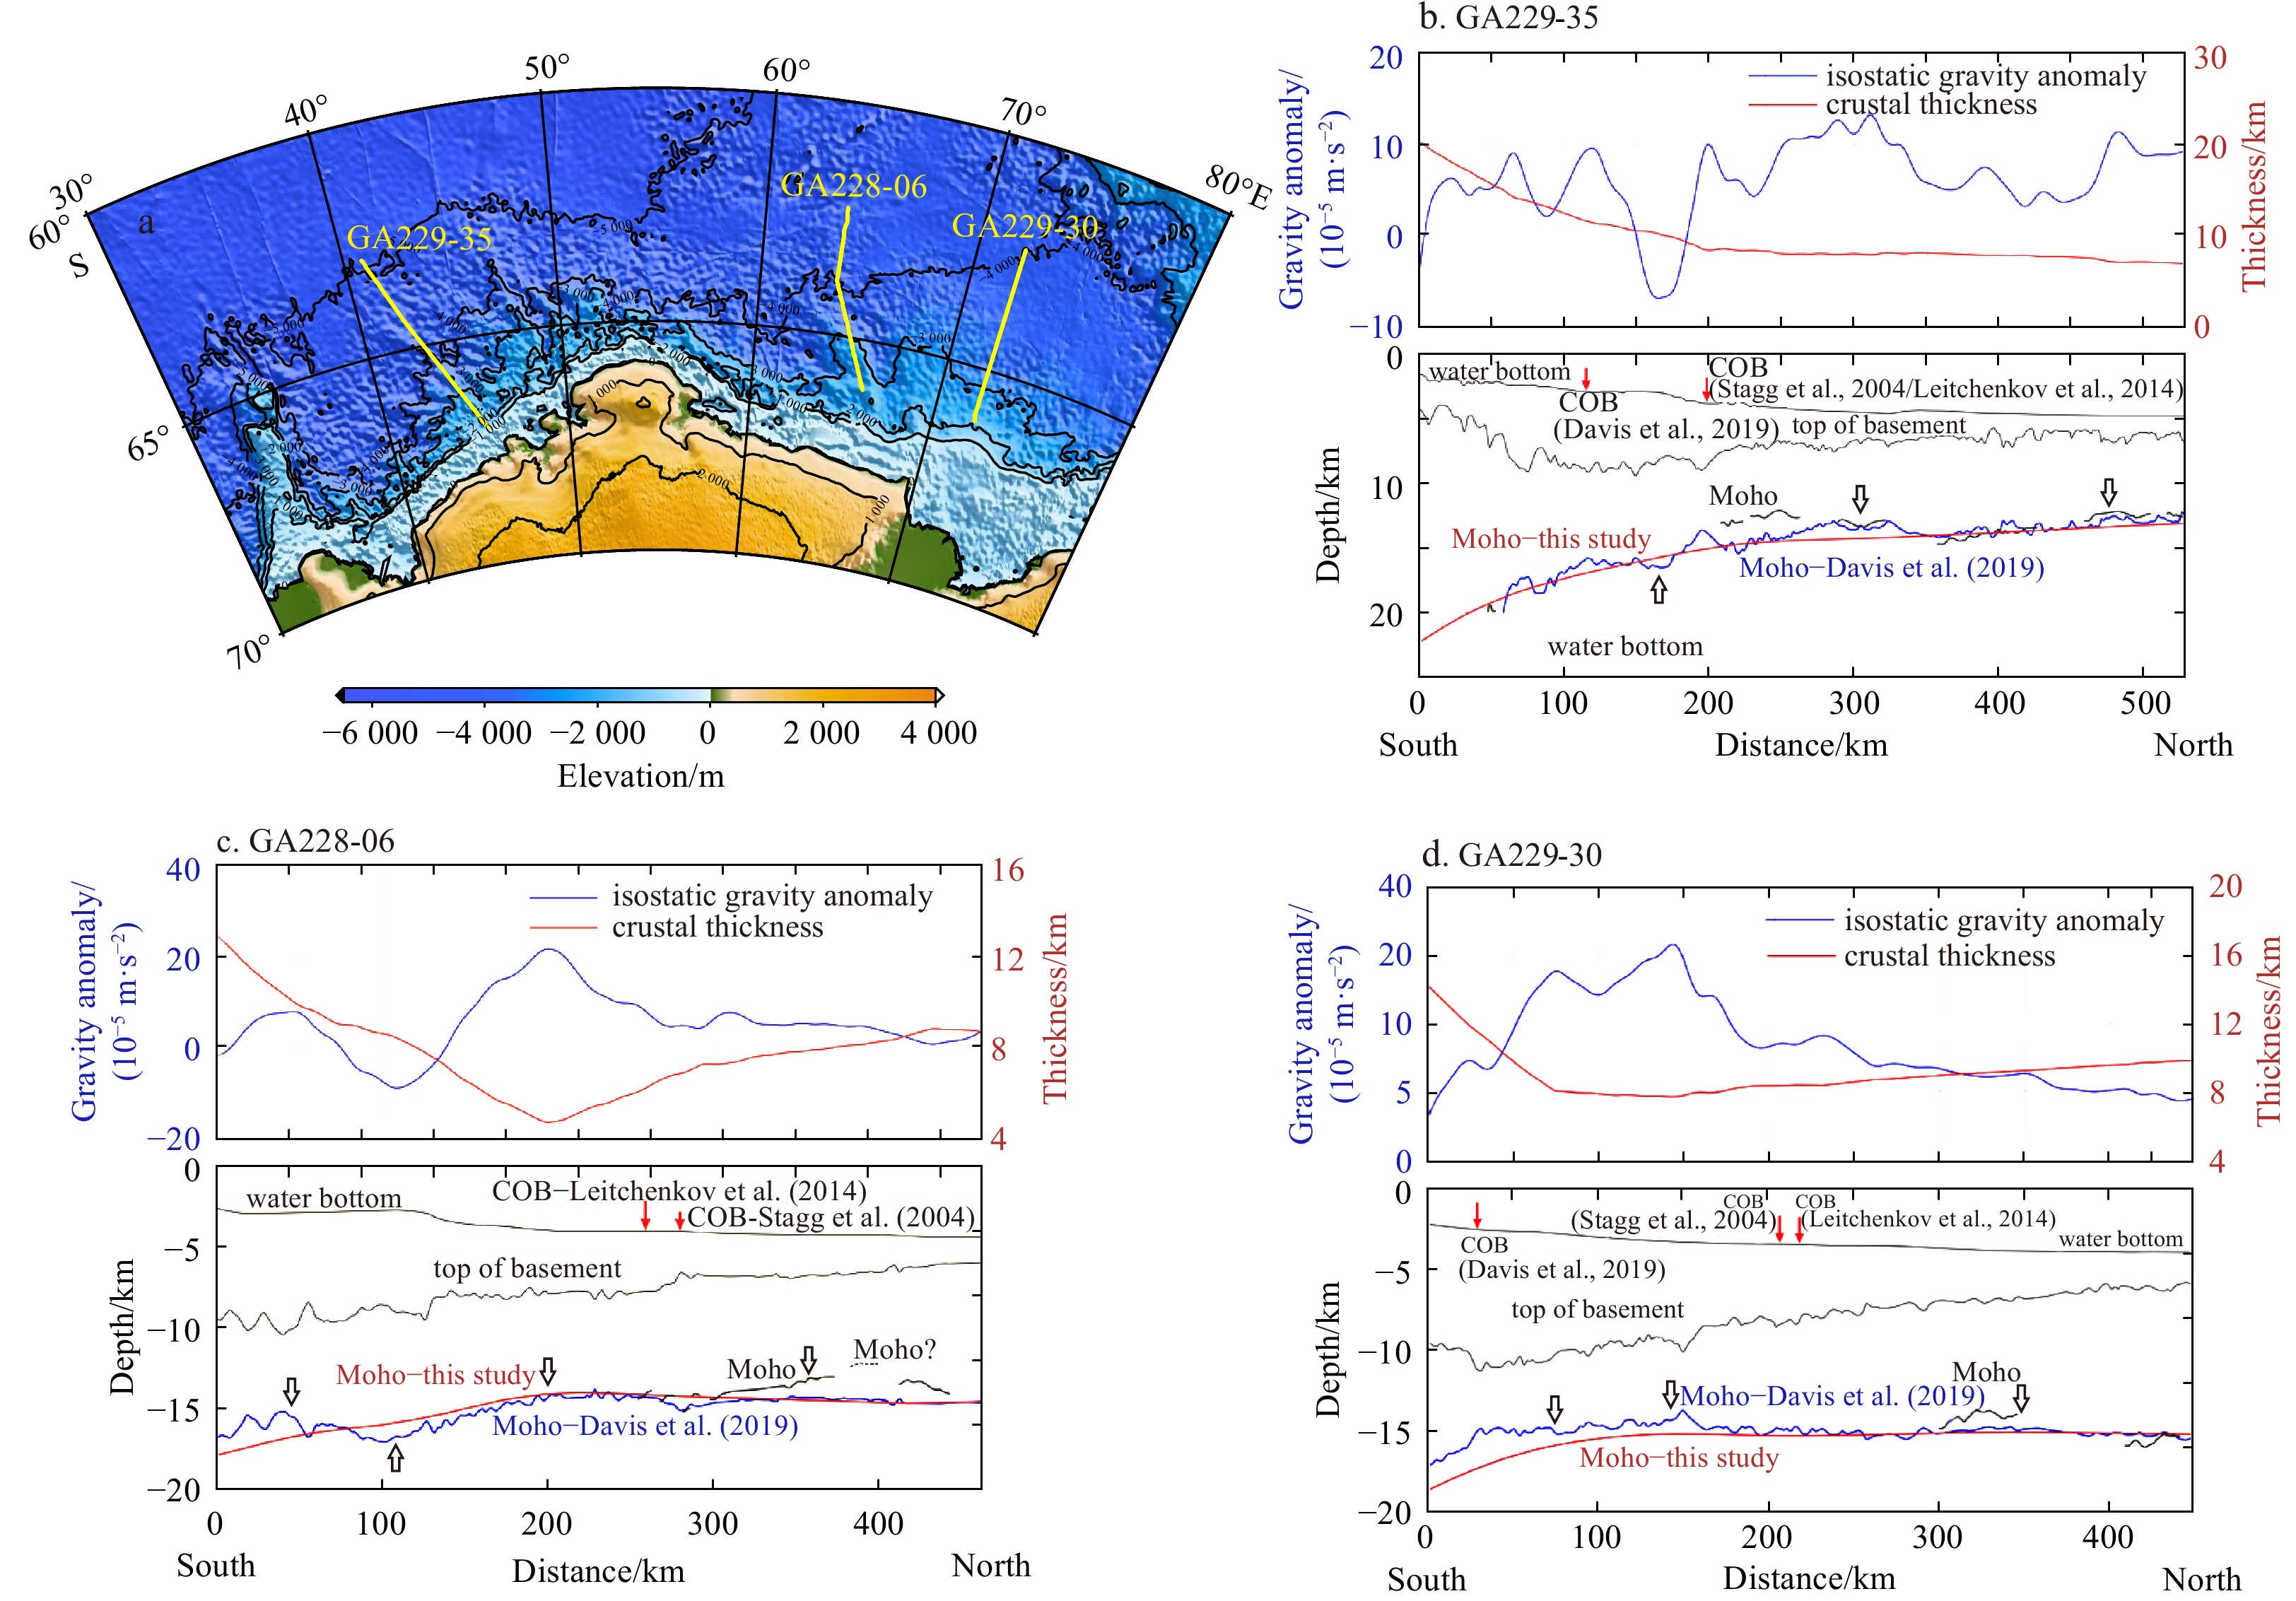
Comprehensive geophysical interpretation profile. a. Topographic map and distribution map of seismic lines in the study area, the interval of elevation contours is 1 000 m, the solid yellow line indicates the position of the comprehensive geophysical interpretation profile. b. Line GA229-35 comprehensive interpretation profile, the red line in the above figure is the crustal thickness, and the blue line is the isostatic gravity anomaly. The red arrows in the figure below indicate the COB proposed by Stagg et al. (2004), Leitchenkov et al. (2014), and Davis et al. (2019), respectively. The red line is the Moho depth calculated for this study, and the blue line is the Moho depth calculated by Davis et al. (2019), the hollow arrow is the direction of isostatic adjustment, the same below. c. Comprehensive interpretation profile of line GA228-06. d. Comprehensive interpretation profile of line GA229-30.
A zone of high isostatic gravity anomalies (30×10−5–80×10−5 m/s2) is distributed from 30°E to the sea area surrounding Enderby Land in East Antarctica (in the Cooperation Sea), and the outer side of the zone corresponds to the COB estimated by Davis et al. (2019). The zone is located on the rift-thinning crustal belt, and most of the sediments belong to the late rifting products, irregularly distributed magnetic anomalies and fault zones are identified (Rotstein et al., 2001), with high flexural isostatic gravity anomalies (80×10−5 m/s2, Fig. 5), indicating that compared to other positions, the lithosphere contains high-density anomalous bodies, which may be the plate remnants produced by early rifting (Stagg et al., 2004). The isostatic gravity anomalies in most areas in the north of the zone are near zero, indicating that most areas have approached the isostatic state. However, a zone with high isostatic gravity anomalies (30×10−5–60×10−5 m/s2) is distributed in the middle area of the Enderby Basin and the Kerguelen Plateau, which is consistent with the fact that the Moho surface in this area sinks (Fig. 4b), and the thickness of the crust increases (Fig. 7). Stagg et al. (2004) obtained 7.60–7.95 km/s seismic wave velocity records on the 4 km thick overlying crust by deploying several seismic stations in the Enderby Basin and its adjacent areas, and speculated that it may be formed by the upwelling of mantle material caused by the fault zone which was produced by thin crust, or caused by magma intrusion into the crust. There are several traps of low isostatic gravity anomalies between the Cosmonauts Sea and Queen Maud Land, and the analysis shows that the thickness of the crust decreases during the tectonic evolution of plate cracking, which makes the isostatic compensation depth shallower than the actual Moho surface and causes asthenosphere material upwelling and Moho surface uplift. The main areas in Enderby Land and Mac. Robertson Land all have positive anomalies, with a magnitude of 0–80×10−5 m/s2. In the central alluvial fan area of Prydz Bay, there is a zone with high isostatic gravity anomalies (25×10–5–80×10−5 m/s2), indicating that this zone has not yet reached the isostatic state, and the depth of its Moho surface is shallower than that of the surrounding areas.
Figure
7.
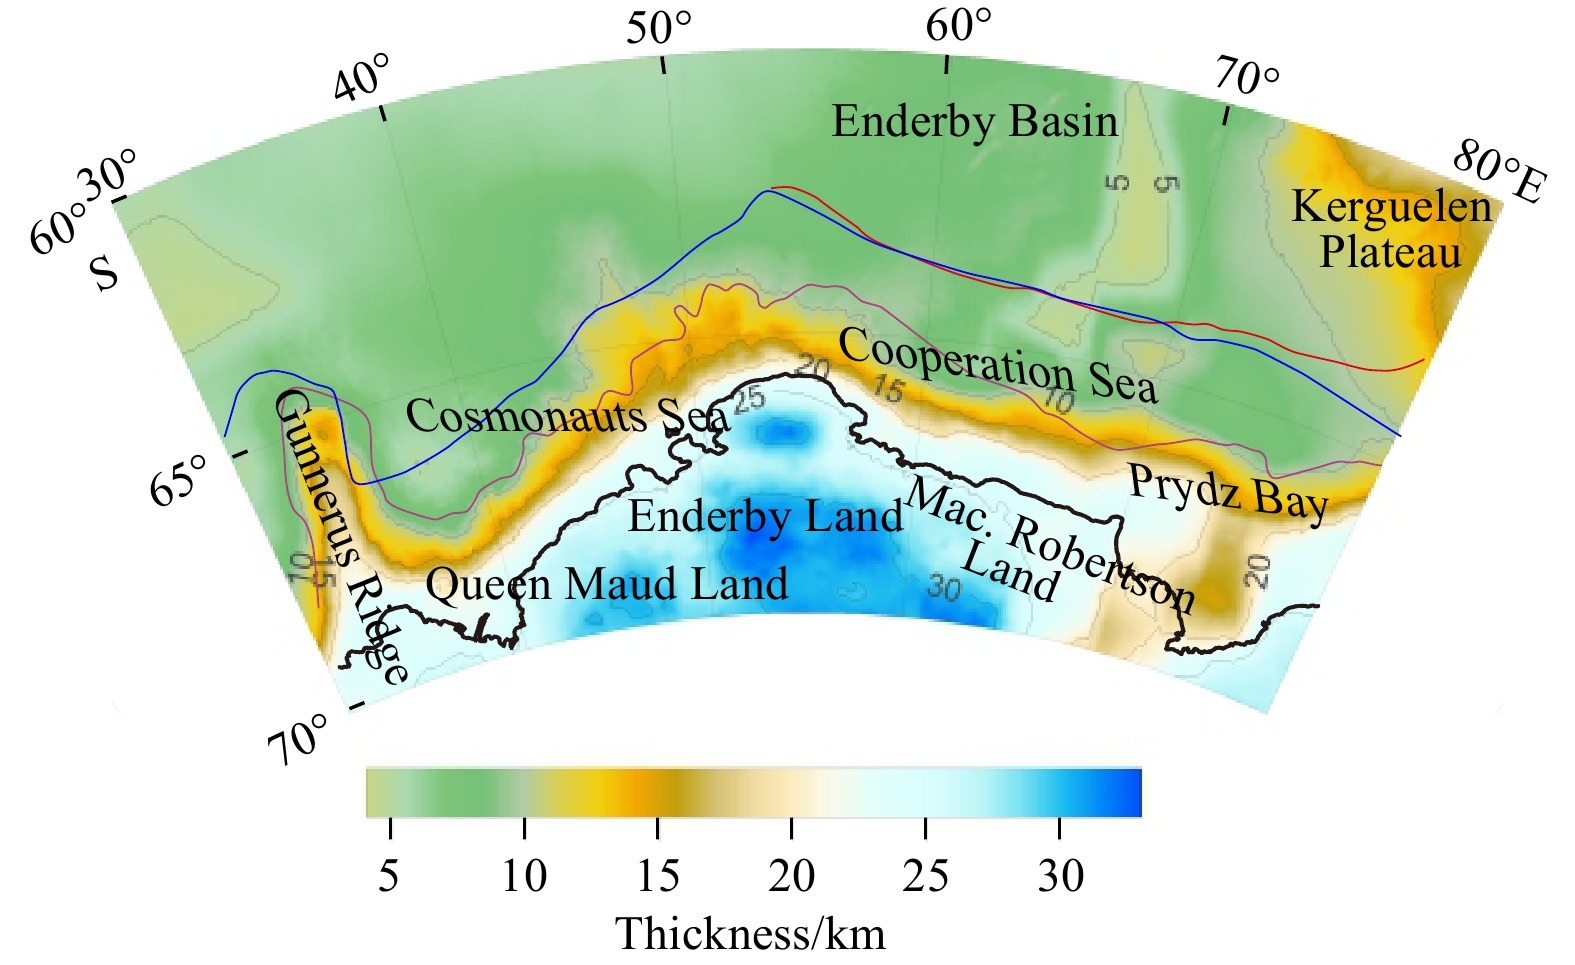
Crustal thickness. The solid blue, solid brown, solid red and dashed black line instructions are the same as in Fig. 1.
4.2
Relationship between isostatic anomalies and crustal thickness
Due to the difference in the processing results and the understanding of the geophysical data in the study area, there are doubts about the crustal structure and the COB of Enderby Land and its adjacent basins. Based on a large amount of geophysical data, Davis et al. (2019) divided the Enderby Basin and its adjacent areas into three parts according to the topography and geomorphology: western, central and eastern parts. The central tectonic domain is divided into two zones with totally different oceanic crust shapes by a high magnetic anomaly zone (EBA; Golynsky et al. 2007, as shown in Fig. 8). The western tectonic domain has many fault zones and a very thin oceanic crust. On this basis, it is speculated that the thin continental crust covers an area with a width of 450 km, spanning from the coastline to the EBA. However, the seismic reflection and marine magnetic data reveal that this high magnetic anomaly zone corresponds to the rise of the basin basement and oceanic crust oriented toward the continent (Stagg et al., 2006). Therefore, this high magnetic anomaly zone is regarded as the COB (Stagg et al., 2004; Golynsky et al., 2013).
Figure
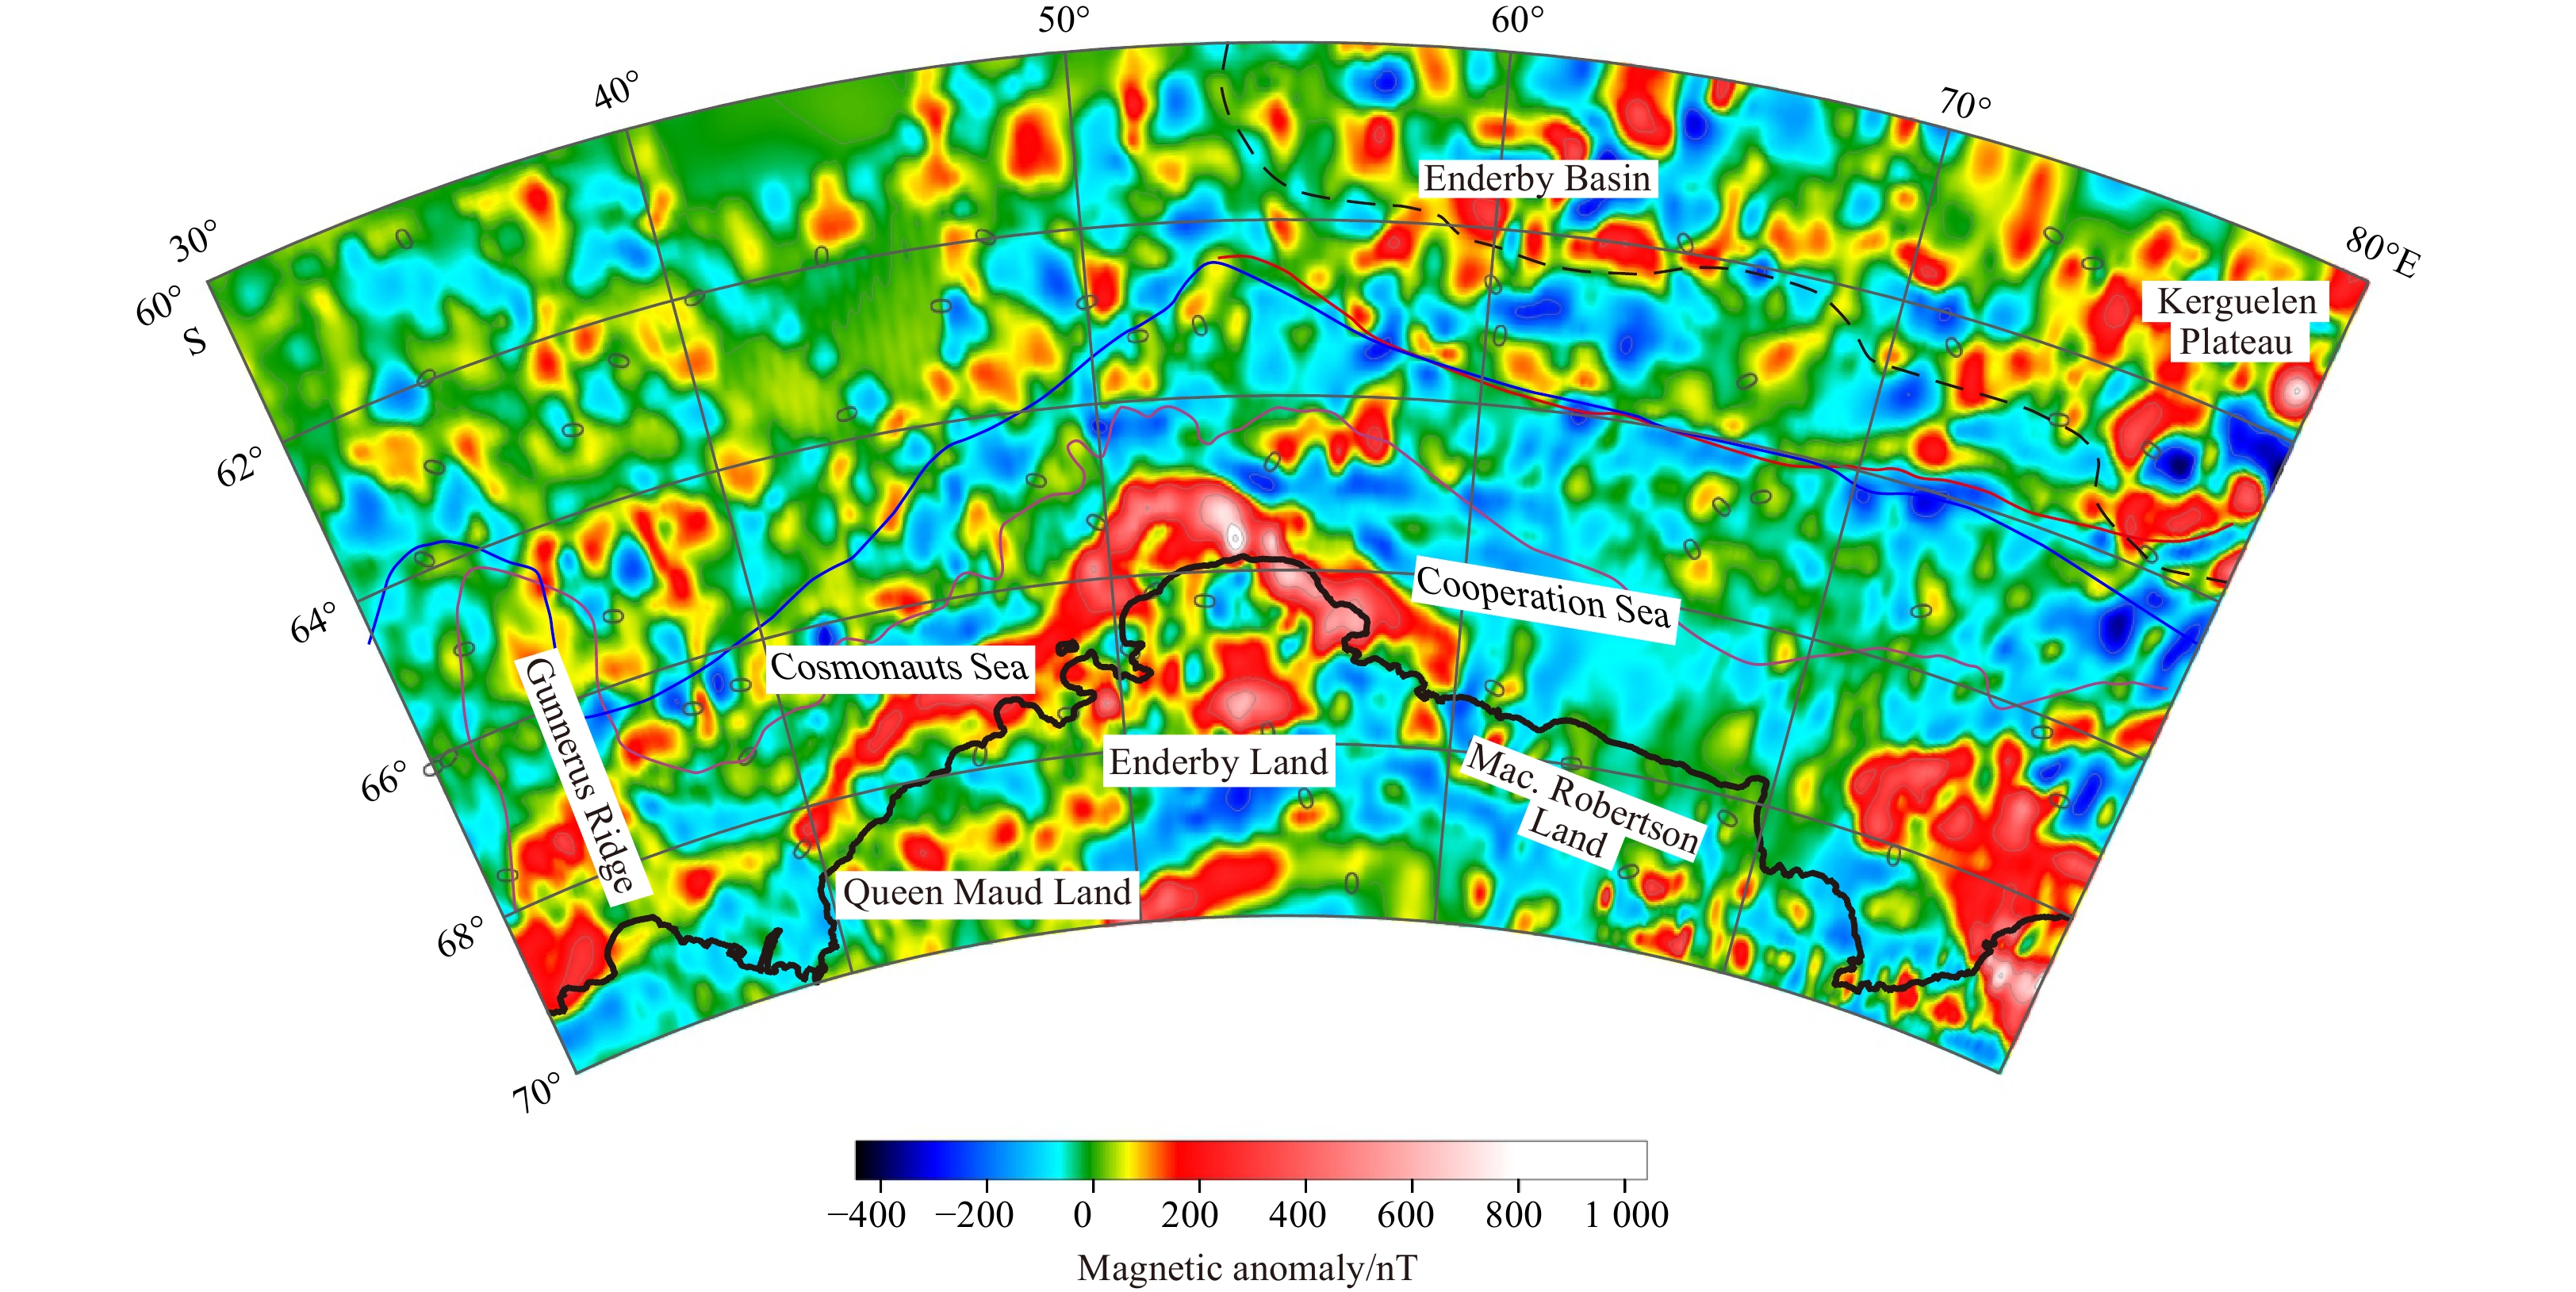
8.
Magnetic anomaly: derived from the global Earth Magnetic Anomaly Grid EMAG2v3 (Meyer et al., 2017), which compiled from satellite, ship, and airborne magnetic measurements. The altitude of EMAG2v3 is 4 km above the geoid, with a resolution of 2′. The solid blue, solid brown, solid red and dashed black line instructions are the same as in Fig. 1.
For the aforementioned problems, this study analyzes the changing and adjustment trends of the crustal thickness and the flexural isostatic gravity anomalies in the study area by calculating the flexural isostatic gravity anomalies and plotting three comprehensive geophysical profiles (Fig. 6).
GA229-35 starts from the Enderby Basin and ends in the Cosmonauts Sea. Along the survey line, most isostatic gravity anomalies are positive, within −10×10−5–15×10−5 m/s2, but the isostatic gravity anomalies between the previously identified COBs are negative, and the isostatic adjustment trend is reflected by the Moho surface uplift. The crustal thickness of previously proposed COBs is 8–11 km, indicating an obvious decreasing trend (from 20 km to 8 km). The depth of the Moho surface calculated in this study is consistent with the results obtained by Davis et al. (2019) and generally corresponds to the Moho surface interpreted by the seismic profile. The trend of isostatic adjustment is also consistent with the interpretation results of the seismic profile.
GA228-06 starts from Kerguelen Large Igneous Province and ends in the central part of Prydz Bay. Along the survey line, the isostatic gravity anomalies all fall within –10×10−5–22×10−5 m/s2. For the first 200 km of the profile, the isostatic gravity anomalies change significantly, and the isostatic adjustment shows the opposite trend. The isostatic gravity anomalies gradually decrease in the second half of the profile, and the crust tends to become isostatic. Changes in the overall crustal thickness exhibit a V shape, decreasing from 13 km to 5 km and then gradually increasing to approximately 8 km. The position where the crustal thickness becomes stable is in the south of the COB identified by Stagg et al. (2004) and Leitchenkov et al. (2014). In the second half, the position of the calculated Moho surface differs by 3–5 km from that of the seismic profile, the isostatic gravity anomalies are positive, and the Moho surface is downwardly adjusted.
GA229-30 starts from the Enderby Basin and ends in the Cooperation Sea. Along the survey line, the isostatic gravity anomalies all fall within 2×10⁻⁵–16×10−5 m/s2. Based on the previously identified COBs, the crustal thickness of the position determined by Davis et al. (2019) is close to 12 km, and there is a clear decreasing trend. However, the crustal thickness at the position identified by Stagg et al. (2004) and Leitchenkov et al. (2014) tends to be stable at 8 km. According to the numerical analysis of isostatic gravity anomalies, the overall Moho surface along the profile sinks. The depth of the Moho surface identified by the seismic reflection profile is consistent with the depth distribution calculated in this study, and the difference is within ±2 km. Therefore, the COB should be in the south of the position identified by Stagg et al. (2004) and Leitchenkov et al. (2014) and close to the position identified by Davis et al. (2019).
4.3
Interpretation of gravity and magnetic data
Forming at a speed of less than 15 mm/a, the western oceanic crust in the study area is the youngest in the Enderby Basin, with clear fault zones (Davis et al., 2016). Except for the Kerguelen Plateau formed by the Kerguelen hotspot, which has a crustal thickness of 15 km, the crustal thickness (Fig. 7) in other parts of the study area changes slightly and is approximately 4–9 km, with the thinnest part being in the Enderby Basin. The thickness of the inland crust along the coastline increases with elevation, with the maximum reaching 34 km. When defining the Continental-Ocean Transition Zone on the nonvolcanic continental margin, Minshull (2009) proposed that the crust becomes increasingly thin toward the continental boundary. The crustal thickness in the inland zone with negative isostatic gravity anomalies in Prydz Bay is thin, with a thickness of 18–20 km, which indicates that there may also be magmatism in the area that causes Moho surface uplift. From north to south, there is a transition zone where the crustal thickness obviously increases from 6–8 km to 12–15 km. The analysis results of the isostatic gravity anomalies show that the continuous volcanic activities may cause the crustal thickness of Gunnerus Ridge to increase from 10 km to 18 km.
Based on the multisource magnetic data and the multichannel seismic reflection profile data, the interface where the upper crustal velocity plunges is determined as the COB. However, upon analysis of the crustal thickness and the comprehensive geophysical profile, we believe that the actual COB should be close to the contour line of the crustal thickness 10–12 km on the outer edge of the coastline, which approaches the COB proposed by Davis et al. (2019).
The COB proposed by Davis et al. (2019) basically coincides with the contour line for a crustal thickness of 10–12 km but is different from the predicted position of high magnetic anomalies. There is a zone of high magnetic anomalies along the continental margin of Enderby Land in Antarctica. Golynsky et al. (2013) believed that these anomalies are mainly caused by the basic or ultrabasic magmatism at the early stage of continental breakup (oceanic edge-effects); Jokat et al. (2010) proposed that they are caused by the oceanic edge effect. The results of this study show that the isostatic gravity anomalies corresponding to the zone of high magnetic anomalies along the continental margin of Queen Maud Land are negative and small, with an isostatic adjustment trend indicating Moho surface uplift, and those on the edge of central Enderby Land are near zero, approaching the isostatic state, which may be caused by the magmatism at the early stage of rifting (Fig. 8).
5.
Conclusions
Based on the regional isostatic theory, this paper uses the gravity field model EIGEN-6C4 and the digital elevation data of ETOP01 and STRM15_PLUS to calculate the flexural isostatic gravity anomalies in Enderby Land and its adjacent areas. Then, the crustal thickness of the study area is calculated, and three comprehensive geophysical interpretation profiles are plotted. Based on the isostatic gravity anomalies in Enderby Land and its adjacent areas, the depth of the Moho surface and the crustal thickness in the study area are calculated. In addition, this study analyzes the crustal structure along the profile and the trend of isostatic adjustment. The calculation results are consistent with the previously obtained seismic interpretation profiles and the gravity-seismic joint inversion results. The following findings are obtained:
(1) The results show that the flexural isostatic gravity anomalies in Enderby Land and its adjacent areas are closely related to the regional tectonic setting and fall within −50×10−5–85×10−5 m/s2. There is a zone of high isostatic gravity anomalies (30–80×10−5 m/s2) between 30°E and the outer side of the Cooperation Sea. It is speculated that compared to other positions, the lithosphere has high-density anomalous bodies, which may be the plate remnants generated by early rifting. There are several traps of low isostatic gravity anomalies between the Cooperation Sea and Queen Maud Land. Based on our analysis, we propose that the thickness of the crust decreases during the tectonic evolution of plate cracking, which makes the isostatic compensation depth shallower than the actual Moho surface and causes asthenosphere material upwelling and Moho surface uplift.
(2) Except for the Kerguelen Plateau, which was formed by a hotspot and has a crustal thickness of 15 km, the crustal thickness in the other parts of the study area changes slightly and is approximately 4–9 km, with the thinnest part being in the Enderby Basin. The thickness of the inland crust along the coastline increases with the elevation, with the maximum reaching 34 km. The analysis results of the isostatic gravity anomalies show that the continuous volcanic activities may cause the crustal thickness of Gunnerus Ridge to increase from 10 km to 18 km.
(3) The isostatic gravity anomalies corresponding to the zone of high magnetic anomalies along the continental margin of Queen Maud Land are negative and small, with an isostatic adjustment trend indicating the Moho surface uplift, and those on the edge of central Enderby Land are near zero, approaching the isostatic state, which may be caused by the magmatism at the early stage of rifting. This paper proposes that the actual COB should be close to the contour line of the crustal thickness 10–12 km on the outer edge of the coastline.
Amante C, Eakins B W. 2009. ETOPO1 1 Arc-Minute Global Relief Model: Procedures, Data Sources and Analysis. NOAA Technical Memorandum NESDIS NGDC-24. Bouder, CO: National Geophysical Data Center, NOAA.
Belyatsky B V, Rodionov N V, Antonov A V, et al. 2011. The 3.98–3.63 Ga zircons as indicators of major processes operating in the ancient continental crust of the east Antarctic shield (Enderby Land). Doklady Earth Sciences, 438(Pt 2): 770–774
Chauvet F, Sapin F, Geoffroy L, et al. 2021. Conjugate volcanic passive margins in the austral segment of the South Atlantic-Architecture and development. Earth-Science Reviews, 212: 103461. doi: 10.1016/j.earscirev.2020.103461
Chen Bo. 2013. The effective elastic thickness over China and surroundings and its lithosphere dynamic implication (in Chinese)[dissertation]. Wuhan: China University of Geosciences
Chen Bo, Haeger C, Kaban M K, et al. 2018. Variations of the effective elastic thickness reveal tectonic fragmentation of the Antarctic lithosphere. Tectonophysics, 746: 412–424. doi: 10.1016/j.tecto.2017.06.012
Davis J K, Lawver L A, Norton I O, et al. 2016. New Somali Basin magnetic anomalies and a plate model for the early Indian Ocean. Gondwana Research, 34: 16–28. doi: 10.1016/j.gr.2016.02.010
Davis J K, Lawver L A, Norton I O, et al. 2019. The crustal structure of the Enderby Basin, East Antarctica. Marine Geophysical Research, 40(1): 1–16. doi: 10.1007/s11001-018-9356-5
DePaolo D J, Manton W I, Grew E S, et al. 1982. Sm-Nd, Rb-Sr and U-Th-Pb systematics of granulite facies rocks from Fyfe Hills, Enderby Land, Antarctica. Nature, 298(5875): 614–618. doi: 10.1038/298614a0
Foerste C, Bruinsma S L, Abrykosov O, et al. 2014. EIGEN-6C4 The latest combined global gravity field model including GOCE data up to degree and order 2190 of GFZ Potsdam and GRGS Toulouse. Potsdam: GFZ Data Services
Gaina C, Müller R D, Brown B, et al. 2007. Breakup and early seafloor spreading between India and Antarctica. Geophysical Journal of the Royal Astronomical Society, 170(1): 151–169. doi: 10.1111/j.1365-246X.2007.03450.x
Gee J S, Kent D V. 2007. Source of oceanic magnetic anomalies and the geomagnetic polarity timescale. Treatise on Geophysics, 5: 455–507. doi: 10.1016/B978-044452748-6/00097-3
Gibbons A D, Whittaker J M, Müller R D. 2013. The breakup of East Gondwana: Assimilating constraints from Cretaceous ocean basins around India into a best-fit tectonic model. Journal of Geophysical Research: Solid Earth, 118(3): 808–822. doi: 10.1002/jgrb.50079
Gladczenko T P, Skogseid J, Eldhom O. 1998. Namibia volcanic margin. Marine Geophysical Researches, 20: 313–341. doi: 10.1023/A:1004746101320
Golynsky A V, Alyavdin S V, Masolov V N, et al. 2002. The composite magnetic anomaly map of the East Antarctic. Tectonophysics, 347(1–3): 109–120
Golynsky A, Blankenship D, Chiapini M, et al. 2007. New magnetic anomaly map of East Antarctica and surrounding regions. In: Proceedings for the Tenth International Symposium on Antarctic Earth Sciences. USGS Open-FileReport 2007-1047, Short Research Paper 50: 1–4
Golynsky A V, Ivanov S V, Kazankov A J, et al. 2013. New continental margin magnetic anomalies of East Antarctica. Tectonophysics, 585: 172–184. doi: 10.1016/j.tecto.2012.06.043
Gray D R, Foster D A, Meert J G, et al. 2008. A Damara orogen perspective on the assembly of southwestern Gondwana. Geological Society, London, Special Publications, 294(1): 257–278
Grew E S, Yates M G, Wilson C J L. 2008. Aureoles of Pb(II)-enriched feldspar around monazite in paragneiss and anatectic pods of the Napier Complex, Enderby Land, East Antarctica: the roles of dissolution-reprecipitation and diffusion. Contributions to Mineralogy and Petrology, 155(3): 363–378. doi: 10.1007/s00410-007-0247-z
Haeger C, Kaban M K. 2019. Decompensative gravity anomalies reveal the structure of the upper crust of Antarctica. Pure and Applied Geophysics, 176(10): 4401–4414. doi: 10.1007/s00024-019-02212-5
Hall D J. 1990. Gulf Coast-East Coast magnetic anomaly I: Root of the main, crustal decollement for the Appalachian-Ouachita orogen. Geology, 18(9): 862–865. doi: 10.1130/0091-7613(1990)018<0862:GCECMA>2.3.CO;2
Hansen S E, Kenyon L M, Graw J H, et al. 2016. Crustal structure beneath the Northern Transantarctic Mountains and Wilkes Subglacial Basin: Implications for tectonic origins. Journal of Geophysical Research: Solid Earth, 121(2): 812–825. doi: 10.1002/2015JB012325
Hansen S E, Nyblade A A, Benoit M H. 2012. Mantle structure beneath Africa and Arabia from adaptively parameterized P-wave tomography: Implications for the origin of Cenozoic Afro-Arabian tectonism. Earth and Planetary Science Letters, 319–320: 23–34
Harley S L, Black L P. 1997. A revised Archaean chronology for the Napier Complex, Enderby Land, from SHRIMP ion-microprobe studies. Antarctic Science, 9(1): 74–91. doi: 10.1017/S0954102097000102
Holbrook W S, Purdy G M, Sheridan R E, et al. 1994. Seismic structure of the U. S. Mid-Atlantic continental margin. Journal of Geophysical Research: Solid Earth, 99(B9): 17871–17891. doi: 10.1029/94JB00729
Ishizuka H. 2008a. An overview of geological studies of JARE in the Napier Complex, Enderby Land, East Antarctica. Geological Society, London, Special Publications, 308(1): 121–138
Ishizuka H. 2008b. Protoliths of the Napier Complex in Enderby Land, East Antarctica; an overview and implication for crustal formation of Archaean continents. Journal of Mineralogical and Petrological Sciences, 103(4): 218–225. doi: 10.2465/jmps.080328
Ji Fei, Li Fei, Zhang Qiao, et al. 2019. Crustal density structure of the Antarctic continent from constrained 3-D gravity inversion. Chinese Journal of Geophysics (in Chinese), 62(3): 849–863
Jin Yu, Jiang Xiaodian. 2002. Lithosphere Dynamics (in Chinese). Beijing: Science Press, 59–74
Jokat W, Nogi Y, Leinweber V. 2010. New aeromagnetic data from the western Enderby Basin and consequences for Antarctic-India break-up. Geophysical Research Letters, 37(21): L21311
Kanao M, Ishikawa M. 2004. Origins of the lower crustal reflectivity in the Lützow-Holm Complex, Enderby Land, East Antarctica. Earth, Planets and Space, 56(2): 151–162
Kanao M, Suvorov V D, Yamashita M, et al. 2014. Crustal structure and tectonic evolution of Enderby Land, East Antarctica, as revealed by deep seismic surveys. Tectonophysics, 627: 38–47. doi: 10.1016/j.tecto.2014.04.014
Król P, Kusiak M A, Dunkley D J, et al. 2020. Diversity of Archean crust in the eastern Tula Mountains, Napier Complex, East Antarctica. Gondwana Research, 82: 151–170. doi: 10.1016/j.gr.2019.12.014
Kusiak M A, Dunkley D J, Wilde S A, et al. 2021. Eoarchean crust in East Antarctica: Extension from Enderby Land into Kemp Land. Gondwana Research, 93: 227–241. doi: 10.1016/j.gr.2020.12.031
Laske G, Masters G, Ma Zhitu, et al. 2013. Update on CRUST 1.0: A 1-degree global model of Earth’s crust. In: EGU General Assembly Conference Abstracts. Vienna: EGU, 15
Lawrence J F, Wiens D A, Nyblade A A, et al. 2006. Upper mantle thermal variations beneath the Transantarctic Mountains inferred from teleseismic S-wave attenuation. Geophysical Research Letters, 33(3): L03303
Leitchenkov G L, Guseva Y B, Gandyukhin V V, et al. 2014. Structure of the Earth’s crust and tectonic evolution history of the Southern Indian Ocean (Antarctica). Geotectonics, 48(1): 5–23. doi: 10.1134/S001685211401004X
Markl R G. 1974. Evidence for the breakup of eastern Gondwanaland by the early cretaceous. Nature, 251(5472): 196–200. doi: 10.1038/251196a0
McElhinny M W. 1970. Formation of the Indian Ocean. Nature, 228(5275): 977–979. doi: 10.1038/228977a0
Meert J G, Santosh M. 2017. The Columbia supercontinent revisited. Gondwana Research, 50: 67–83. doi: 10.1016/j.gr.2017.04.011
Meyer B, Chulliat A, Saltus R. 2017. Derivation and error analysis of the earth magnetic anomaly grid at 2 arc min resolution version 3 (EMAG2v3). Geochemistry, Geophysics, Geosystems, 2017, 18(12): 4522–4537
Minshull T A. 2009. Geophysical characterisation of the ocean–continent transition at magma-poor rifted margins. Comptes Rendus - Géoscience, 341(5): 382–393
Ni S D, Helmberger D V. 2003. Seismological constraints on the South African superplume; could be the oldest distinct structure on earth. Earth and Planetary Science Letters, 206(1–2): 119–131
O’Donnell J P, Nyblade A A. 2014. Antarctica’s hypsometry and crustal thickness: Implications for the origin of anomalous topography in East Antarctica. Earth and Planetary Science Letters, 388: 143–155. doi: 10.1016/j.jpgl.2013.11.051
Parker R L. 1973. The rapid calculation of potential anomalies. Geophysical Journal International, 31(4): 447–455. doi: 10.1111/j.1365-246X.1973.tb06513.x
Rotstein Y, Munschy M, Bernard A. 2001. The Kerguelen Province revisited: additional constraints on the early development of the Southeast Indian Ocean. Marine Geophysical Researches, 22(2): 81–100. doi: 10.1023/A:1010345608833
Scheinert M, Ferraccioli F, Schwabe J, et al. 2016. New Antarctic gravity anomaly grid for enhanced geodetic and geophysical studies in Antarctica. Geophysical Research Letters, 43(2): 600–610. doi: 10.1002/2015GL067439
Sjöberg L E. 2009. Solving Vening Meinesz-Moritz inverse problem in isostasy. Geophysical Journal International, 179(3): 1527–1536. doi: 10.1111/j.1365-246X.2009.04397.x
Stagg H, Colwell J B, Direen N G, et al. 2004. Geology of the continental margin of Enderby and Mac. Robertson Lands, East Antarctica: insights from a regional data set. Marine Geophysical Researches, 25(3): 183–219
Stagg H, Colwell J B, Borissova I, et al. 2006. The Bruce rise area, east Antarctica: Formation of a continental margin near the Greater India-Australia-Antarctica triple junction. Terra Antartica, 13(1–2): 3–22
Stark C P, Stewart J, Ebinger C J. 2003. Wavelet transform mapping of effective elastic thickness and plate loading: Validation using synthetic data and application to the study of southern African tectonics. Journal of Geophysical Research: Solid Earth, 108(B12): 2558. doi: 10.1029/2001JB000609
Tozer B, Sandwell D T, Smith W H F, et al. 2019. Global bathymetry and topography at 15 arc sec: SRTM15+. Earth and Space Science, 6(10): 1847–1864. doi: 10.1029/2019EA000658
Wang Qianshen, Teng Jiwen, Zhang Yongqian, et al. 2009. The crustal structure and gravity isostasy in the middle western Sichuan area. Chinese Journal of Geophysics (in Chinese), 52(2): 579–583
Williams S E, Whittaker J M, Granot R, et al. 2013. Early India-Australia spreading history revealed by newly detected Mesozoic magnetic anomalies in the Perth Abyssal Plain. Journal of Geophysical Research: Solid Earth, 118(7): 3275–3284. doi: 10.1002/jgrb.50239
Zeng Hualin. 2005. Gravity Field and Gravity Exploration (in Chinese). Beijing: Geological Publishing House, 93–100
Zhang Xingyu, Chen Chao, Du Jinsong, et al. 2020. Characteristics of Vening Meinesz isostatic gravity anomalies in Tien Shan and surroundings and its dynamic significances. Chinese Journal of Geophysics (in Chinese), 63(10): 3791–3803. doi: 10.6038/cjg2020N0448
Long Ma, Chenguang Liu, An Yang, Baohua Liu, Chenglong Xia. Characteristics of gravity anomalies and tectonic analysis of Enderby Land in East Antarctica and its adjacent areas[J]. Acta Oceanologica Sinica, 2023, 42(2): 94-103. doi: 10.1007/s13131-022-2029-x
Long Ma, Chenguang Liu, An Yang, Baohua Liu, Chenglong Xia. Characteristics of gravity anomalies and tectonic analysis of Enderby Land in East Antarctica and its adjacent areas[J]. Acta Oceanologica Sinica, 2023, 42(2): 94-103. doi: 10.1007/s13131-022-2029-x
Figure 1. Regional geological map of the study area. The terrain data are extracted from the ETOP01 model (Amante and Eakins, 2009), with a resolution of 1′×1′. The topographic data in local areas are supplemented by SRTM15_PLUS data (Tozer et al., 2019) with a resolution of 15″×15″, and the interval of elevation contours is 1 000 m. The main regional structures of the study are noted as: Queen Maud Land, Enderby Land, Mac. Robertson Land, Gunnerus Ridge, Cosmonauts Sea, Cooperation Sea, Enderby Basin, Kerguelen Plateau. The thick solid blue line represents the continental-oceanic boundary (COB) (Leitchenkov et al. 2014; Golynsky et al., 2013); the thick solid brown line represents the COB proposed by Davis et al. (2019); the thick solid red line is the Enderby Basin Anomaly (Gaina et al., 2007; Golynsky et al., 2007, 2013); the dashed black line is the boundary of Kerguelen Large Igneous Province (Golynsky et al., 2013). The same notation is used in the figures below.
Figure 2. Gravity anomaly and orographic gravity effect in Enderby Land and its adjacent areas. a. Free-air gravity anomaly, derived from the gravity field model EIGEN-6C4 (Foerste et al., 2014), and the height is 8 km, 10−5 m/s2. b. Compensated terrain, the average densities of the water layer, ice layer, upper sediment layer, and middle sediment layer were taken as 1.027 g/cm3, 0.917 g/cm3, 2.028 g/cm3, and 2.314 g/cm3, respectively (Table 1). The topography was converted by density ratio to equivalent complementary crustal terrain data, km. c. Terrain after compensation and correction, ice surface elevation minus water depth and ice thickness after plusing compensation terrain, km. d. Orographic gravity effect, gravity effect calculated by terrain after compensation and correction, 10−5 m/s2. e. Bouguer gravity anomaly, obtained by sbutracting orographic gravity effect from free-air gravity anomaly, 10−5 m/s2.
Figure 3. Comparison between isostatic compensation depth and CRUST1.0 depth. a. Comparison of different effective elastic thicknesses, the minimum RMS is 4.91 with Te is 6 km. b. Comparison between mean compensation depth and CRUST1.0, the minimum RMS is 6 with T0 is 26 km.
Figure 4. Isostatic correction and compensation depth. a. Isostatic correction value for deflection, gravity effect calculated by the substance between H and T0, 10−5m/s2. b. Isostatic compensation depth for deflection. The optimal average compensation depth T0=26 km. Calculated the curvature of compensation surface ${h}_{T_{\rm{e}}}$ with Te=6 km. The calculation result is the best fit with CRUST1.0, and the RMS is the smallest.
Figure 5. Flexural isostatic gravity anomalies (the solid blue, solid brown, solid red and dashed black line instructions are the same as in Fig. 1).
Figure 6. Comprehensive geophysical interpretation profile. a. Topographic map and distribution map of seismic lines in the study area, the interval of elevation contours is 1 000 m, the solid yellow line indicates the position of the comprehensive geophysical interpretation profile. b. Line GA229-35 comprehensive interpretation profile, the red line in the above figure is the crustal thickness, and the blue line is the isostatic gravity anomaly. The red arrows in the figure below indicate the COB proposed by Stagg et al. (2004), Leitchenkov et al. (2014), and Davis et al. (2019), respectively. The red line is the Moho depth calculated for this study, and the blue line is the Moho depth calculated by Davis et al. (2019), the hollow arrow is the direction of isostatic adjustment, the same below. c. Comprehensive interpretation profile of line GA228-06. d. Comprehensive interpretation profile of line GA229-30.
Figure 7. Crustal thickness. The solid blue, solid brown, solid red and dashed black line instructions are the same as in Fig. 1.
Figure 8. Magnetic anomaly: derived from the global Earth Magnetic Anomaly Grid EMAG2v3 (Meyer et al., 2017), which compiled from satellite, ship, and airborne magnetic measurements. The altitude of EMAG2v3 is 4 km above the geoid, with a resolution of 2′. The solid blue, solid brown, solid red and dashed black line instructions are the same as in Fig. 1.


 DownLoad:


 DownLoad:


 DownLoad: