
Figure
1.
Locations of bathing beaches.
| Citation: | Jingming Hou, Wei Lu, Tingting Fan, Peitao Wang. Tsunami hazard and mitigation analysis for bathing beaches in China based on numerical simulations[J]. Acta Oceanologica Sinica, 2022, 41(12): 27-37. doi: 10.1007/s13131-022-2027-z

|
Since the beginning of the 21st century, there have been several major tsunamis around the world, resulting in catastrophic loss of property and lives. Three tsunami events killed more than 2 000 people (NGDC, 2021). On December 26, 2004, the Sumatran earthquake and tsunami killed more than 220 000 people and caused significant damage to countries and regions along the Indian Ocean coast (Wang and Liu, 2006; Ioualalen et al., 2007). In March 2011, more than 18 000 people were killed in the Tohoku earthquake and tsunami. The maximum tsunami amplitude of 38.9 m was monitored and verified in the numerical simulation (Wei et al., 2013). On December 22, 2018, Anak Krakatau erupted and caused a tsunami (Ren et al., 2020). The tsunami severely affected several beaches in Indonesia (Syamsidik et al., 2020). When a tsunami occurs, bathing beaches are generally the first to be hit. There are generally no seawalls on the beaches, so people are completely defenseless when they are on the beach. Therefore, it is necessary to evaluate the tsunami hazard of bathing beaches.
Tsunamis are caused by the displacement of large amounts of water. They travel as long waves in the deep ocean. As the waves spread to the shallow waters near the shore, they usually turn into a series of bores. Owing to the irregularity of nearshore terrain, strong tsunami currents are unstable (Carrier et al., 2003). Previous experiments and analyses have studied the near-shore evolution of tsunamis. The tsunami wave characteristics, shelf slope, and roughness are all factors that influence the tsunami runup and tsunami flow. Apotsos et al. (2011) conducted more than 13 000 simulations to examine the effect of wave characteristics, shelf slope, and bottom roughness on tsunami amplitude and current. Madsen et al. (2008) simulated tsunami wave propagation on a gentle slope. After analyzing the one-dimensional effect of shallow water obstacles on nonlinear long-wave runup, Lynett (2007) found that the beach slope is the primary factor determining tsunami runup. Based on the theory of all-nonlinear shallow water waves, Carrier et al. (2003) calculated the tsunami up and down motion on a tilted beach. The results show that the maximum tsunami velocity occurs on the moving coastline and the maximum momentum flux appears near the extreme depth position. Tsunami amplitude is an important factor in measuring the degree of tsunami hazard (Løvholt et al., 2014; Feng et al., 2017; Ren et al., 2017; Wang et al., 2021). Chan and Liu (2012) studied the relationship between the maximum tsunami runup and the dominant waveform. The results show that the acceleration phase of the incident wave controls the maximum runup for a single wave. In recent years, the effects of tsunami flows in ports have been observed and documented in several locations around the world. The Mw 9.1 Japan earthquake in March 2011 triggered a tsunami that affected the entire Pacific Ocean (Borrero et al., 2015). Ports close to the tsunami source area were severely damaged and many marine installations were completely destroyed. A tsunami flow velocity of 3–10 m/s was obtained by analyzing the video of survivors (Fritz et al., 2012). It is well known that tsunami waves may cause severe erosion and scouring of coastlines. Tsunami wave flow damage was also reported in Crescent City and Santa Cruz (Wilson et al., 2012). Tonkin et al. (2003) studied the destructive effect of tsunamis on buildings by analyzing the tsunami scour process around a cylinder.
Previous studies have investigated some methods to mitigate the effects of tsunamis. Research on the use of vegetation and seawalls to protect against tsunamis is increasing. When a tsunami passes over coastal vegetation and seawalls, the tsunami energy is significantly weakened (Zhang et al., 2020). The mitigative effect of artificial hills on tsunami waves was studied by Lunghino et al. (2020). Their results show that artificial hills can reflect part of the tsunami energy and play an important role in tsunami reduction. Lopez (2009) discussed tsunami prevention methods for coastal areas, including natural prevention such as topography and vegetation, as well as artificial features such as seawalls.
China is located on the west coast of the Pacific Ocean. The coastal waters of southeastern China lie at the boundary of the Eurasian Plate and the Philippine Sea Plate, where local tsunamis and regional tsunamis are likely to occur. Several scholars have analyzed the impact of tsunamis in China (Liu et al., 2007; Hou et al., 2020a). Li et al. (2018) found that the effects of a tsunami on Macau would double with a mean sea level rise of 0.5 m. Sun et al. (2013) analyzed the impact of ancient tsunamis on the islands in the South China Sea. The areas that may be hit by tsunamis in China are the coasts of the East China Sea and the South China Sea (Zhao et al., 2013; Li et al., 2016). There are a lot of bathing beaches along the southeast coast of China. The aim of this study is to analyze the tsunami hazard for bathing beaches in China by analyzing the effects of tsunami wave amplitude and tsunami flow on bathing beaches. Using this information, tsunami prevention and mitigation measures for bathing beaches were studied and discussed.
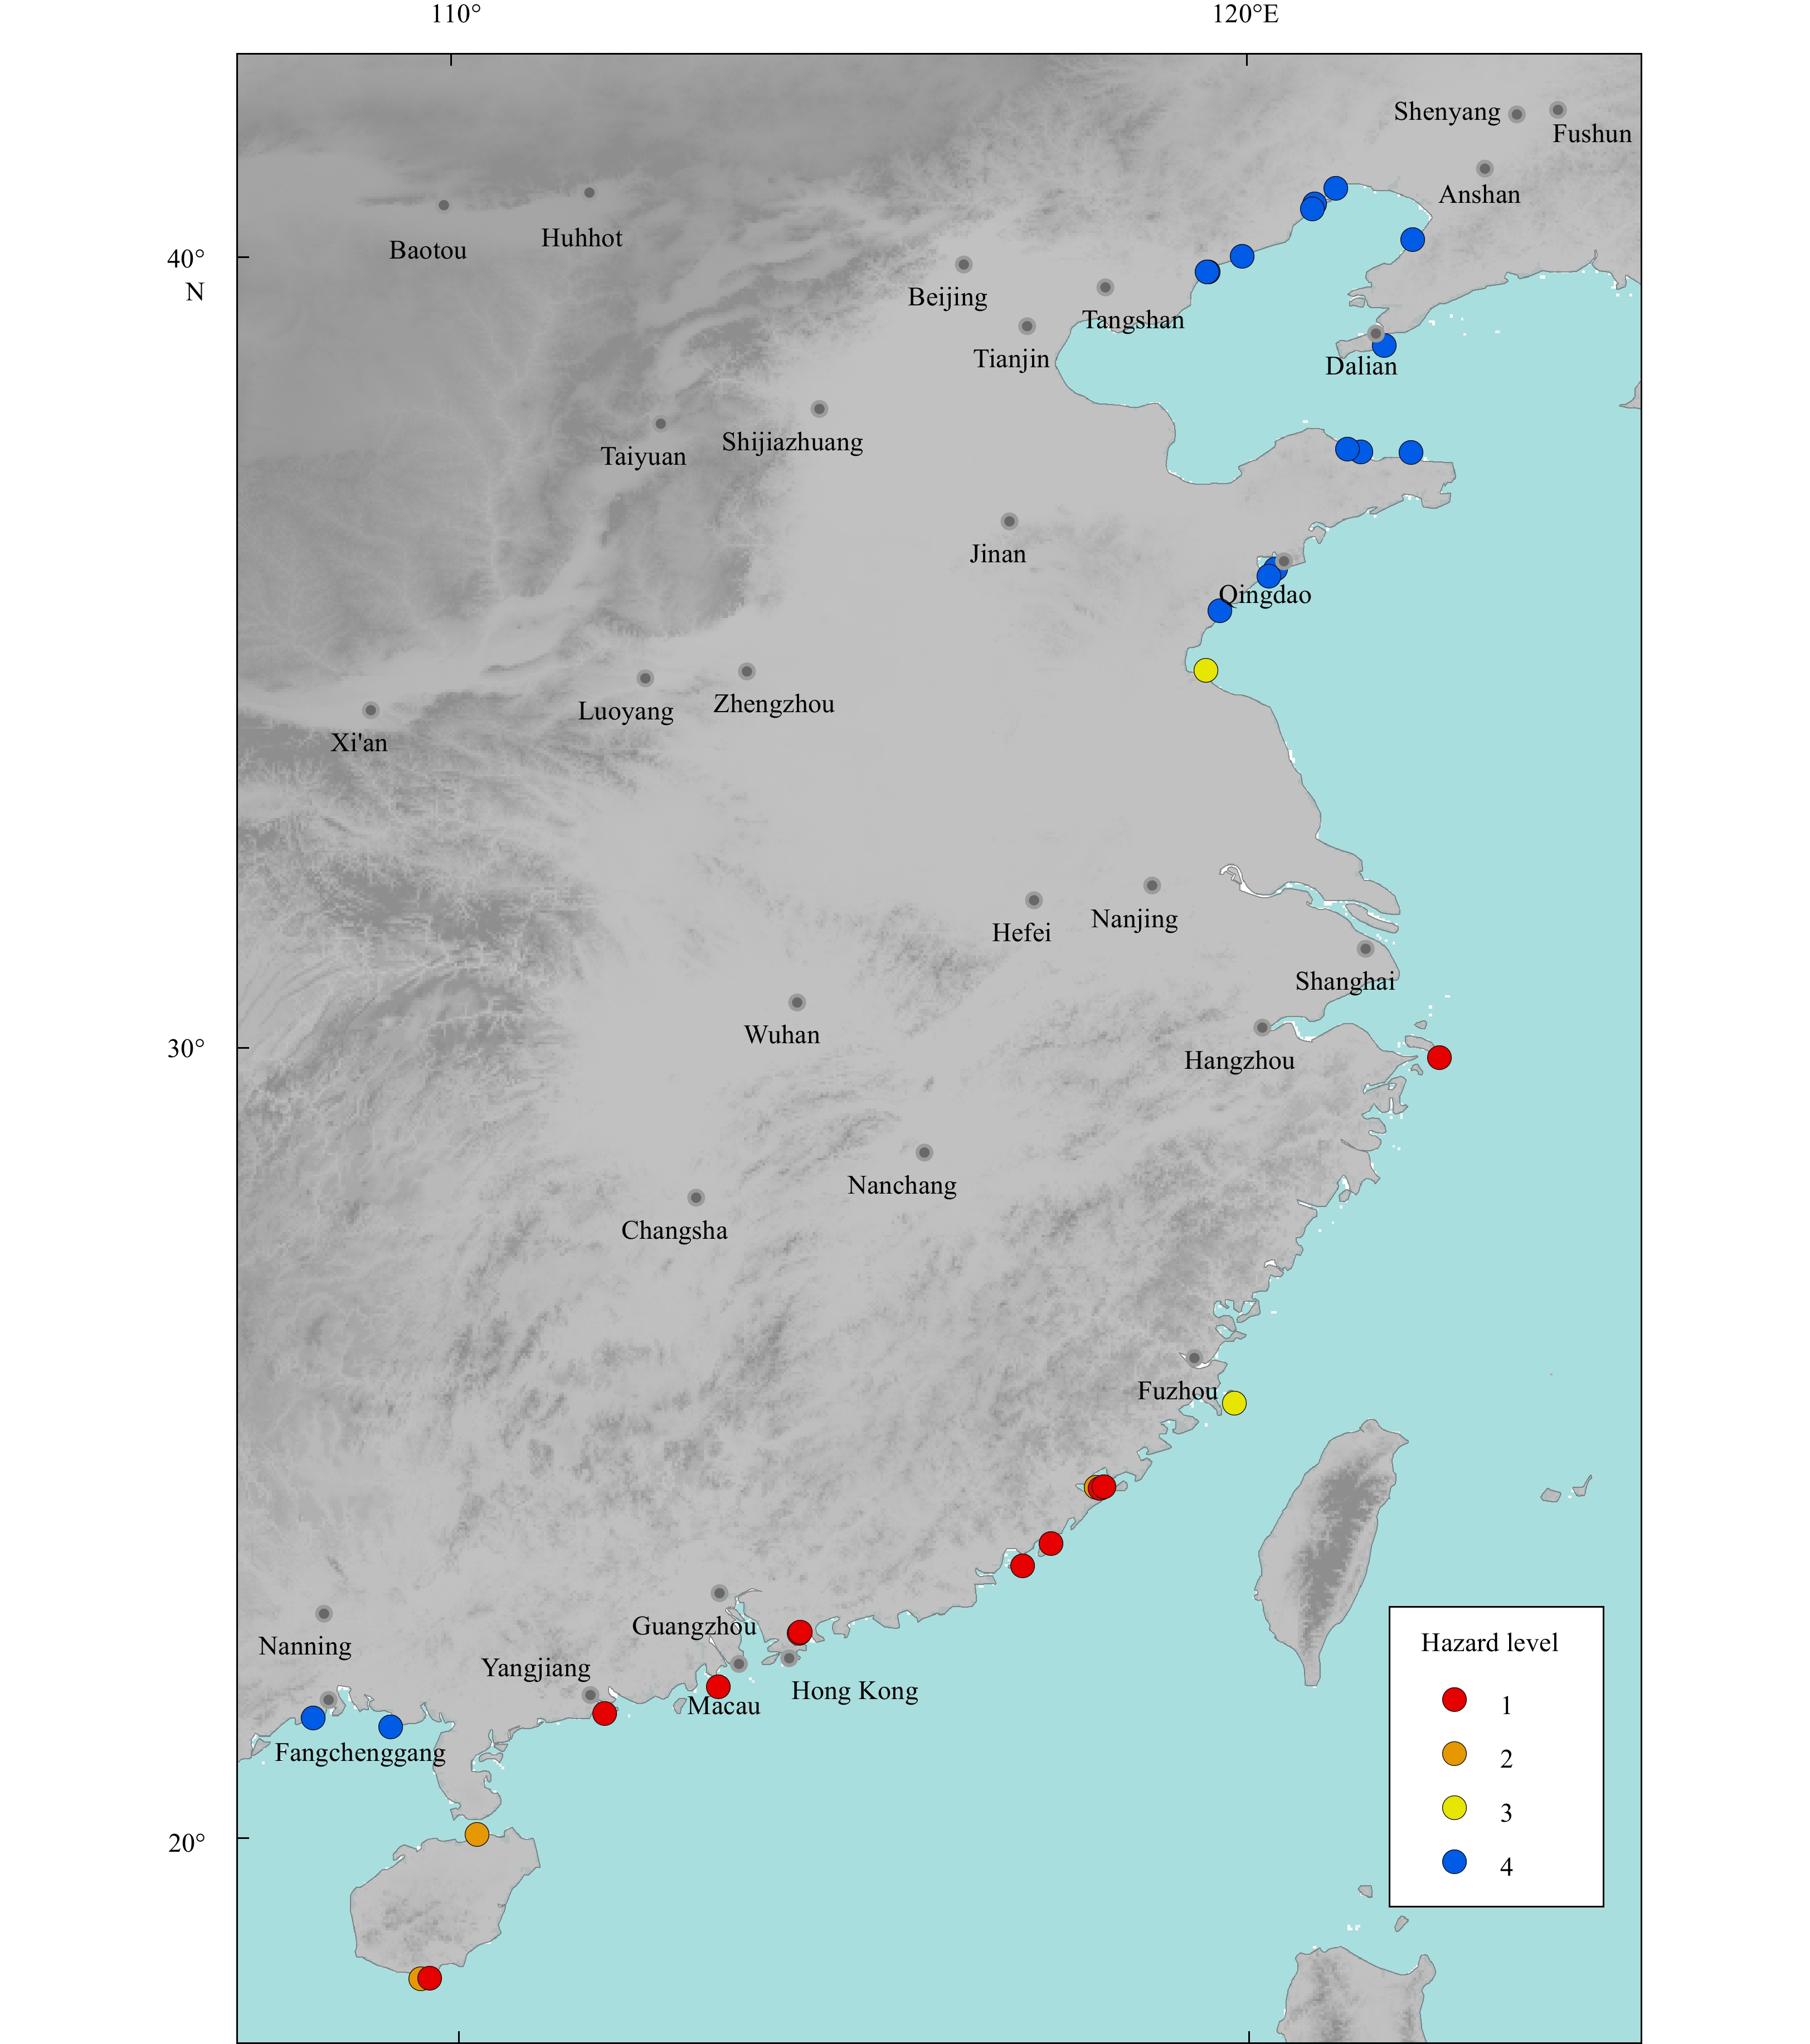
China has a long coastline with many bathing beaches. A weekly report on bathing beaches by the Ministry of Ecology and Environment of China contains a water quality analysis for 31 major bathing beaches. This study analyzes the tsunami hazard for these bathing beaches. These bathing beaches are distributed from south to north. The northernmost is Sunjiawan bathing beach in Jinzhou City, and the southernmost is Yalongwan bathing beach in Sanya City. The locations of the bathing beaches are shown in Fig. 1.
A tsunami numerical simulation method was used in this study to analyze tsunami hazard. Potential tsunami sources were determined and the tsunamis were numerically calculated. By analyzing parameters such as tsunami travel time and tsunami amplitude at the time the tsunami affects the bathing beach, we studied tsunami hazard characteristics for the coast of China. The hazard levels for bathing beaches were analyzed based on a numerical simulation of worst-case scenarios. For high-risk bathing beaches, high resolution numerical calculations were conducted to analyze the tsunami current. Using the topographical environment of the bathing beaches, an additional numerical simulation of tsunami prevention measures, such as seawalls, was conducted. The research flowchart of this study is shown in Fig. 2.

There are several geological tectonic zones along the southeast coast of China, any of which could trigger a tsunami. This study considers the potential tsunami sources of previous research (Hou et al., 2020b; Qiu et al., 2019; Megawati et al., 2009; Hsu et al., 2016), as shown in Table 1. The magnitudes were set to 9.0 as the worst-case scenario.
| Location | Latitude, longitude | Mw |
| Japan Trench | 38.24°N, 142.37°E | 9.0 |
| Nankai Trough | 31.83°N, 133.50°E | 9.0 |
| Ryukyu Trench | 25.68°N, 128.81°E | 9.0 |
| Manila Trench | 18.97°N, 120.57°E | 9.0 |
| Philippine Trench | 13.70°N, 125.33°E | 9.0 |
| Mariana Trench | 12.50°N, 142.50°E | 9.0 |
 DownLoad:
CSV
DownLoad:
CSV
The tsunami numerical simulation was conducted using the COMCOT model (Wang, 2009). This model is widely used in tsunami simulation and hazard analysis. Several scholars have conducted numerical simulations of global tsunamis in recent years using this model. The simulation results are in good agreement with monitoring data (Lynett et al., 2012; Wang et al., 2012).
The linear governing equations of spherical coordinates in the COMCOT model are as follows:
| $$ \frac{\partial \eta }{\partial t}+\frac{1}{R\;{{\rm{cos}}}\; \phi }+\left[\frac{\partial P}{\partial \psi }+\frac{\partial }{\partial \phi }\left(\rm{cos}\;\phi\; Q\right)\right]=-\frac{\partial h}{\partial t} , $$ | (1) |
| $$ \frac{\partial P}{\partial t}+\frac{gh}{R\;{{\rm{cos}}}\;\phi }\frac{\partial \eta }{\partial \psi }-fQ=0 , $$ | (2) |
| $$ \frac{\partial Q}{\partial t}+\frac{gh}{R}\frac{\partial \eta }{\partial \phi }+fP=0 . $$ | (3) |
The nonlinear equations adopted in this paper are shown below:
| $$ \frac{\partial \eta }{\partial t}+\frac{1}{R\;{{\rm{cos}}}\;\phi }+\left[\frac{\partial P}{\partial \psi }+\frac{\partial }{\partial \phi }\left({{\rm{cos}}}\;\phi \; Q\right)\right]=-\frac{\partial h}{\partial t} , $$ | (4) |
| $$ \frac{\partial P}{\partial t}+\frac{1}{R\;{{\rm{cos}}}\;\phi }\frac{\partial }{\partial \psi }\left(\frac{{P}^{2}}{H}\right)+\frac{1}{R}\frac{\partial }{\partial \psi }\left(\frac{PQ}{H}\right)+\frac{gH}{R\;{{\rm{cos}}}\;\phi }\frac{\partial \eta }{\partial \psi }-fQ+{F}_{x}=0 , $$ | (5) |
| $$ \frac{\partial Q}{\partial t}+\frac{1}{R\;{{\rm{cos}}}\;\phi }\frac{\partial }{\partial \psi }\left(\frac{PQ}{H}\right)+\frac{1}{R}\frac{\partial }{\partial \phi }\left(\frac{{Q}^{2}}{H}\right)+\frac{gH}{R}\frac{\partial \eta }{\partial \phi }+fP+{F}_{y}=0 , $$ | (6) |
where H is the total depth, h is the water depth, η denotes the free surface displacement, f represents the Coriolis force coefficient, Fx and Fy represents the bottom friction in x and y directions, respectively; R is the radius of the Earth, g stands for the gravitational acceleration, and P and Q are the volume flux components in the longitudinal
Our tsunami hazard analysis for bathing beaches considered both tsunami amplitude and tsunami current. The numerical simulation was conducted using two models: Model A and Model B. Model A, with two layers, was used to calculate the tsunami amplitude at coastal bathing beaches. Model B added a third layer to the Model A, and we performed tsunami wave current simulation at high-risk bathing beaches to further evaluate the tsunami hazard.
In this section, a numerical calculation of potential tsunamis was conducted using Model A. The tsunami maximum amplitudes from the numerical calculations were used to analyze the impact of each tsunami scenario on coastal areas and bathing beaches and identify the high-risk bathing beaches.
The numerical simulation settings for Model A are shown in Table 2. Since the potential tsunami sources are located southeast of China, the first layer of tsunami numerical simulation covers the Northwest Pacific region. The bathymetric data used in the first layer were ETOPO2 with a resolution of 2' (NGDC, 2006). The second layer contains three parts. The first part covers the Bohai Sea and Yellow Sea, including the coastal waters of Liaoning, Hebei, Tianjin, and Shandong provinces (city). The second part covers the coast of the East China Sea, including Jiangsu, Shanghai, Zhejiang, and Fujian provinces (city). The third part covers the coast of the South China Sea, including Guangdong, Guangxi, and Hainan provinces. The bathymetric data used in the second layer were SRTM plus15 with a resolution of (1/4)' (Tozer et al., 2019). The spatial extent of the second layer is shown in Fig. 3. When the tsunami propagates in the ocean, dispersion and Coriolis force are relatively important. Therefore, a linear shallow water equation in spherical coordinates was used to simulate the propagation of the tsunami wave in the first layer of Model A. When the tsunami reaches the continental shelf, the linear shallow water equation is no longer applicable. In the second layer, a nonlinear equation is adopted.
| Layer | Bathymetric data | Regional extent | Governing equation | Spatial resolution |
| Layer 1 | ETOPO2 | 5.0°–52.0°N, | linear | 2' |
| 99.0°–157.0°E | ||||
| Layer 2 | SRTM plus15 | 34.7°–41.6°N, | nonlinear | (1/4)' |
| 117.2°–124.9°E; | ||||
| 23.1°–34.7°N, | ||||
| 117.2°–123.5°E; | ||||
| 17.4°–24.1°N, | ||||
| 107.3°–117.1°E |
DownLoad:
CSV

Sixty-one tsunami wave characteristic output points were established along the coast of China in Model A. The output points are 100 km offshore. The location of the output points are shown in Fig. 3.
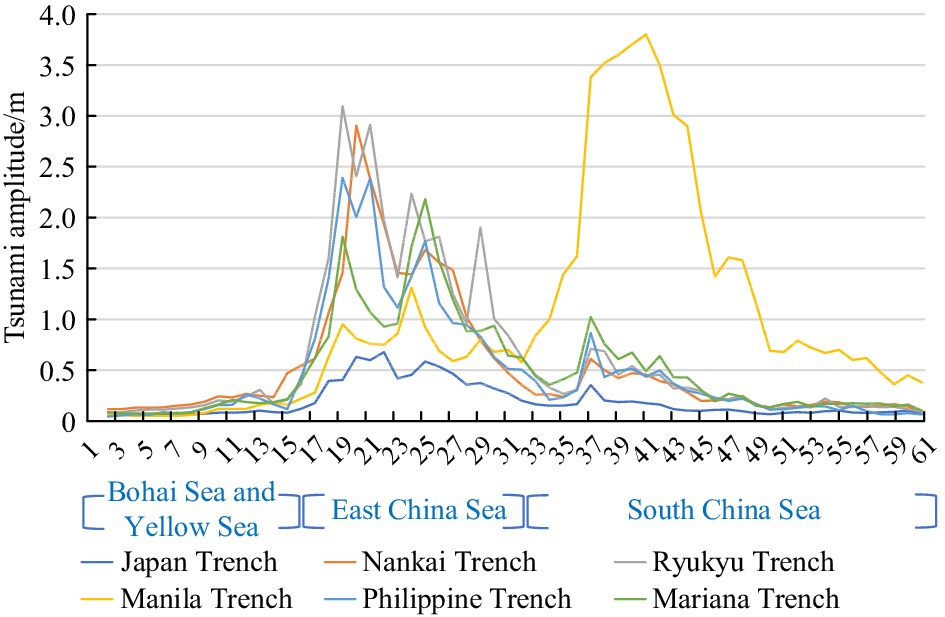
The maximum tsunami amplitudes at the 61 output points (from north to south) are shown in Fig. 4. This figure shows the amplitude values and amplitude difference of each tsunami source. The maximum tsunami amplitude exceeds 3 m. The tsunami sources affecting the coast of the East China Sea include the Ryukyu Trench, the Mariana Trench, and the Philippine Trench. A tsunami from the Manila Trench has the potential for a significant impact on the coast of the South China Sea. The tsunami amplitude in the waters of Fujian Province is relatively small due to the blocking effect of Taiwan.

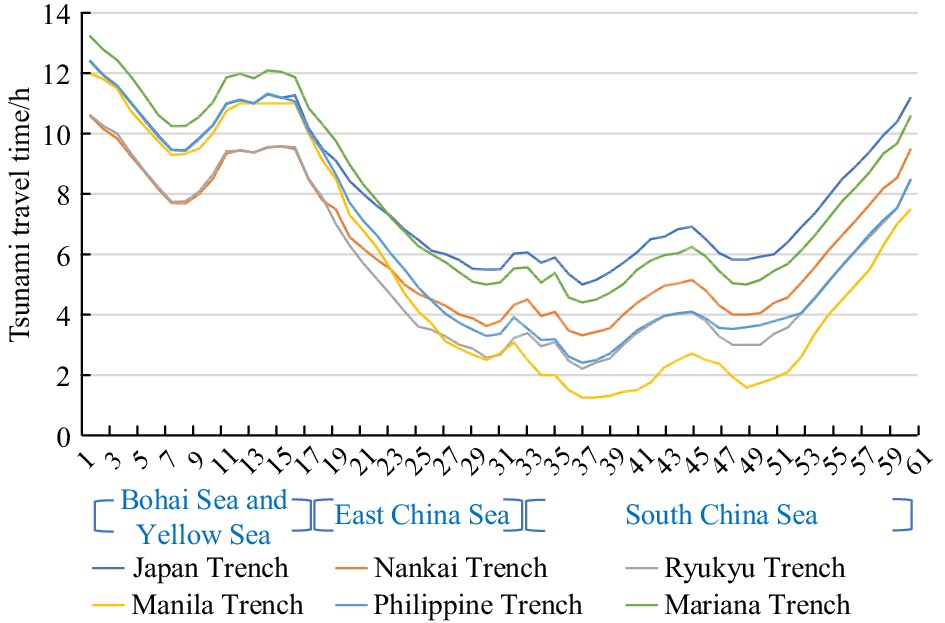
Tsunami arrival times at 61 the output points (from north to south) are shown in Fig. 5. This figure visually shows the tsunami travel time and difference of each tsunami source. From this figure, we can see that the tsunami arrival time curves for different tsunami sources are very similar because the tsunami propagation speed depends mainly on the water depth. As a result of the bathymetry off the coast of China, a tsunami slows down when it reaches the Hainan–Taiwan–Ryukyu line. From north to the south, the tsunami arrival times decrease and then increase. The tsunami arrival time for southeast of Hainan Island is relatively small. In the Manila Trench scenario, the tsunami wave can reach offshore Hainan Island in about 1.7 h.

The maximum amplitudes are shown in Fig. 6. Panels a–f are the maximum amplitudes of Japan Trench, Nankai Trough, Ryukyu Trench, Manila Trench, Philippine Trench and Mariana Trench, respectively. The figure shows the results of the first layer of numerical simulation, with a maximum amplitude of more than 3 m. The results show that six modeled tsunamis have an important impact on the coast of China. The provinces (city) affected by these tsunamis include Jiangsu, Shanghai, Zhejiang, Fujian, Guangdong, and Hainan. The tsunami most hazardous to the coast of East China Sea would be one that originates in the Ryukyu Trench because the direction of tsunami energy is toward the coastal areas of Jiangsu Province, Shanghai City, and Zhejiang Province. A Manila Trench tsunami would affect the coasts of Hainan, Fujian, and Guangdong provinces. Tsunamis from the Nankai Trough, the Philippine Trench, and the Mariana Trench could pass through the gaps of the Ryukyu Islands to affect the eastern coast of China.

In Table 3, the tsunami hazard for bathing beaches along the coast of China is classified by the maximum tsunami amplitude. The analysis results are shown in Fig. 7. Nine bathing beaches are classified as tsunami hazard level 1. The Manila Trench is one of the most important tsunami sources affecting China. It should be noted that there is tsunami possibility in both southern and northern parts of the Manila Trench. The most dangerous scenario is considered in this paper, the source is set in the north of Manila Trench.
| Hazard level | Amplitude/m | Color |
| 1 | >3 | red |
| 2 | 1–3 | orange |
| 3 | 0.3–1 | yellow |
| 4 | <0.3 | blue |
DownLoad:
CSV

Tsunami wave currents at high-risk bathing beaches were calculated to further analyze the disaster-causing factors of tsunamis. Starting with Model A, the third layer of Model B was added to simulate wave current at 4 of 9 level-1 bathing beaches including Zhujiajian Beach, Dajiaowan Beach, Feishatan Beach, and Yalongwan Beach. The third layer adopted a nonlinear equation with a resolution of (1/32)'. Water depths for the third layer were chart data processed with reference plane adjustment and interpolation. The land/water boundary was modified using satellite data. The third layer settings are shown in Table 4.
| Layer | Bathymetric data | Regional extent | Governing equations | Spatial resolution |
| Layer 3 | nautical chart | 29.8°–29.9°N, 122.4°–122.5°E; | nonlinear | (1/32)' |
| 21.8°–22.0°N, 113.2°–113.3°E; 21.5°–21.6°N, 111.8°–111.9°E; 18.1°–18.3°N, 109.5°–109.7°E |
DownLoad:
CSV
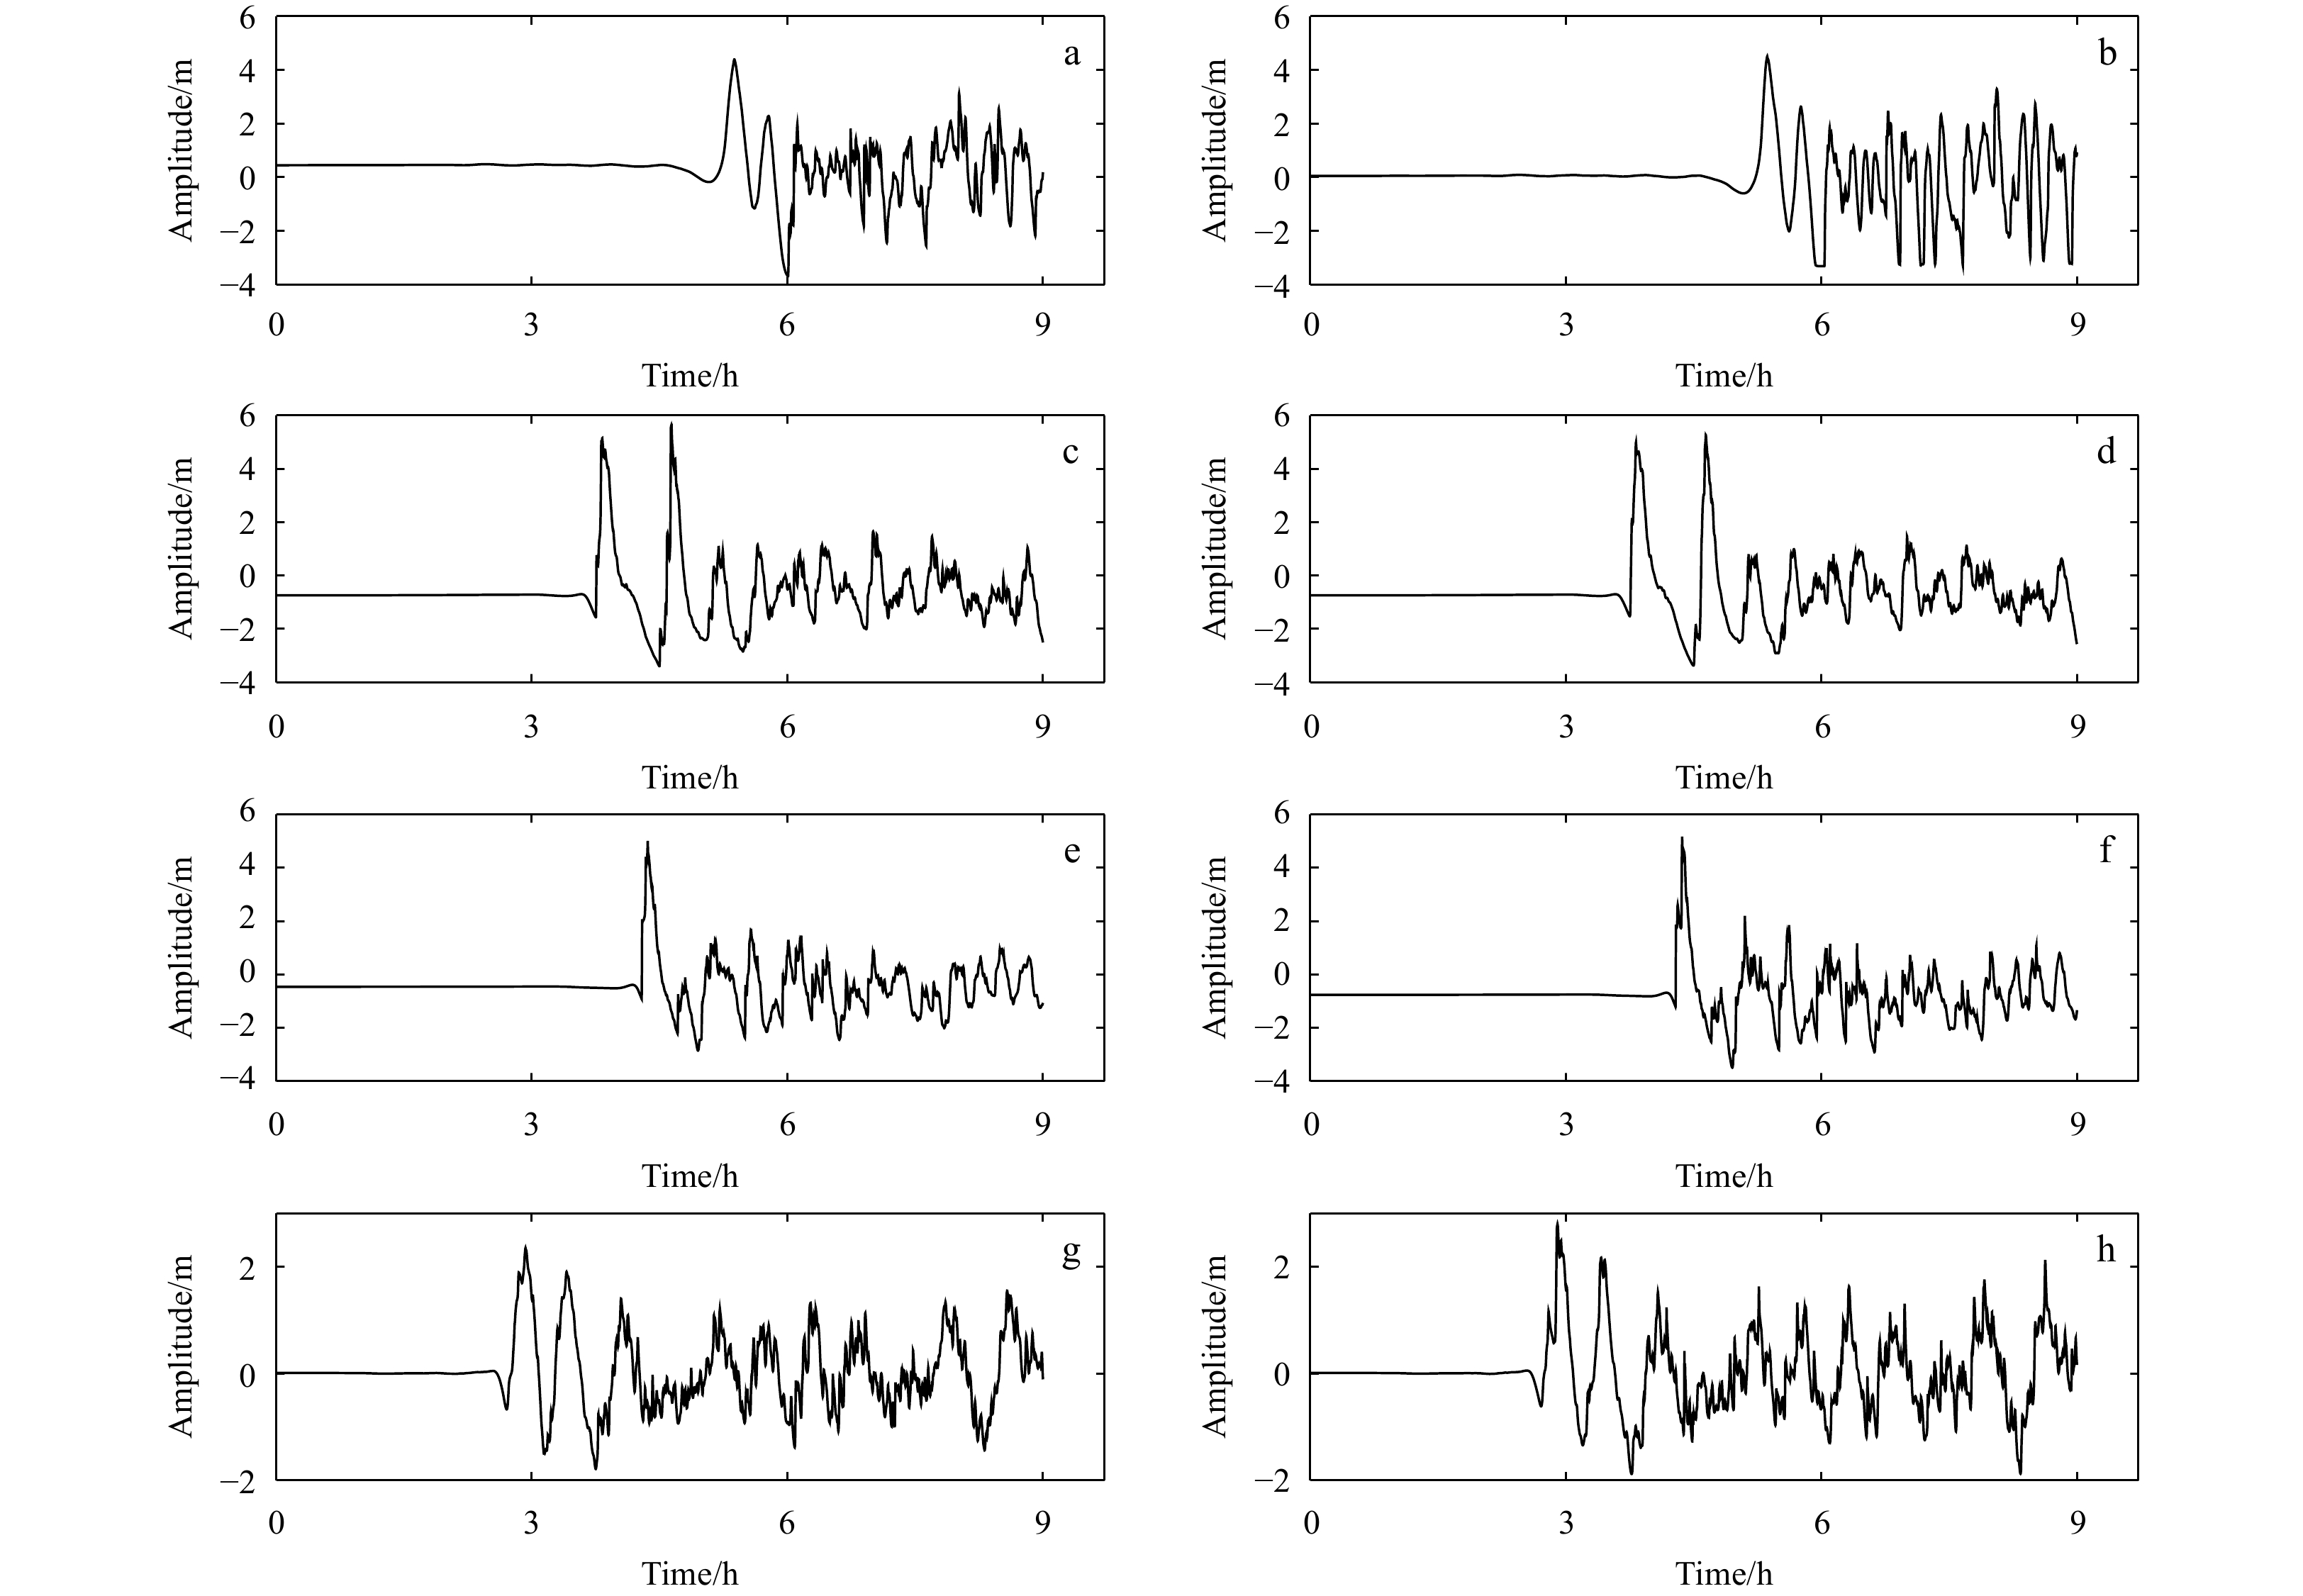
In this section, eight output locations, 0.5 km offshore, were selected to show tsunami wave characteristics at four bathing beaches. The water depth of output locations is about 5 m. The tsunami wave curves for these eight output locations are shown in Fig. 8. Locations A and B, at Zhujiajian Beach, had a maximum amplitude of 4.5 m. Locations C and D, at Dajiaowan Beach, had a maximum amplitude of 5.8 m. Locations E and F, at Feishatan Beach, had a maximum amplitude of 5.7 m. Locations G and H, at Yalongbay Beach, had a maximum amplitude of 2.4 m. The numerical values in the figure show that the tsunami amplitude increases as the water depth decreases when the tsunami wave reaches the nearshore, compared with Fig. 4.

Tsunami flow velocity and flow direction are also important indicators of the physical characteristics and disaster-causing capability of tsunami waves. Figure 9 shows the flow direction corresponding to the maximum flow velocity at each grid point of four bathing beaches. Panel a shows the tsunami flow at Zhujiajian Beach in the Ryukyu Trench tsunami scenario. Panels b–d represent the tsunami flow of Feishatan Beach, Dajiaowan Beach and Yalongwan Beach in the Manila Trench scenario. From the figure we can see that the maximum velocity occurs when the tsunami wave flows into the bathing beach in most cases. But there are also a few flow directions showing the water retreat process. Therefore, attention should also be paid to prevent the hazard of tsunami wave retreat.

Based on the numerical simulation results, the maximum amplitude and maximum flow velocity at four bathing beaches are shown in Table 5. A tsunami with maximum amplitude of 7.1 m or maximum flow velocity of 4.8 m/s would be very dangerous to bathing beaches. Some measures should be taken to mitigate the effects of tsunamis in these areas. Because of the direction of tsunami energy and the short distance to tsunami source, the maximum amplitude and flow velocity of tsunamis are the greatest at the Zhujiajian bathing beach. The Manila Trench is the most dangerous tsunami source for the Dajiaowan bathing beach, Feishatan bathing beach, and Yalongwan bathing beach. As can be seen from Table 5, larger amplitudes correspond to greater flow velocity. Bathing beaches usually have a gentle offshore slope. When tsunami waves propagate to the shore, the gentle slope terrain makes the energy aggregate, resulting in an increase in the tsunami amplitude.
| Bathing beach | City | Parameters | Japan Trench | Nankai Trough | Ryukyu Trench | Manila Trench | Philippine Trench | Mariana Trench |
| Zhujiajian | Zhoushan | Amplitude/m | 1.1 | 4.4 | 5.2 | 0.8 | 3.2 | 5.0 |
| Velocity/(m·s−1) | 0.5 | 0.6 | 3.9 | 0.1 | 1.2 | 2.4 | ||
| Dajiaowan | Yangjiang | Amplitude/m | 0.4 | 0.9 | 1.4 | 6.5 | 1.4 | 2.2 |
| Velocity/(m·s−1) | 0.1 | 0.3 | 0.5 | 4.3 | 0.4 | 0.5 | ||
| Feishatan | Zhuhai | Amplitude/m | 0.5 | 0.7 | 1.1 | 7.1 | 1.2 | 1.4 |
| Velocity/(m·s−1) | 0.2 | 0.1 | 0.2 | 4.8 | 0.2 | 0.5 | ||
| Yalongwan | Sanya | Amplitude/m | 0.3 | 1.0 | 1.2 | 3.5 | 0.8 | 1.1 |
| Velocity/(m·s−1) | 0.1 | 0.4 | 0.5 | 2.2 | 0.2 | 0.5 |
DownLoad:
CSV
The occurrence of tsunamis cannot be predicted, but disasters caused by tsunamis can be mitigated through reasonable prevention measures. The analysis in the above sections shows that some bathing beaches of China are at risk of being affected by tsunamis. Therefore, we conducted research on tsunami mitigation for bathing beaches.
Tsunami disaster prevention and mitigation include natural elements and designed elements. The designed elements include artificial structures such as dams or seawalls, whereas natural elements refer to vegetation such as mangroves. In recent years, new concepts in coastal protection have been proposed. The use of a combination of natural elements and designed elements is becoming an increasingly important component of coastal risk management.
In general, there is no vegetation near the shore of a bathing beach. A tsunami wave is the fluctuation of the entire water body from the surface to the seabed. Offshore seawalls with artificial vegetation built on the sea floor have been used to mitigate the effects of tsunamis. Based on the above analysis, we know that the amplitude and flow velocity of a tsunami wave will increase when it encounters obstacles. Therefore, seawalls should be placed at a certain distance from the beach. Seawall experiments were conducted near Dajiaowan Beach in the Manila Trench tsunami scenario. Three different schemes were used (Table 6). The height in Table 6 refers to the seawall height above the mean sea level, excluding the part below the sea level. Scheme 1 had no seawall elements. Scheme 2 had four concrete cuboids. Scheme 3 had one cuboid whose length was equal to the sum of the lengths of the four cuboids in Scheme 2.
| Length/m | Width/m | Height (msl)/m | Offshore distance/m | Shape | Material | |
| Scheme 1 | no additions | no additions | no additions | no additions | no additions | no additions |
| Scheme 2 | 70 | 30 | 10 | 400 | cuboid | concrete and plants |
| 70 | 30 | 10 | 400 | cuboid | concrete and plants | |
| 70 | 30 | 10 | 400 | cuboid | concrete and plants | |
| 70 | 30 | 10 | 400 | cuboid | concrete and plants | |
| Scheme 3 | 280 | 30 | 10 | 400 | cuboid | concrete and plants |
| Note: msl means mean sea level. | ||||||
DownLoad:
CSV
The tsunami prevention experiment was conducted using a numerical model with four layers. The model settings are shown in Table 7.
| Layer | Bathymetric data | Regional extent | Equation | Resolution |
| Layer 1 | ETOPO2 | 5°S–52°N, 99°–157°E | linear | 2' |
| Layer 2 | SRTM plus15 | 17.4°–24.1°N, 107.3°–117.1°E | nonlinear | (1/4)' |
| Layer 3 | nautical chart | 21.5°–21.6°N, 111.8°–111.9°E | nonlinear | (1/32)' |
| Layer 4 | nautical chart | 21.56°–21.58°N, 111.83°–111.85°E | nonlinear | (1/256)' |
DownLoad:
CSV
The results of the numerical calculations are shown in Fig. 10. Panels a–c show the tsunami amplitudes for Schemes 1–3, respectively. Panels d–f show the flow velocities for Schemes 1–3.

As can be seen from Fig. 10, the tsunami amplitude distribution changed significantly after the addition of seawalls. Scheme 2 reduced the tsunami amplitude at the beaches. Scheme 3 reduced tsunami amplitude in some areas, but it also caused an increase of tsunami amplitude in the western part of the beach. The seawalls blocked the tsunami waves and weakened the tsunami wave. However, the tsunami amplitude at the seawalls increased. Therefore, the seawall should be located away from the bathing beach.
According to Fig. 10, the flow velocity also changed obviously after the addition of seawalls. Scheme 2 had some effect on reducing the flow velocity. Areas with larger flow velocity were formed between adjacent seawalls. The flow velocity behind the seawall was reduced. Scheme 3 reduced the flow velocity in front of the seawall, but caused an increase of flow velocity on both sides and behind the seawall. The maximum flow velocity value of Scheme 3 was larger than that of Scheme 2, making the seawall bear a larger tsunami force. A tsunami has a long wavelength, which can diffract as it passes through the seawall. The separate seawalls actually increase the effective length. In general, the four separate seawalls in Scheme 2 are better at reducing the force of the tsunami wave than using a single seawall.
Tsunami inundation occurred in the seawalls experiment. Due to the lack of accurate topography data, the tsunami inundation was not analyzed in detailed. But tsunami inundation should be considered in tsunami disaster prevention and mitigation for the bathing beaches. Although we analyzed the effect of seawalls, the construction difficulty was not taken into account. The construction of seawalls needs further discussion with respect to architecture, mechanics, and other aspects. The shape, length, width, number, and location of seawalls for maximum effect also need further research. The separate seawalls can reduce the tsunami velocity in front and behind the seawalls to some extent, it should be noted that the tsunami velocity on both sides of seawalls and along the coastline may increase. Before the construction of seawalls, the impact of seawall on coastal sediment transport and beach erosion should also be studied.
When a tsunami wave propagates to the nearshore, the amplitude increases as the water becomes shallower. Tsunami amplitude and flow velocity will increase when a tsunami encounters obstacles. The tsunami hazard at bathing beaches needs attention and prevention. In this study, a numerical model was used to test artificial concrete seawalls off the coast of bathing beaches. The results indicate that artificial seawalls can block a tsunami wave to a certain extent. To maximize the reflection of tsunami energy, the locations and shapes of the seawalls need to be determined based on the shape of the coastline and the direction of potential tsunami waves.
Tsunami mitigation elements include natural landscapes and artificial constructions. The experiment in this study focuses on a numerical simulation of the interaction between seawalls and tsunamis, providing ideas for follow-up research. The design of tsunami mitigation seawalls is important, because the spacing and shape of the seawalls may have a significant impact on the results. In addition, vegetation is an important supplementary component of a seawall that could beautify the seawalls and play a role in blocking tsunami waves.
There are some limitations in this study. The deterministic method was used to analyze the tsunami hazard of the worst tsunami scenario, without considering the tsunami probability of each scenarios. The probabilistic tsunami analysis will be considered in future research. Due to the lack of accurate topography data, the tsunami inundation was not analyzed in detail. It is necessary to consider tsunami inundation and tsunami evacuation in the future.
The above analysis of tsunami waves characteristics at bathing beaches lays a foundation for further analysis of tsunami wave mitigation. Before the tsunami arrives, disaster prevention and mitigation can be conducted through tsunami mitigation publicity and the construction of seawalls. In addition, tsunami exercises for bathing beaches can be held irregularly to test tsunami information broadcast and improve evacuation capabilities. A tsunami warning system for bathing beaches should be established, and a tsunami evacuation plan should preferably be developed in advance.
This article studied the propagation characteristics of tsunamis from offshore to bathing beaches under potential scenarios. The results show that tsunamis are a greater hazard for bathing beaches in Hainan, Guangdong, and Zhejiang provinces than for other beaches along the coast of China. Tsunamis originating from the Philippine Trench, Nankai Trough, and Mariana Trench can also affect China’s offshore waters through the inter-island gaps of the Ryukyu Islands. This study evaluated the impact of potential tsunami sources on China’s coastal waters and bathing beaches, and calculated the maximum tsunami amplitude and tsunami flow velocity. This information was used to create a hazard level classification for bathing beaches. The analysis results could provide a scientific reference for the tsunami disaster prevention and mitigation measures.
A high-resolution numerical model was established to study tsunami flow characteristics at four bathing beaches and to test different seawall configurations for tsunami mitigation. The experimental results show that four separate seawalls are more effective than one large seawall for tsunami disaster prevention and mitigation. This conclusion was determined by looking at tsunami amplitude and flow velocity. Tsunami waves can bypass a single seawall and cause damage to objects behind it. Furthermore, a single seawall bears more tsunami force than multiple seawalls. Although the separate seawalls can reduce the tsunami velocity in front and behind the seawalls to some extent, it should be noted that the tsunami velocity on both sides of seawalls and along the coastline may increase. The construction of seawalls should be carefully considered and need to be studied in many aspects, including ecology, construction, and fluid dynamic research.
China is located on the western coast of the Pacific Ocean, facing the threat of transoceanic tsunamis and regional tsunamis. Crowds at bathing beaches are usually unprepared for a tsunami. Therefore, tsunami risk assessment for bathing beaches should be done in advance, and disaster prevention through the use of seawalls should be studied. Future research could focus on the position, shape, quantity, and construction of seawalls and other prevention measures.
|
Apotsos A, Jaffe B, Gelfenbaum G. 2011. Wave characteristic and morphologic effects on the onshore hydrodynamic response of tsunamis. Coastal Engineering, 58(11): 1034–1048. doi: 10.1016/j.coastaleng.2011.06.002
|
|
Borrero J C, Lynett P J, Kalligeris N. 2015. Tsunami currents in ports. Philosophical Transactions of the Royal Society A: Mathematical, Physical and Engineering Sciences, 373(2053): 20140372
|
|
Carrier G F, Wu T T, Yeh H. 2003. Tsunami run-up and draw-down on a plane beach. Journal of Fluid Mechanics, 475: 79–99. doi: 10.1017/S0022112002002653
|
|
Chan I C, Liu P L F. 2012. On the runup of long waves on a plane beach. Journal of Geophysical Research: Oceans, 117(C8): C08006
|
|
Feng Xingru, Yin Baoshu, Gao Song, et al. 2017. Assessment of tsunami hazard for coastal areas of Shandong Province, China. Applied Ocean Research, 62: 37–48. doi: 10.1016/j.apor.2016.12.001
|
|
Fritz H M, Phillips D A, Okayasu A, et al. 2012. The 2011 Japan tsunami current velocity measurements from survivor videos at Kesennuma Bay using LiDAR. Geophysical Research Letters, 39(7): L00G23
|
|
Hou Jingming, Li Xiaojuan, Wang Peitao, et al. 2020a. Hazard analysis of tsunami disaster on the Maritime Silk Road. Acta Oceanologica Sinica, 39(1): 74–82. doi: 10.1007/s13131-019-1526-z
|
|
Hou Jingming, Yuan Ye, Li Tao, et al. 2020b. Tsunami hazard analysis for Chinese coast from potential earthquakes in the western North Pacific. Geomatics, Natural Hazards and Risk, 11(1): 967–983
|
|
Hsu Y J, Yu S B, Loveless J P, et al. 2016. Interseismic deformation and moment deficit along the Manila subduction zone and the Philippine Fault system. Journal of Geophysical Research: Solid Earth, 121(10): 7639–7665. doi: 10.1002/2016JB013082
|
|
Ioualalen M, Asavanant J, Kaewbanjak N, et al. 2007. Modeling the 26 December 2004 Indian Ocean tsunami: Case study of impact in Thailand. Journal of Geophysical Research: Oceans, 112(C7): C07024
|
|
Li Linlin, Switzer A D, Chan C H, et al. 2016. How heterogeneous coseismic slip affects regional probabilistic tsunami hazard assessment: A case study in the South China Sea. Journal of Geophysical Research: Solid Earth, 121(8): 6250–6272. doi: 10.1002/2016JB013111
|
|
Li Linlin, Switzer A D, Wang Yu, et al. 2018. A modest 0.5-m rise in sea level will double the tsunami hazard in Macau. Science Advances, 4(8): eaat1180. doi: 10.1126/sciadv.aat1180
|
|
Liu Yingchun, Santos A, Wang S M, et al. 2007. Tsunami hazards along Chinese coast from potential earthquakes in South China Sea. Physics of the Earth and Planetary Interiors, 163(1–4): 233–244
|
|
Lopez J A. 2009. The Multiple Lines of Defense Strategy to Sustain Coastal Louisiana. Journal of Coastal Research, 10054: 186–197. doi: 10.2112/SI54-020.1
|
|
Løvholt F, Glimsdal S, Harbitz C B, et al. 2014. Global tsunami hazard and exposure due to large co-seismic slip. International Journal of Disaster Risk Reduction, 10: 406–418. doi: 10.1016/j.ijdrr.2014.04.003
|
|
Lunghino B, Tate A F S, Mazereeuw M, et al. 2020. The protective benefits of tsunami mitigation parks and ramifications for their strategic design. Proceedings of the National Academy of Sciences of the United States of America, 117(20): 10740–10745. doi: 10.1073/pnas.1911857117
|
|
Lynett P J. 2007. Effect of a shallow water obstruction on long wave runup and overland flow velocity. Journal of Waterway, Port, Coastal, and Ocean Engineering, 133(6): 455–462
|
|
Lynett P J, Borrero J C, Weiss R, et al. 2012. Observations and modeling of tsunami-induced currents in ports and harbors. Earth and Planetary Science Letters, 327–328: 68–74
|
|
Madsen P A, Fuhrman D R, Schäffer H A. 2008. On the solitary wave paradigm for tsunamis. Journal of Geophysical Research: Oceans, 113(C12): C12012
|
|
Megawati K, Shaw F, Sieh K, et al. 2009. Tsunami hazard from the subduction megathrust of the South China Sea: Part I. Source characterization and the resulting tsunami. Journal of Asian Earth Sciences, 36(1): 13–20. doi: 10.1016/j.jseaes.2008.11.012
|
|
National Geophysical Data Center (NGDC). 2006. 2-minute Gridded Global Relief Data (ETOPO2) v2. NOAA National Centers for Environmental Information. http: //doi. org/10.7289/V5J1012Q[2021-01-15]
|
|
National Geophysical Data Center (NGDC). 2021. World Data Service: NCEI/WDS Global Historical Tsunami Database. NOAA National Centers for Environmental Information. https://www.ncei.noaa.gov/access/metadata/landing-page/bin/iso?id=gov.noaa.ngdc.mgg.hazards:G02151[2021-01-15]
|
|
Qiu Qiang, Li Linlin, Hsu Y J, et al. 2019. Revised earthquake sources along Manila trench for tsunami hazard assessment in the South China Sea. Natural Hazards and Earth System Sciences, 19(7): 1565–1583. doi: 10.5194/nhess-19-1565-2019
|
|
Ren Zhiyuan, Wang Yuchen, Wang Peitao, et al. 2020. Numerical study of the triggering mechanism of the 2018 Anak Krakatau tsunami: eruption or collapsed landslide?. Natural Hazards, 102(1): 1–13. doi: 10.1007/s11069-020-03907-y
|
|
Ren Zhiyuan, Yuan Ye, Wang Peitao, et al. 2017. The September 16, 2015 MW 8.3 Illapel, Chile Earthquake: characteristics of tsunami wave from near-field to far-field. Acta Oceanologica Sinica, 36(5): 73–82. doi: 10.1007/s13131-017-1005-3
|
|
Sun Liguang, Zhou Xin, Huang Wen, et al. 2013. Preliminary evidence for a 1000-year-old tsunami in the South China Sea. Scientific Reports, 3(1): 1655. doi: 10.1038/srep01655
|
|
Syamsidik, Benazir, Luthfi M, et al. 2020. The 22 December 2018 Mount Anak Krakatau volcanogenic tsunami on Sunda Strait coasts, Indonesia: tsunami and damage characteristics. Natural Hazards and Earth System Sciences, 20(2): 549–565. doi: 10.5194/nhess-20-549-2020
|
|
Tonkin S, Yeh H, Kato F, et al. 2003. Tsunami scour around a cylinder. Journal of Fluid Mechanics, 496: 165–192. doi: 10.1017/S0022112003006402
|
|
Tozer B, Sandwell D T, Smith W H F, et al. 2019. Global bathymetry and topography at 15 arc sec: SRTM15+. Earth and Space Science, 6(10): 1847–1864. doi: 10.1029/2019EA000658
|
|
Wang Xiaoming. 2009. User manual for COMCOT version 1.7 (first draft). Ithaca, NY: Cornel University, 65
|
|
Wang Xiaoming, Liu P L F. 2006. An analysis of 2004 Sumatra earthquake fault plane mechanisms and Indian Ocean tsunami. Journal of Hydraulic Research, 44(2): 147–154. doi: 10.1080/00221686.2006.9521671
|
|
Wang Peitao, Ren Zhiyuan, Sun Lining, et al. 2021. Observations and modelling of the travel time delay and leading negative phase of the 16 September 2015 Illapel, Chile tsunami. Acta Oceanologica Sinica, 40(11): 11–30. doi: 10.1007/s13131-021-1830-2
|
|
Wang Peitao, Yu Fujiang, Zhao Lianda, et al. 2012. Numerical analysis of tsunami propagating generated by the Japan MW 9.0 earthquake on Mar. 11 in 2011 and its impact on China coasts. Chinese Journal of Geophysics, 55(9): 3088–3096
|
|
Wei Yong, Chamberlin C, Titov V V, et al. 2013. Modeling of the 2011 Japan tsunami: lessons for near-field forecast. Pure and Applied Geophysics, 170(6–8): 1309–1331
|
|
Wilson R, Davenport C, Jaffe B. 2012. Sediment scour and deposition within harbors in California (USA), caused by the March 11, 2011 Tohoku-oki tsunami. Sedimentary Geology, 282: 228–240. doi: 10.1016/j.sedgeo.2012.06.001
|
|
Zhang Mingliang, Ji Yongpeng, Wang Yini, et al. 2020. Numerical investigation on tsunami wave mitigation on forest sloping beach. Acta Oceanologica Sinica, 39(1): 130–140. doi: 10.1007/s13131-019-1527-y
|
|
Zhao Xi, Liu Hua, Wang Benlong. 2013. Evolvement of tsunami waves on the continental shelves with gentle slope in the China Seas. Theoretical and Applied Mechanics Letters, 3(3): 032005. doi: 10.1063/2.1303205
|


Figures(10) / Tables(7)

Supported by:
Beijing Renhe Information Technology Co. Ltd

Jingming Hou, Wei Lu, Tingting Fan, Peitao Wang. Tsunami hazard and mitigation analysis for bathing beaches in China based on numerical simulations[J]. Acta Oceanologica Sinica, 2022, 41(12): 27-37. doi: 10.1007/s13131-022-2027-z

| Location | Latitude, longitude | Mw |
| Japan Trench | 38.24°N, 142.37°E | 9.0 |
| Nankai Trough | 31.83°N, 133.50°E | 9.0 |
| Ryukyu Trench | 25.68°N, 128.81°E | 9.0 |
| Manila Trench | 18.97°N, 120.57°E | 9.0 |
| Philippine Trench | 13.70°N, 125.33°E | 9.0 |
| Mariana Trench | 12.50°N, 142.50°E | 9.0 |
DownLoad:
CSV
| Layer | Bathymetric data | Regional extent | Governing equation | Spatial resolution |
| Layer 1 | ETOPO2 | 5.0°–52.0°N, | linear | 2' |
| 99.0°–157.0°E | ||||
| Layer 2 | SRTM plus15 | 34.7°–41.6°N, | nonlinear | (1/4)' |
| 117.2°–124.9°E; | ||||
| 23.1°–34.7°N, | ||||
| 117.2°–123.5°E; | ||||
| 17.4°–24.1°N, | ||||
| 107.3°–117.1°E |
DownLoad:
CSV
| Hazard level | Amplitude/m | Color |
| 1 | >3 | red |
| 2 | 1–3 | orange |
| 3 | 0.3–1 | yellow |
| 4 | <0.3 | blue |
DownLoad:
CSV
| Layer | Bathymetric data | Regional extent | Governing equations | Spatial resolution |
| Layer 3 | nautical chart | 29.8°–29.9°N, 122.4°–122.5°E; | nonlinear | (1/32)' |
| 21.8°–22.0°N, 113.2°–113.3°E; 21.5°–21.6°N, 111.8°–111.9°E; 18.1°–18.3°N, 109.5°–109.7°E |
DownLoad:
CSV
| Bathing beach | City | Parameters | Japan Trench | Nankai Trough | Ryukyu Trench | Manila Trench | Philippine Trench | Mariana Trench |
| Zhujiajian | Zhoushan | Amplitude/m | 1.1 | 4.4 | 5.2 | 0.8 | 3.2 | 5.0 |
| Velocity/(m·s−1) | 0.5 | 0.6 | 3.9 | 0.1 | 1.2 | 2.4 | ||
| Dajiaowan | Yangjiang | Amplitude/m | 0.4 | 0.9 | 1.4 | 6.5 | 1.4 | 2.2 |
| Velocity/(m·s−1) | 0.1 | 0.3 | 0.5 | 4.3 | 0.4 | 0.5 | ||
| Feishatan | Zhuhai | Amplitude/m | 0.5 | 0.7 | 1.1 | 7.1 | 1.2 | 1.4 |
| Velocity/(m·s−1) | 0.2 | 0.1 | 0.2 | 4.8 | 0.2 | 0.5 | ||
| Yalongwan | Sanya | Amplitude/m | 0.3 | 1.0 | 1.2 | 3.5 | 0.8 | 1.1 |
| Velocity/(m·s−1) | 0.1 | 0.4 | 0.5 | 2.2 | 0.2 | 0.5 |
DownLoad:
CSV
| Length/m | Width/m | Height (msl)/m | Offshore distance/m | Shape | Material | |
| Scheme 1 | no additions | no additions | no additions | no additions | no additions | no additions |
| Scheme 2 | 70 | 30 | 10 | 400 | cuboid | concrete and plants |
| 70 | 30 | 10 | 400 | cuboid | concrete and plants | |
| 70 | 30 | 10 | 400 | cuboid | concrete and plants | |
| 70 | 30 | 10 | 400 | cuboid | concrete and plants | |
| Scheme 3 | 280 | 30 | 10 | 400 | cuboid | concrete and plants |
| Note: msl means mean sea level. | ||||||
DownLoad:
CSV
| Layer | Bathymetric data | Regional extent | Equation | Resolution |
| Layer 1 | ETOPO2 | 5°S–52°N, 99°–157°E | linear | 2' |
| Layer 2 | SRTM plus15 | 17.4°–24.1°N, 107.3°–117.1°E | nonlinear | (1/4)' |
| Layer 3 | nautical chart | 21.5°–21.6°N, 111.8°–111.9°E | nonlinear | (1/32)' |
| Layer 4 | nautical chart | 21.56°–21.58°N, 111.83°–111.85°E | nonlinear | (1/256)' |
DownLoad:
CSV
| Location | Latitude, longitude | Mw |
| Japan Trench | 38.24°N, 142.37°E | 9.0 |
| Nankai Trough | 31.83°N, 133.50°E | 9.0 |
| Ryukyu Trench | 25.68°N, 128.81°E | 9.0 |
| Manila Trench | 18.97°N, 120.57°E | 9.0 |
| Philippine Trench | 13.70°N, 125.33°E | 9.0 |
| Mariana Trench | 12.50°N, 142.50°E | 9.0 |
| Layer | Bathymetric data | Regional extent | Governing equation | Spatial resolution |
| Layer 1 | ETOPO2 | 5.0°–52.0°N, | linear | 2' |
| 99.0°–157.0°E | ||||
| Layer 2 | SRTM plus15 | 34.7°–41.6°N, | nonlinear | (1/4)' |
| 117.2°–124.9°E; | ||||
| 23.1°–34.7°N, | ||||
| 117.2°–123.5°E; | ||||
| 17.4°–24.1°N, | ||||
| 107.3°–117.1°E |
| Hazard level | Amplitude/m | Color |
| 1 | >3 | red |
| 2 | 1–3 | orange |
| 3 | 0.3–1 | yellow |
| 4 | <0.3 | blue |
| Layer | Bathymetric data | Regional extent | Governing equations | Spatial resolution |
| Layer 3 | nautical chart | 29.8°–29.9°N, 122.4°–122.5°E; | nonlinear | (1/32)' |
| 21.8°–22.0°N, 113.2°–113.3°E; 21.5°–21.6°N, 111.8°–111.9°E; 18.1°–18.3°N, 109.5°–109.7°E |
| Bathing beach | City | Parameters | Japan Trench | Nankai Trough | Ryukyu Trench | Manila Trench | Philippine Trench | Mariana Trench |
| Zhujiajian | Zhoushan | Amplitude/m | 1.1 | 4.4 | 5.2 | 0.8 | 3.2 | 5.0 |
| Velocity/(m·s−1) | 0.5 | 0.6 | 3.9 | 0.1 | 1.2 | 2.4 | ||
| Dajiaowan | Yangjiang | Amplitude/m | 0.4 | 0.9 | 1.4 | 6.5 | 1.4 | 2.2 |
| Velocity/(m·s−1) | 0.1 | 0.3 | 0.5 | 4.3 | 0.4 | 0.5 | ||
| Feishatan | Zhuhai | Amplitude/m | 0.5 | 0.7 | 1.1 | 7.1 | 1.2 | 1.4 |
| Velocity/(m·s−1) | 0.2 | 0.1 | 0.2 | 4.8 | 0.2 | 0.5 | ||
| Yalongwan | Sanya | Amplitude/m | 0.3 | 1.0 | 1.2 | 3.5 | 0.8 | 1.1 |
| Velocity/(m·s−1) | 0.1 | 0.4 | 0.5 | 2.2 | 0.2 | 0.5 |
| Length/m | Width/m | Height (msl)/m | Offshore distance/m | Shape | Material | |
| Scheme 1 | no additions | no additions | no additions | no additions | no additions | no additions |
| Scheme 2 | 70 | 30 | 10 | 400 | cuboid | concrete and plants |
| 70 | 30 | 10 | 400 | cuboid | concrete and plants | |
| 70 | 30 | 10 | 400 | cuboid | concrete and plants | |
| 70 | 30 | 10 | 400 | cuboid | concrete and plants | |
| Scheme 3 | 280 | 30 | 10 | 400 | cuboid | concrete and plants |
| Note: msl means mean sea level. | ||||||
| Layer | Bathymetric data | Regional extent | Equation | Resolution |
| Layer 1 | ETOPO2 | 5°S–52°N, 99°–157°E | linear | 2' |
| Layer 2 | SRTM plus15 | 17.4°–24.1°N, 107.3°–117.1°E | nonlinear | (1/4)' |
| Layer 3 | nautical chart | 21.5°–21.6°N, 111.8°–111.9°E | nonlinear | (1/32)' |
| Layer 4 | nautical chart | 21.56°–21.58°N, 111.83°–111.85°E | nonlinear | (1/256)' |
 DownLoad: