
Figure
1.
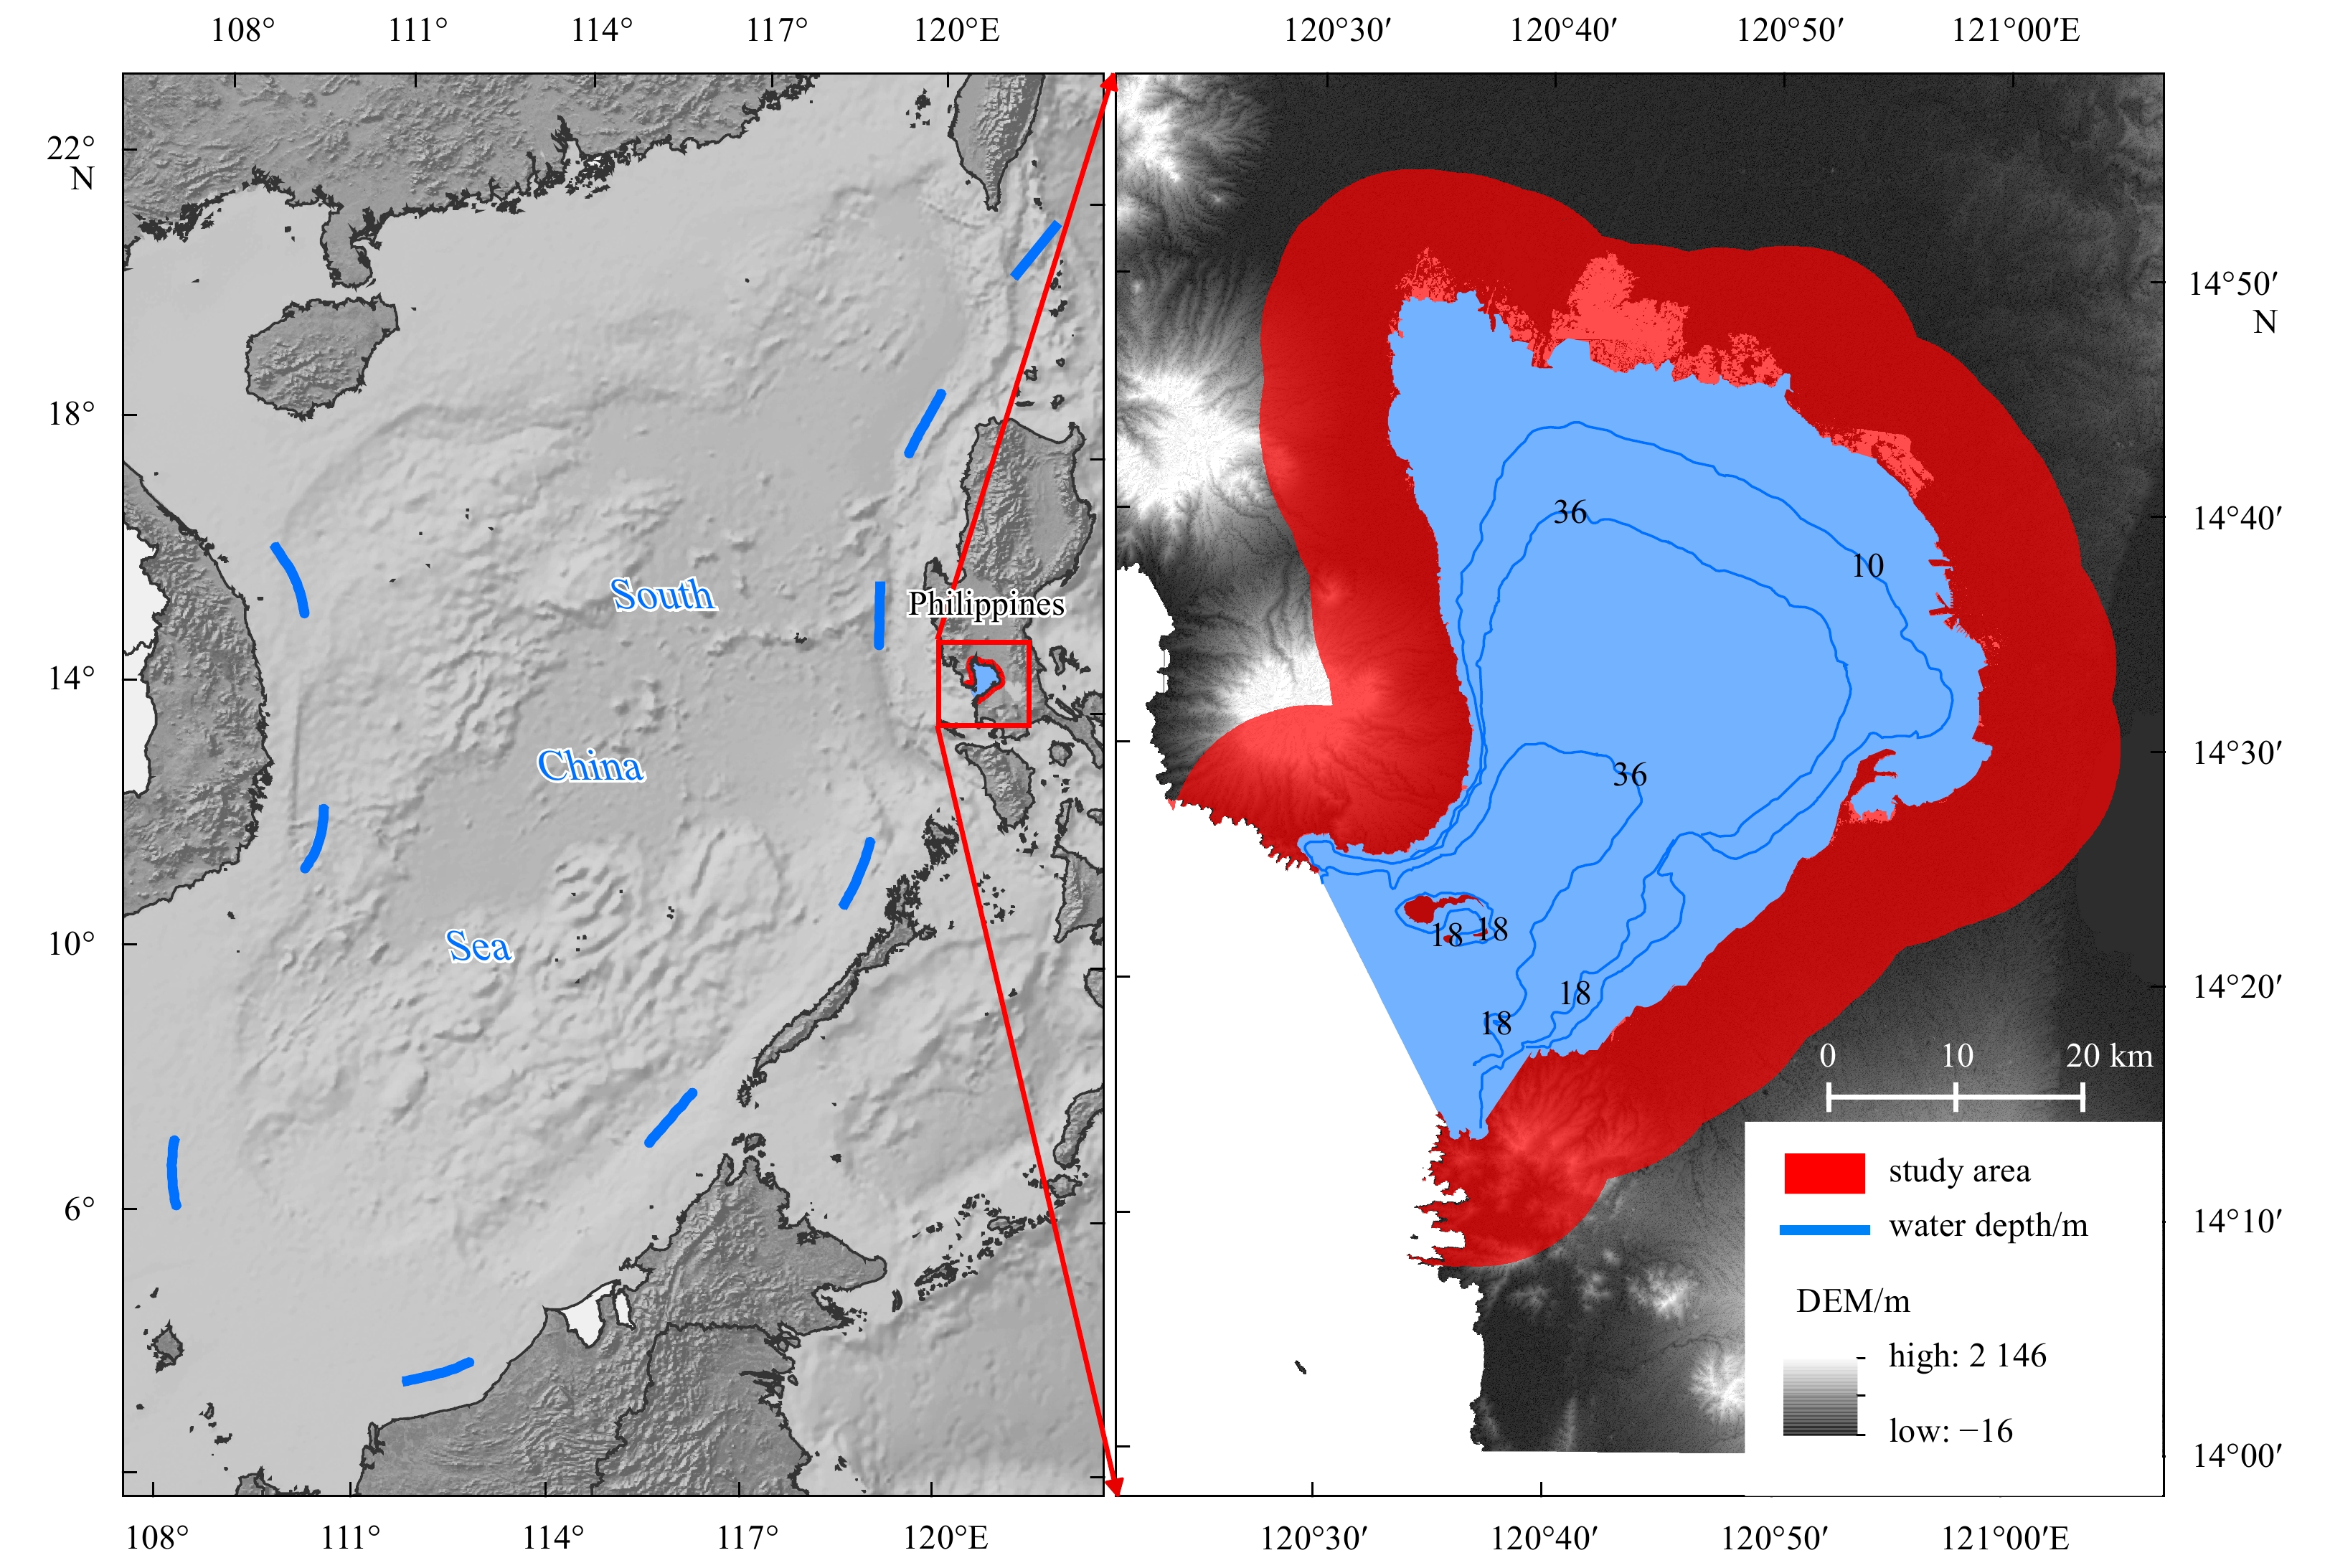
Location of the study area.
| Citation: | Zhi Ding, Fenzhen Su, Yanan Chen, Ying Liu, Xue Feng, Wenqiu Hu, Fengqin Yan, He Li, Pujia Yu, Xuguang Tang. Whether human-induced activities could change the gradient pattern of coastal land use along the sea-land direction: a case study in Manila Bay, Philippines[J]. Acta Oceanologica Sinica, 2023, 42(2): 163-174. doi: 10.1007/s13131-022-2026-0

|
The coastal zone, which is the interaction zone between the ocean, the atmosphere and the land, plays a key role in global energy and material flow (Ray, 1991; Hadley, 2009; Grachev et al., 2018). The coastal zone is a place with unique zonal characteristics along the land–sea direction due to the comprehensive result of terrestrial and marine factors and land–ocean interactions (LOIs) (Ray, 1991; Ray and Hayden, 1992; Hadley, 2009). The zonal characteristic is usually shown by the physiographic, physiochemical, and biogenic gradients (Ray, 1991). As one of the popular forms of multiple coastal features, the coastal land use and land cover (LULC) also shows a gradient pattern along the sea–land direction (Xu et al., 2012; Di et al. 2015; Ding et al., 2017, 2019). Affected by global change, particularly for human disturbance, the coastal zone has recently experienced dramatic changes, including urban expansion, wetland decrease and coastal erosion (Li et al., 2017; Zhou et al., 2018; Liu et al., 2020; Huang et al., 2021). The increasing intense human activities have largely changed the coastal LULC pattern and led to habitat degradation that has become the dominant driving factor of the ecological and environmental issues in the coastal region (Martinez et al., 2017; Zhang et al., 2017; Zhou et al., 2018; Huang et al., 2021). However, whether human-induced activities could change the gradient pattern of coastal land use along the sea–land direction remains unclear, and exploring their relationship will offer a new way of assessing the impact of human activities on coastal change.
The coastal LULC gradient pattern refers to the regular spatial pattern of the LULC along the sea–land direction (Ray, 1991; Ding et al., 2019). For example, affected by salinity, agricultural land, including dry land and paddy field, is mainly distributed around the inland part of the coastal zone (Hou and Xu, 2011). Meanwhile, salt vegetation often shows a zonal pattern with salinity and soil moisture content gradient due to the interaction of land and sea (Xin et al., 2010; Marani et al., 2013). In addition, buffering analysis indicates that land use intensity is low in the island and near-shore areas but high in regions that are 4–30 km away from the coastline (Sheik and Chandrasekar, 2011; Di et al., 2015). However, this land use gradient might vary due to the spatial heterogeneity of the coastal LULC along the horizontal direction. On this basis, a new method based on the land use sequential relationships along the sea–land gradient was developed to mine the spatial heterogeneity of the typical coastal land use sequence patterns (CLUSPs) along both the sea–land and horizontal directions (Ding et al., 2019). However, the land uses sequential number, a key index used in this method, has no direct correlation with the distance from the coastline and might not represent the actual spatial location along the sea–land direction.
With the development of society and economy, the increasing human activities have become the major driving forces of coastal zone change (Sajjad et al., 2018). On the one hand, anthropic disturbances, such as sea reclamation and urban expansion, lead to a large decrease in coastal wetland (Zhou et al., 2018) and have a negative effect on ecosystem functions and services (Wang et al., 2018; Huang et al., 2020; Liu et al., 2020). On the other hand, ecological restoration activities, such mangrove restoration that greatly improves mangroves, have been conducted to protect the coastal wetland (Hu et al., 2018, 2020). Meanwhile, multiple integrated coastal zone planning and management strategies have also been developed to achieve sustainable development goals (Islam and Shamsuddoha, 2018; Li et al., 2019; Politi et al., 2019). Consequently, the actual impact of human activities on coastal zone change is difficult to assess. The land–sea gradient feature of the coastal zone that is a unique characteristic is the result of the comprehensive effect of the inland, the ocean and the LOIs over a long period (thousands of years). The coastal land use pattern along the sea–land gradient is a typical representation of this feature, and its change has a close correlation with human activities, which might offer a new way of assessing the impact of human activities on coastal zone change.
Manila Bay was selected as the study area in this work. Manila Bay, a famous international port, has experienced dramatic land use change, and the urban area has become one of the most populated area in the world (Dado and Narisma, 2022). The major objectives of this study are as follows: (1) mine the typical land use gradient pattern along the sea–land direction, (2) explore the spatial–temporal changes of this typical land use gradient pattern and (3) analyse the impact of the specific land use activities on the changes of the coastal land use gradient pattern.
Manila Bay (14°03′–14°56′N, 120°06′–121°21′E) (Fig. 1) is in the western edge of Luzon and the east of South China Sea, a semi-enclosed estuary. The coastline of the bay spans 290 km. The bay water area is approximately 1 932 km2, with an average water depth of approximately 17 m. Located around the capital city of Philippines, Manila Bay has the biggest port in the Philippines. Since 1972, the population in this area has increased greatly, making City of Manila one most densely populated areas in the world (Dado and Narisma, 2022; Vallejo et al., 2019). Meanwhile, the urban area has also experienced a rapid increase in population growth (Dado and Narisma, 2022). With highly urbanised communities, Manila Bay has many environmental issues, ranging from land and sea based pollution, reclamation and land conversion (Mishra et al., 2021).
The LULC data (Fig. 2) was interpreted from Landsat TM images (

To quantify the spatial sequential pattern of the coastal LULC along the sea–land direction, the typical belt-shaped coastal zone was sampled into regular coastal transect lines with the same length and adjacent distance. Each coastal transect line represents one small coastal zone and retains the gradient characteristic of the LULC along the sea–land direction. In this study, the length of the coastal transect line was defined as 20 km (10 km for the inland part and 10 km for the ocean part). The adjacent distance between the transect lines was defined as 300 m on the basis of the size of the smallest batch in the study area. The detailed sampling process of the coastal transect line can be seen in the references (Ding et al., 2017, 2019). Then, we constructed the LULC map of the coastal transect line (Fig. 3) on the basis of the LULC map.

Partitioning Around Medoids (PAM), one of the most popular clustering methods with high efficiency (Bindra et al., 2019), is widely used to mine regular rules in geospatial data (Disegna et al., 2017; Hahus et al., 2018; Cárdenas and Torres, 2021). The key principle of PAM is to classify the data into predefined k clusters and assign each object to their nearest centre medoid. Given that PAM uses a true sample object as the centre medoid, it is robust and only slightly affected by noisy data (Kumar and Wasan, 2011; Al Abid, 2014). Therefore, we selected PAM as the clustering method in this study.
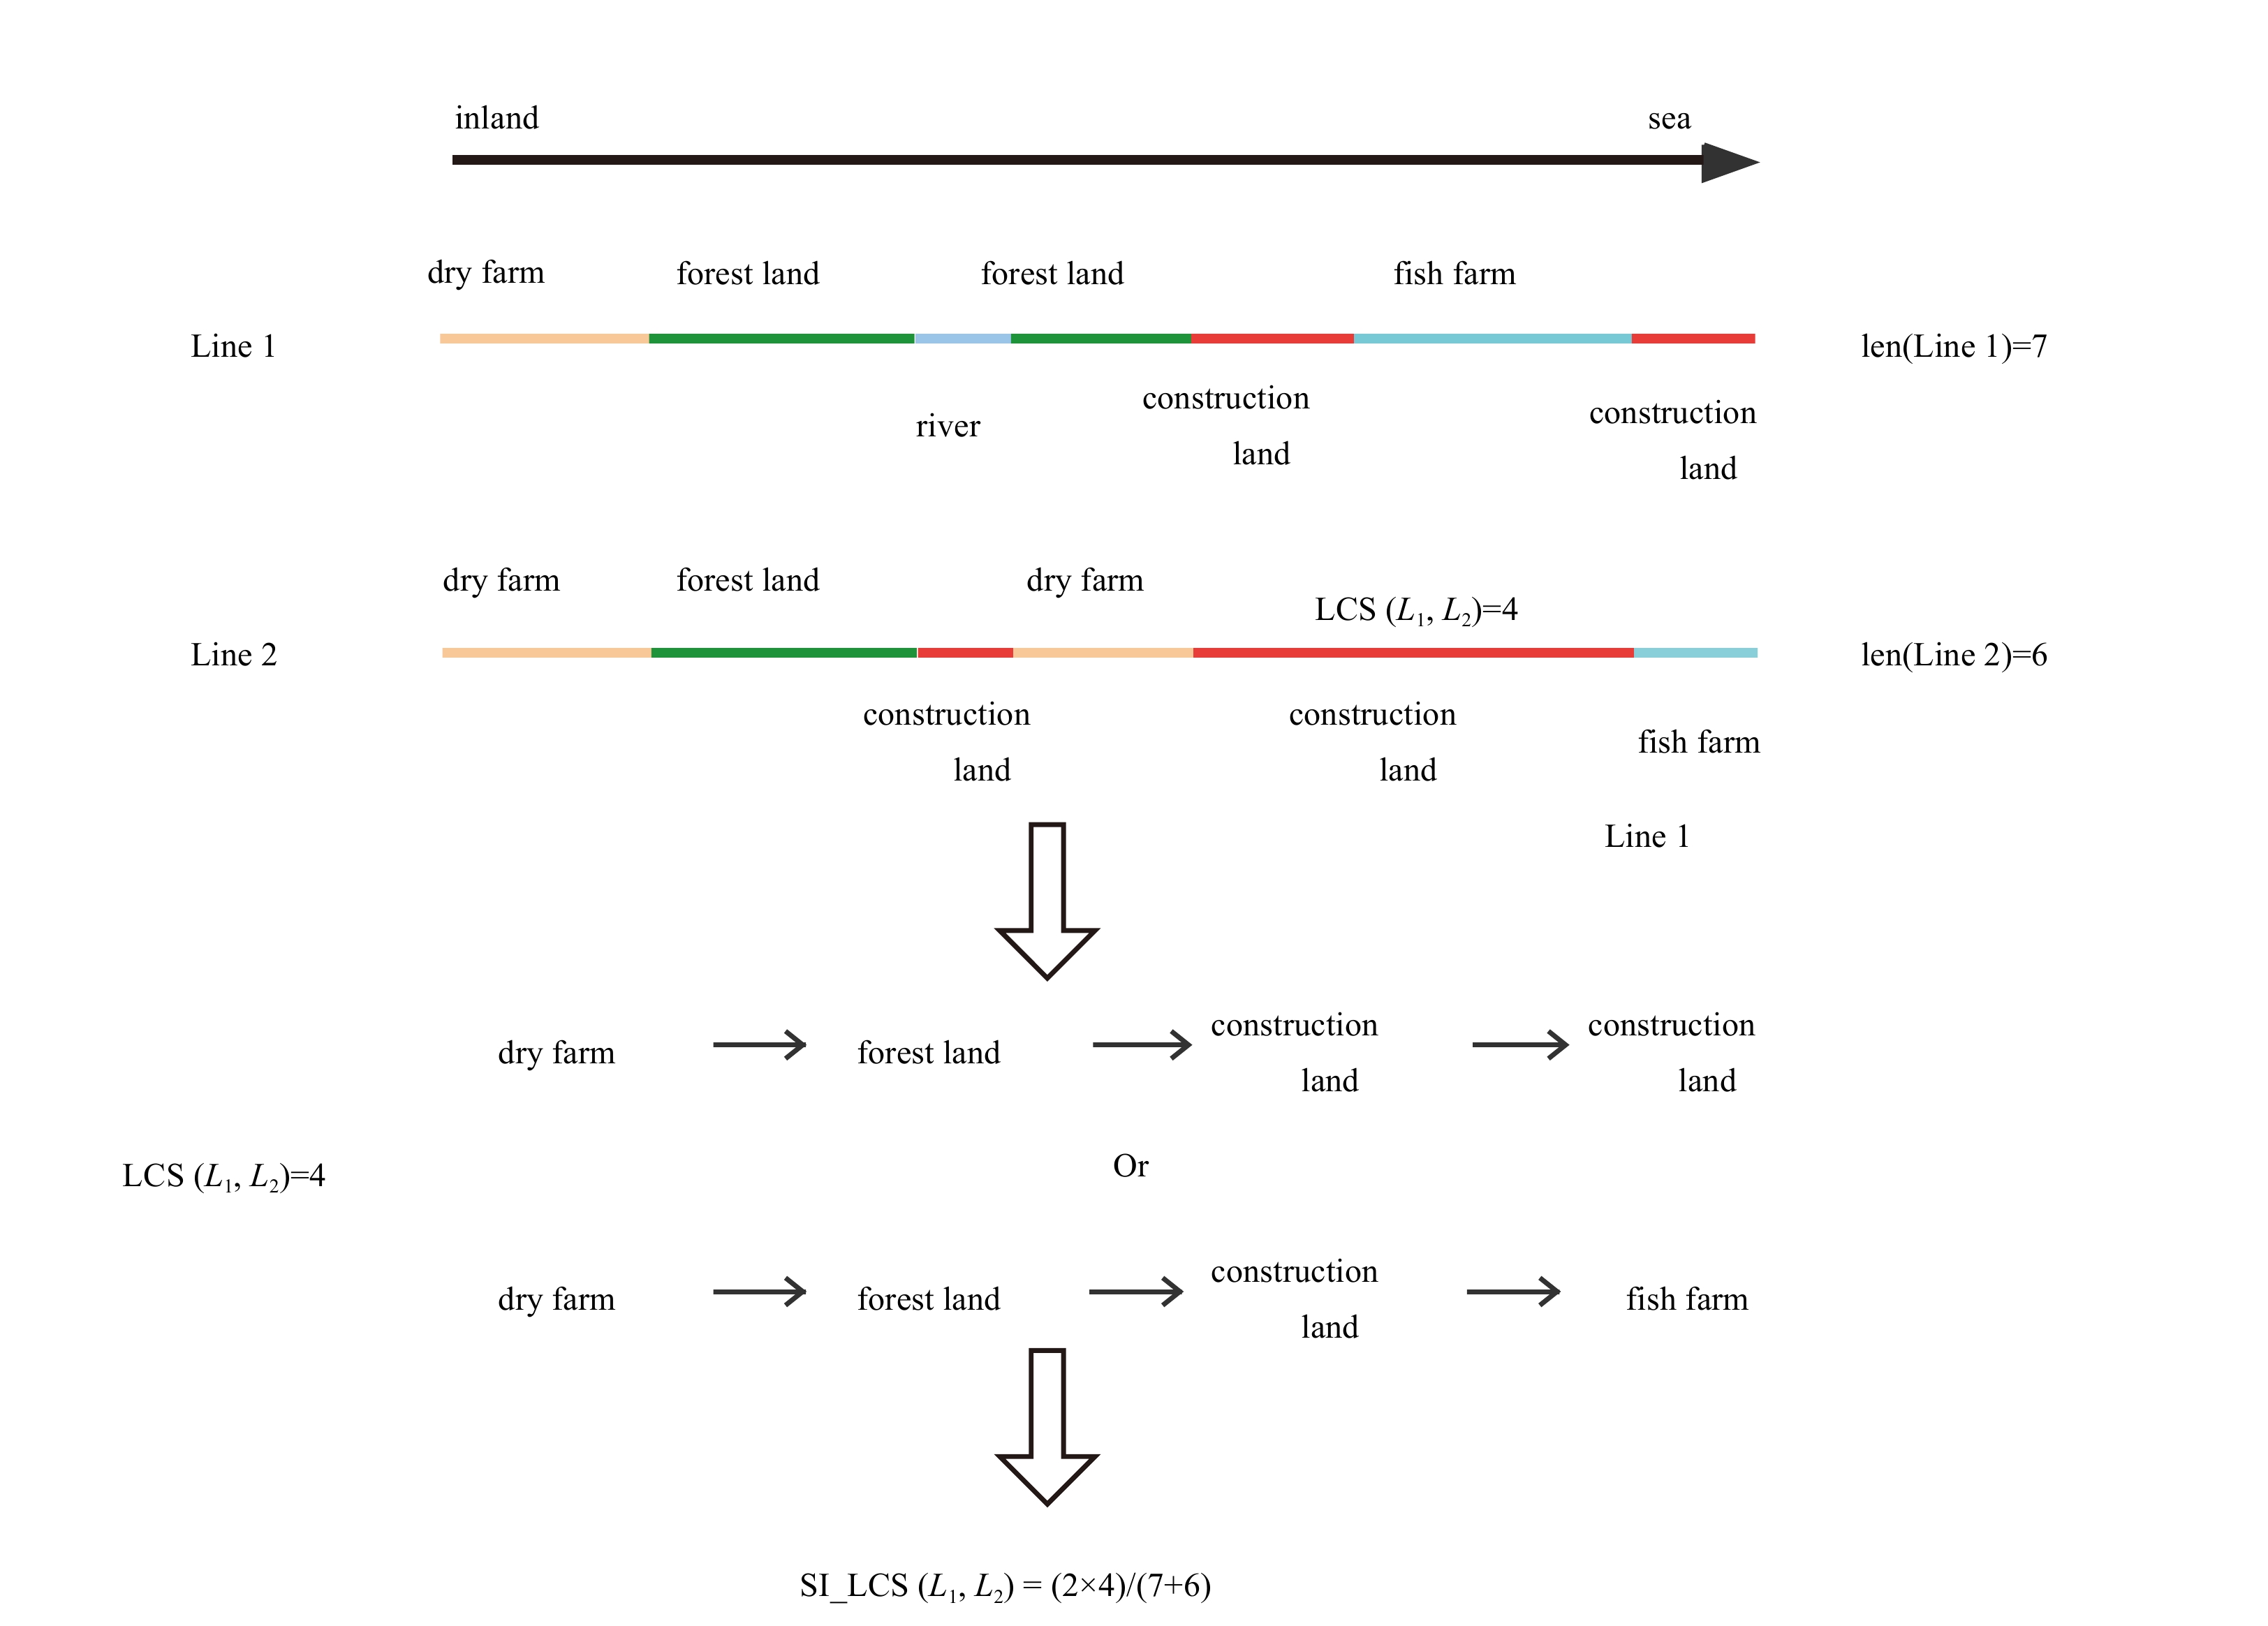
To calculate the similarity of the LULC’s sequential pattern along the sea–land direction, we developed the Similarity Index with the Longest Common Subsequence (SI_LCS), a similarity index based on the longest common subsequence (LCS) (Hirschberg, 1977; Tseng et al., 2018) between CLUSPs. The SI_LCS is calculated as follows (Eq. (1) and Fig. 4):

| $$ {{\rm{SI}}\_{\rm{LCS}}}(L_{i},{{L}}_{j})=\frac{{2\times {\rm{LCS}}(L}_{i},{L}_{j})}{\mathrm{l}\mathrm{e}\mathrm{n}\left({L}_{i}\right)+\mathrm{l}\mathrm{e}\mathrm{n}\left({L}_{j}\right)} , $$ | (1) |
where SI_LCS (Li, Lj) is the clustering distance between coastal transect lines i and j; LCS (Li, Lj) is the count of the longest common subsequence between the lines i and j; len(Li) and len(Lj) are the counts of the LULC features in lines i and j along the sea–land direction, respectively.
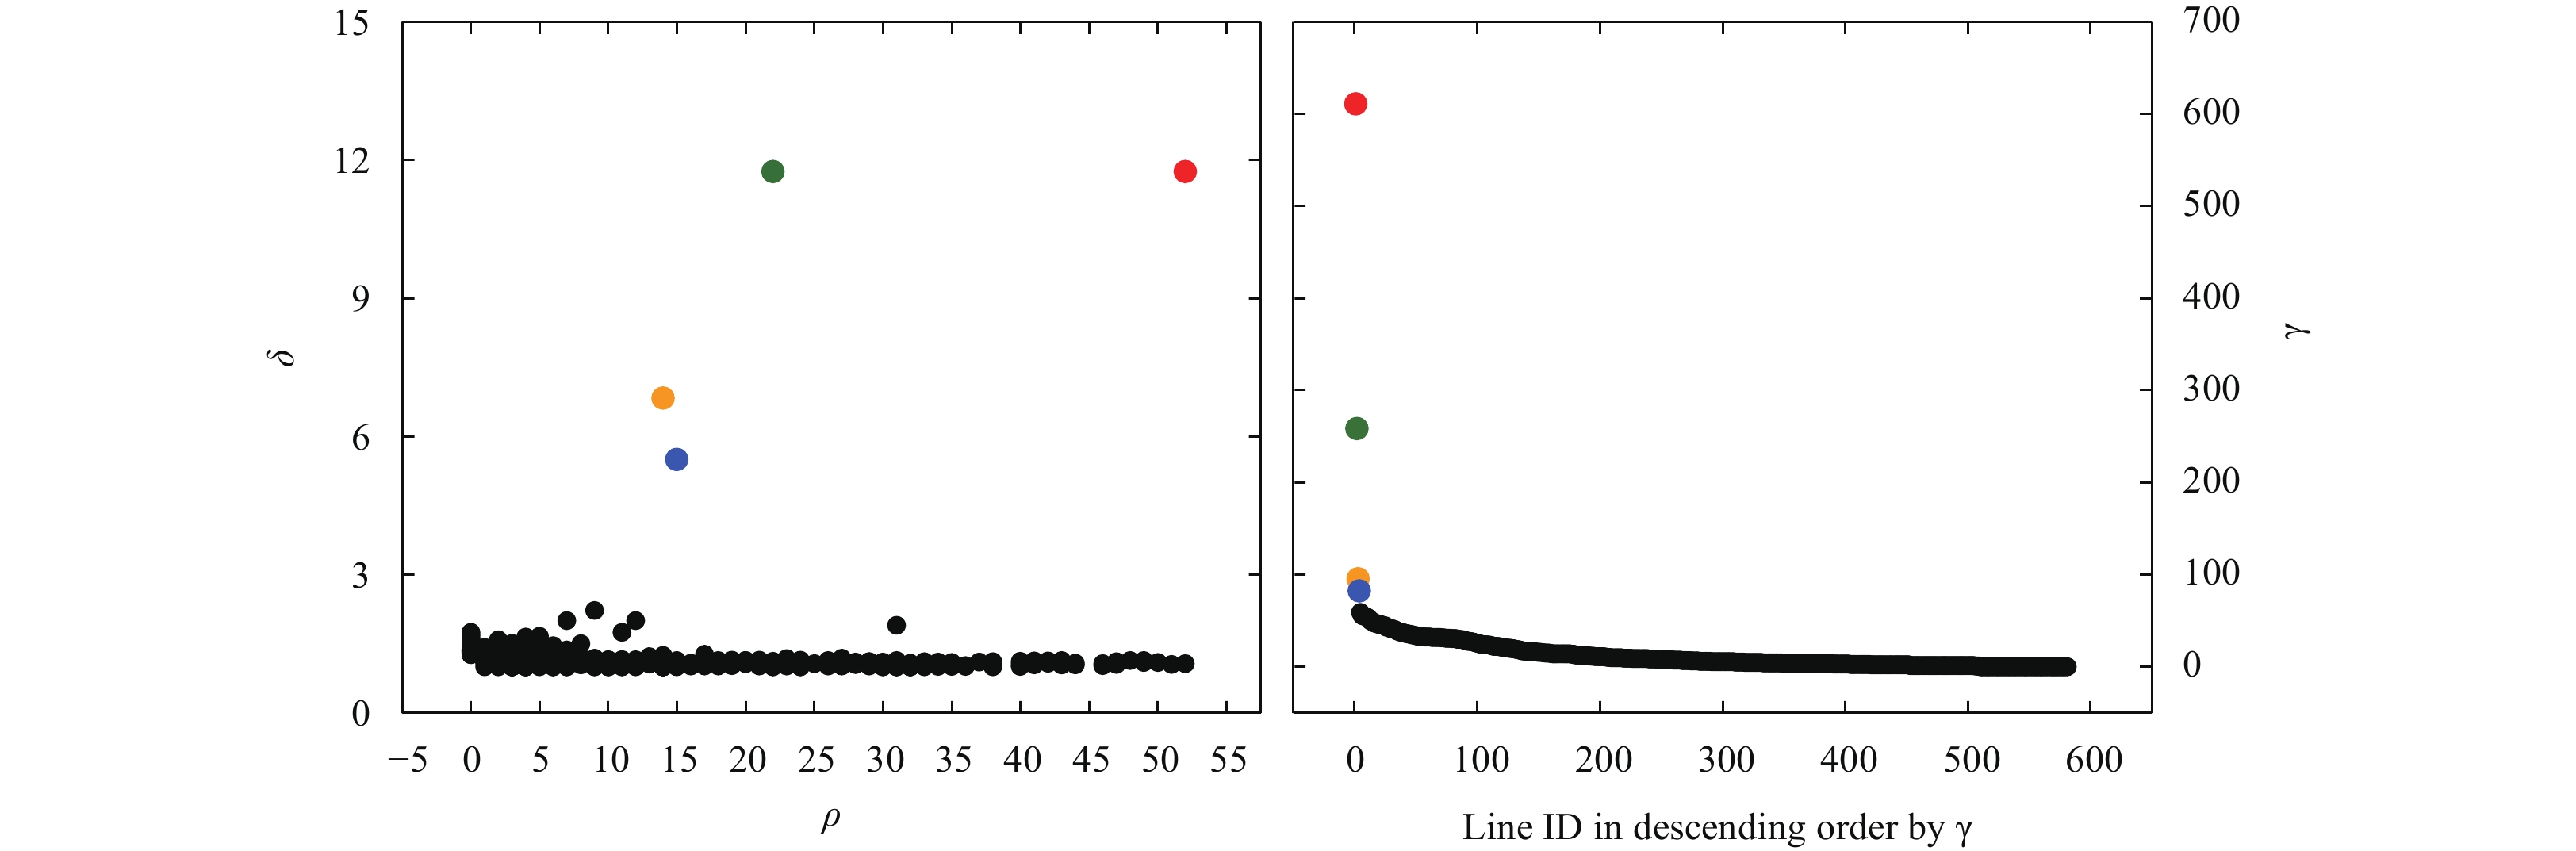
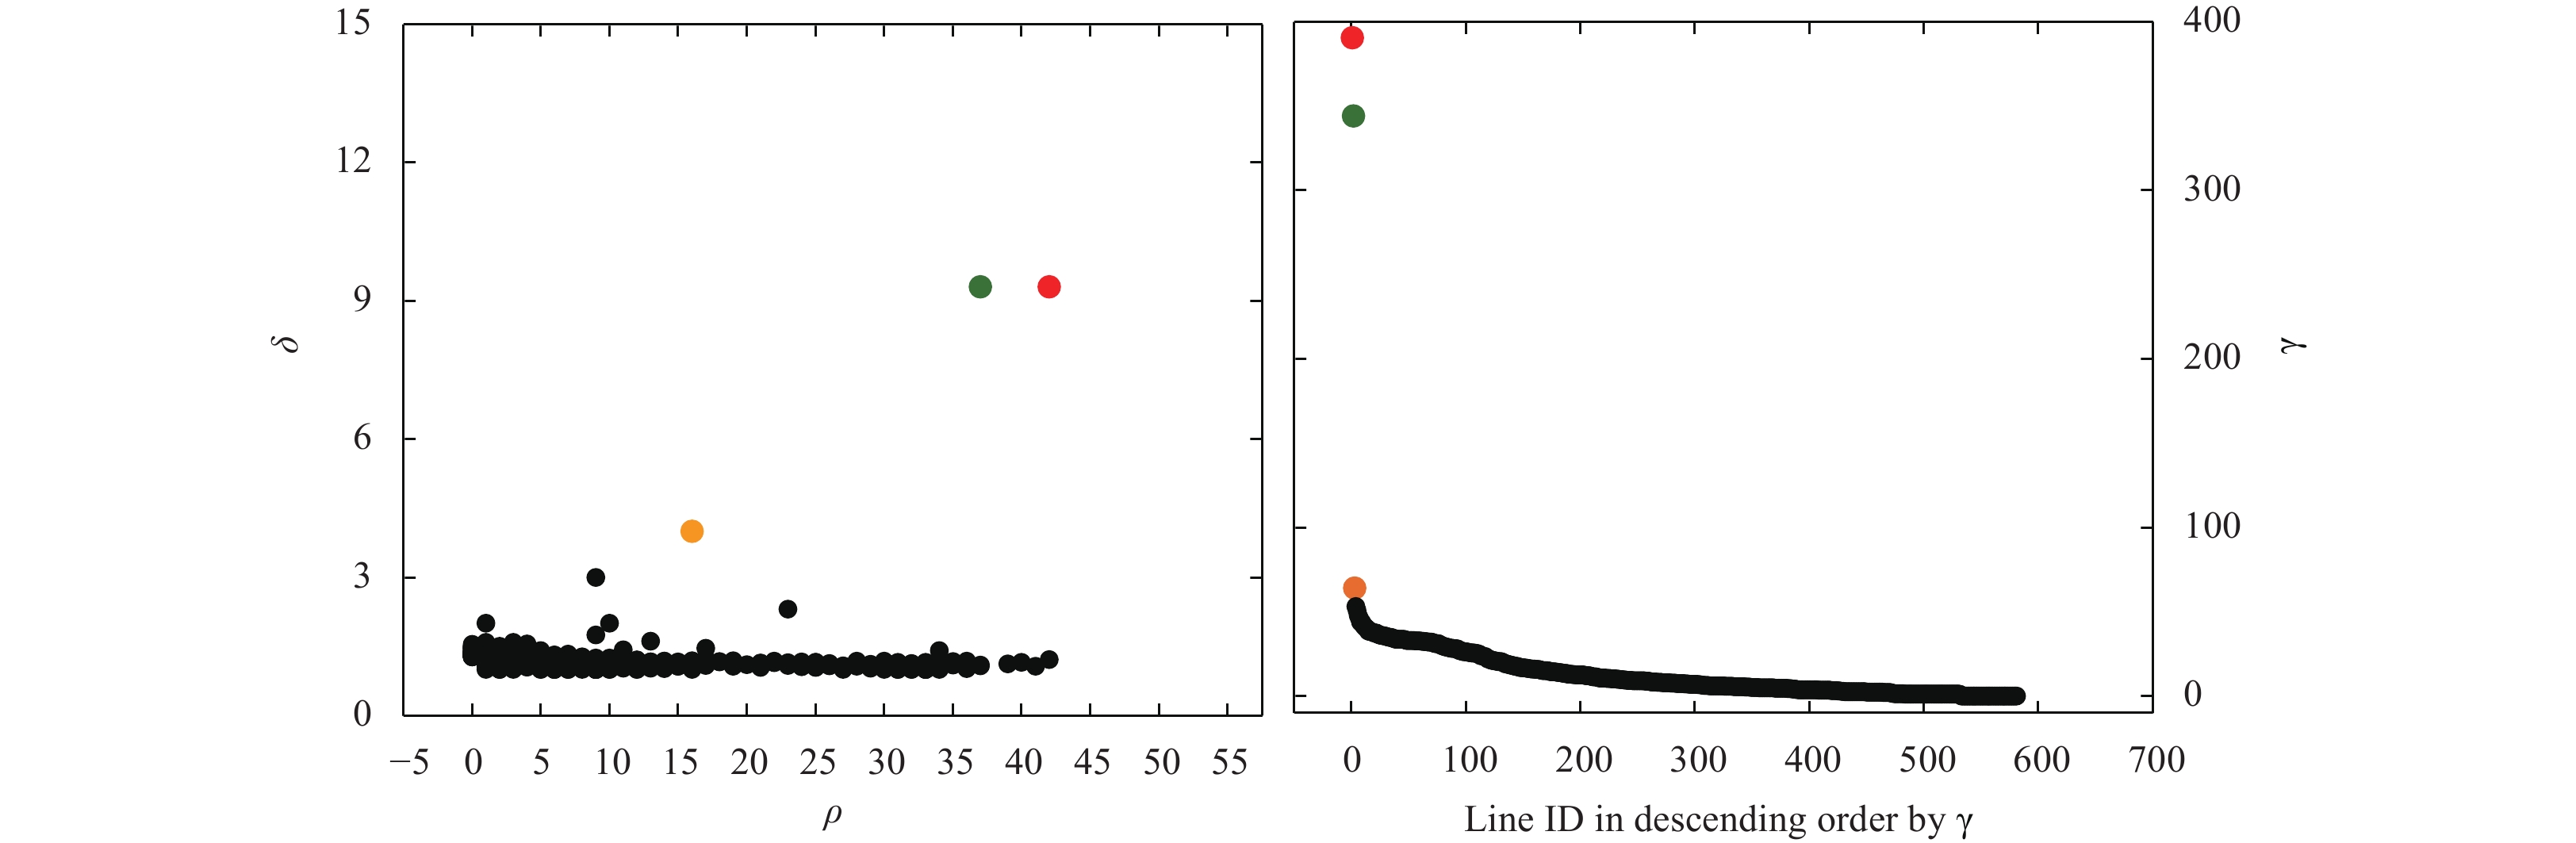
Like other clustering algorithms, PAM also arbitrarily predefines cluster number k (the number of cluster centres). Moreover, k is usually hard to define. An improved density peaks clustering method was developed for fast cluster k search (Rodriguez and Laio, 2014; Xu et al., 2018) and has been widely used by relevant clustering research (Xu and Tian, 2015; Du et al., 2016; Chen et al., 2020). This method defines the cluster centers as points surrounded by points with a low local density (ρ, Eq. (2)) and a large distance (δ, Eq. (3)) from any point with a high local density (Rodriguez and Laio, 2014). The cluster centers (anomalous points with anomalously large δ) are easily observed by the scatter points graph of δ and ρ (called decision graph in this paper). The detailed procedure can be seen in the reference (Rodriguez and Laio, 2014).
| $$ {\rho }_{i}=\sum _{j}\chi ({d}_{ij}-{d}_{c}) , $$ | (2) |
where
| $$ {\text{δ}}_{i}=\underset{j:{\rho }_{j} > {\rho }_{i}}{\mathrm{min}}\left({d}_{ij}\right) , $$ | (3) |
where δi is the minimum distance between point i and any other point with a higher density. For the point with the highest density, the δi is the maxj (dij).
Additionally, a hint for choosing the number of centers is provided by the plot of γ(= δ×ρ) sorted in decreasing order. The critical point is the mutation point of the γ value.
The sequential relationships of the LULCs in the CLUSP is derived from their locations along the sea–land direction. In a previous study, we used the average sequential number to represent the sequential relationships of the LULCs in the CLUSP along the sea–land direction (Ding et al., 2019). However, the sequential number has no direct correlation with the locations of the LULCs and might not represent the actual sequential relationships. In this study, we used the average distance (AD) from the coastline to represent the spatial locations of the LULCs along the sea–land direction. The sequential relationships of the LULCs in each CLUSP were sorted in ascending order of the average distances of the LULCs from the coastline. The AD is calculated as follows (Eq. (4)):
| $$ {{\rm{AD}}}_{{{\rm{LC}}}_{m}}=\frac{\displaystyle\sum\limits _{k=1}^{n}{\rm{mean}}\left({d}_{{{\rm{LC}}}_{m,k}}\right)}{n} , $$ | (4) |
where
According to Figs 5 and 6, the CLUSP of Manila could by classified into four clusters in 1988, and three clusters in 2016. Spatially, the CLUSP clusters in 1988 and 2016 showed an aggregated distribution in which the transect lines that belonged to the same cluster were near each other (Fig. 6). CLUSP 1 in 1988 and 2016 had the same cluster centre and was mainly distributed around the sides of the bottom of Manila Bay (Fig. 7). CLUSP 4 in 1988 and CLUSP 3 in 2016 had a similar distributed area, mainly around the top of the bay. CLUSP 3 in 2016 covered the majority of the total areas of CLUSPs 2 and 3 in 1988 and was mainly distributed around the sides of the middle of the bay.


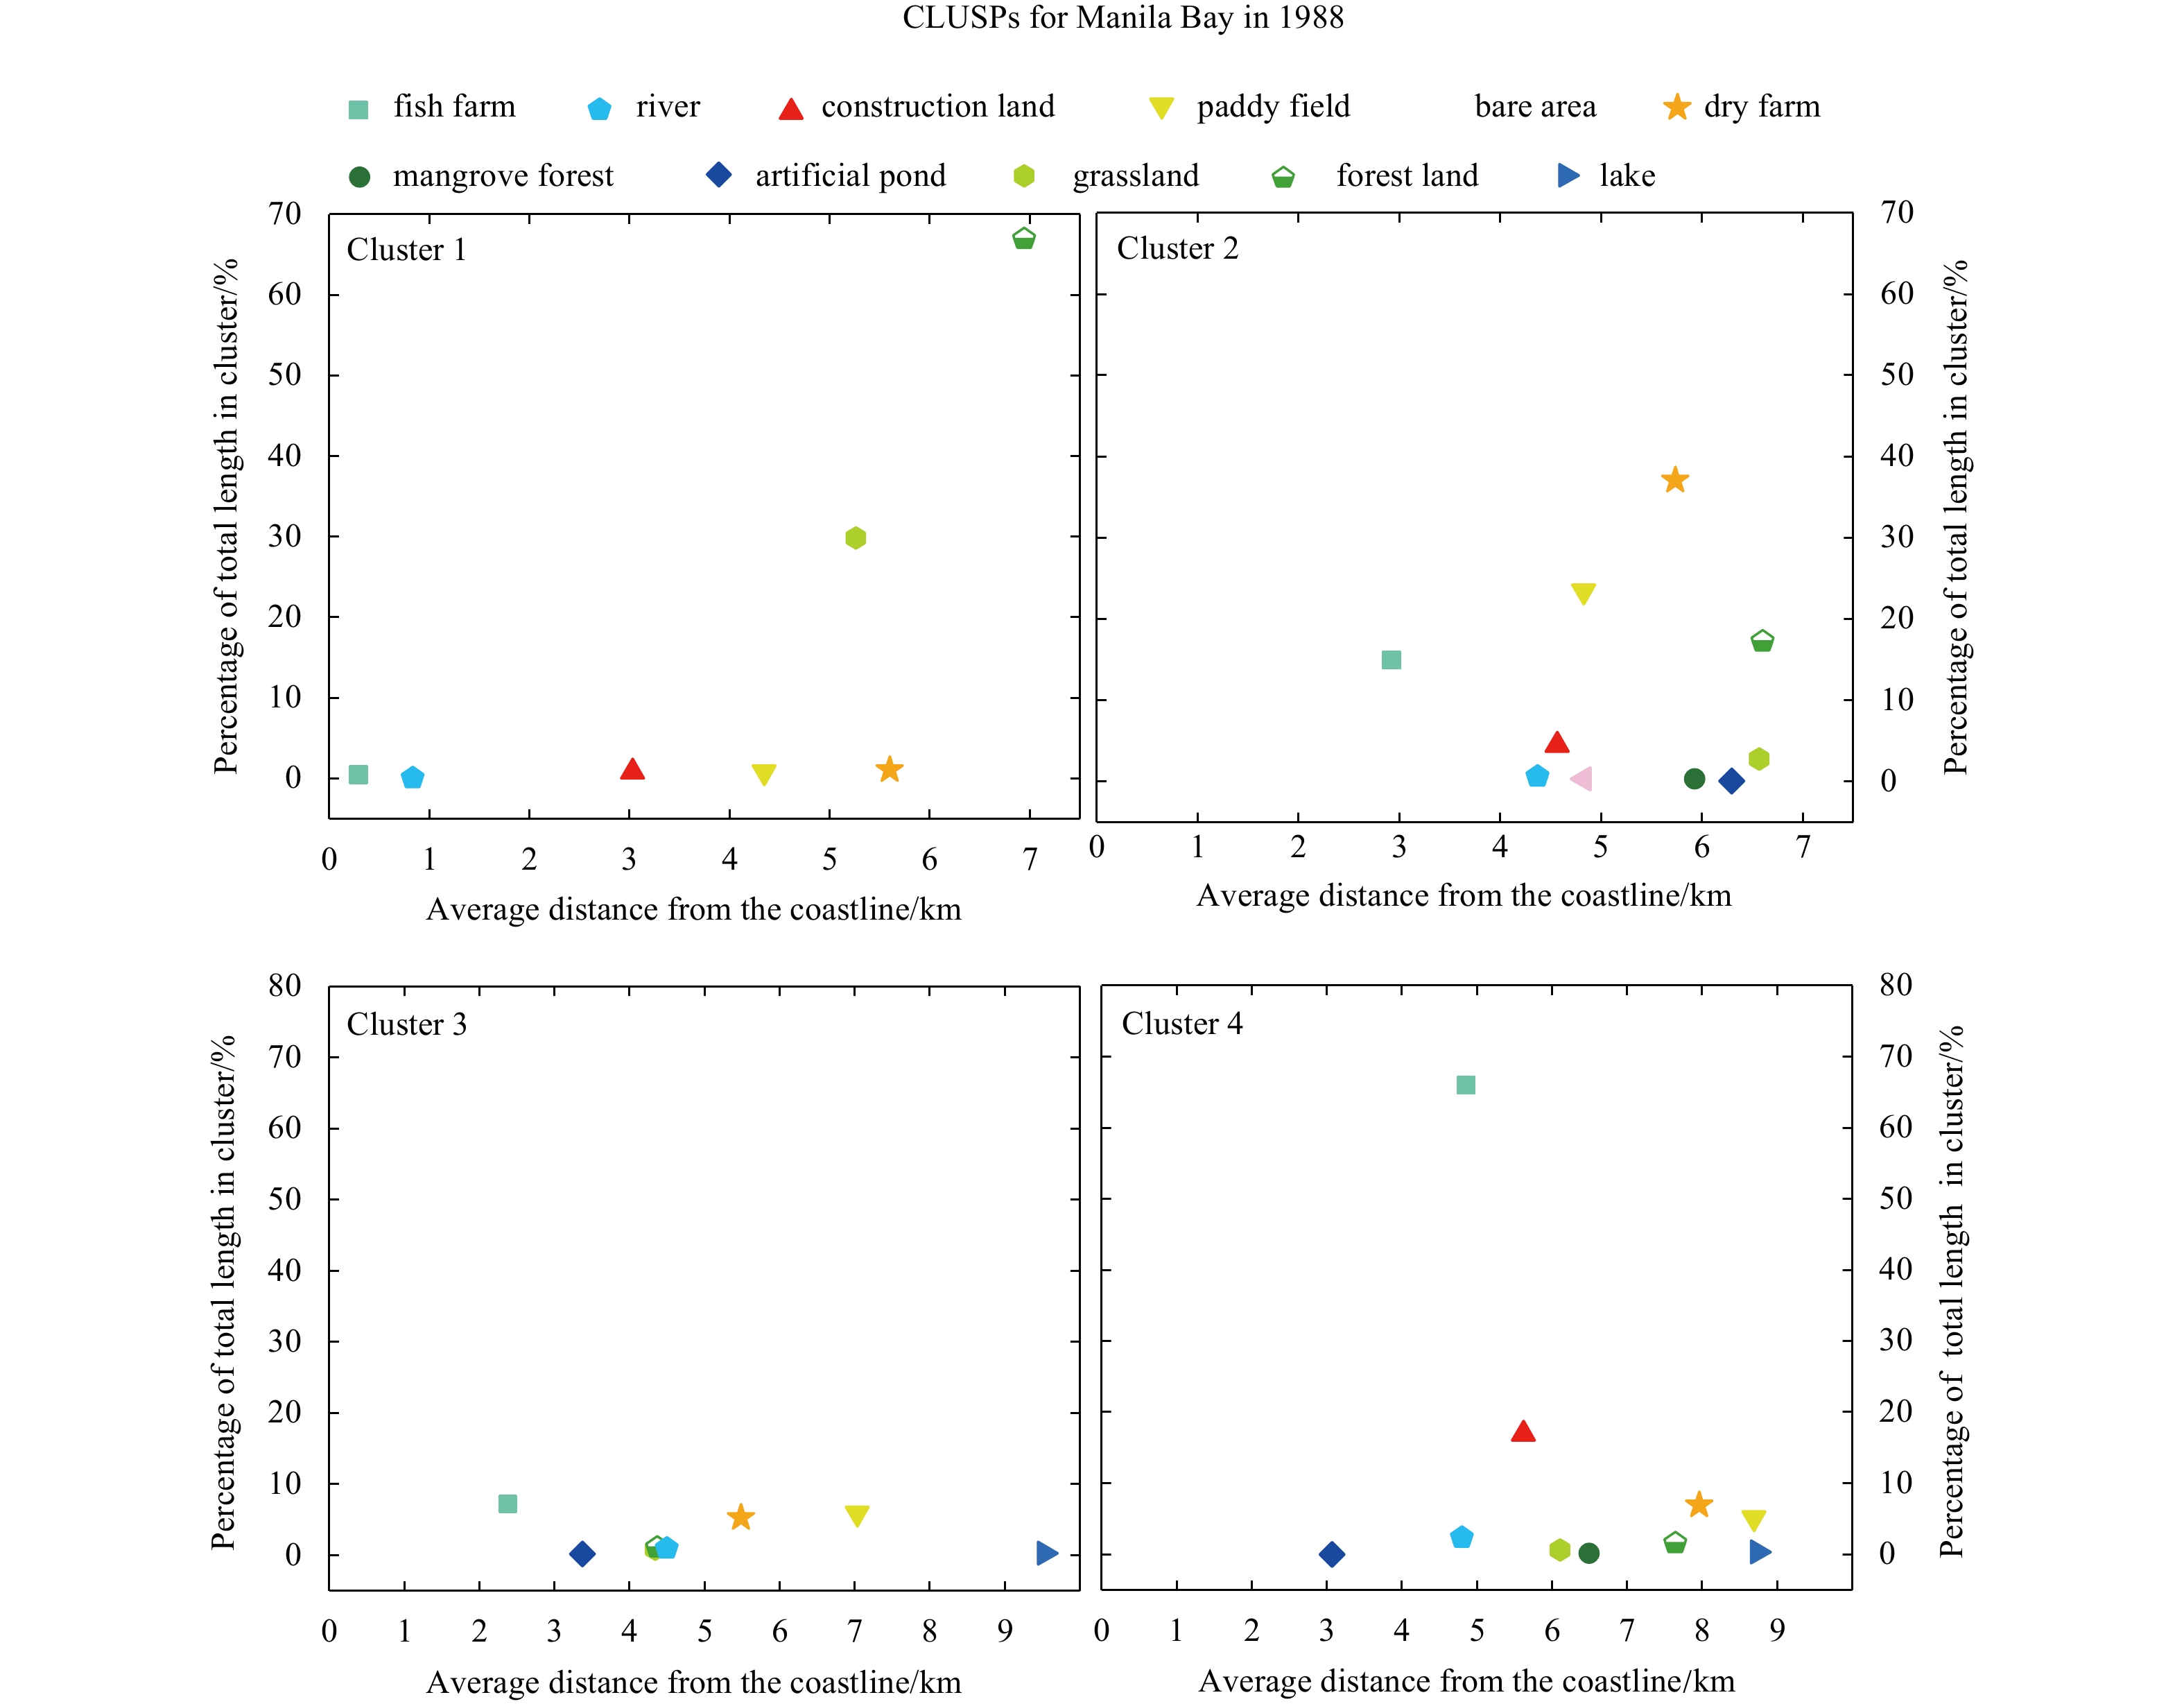
In 1988, the four CLUSPs showed typical land development and spatial pattern along the sea–land direction (Fig. 8). CLUSP 1 (Cluster 1) was a typical natural CLUSP dominated by forest and grassland that covered more than 96% of the total area in this pattern. CLUSP 1 also showed a landward distribution along the sea–land direction. Given that forest and grassland were mainly distributed in the inland places far from the coastline, the other LULC types with a lower coverage were in front of them along the sea–land direction. CLUSP 2 was an agricultural CLUSP dominated by dry farm and paddy field (accounting for approximately 60% of the total coverage) and also showed a landward distribution along the sea–land direction. CLUSP 3 was a typical urbanised CLUSP in which construction land covered more than 78% of the total coverage and the other LULC types covered less than 10% of the total coverage in this pattern. Meanwhile, construction land was mainly distributed around the areas near the coastline. Therefore, CLUSP 3 showed a seaward distribution along the sea–land direction. CLUSP 4 was a fishery CLUSP (accounting for approximately 70% of the total coverage) and also showed a seaward distribution along the sea–land direction.

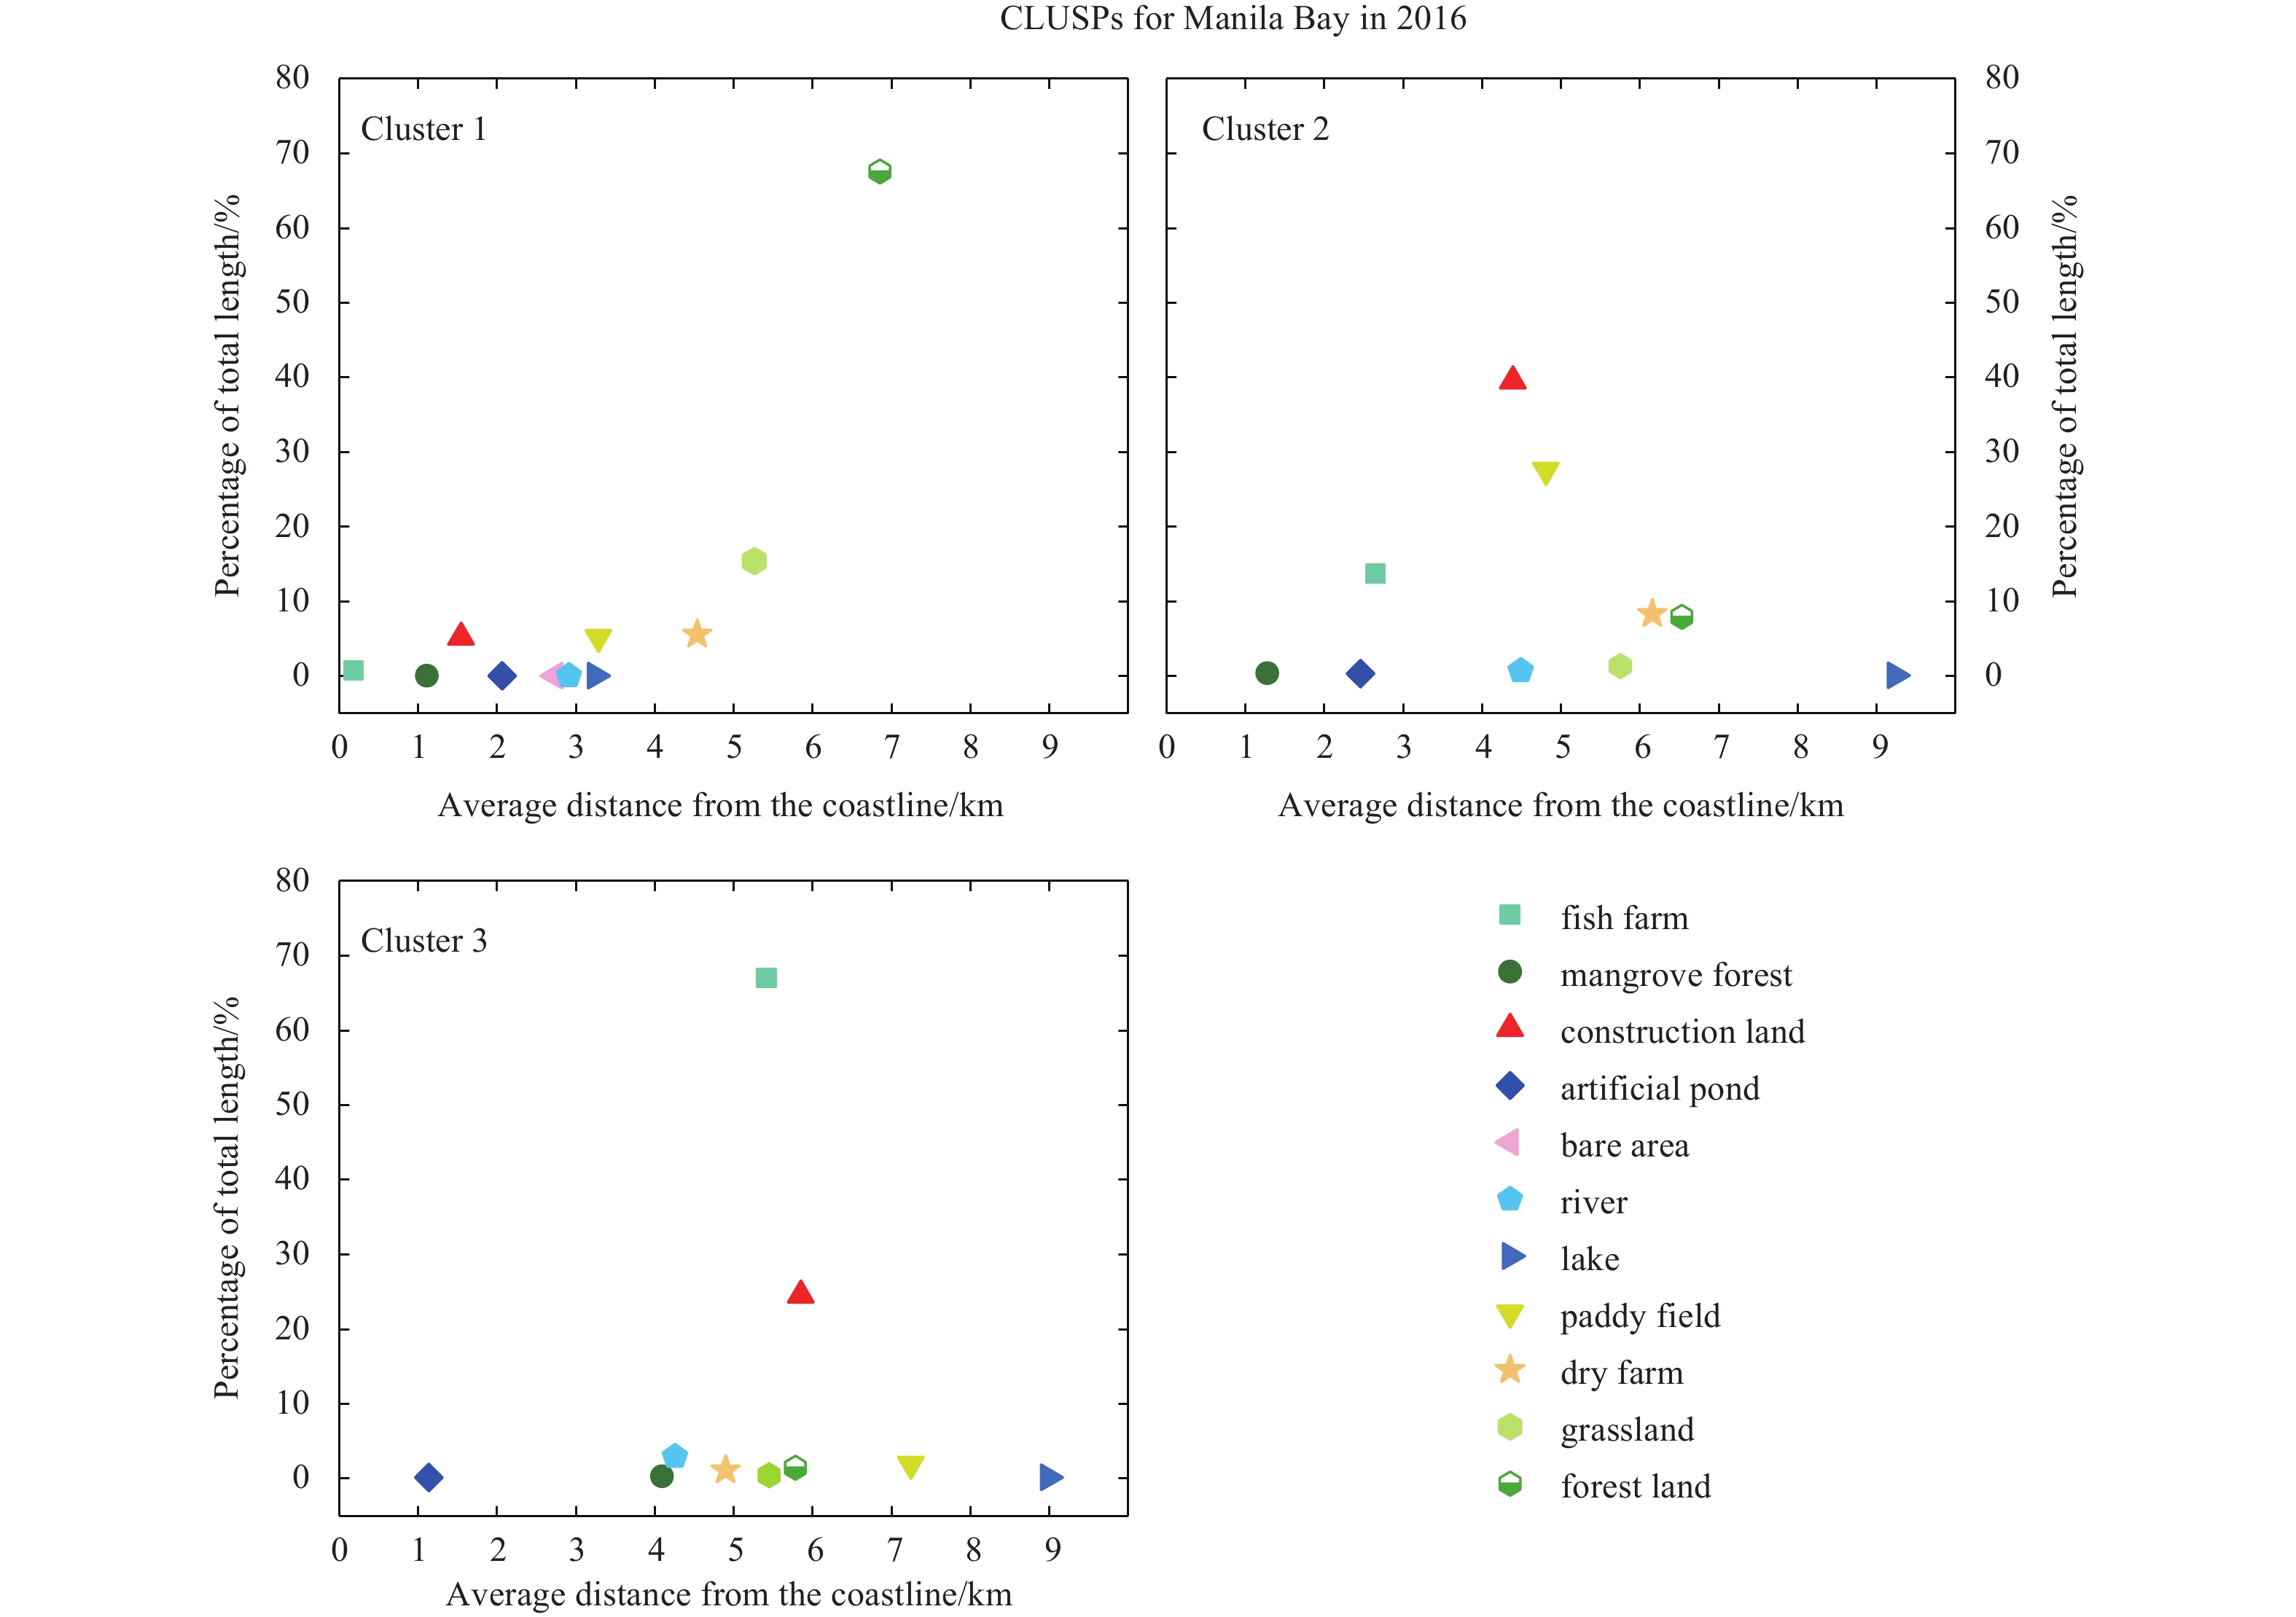
Like CLUSP 1 in 1988, CLUSP 1 in 2016 was also a typical natural CLUSP and showed a landward distribution along the sea–land direction (Fig. 9). However, the CLUSP in 2016 was mainly covered by forest land that accounted for more than 67% of the total coverage in this pattern. CLUSP 2 in 2016 was an intermediate CLUSP between the agricultural CLUSP (CLUSP 2 in 1988) and the urbanised CLUSP (CLUSP 3 in 1988). Agricultural area (dry land and paddy field) and urban area had a similar coverage (accounting for approximately 39% and 36% of the total coverage in this pattern, respectively), covering more than 75% of the total area. Meanwhile, these major LULC types were mainly distributed around the middle places along the sea–land direction. Thus, CLUSP 2 in 2016 showed a neutral distribution along the sea–land direction. CLUSP 3 in 2016 was a typical fishery CLUSP in which fish farm covered approximately 67% of the total area in this pattern. Although fish farm belongs to the typical seaward LULC, it was mainly distributed around the middle places and showed a neutral distribution along the sea–land direction. This phenomenon might be due to the landward expansion of fish farm.

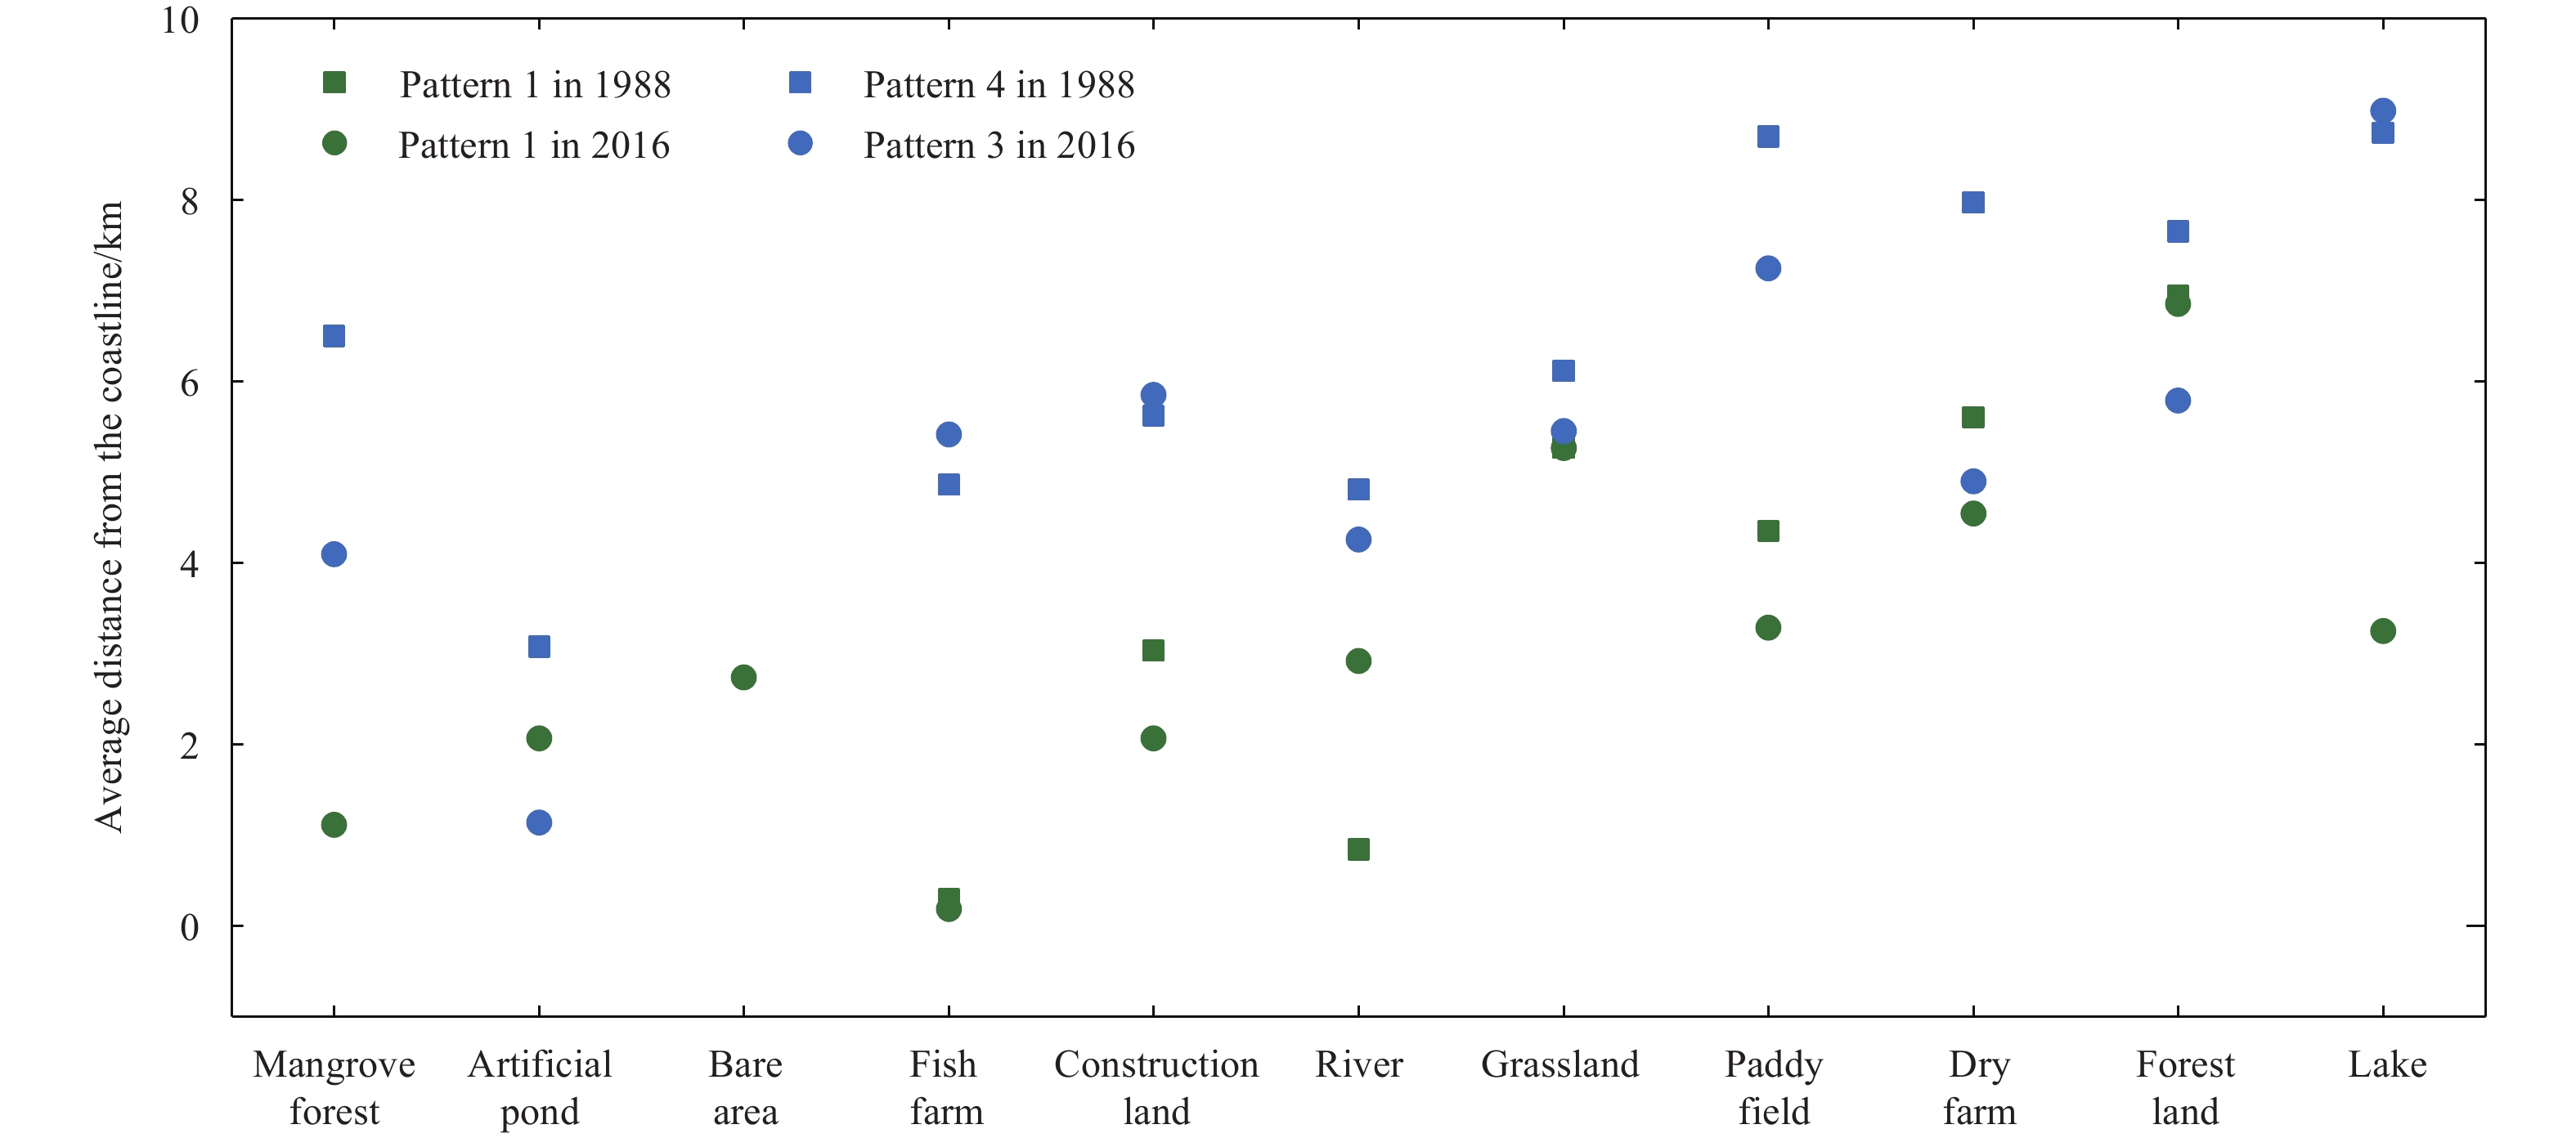
From 1988 to 2016, the number of CLUSP types decreased from 4 to 3 mainly because of the fusion of the agricultural CLUSP (Pattern 2 in 1988) and the artificial CLUSP dominated by construction land (Pattern 3 in 1988) into the artificial CLUSP dominated multiple LULC types (i.e., construction land, fish farm, paddy field and dry farm). Meanwhile, more than 84% of the area covered by Pattern 2 in 2016 also belonged to the area of Patterns 2 and 3 in 1988. The sequential locations of the LULCs for the CLUSPs also had obvious changes, and the majority of the LULC types, except for fish farm and forest land, were far from the coastline (Fig. 10). Even with a similar natural CLUSP, such as Pattern 1 in 1988 and 2016, the majority of the LULC types, except for river, in this pattern were farther from the coastline than those in 2016 (Fig. 11). A similar result was obtained for the fishery CLUSP pattern (Pattern 4 in 1988 and Pattern 3 in 2016, Fig. 11). CLUSP 4 (artificial pond-river-fish farm-construction land-grassland-mangrove forest-forest land-dry land-paddy field) in 1988 changed to CLUSP 3 (artificial pond-mangrove forest-river-dry farm-fish farm-grassland-forest land-construction land-paddy field) in 2016 along the sea–land direction. Particularly, the sequential location of construction land changed from the 4th of Pattern 4 in 1988 to the 8th of Pattern 3 in 2016, whilst dry farm and mangrove forest changed from the 8th and 6th to the 4th and 2nd, respectively. Additionally, the land use intensity of typical CLUSPs increased from 1988 to 2016. The area percentage of the major artificial LULC types, including construction land, dry farm, paddy field and fish farm, showed an increasing trend (0.49 % per year and 0.37 per year for Patterns 1 and 2, respectively) in either the typical artificial CLUSP (Pattern 2 in 1988 and 2016) or the nature CLUSP (Pattern 1 in 1998 and 2016) from 1988 to 2016.


We found that the CLUSPs presented spatial–temporal stability and variability in Manila Bay from 1988 to 2016. Stability mainly refers to some similar typical CLUSPs in 1988 and 2016, such as the typical nature CLUSP (Pattern 1 in 1988 and 2016) and the fishery CLUSP (Pattern 4 in 1988 and Pattern 3 in 2016). These similar CLUSPs not only had a stable land use sequential pattern along the sea–land direction (Fig. 10) but also covered a similar region in the study area. For example, the overlap areas of Pattern 1 in 1988 and in 2016 covered more than 96% and 82% of the entire areas for the two patterns, respectively. Similarly, Pattern 4 in 1988 and Pattern 3 in 2016 had large overlap percentages of more than 73% and 71%, respectively. The stable land use sequential pattern was also reported in previous studies (Li et al., 2016; Feng et al., 2018; Ding et al., 2019), largely attributing the stability to the gradient characteristic the coastal zone along the sea–land direction (Ray, 1991; Hadley, 2009). Affected by terrestrial factors, marine factors and LOIs, the physiographic, physiochemical and biogenic features of the coastal zone exhibit a gradient pattern with the increasing distance from the sea (Ray, 1991). In terms of the stability of these coastal features, the coastal LULC, a representation of these features, also shows a gradient pattern with stable sequential relationships along the sea–land direction.
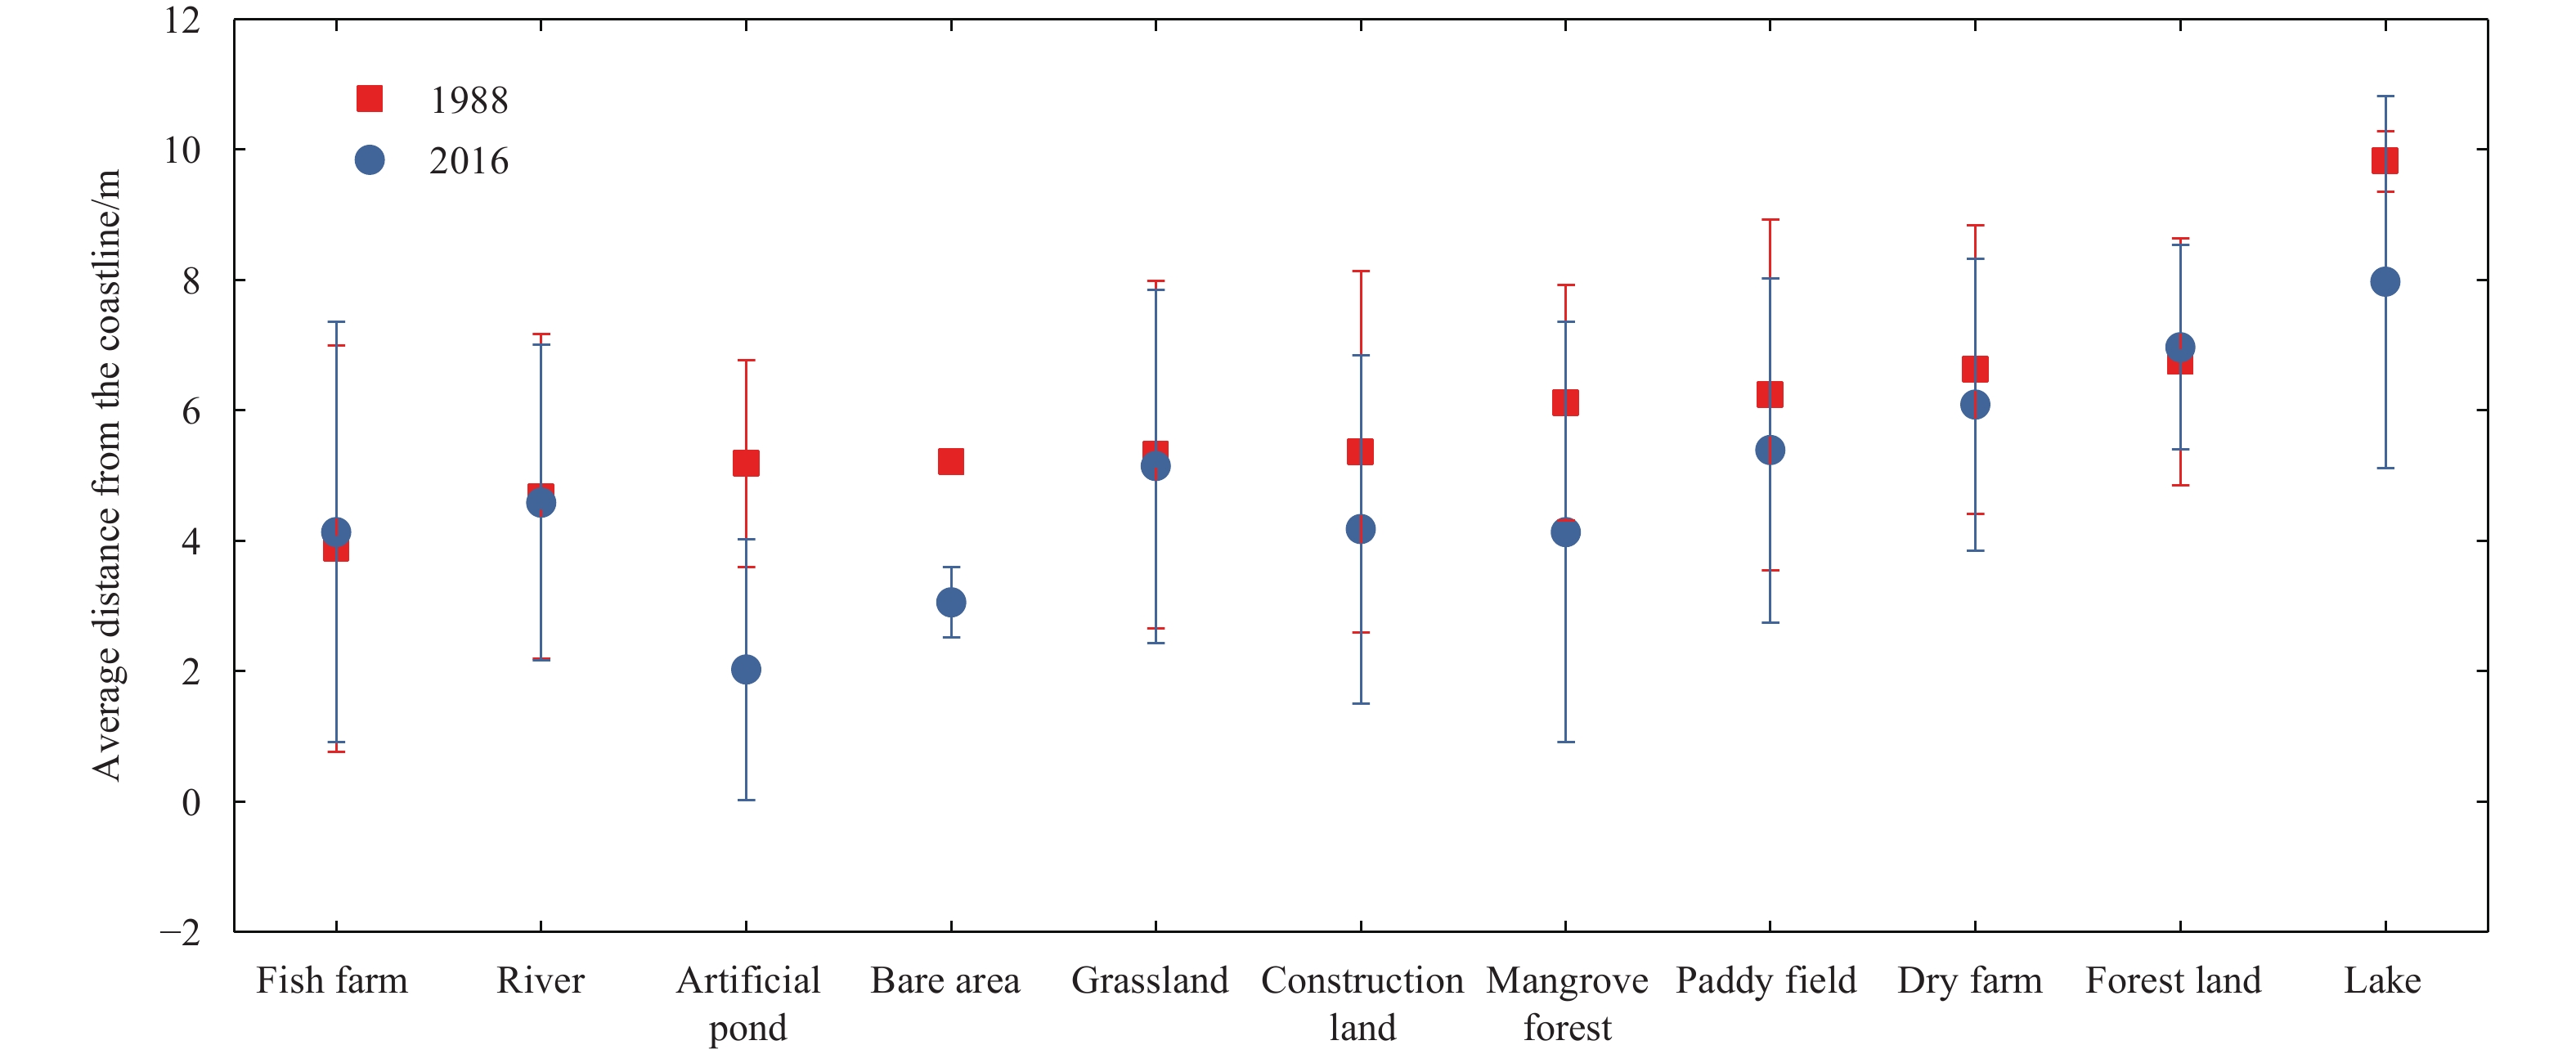
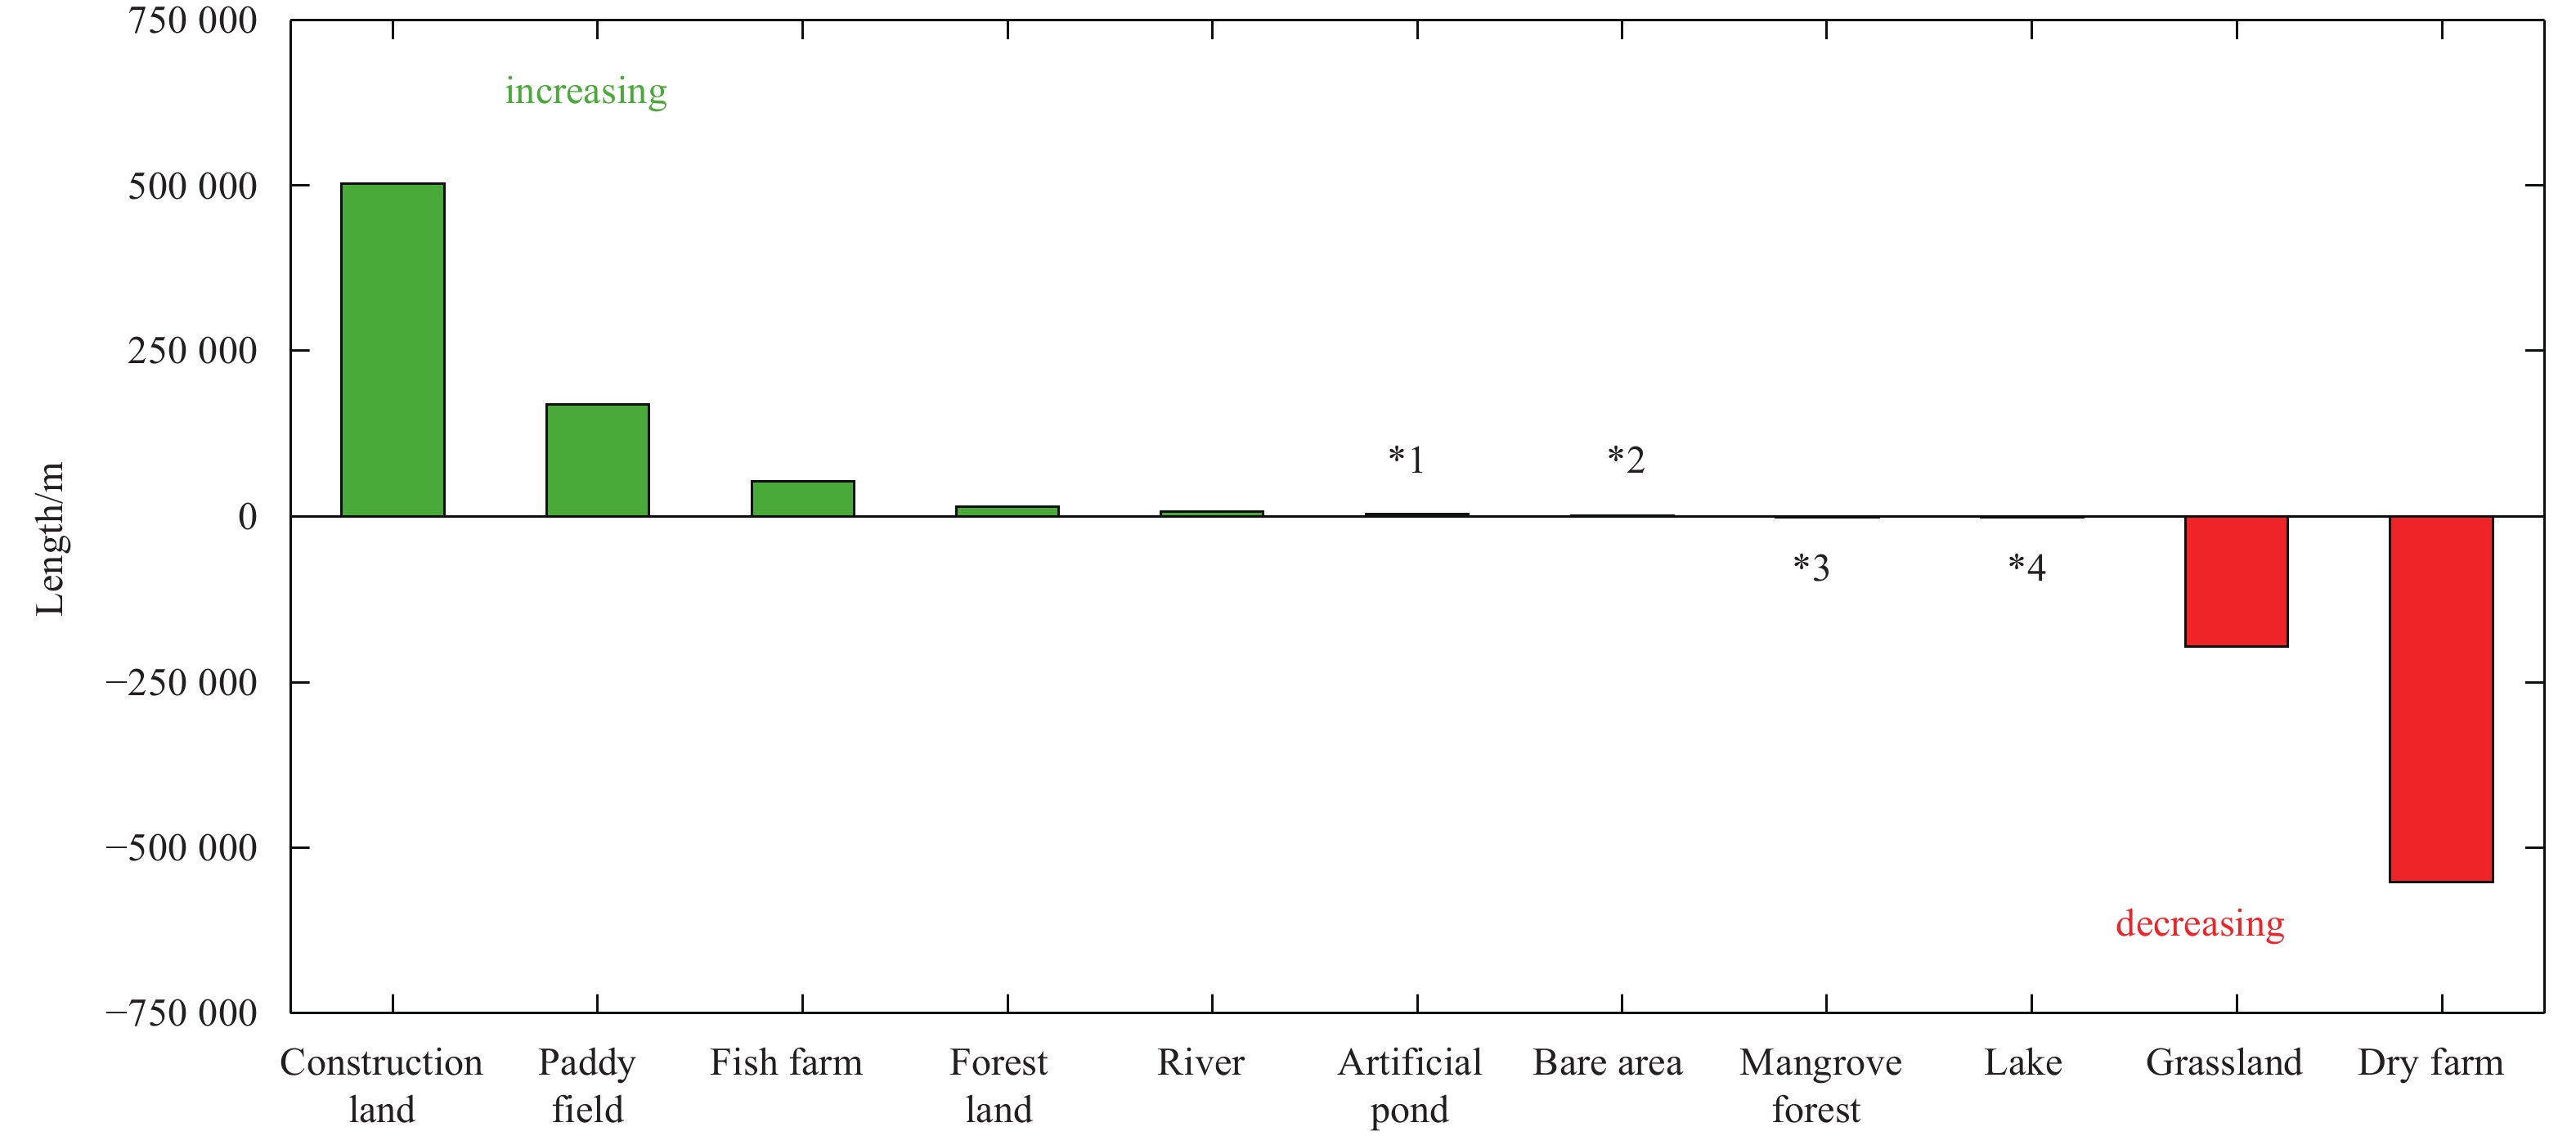
However, we also found that the distance and sequential locations of the LULCs had obvious changes from 1988 to 2016. Overall, the LULC types, except fish farm and forest land, showed a landward sprawling trend with a long distance from the coastline in 2016 (Fig. 10). Fish farm in the typical fishery CLUSP (Pattern 4 in 1988 and Pattern 3 in 2016) also showed a landward sprawling trend (Fig. 11). This phenomenon was largely due to the expansion of fish farm that increased by 4.28% from 1988 to 2016. A previous study also found that the aquaculture area increased by 400 hm2/a from 1976 to 2013 (Mialhe et al., 2016). The LULC change also had some correlations with the seaward sprawling trend of some LULC types in the CLUSP as discussed in the next section. In addition, we found that the land use intensity of the CLUSPs obviously increase from 1988 to 2016. Although the area percentage of total forest land greatly increased from 8.44% to 24.54%, the area percentage of the major artificial LULC types for the typical natural CLUSP (Pattern 1 in 1988 and 2016) and the artificial CLUSP (Pattern 2 in 1988 and 2016) still had an obvious increase from 3.14% to 16.80% and 79.04% to 89.49%, respectively. This phenomenon can be attributed to the urban expansion and agricultural reclamation that accounted for 89.45 % of the LULC increase and led to the decrease of mangrove forest and grassland (Fig. 12). This trend was also reported by previous studies (Garcia et al., 2014; Mialhe et al., 2016).

Urban expansion always causes the degradation of the ecosystem diversity and increases of land intensification in coastal areas (Shi et al., 2015; Nor et al., 2017; Ai et al., 2020; Moschetto et al., 2021). In this study, urban and aquaculture expansions were the major driving factors of the decrease in diversity of the CLUSPs and the enhanced land use intensification for the CLUSPs from 1988 to 2016 (Figs 7 and 12). On the one hand, more than 74% of the increased LULC coverage was contributed by construction land and fish farm, i.e., 67% for construction land. Nearly 74% of the increased construction land originated from dry farm and paddy field. The large urban expansion was also reported by previous studies (Dado and Narisma, 2022; Mishra et al., 2021), and the expansion might be attributed to the increase of population in this region (Dado and Narisma, 2022). Consequently, the agricultural CLUSP (Pattern 2 in 1988) and the artificial CLUSP dominated by construction land (Pattern 3 in 1988) were converted into an artificial CLUSP dominated by the multiple LULC types mentioned above. On the other hand, forest land had a small increase, and this increase was much less than the decrease of grassland. Finally, the land use intensification for both the natural and artificial CLUSPs showed an increasing trend from 1988 to 2016.
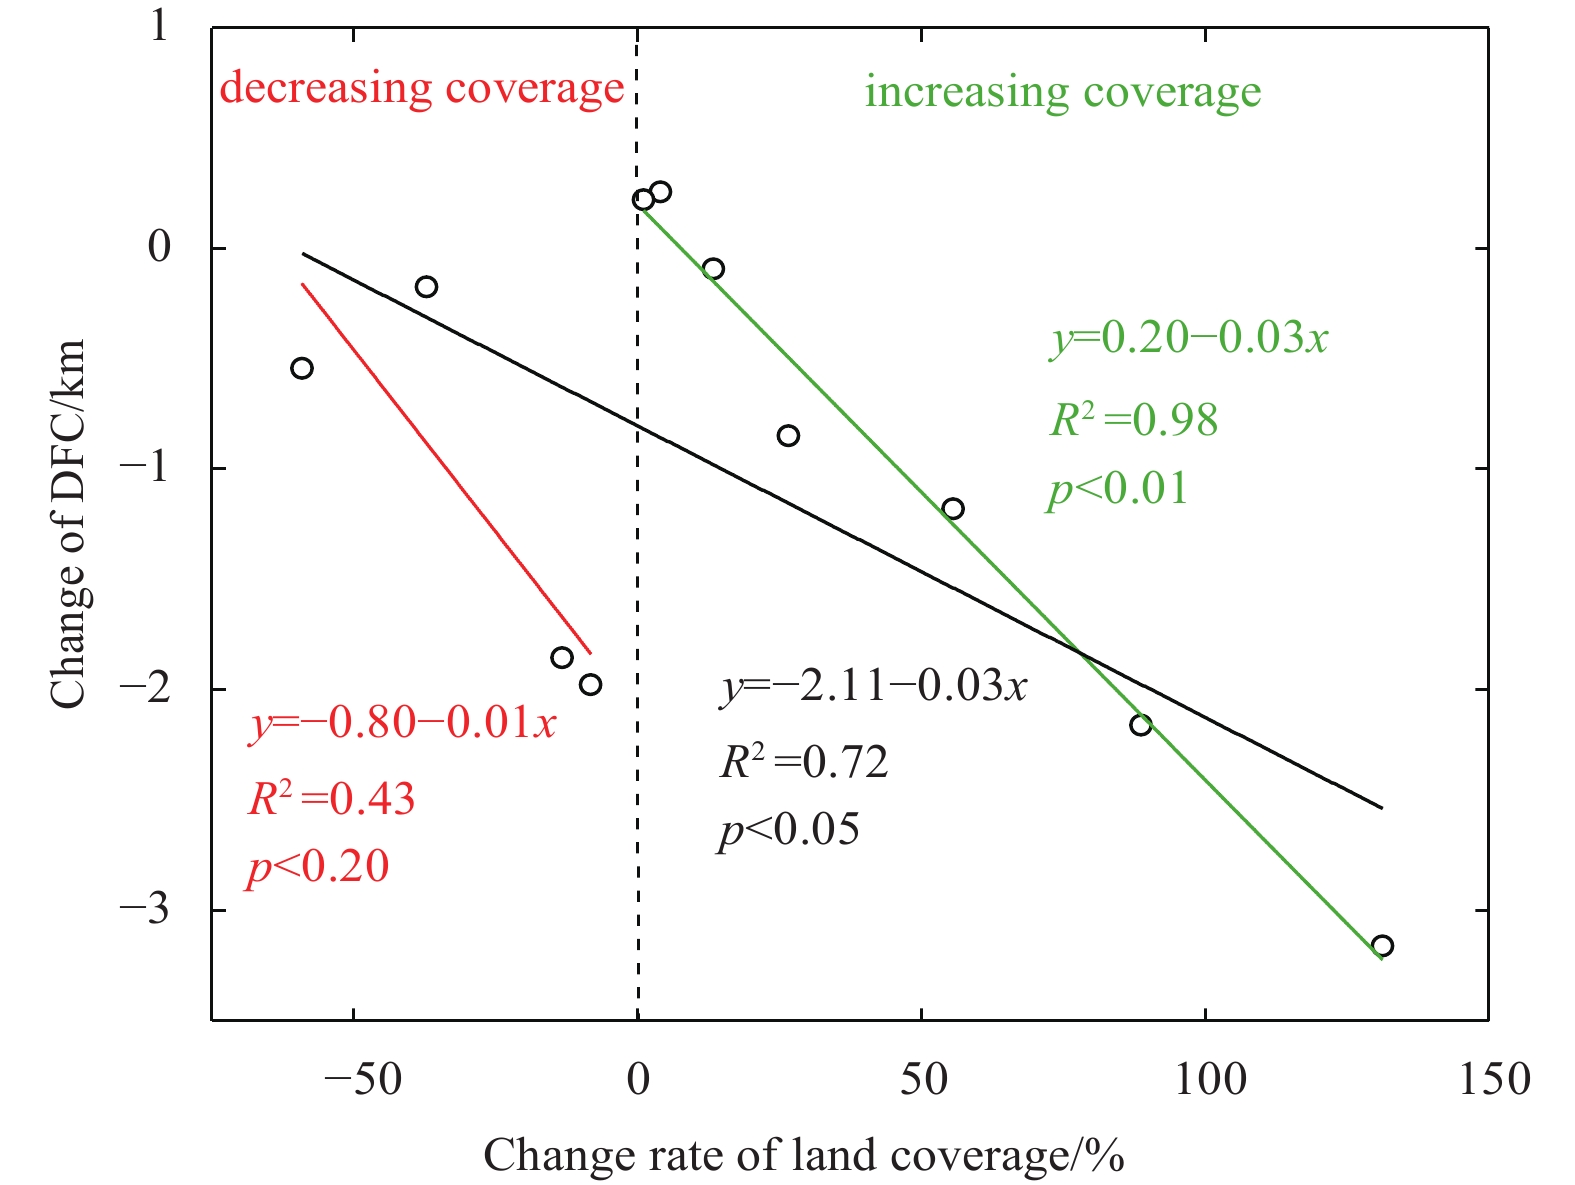
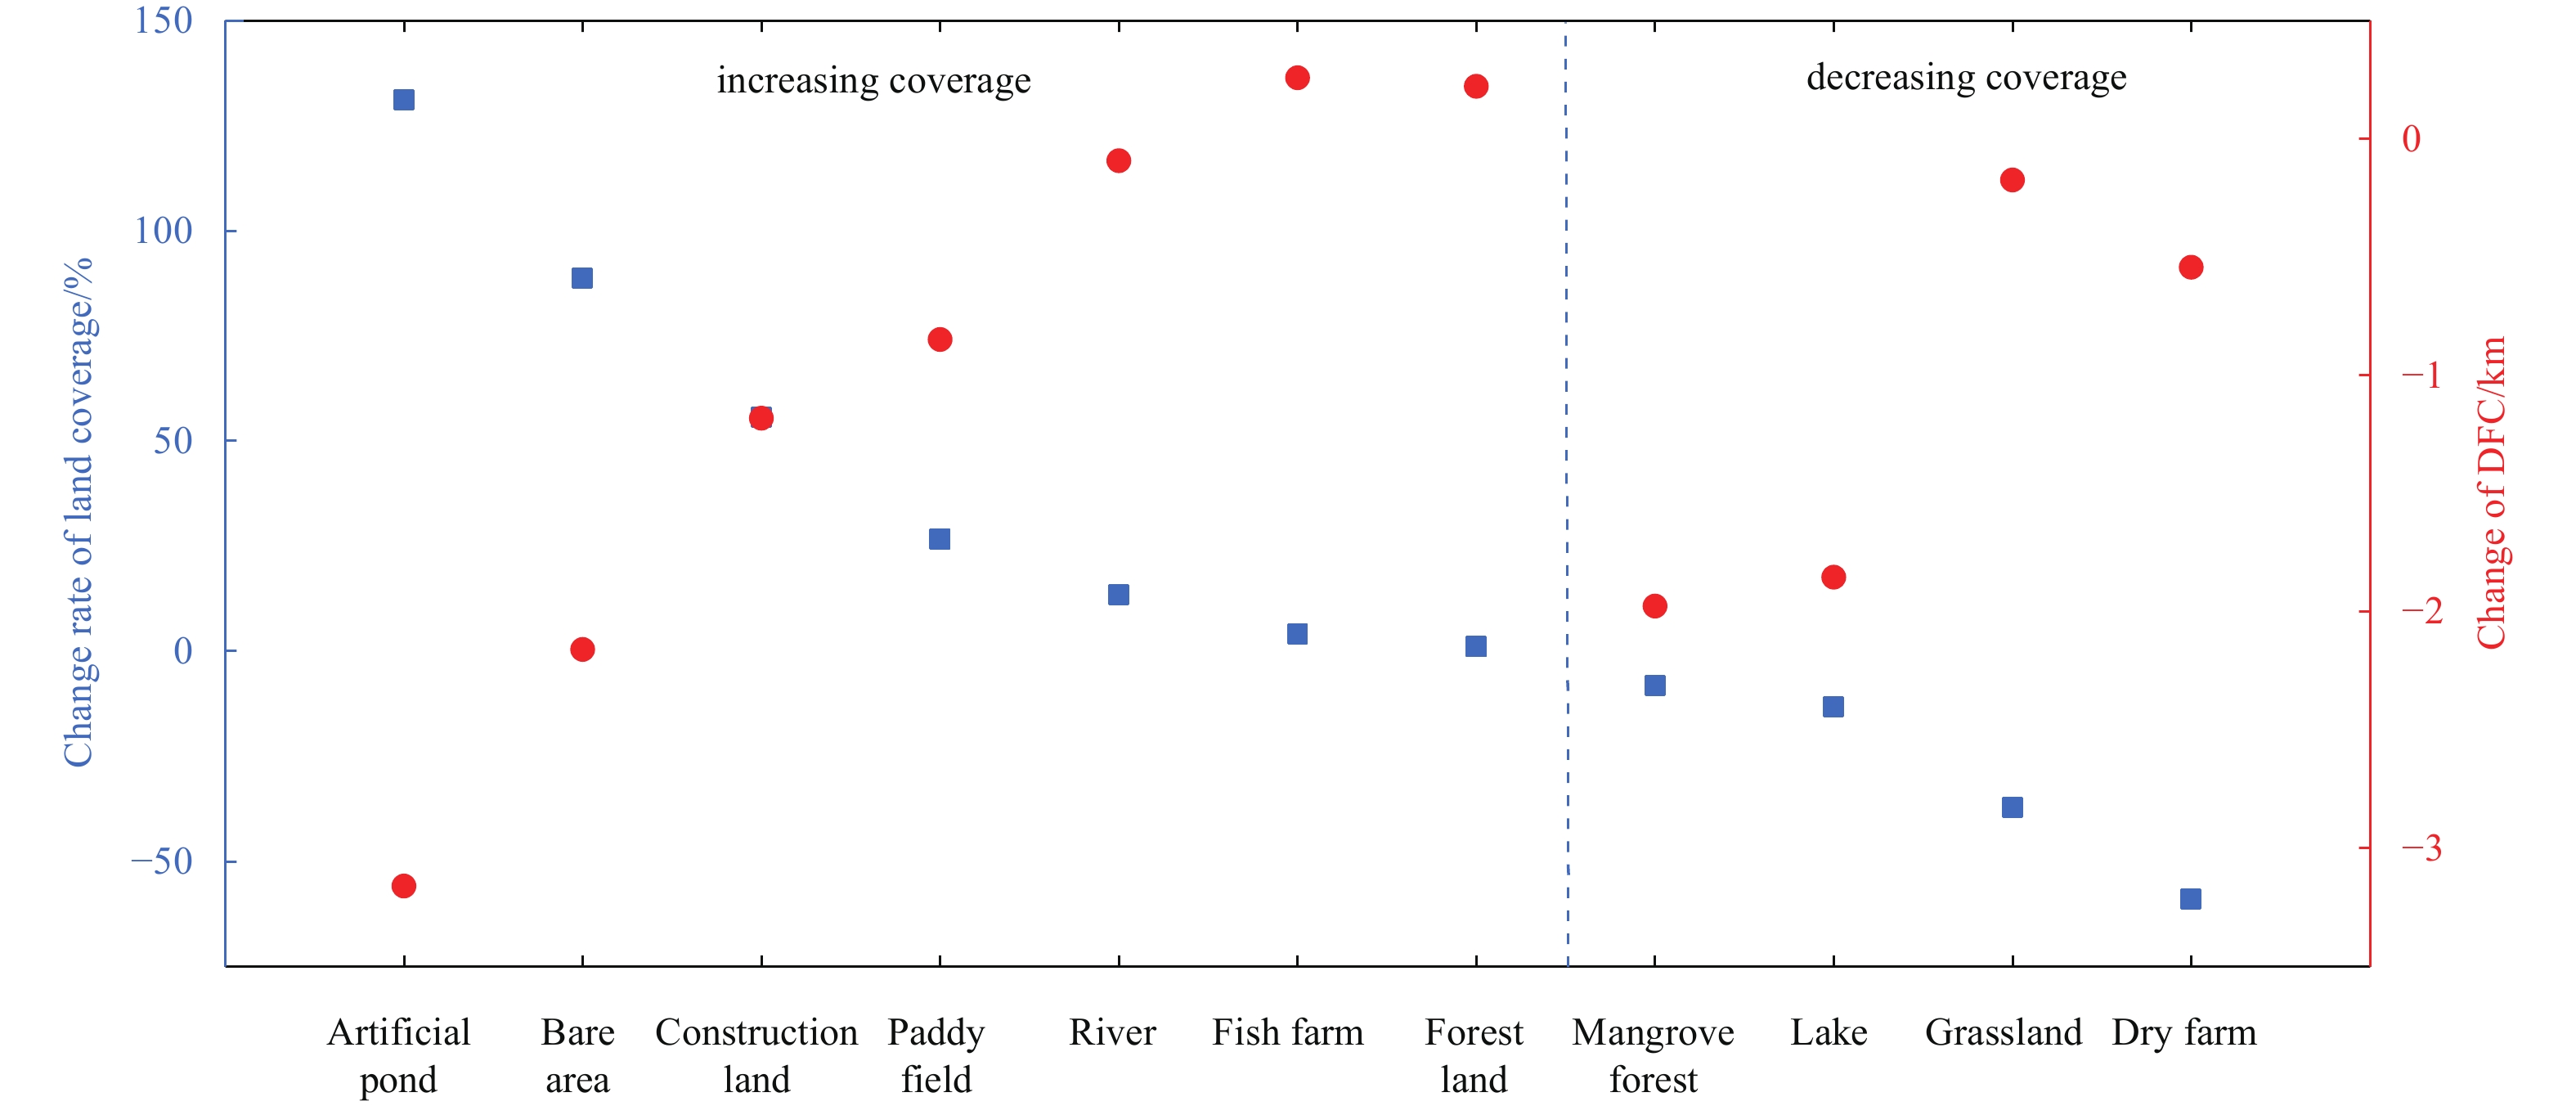
However, the increase in the area of LULC coverage did not have an obvious correlation with the distance from the coastline (DFC) in Manila Bay. However, the net change rate of LULC coverage had a close relationship with the DFC (Fig. 13). The location of the LULC with a high coverage increase rate showed a seaward sprawling trend, and that with a high decreasing rate of coverage showed an inland toward trend (Fig. 14). Therefore, the dynamics of CLUSPs might be largely due to the high increase or decrease rate of LULC areas. Some LULC types with a low coverage, such as mangrove forest and artificial pond, might have a large net change rate with a small area change and would largely affect the CLUSP along the sea–land direction. Thus, the buffering method that focuses on the major LULC in the subzone (Xin et al., 2010; Xu et al., 2012; Di et al., 2015) ignores some dynamics of the CLUSP along the sea–land direction. In addition, we found that the net change rate of the LULC with an increasing coverage had highly significant (p<0.01 and R2=0.98) negative correlations with the DFC (Fig. 13) in the Manila Bay. This significant correlation also indicates the large impact of human-induced activities on the seaward landscape.


In this study, we mined the typical CLUSPs on the basis of the distance gradient from the coastline in Manila Bay. We found that majority of the coastal LULCs were distributed around areas with a relative stable distance from the coastline. However, these stable areas changed along the coast (parallel to the coastline) and were clustered into typical CLUSPs, such as the natural CLUSP dominated by forest land and grassland for Pattern 1 in 1988 and 2016, and the fishery CLUSP dominated by fish farm for Pattern 4 in 1988. Affected by the dominant LULC, these typical CLUSPs showed a regular spatial pattern along the sea–land direction. For example, the typical natural CLUSP showed a landward pattern due to the long distance of forest land and grassland from the coastline. However, influenced by urban and aquaculture expansions, the land intensification of the CLUSP showed an obvious increase and caused the decrease of CLUSP diversity from 1988 to 2016. The increase of the area of LULC coverage did not have an obvious correlation with the DFC, but the net increase rate of the LULC coverage had a significantly negative correlation with the DFC. Therefore, human-induced activities have a large impact on the gradient pattern of coastal land use along the sea–land direction
Acknowledgements: We would like to thank all scientists who provided multisource data, namely, BESS GPP and MODIS GPP, CCI–LC products (v2.07) and precipitation and temperature map from the Data Centre for Resources and Environmental Sciences, Chinese Academy of Sciences.|
Ai Bin, Ma Chunlei, Zhao Jun, et al. 2020. The impact of rapid urban expansion on coastal mangroves: a case study in Guangdong Province, China. Frontiers of Earth Science, 14: 37–49. doi: 10.1007/s11707-019-0768-6
|
|
Al Abid F B. 2014. A novel approach for PAM clustering method. International Journal of Computer Applications, 86(17): 1–5. doi: 10.5120/15074-3039
|
|
Bindra K, Mishra A, Suryakant. 2019. Effective data clustering algorithms. In: Ray K, Sharma T K, Rawat S, et al., eds. Soft Computing: Theories and Applications. Singapore: Springer, 419–432
|
|
Cárdenas J A R, Torres G P. 2021. Geospatial data mining techniques survey. In: Oliva D, Houssein E H, Hinojosa S, eds. Metaheuristics in Machine Learning: Theory and Applications. Cham: Springer, 635–643
|
|
Chen Yewang, Hu Xiaoliang, Fan Wentao, et al. 2020. Fast density peak clustering for large scale data based on kNN. Knowledge-Based Systems, 187: 104824. doi: 10.1016/j.knosys.2019.06.032
|
|
Dado J M, Narisma G T. 2022. The effect of urban expansion in Metro Manila on the southwest monsoon rainfall. Asia-Pacific Journal of Atmospheric Sciences, 58(1): 1–12. doi: 10.1007/s13143-019-00140-x
|
|
Di Xianghong, Hou Xiyong, Wang Yuandong, et al. 2015. Spatial-temporal characteristics of land use intensity of coastal zone in China during 2000–2010. Chinese Geographical Science, 25(1): 51–61. doi: 10.1007/s11769-014-0707-0
|
|
Ding Zhi, Liao Xiaohan, Su Fenzhen, et al. 2017. Mining coastal land use sequential pattern and its land use associations based on association rule mining. Remote Sensing, 9(2): 116. doi: 10.3390/rs9020116
|
|
Ding Zhi, Su Fenzhen, Zhang Junjue, et al. 2019. Clustering coastal land use sequence patterns along the sea–land direction: a case study in the coastal zone of Bohai Bay and the Yellow River Delta, China. Remote Sensing, 11(17): 2024. doi: 10.3390/rs11172024
|
|
Disegna M, D’Urso P, Durante F. 2017. Copula-based fuzzy clustering of spatial time series. Spatial Statistics, 21: 209–225. doi: 10.1016/j.spasta.2017.07.002
|
|
Du Mingjing, Ding Shifei, Jia Hongjie. 2016. Study on density peaks clustering based on k-nearest neighbors and principal component analysis. Knowledge-Based Systems, 99: 135–145. doi: 10.1016/j.knosys.2016.02.001
|
|
Feng Yu, Sun Tao, Zhu Meisha, et al. 2018. Salt marsh vegetation distribution patterns along groundwater table and salinity gradients in Yellow River Estuary under the influence of land reclamation. Ecological Indicators, 92: 82–90. doi: 10.1016/j.ecolind.2017.09.027
|
|
Garcia K B, Malabrigo Jr P L, Gevaña D T. 2014. Philippines’ mangrove ecosystem: status, threats and conservation. In: Faridah-Hanum I, Latiff A, Hakeem K R, et al., eds. Mangrove Ecosystems of Asia. New York: Springer, 81–94
|
|
Grachev A A, Leo L S, Fernando H J S, et al. 2018. Air–sea/land interaction in the coastal zone. Boundary-Layer Meteorology, 167(2): 181–210. doi: 10.1007/s10546-017-0326-2
|
|
Hadley D. 2009. Land use and the coastal zone. Land Use Policy, 26 (Suppl 1): S198–S203
|
|
Hahus I, Migliaccio K, Douglas-Mankin K, et al. 2018. Using cluster analysis to compartmentalize a large managed wetland based on physical, biological, and climatic geospatial attributes. Environmental Management, 62(3): 571–583. doi: 10.1007/s00267-018-1050-5
|
|
Hirschberg D S. 1977. Algorithms for the longest common subsequence problem. Journal of the ACM, 24(4): 664–675. doi: 10.1145/322033.322044
|
|
Hou Xiyong, Xu Xinliang. 2011. Spatial patterns of land use in coastal zones of China in the early 21st century. Geographical Research (in Chinese), 30(8): 1370–1379
|
|
Hu Luojia, Li Wenyu, Xu Bing. 2018. Monitoring mangrove forest change in China from 1990 to 2015 using Landsat-derived spectral-temporal variability metrics. International Journal of Applied Earth Observation and Geoinformation, 73: 88–98. doi: 10.1016/j.jag.2018.04.001
|
|
Hu Wenjia, Wang Yuyu, Zhang Dian, et al. 2020. Mapping the potential of mangrove forest restoration based on species distribution models: A case study in China. Science of The Total Environment, 748: 142321. doi: 10.1016/j.scitotenv.2020.142321
|
|
Huang Baoying, Li Zhijian, Dong Chengcheng, et al. 2021. The effects of urbanization on vegetation conditions in coastal zone of China. Progress in Physical Geography: Earth and Environment, 45(4): 564–579. doi: 10.1177/0309133320979501
|
|
Huang Chong, Zhang Chenchen, Liu Qingsheng, et al. 2020. Land reclamation and risk assessment in the coastal zone of China from 2000 to 2010. Regional Studies in Marine Science, 39: 101422. doi: 10.1016/j.rsma.2020.101422
|
|
Islam M M, Shamsuddoha M. 2018. Coastal and marine conservation strategy for Bangladesh in the context of achieving blue growth and sustainable development goals (SDGs). Environmental Science & Policy, 87: 45–54
|
|
Kumar P, Wasan S K. 2011. Comparative study of k-means, pam and rough k-means algorithms using cancer datasets. In: Proceedings of CSIT: 2009 International Symposium on Computing, Communication, and Control (ISCCC 2009). Singapore: IACSIT Press, 136–140
|
|
Li Huiying, Man Weidong, Li Xiaoyan, et al. 2017. Remote sensing investigation of anthropogenic land cover expansion in the low-elevation coastal zone of Liaoning Province, China. Ocean & Coastal Management, 148: 245–259
|
|
Li Qian, Yu Yang, Jiang Xiaoqian, et al. 2019. Multifactor-based environmental risk assessment for sustainable land-use planning in Shenzhen, China. Science of The Total Environment, 657: 1051–1063. doi: 10.1016/j.scitotenv.2018.12.118
|
|
Li Yuan, Zhang Haibo, Li Qingbo, et al. 2016. Characteristics of residual organochlorine pesticides in soils under different land-use types on a coastal plain of the Yellow River Delta. Environmental Geochemistry and Health, 38(2): 535–547. doi: 10.1007/s10653-015-9738-4
|
|
Liu Yubin, Hou Xiyong, Li Xiaowei, et al. 2020. Assessing and predicting changes in ecosystem service values based on land use/cover change in the Bohai Rim coastal zone. Ecological Indicators, 111: 106004. doi: 10.1016/j.ecolind.2019.106004
|
|
Marani M, Da Lio C, D’Alpaos A. 2013. Vegetation engineers marsh morphology through multiple competing stable states. Proceedings of the National Academy of Sciences of the United States of America, 110(9): 3259–3263. doi: 10.1073/pnas.1218327110
|
|
Martinez M L, Silva R, Lithgow D, et al. 2017. Human impact on coastal resilience along the coast of Veracruz, Mexico. Journal of Coastal Research, 77(sp1): 143–153
|
|
Mialhe F, Gunnell Y, Mering C, et al. 2016. The development of aquaculture on the northern coast of Manila Bay (Philippines): an analysis of long-term land-use changes and their causes. Journal of Land Use Science, 11(2): 236–256. doi: 10.1080/1747423X.2015.1057245
|
|
Mishra B K, Mebeelo K, Chakraborty S, et al. 2021. Implications of urban expansion on land use and land cover: towards sustainable development of Mega Manila, Philippines. GeoJournal, 86(2): 927–942. doi: 10.1007/s10708-019-10105-2
|
|
Moschetto F A, Ribeiro R B, De Freitas D M. 2021. Urban expansion, regeneration and socioenvironmental vulnerability in a mangrove ecosystem at the southeast coastal of São Paulo, Brazil. Ocean & Coastal Management, 200: 105418
|
|
Nor A N M, Corstanje R, Harris J A, et al. 2017. Impact of rapid urban expansion on green space structure. Ecological Indicators, 81: 274–284. doi: 10.1016/j.ecolind.2017.05.031
|
|
Politi E, Paterson S K, Scarrott R, et al. 2019. Earth observation applications for coastal sustainability: potential and challenges for implementation. Anthropocene Coasts, 2(1): 306–329. doi: 10.1139/anc-2018-0015
|
|
Ray G C. 1991. Coastal-zone biodiversity patterns. BioScience, 41(7): 490–498. doi: 10.2307/1311807
|
|
Ray G C, Hayden B P. 1992. Coastal zone ecotones. In: Hansen A J, Castri F, eds. Landscape Boundaries. New York: Springer, 403–420
|
|
Rodriguez A, Laio A. 2014. Clustering by fast search and find of density peaks. Science, 344(6191): 1492–1496. doi: 10.1126/science.1242072
|
|
Sajjad M, Li Yangfan, Tang Zhenghong, et al. 2018. Assessing hazard vulnerability, habitat conservation, and restoration for the enhancement of mainland China’s coastal resilience. Earth’s Future, 6(3): 326–338. doi: 10.1002/2017EF000676
|
|
Sheik M, Chandrasekar N. 2011. A shoreline change analysis along the coast between Kanyakumari and Tuticorin, India, using digital shoreline analysis system. Geo-spatial Information Science, 14(4): 282–293. doi: 10.1007/s11806-011-0551-7
|
|
Shi Lifeng, Liu Fang, Zhang Zengxiang, et al. 2015. Spatial differences of coastal urban expansion in China from 1970s to 2013. Chinese Geographical Science, 25(4): 389–403. doi: 10.1007/s11769-015-0765-y
|
|
Tseng Kuo-Tseng, Chan De-Sheng, Yang Chang-Biau, et al. 2018. Efficient merged longest common subsequence algorithms for similar sequences. Theoretical Computer Science, 708: 75–90. doi: 10.1016/j.tcs.2017.10.027
|
|
Vallejo Jr B M, Aloy A B, Ocampo M, et al. 2019. Manila bay ecology and associated invasive species. In: Makowski C, Finkl C W, eds. Impacts of Invasive Species on Coastal Environments. Cham: Springer, 145–169
|
|
Wang Wenyue, Zhang Junjue, Su Fenzhen. 2018. An index-based spatial evaluation model of exploitative intensity: A case study of coastal zone in Vietnam. Journal of Geographical Sciences, 28(3): 291–305. doi: 10.1007/s11442-018-1473-1
|
|
Xin Pei, Gibbes B, Li Ling, et al. 2010. Soil saturation index of salt marshes subjected to spring-neap tides: A new variable for describing marsh soil aeration condition. Hydrological Processes, 24(18): 2564–2577. doi: 10.1002/hyp.7670
|
|
Xu Xiao, Ding Shifei, Shi Zhongzhi. 2018. An improved density peaks clustering algorithm with fast finding cluster centers. Knowledge-Based Systems, 158: 65–74. doi: 10.1016/j.knosys.2018.05.034
|
|
Xu Yan, Pu Lijie, Zhang Runsen, et al. 2012. Spatial-temporal dynamics of land use and land cover change in the coastal zone of Jiangsu Province. Resources and Environment in the Yangtze Basin (in Chinese), 21(5): 565–571
|
|
Xu Dongkuan, Tian Yingjie. 2015. A comprehensive survey of clustering algorithms. Annals of Data Science, 2(2): 165–193. doi: 10.1007/s40745-015-0040-1
|
|
Zhang Feng, Sun Xiao, Zhou Yan, et al. 2017. Ecosystem health assessment in coastal waters by considering spatio-temporal variations with intense anthropogenic disturbance. Environmental Modelling & Software, 96: 128–139
|
|
Zhou Yunkai, Ning Lixin, Bai Xiuling. 2018. Spatial and temporal changes of human disturbances and their effects on landscape patterns in the Jiangsu coastal zone, China. Ecological Indicators, 93: 111–122. doi: 10.1016/j.ecolind.2018.04.076
|

Figures(14)

Supported by:
Beijing Renhe Information Technology Co. Ltd

Zhi Ding, Fenzhen Su, Yanan Chen, Ying Liu, Xue Feng, Wenqiu Hu, Fengqin Yan, He Li, Pujia Yu, Xuguang Tang. Whether human-induced activities could change the gradient pattern of coastal land use along the sea-land direction: a case study in Manila Bay, Philippines[J]. Acta Oceanologica Sinica, 2023, 42(2): 163-174. doi: 10.1007/s13131-022-2026-0

 DownLoad:


 DownLoad: