Ruijie Ye, Feng Zhou, Xiao Ma, Dingyong Zeng, Feilong Lin, Hongliang Li, Chenggang Liu, Soe Moe Lwin, Hlaing Swe Win, Soe Pyae Aung. Observed characteristics of flow, water mass, and turbulent mixing in the Preparis Channel[J]. Acta Oceanologica Sinica, 2023, 42(2): 83-93. doi: 10.1007/s13131-022-2021-5
Citation:
Ruijie Ye, Feng Zhou, Xiao Ma, Dingyong Zeng, Feilong Lin, Hongliang Li, Chenggang Liu, Soe Moe Lwin, Hlaing Swe Win, Soe Pyae Aung. Observed characteristics of flow, water mass, and turbulent mixing in the Preparis Channel[J]. Acta Oceanologica Sinica, 2023, 42(2): 83-93. doi: 10.1007/s13131-022-2021-5
Ruijie Ye, Feng Zhou, Xiao Ma, Dingyong Zeng, Feilong Lin, Hongliang Li, Chenggang Liu, Soe Moe Lwin, Hlaing Swe Win, Soe Pyae Aung. Observed characteristics of flow, water mass, and turbulent mixing in the Preparis Channel[J]. Acta Oceanologica Sinica, 2023, 42(2): 83-93. doi: 10.1007/s13131-022-2021-5
Citation:
Ruijie Ye, Feng Zhou, Xiao Ma, Dingyong Zeng, Feilong Lin, Hongliang Li, Chenggang Liu, Soe Moe Lwin, Hlaing Swe Win, Soe Pyae Aung. Observed characteristics of flow, water mass, and turbulent mixing in the Preparis Channel[J]. Acta Oceanologica Sinica, 2023, 42(2): 83-93. doi: 10.1007/s13131-022-2021-5
National Analytical Laboratory Department of Research Innovation, Ministry of Education, Yangon 11061, Myanmar
5.
Port and Harbour Engineering Department, Myanmar Maritime University, Yangon 11293, Myanmar
Funds:
The Global Change and Air-Sea Interaction II Project under contract Nos GASI-01-EIND-STwin and GASI-04-WLHY-03; the Scientific Research Fund of the Second Institute of Oceanography, Ministry of Natural Resources under contract No. JB2106; the Global Change and Air-Sea Interaction II Project under contract No. GASI-04-WLHY-01; the Leading Talents of Science and Technology Innovation in the Zhejiang Provincial Ten Thousand Talents Program under contract No. 2020R52038; the Oceanic Sustainability-Based Marine Science and Technology Cooperation in Maritime Silk Road and Island Countries.
Preparis Channel is the very important exchange path of energy and materials between the northern Bay of Bengal and Andaman Sea (AS). A set of hydrographic measurements, a microstructure profiler, and a deep mooring were used to determine the characteristics of water masses, turbulent mixing, and flows in the Preparis Channel. The unprecedented short-term mooring data reveal that a deep current in the deep narrow passage (below 400 m) of the Preparis Channel flows toward the Bay of Bengal (BoB) with a mean along-stream velocity of 25.26 cm/s at depth of 540 m; above the deep current, there are a relatively weak current flows toward the AS with a mean along-stream velocity of 15.46 cm/s between 500 m and 520 m, and another weak current flows toward the BoB between 430 m and 500 m. Thus, a sandwiched vertical structure of deep currents (below 400 m) is present in the Preparis Channel. The volume transport below 400 m is 0.06 Sv (1 Sv = 106 m3/s) from the AS to the BoB. In the upper layer (shallower than 300 m), the sea water of the AS is relatively warmer and fresher than that in the BoB, indicating a strong exchange through the channel. Microstructure profiler observations reveal that the turbulent diffusivity in the upper layer of the Preparis Channel reaches O(10−4 m2/s), one order larger than that in the interior of the BoB and over the continental slope of the northern AS. We speculate that energetic high-mode internal tides in the Preparis Channel contribute to elevated turbulent mixing. In addition, a local “hotspot” of turbidity is identified at the deep mooring site, at depth of about 100 m, which corresponds to the location of elevated turbulent mixing in the Preparis Channel.
The Andaman Sea (AS) is a semi-enclosed marginal sea located in the northeastern part of the tropical Indian Ocean, and is connected to the Bay of Bengal (BoB) through three major channels: the Preparis Channel, the Ten Degree Channel, and the Great Channel (Fig. 1a). Previous studies revealed that equatorial signals induced by wind forcing in the equatorial Indian Ocean could enter the AS through the Great Channel and exit via the Preparis Channel, and subsequently radiate free Rossby waves into the BoB, which exert strong effect on the interior circulation in the BoB (Cheng et al., 2013; Chatterjee et al., 2017). In addition, backward eddy tracking in the BoB suggested that most of eddies (especially at 15°N) originated in the vicinity of the Preparis Channel, and strong subsurface current was also found to flow into the BoB through the Preparis Channel in a well-validated model (Jithin and Francis, 2021). A high-resolution model suggested that the Preparis Channel is the main passage of water mass transport between the BoB and the AS with strong seasonality in the transport direction and magnitude (Liao et al., 2020). Earlier model and observations also revealed that a subsurface intensified eddy occurred just west of the South Preparis Channel with the max speed at 140 m and led to anomalies in salinity and oxygen, which all were probably caused by a jet flowing out of the AS through the channel (Hacker et al., 1998).
Figure
1.
Location of in situ observation measurements and bathymetric map of the Preparis Channel. a. Bottom topography of the Bay of Bengal and Andaman Sea from the global bathymetry data with 1′ resolution (Smith and Sandwell, 1997); the black box indicates the study area. b. Bottom topography of the Preparis Channel; the red star marks the deep mooring, brown filled circles indicate the CTD/LADCP stations, and black dots denoting VMP stations; Sections 1 and 2 (cyan curves) are defined to evaluate the spatial distributions of water mass in the Preparis Channel. c. Expanded view of the bottom topography of the deep mooring station in the Preparis Channel; the dashed black line indicates the section topography displayed in Fig. 4b; the orange contour represents the 400-m isobath, and the magenta contour is the 600-m isobath.
Water mass in the AS is significantly different from that in the BoB, indicating a strong exchange between them. Previously, many studies focused on the water properties of the AS (Ramesh Bahu and Sastry, 1976; Varkey et al., 1996), and significant differences in water mass properties between the AS and BoB have been noted (Sen Gupta et al., 1981; Sarma and Narvekar, 2001). Below ~1 800 m, the AS is an isolated basin, and the deep water there is well mixed and warmer (approximately 1–2℃) than that in the BoB due to enhanced turbulent mixing in the deep AS (Jithin and Francis, 2020; Liao et al., 2020; Peng et al., 2021). Based on model simulations, Liao et al. (2020) pointed out that water mass is transported from the BoB to the AS through the Preparis Channel at a shallow depth of about 250 m, whereas water mass transport from the AS to the BoB exists in the Ten Degree Channel with a maximum depth of approximately 800 m; in the Great Channel with a maximum depth of approximately 1 800 m, a four-layer water exchange exists between the BoB and AS. The water properties of the AS are affected by the water transport through the three major channels, and diluted by the fresh water from the Irrawaddy, Brahmaputra, and Ganga rivers in the north (Robinson et al., 2007; Furuichi et al., 2009; Chandran et al., 2018; Liu et al., 2020). The Preparis Channel is also thought to be the internal tides source, compared to the other channels (Jithin et al., 2020). However, due to the complexity of topography, direct measurements of water exchange between the AS and BoB through three major channels are still extremely limited.
As the main passage of water exchange between the BoB and AS, the Preparis Channel plays a significant role in modulating the regional circulation of the AS and redistributing water mass and sediment in the northern AS (Awasthi et al., 2014). Preivous studies revealed that shoaling internal waves could resuspend the bottom sediment (Tian et al., 2019) and spread the suspended sediment into the interior portion of the channel, and elevated turbulent mixing could accelerate the spreading of bottom sediment (Wain and Rehmann, 2010). Therefore, exploration of characteristics of flow and water mass in the Preparis Channel can help us not only understand the water exchange between the AS and BoB, but also further investigate the modulation mechanism of interior circulation in the BoB. However, very few in situ observations of the flow and water mass in the Preparis Channel have been reported, and previous studies were mainly based on model simulations and concentrated on the flow shallower than 300 m (Rizal et al., 2012; Liao et al., 2020).
Recently, an international cooperation cruise, named the “Joint Advanced Marine and Ecological Studies (JAMES)”, was conducted in the Bay of Bengal and eastern equatorial Indian Ocean during December 2019 to February 2020 (Hu et al., 2022); and systematic observations, including hydrographic measurements, microstructure profiler observations, and near-bottom mooring measurements, were obtained jointly by scientists from China and Myanmar in the Preparis Channel to clarify its water properties, deep flow structure, and turbulent mixing (Fig. 1b). The deep flow below 400 m in the Preparis Channel revealed in this study can provide us knowledge of vertical structure of flow in the Preparis Channel; and the spatial structure of the water mass in the upper layer explored in this study provides us knowledge of the sources of water masses in the Preparis Channel, both of which can help us better simulate the regional circulation in the Preparis Channel in the future.
2.
Field experiment
A short-term deep mooring (denoted as PC based on location) positioned in the Preparis Channel (14.58°N, 93.53°E) was deployed for three days from 5:00 am on February 18 to 10:00 am on February 21, 2020 (Fig. 1c). The deep mooring was instrumented with a SBE 37-SM conductivity-temperature-depth (CTD) recorder (Sea-Bird Electronics, Bellevue, WA, USA), an upward-looking 300-kHz Workhorse Sentinel acoustic Doppler current profiler (ADCP) (Teledyne RD Instruments, San Diego, CA, USA), and a single-point Seaguard recording current meter (RCM) (Aanderaa Instruments, Bergen, Norway). Mean deployed depths of CTD, ADCP, and RCM were estimated as 500 m, 530 m, and 540 m, respectively. The accuracy of the velocity measurements was 0.15 cm/s for the current meters, and 0.5% S ± 0.5 cm/s for the ADCP (S is the water velocity). The accuracy of the CTD was 0.002℃ for temperature, 0.003 mS/cm for conductivity, and 0.1% of the full-scale range for pressure (which was 7 m for the CTD used in this experiment). The sampling time interval of the RCM was 1 h, and that of the ADCP and CTD was 0.5 h.
In addition, a total of 29 hydrographic stations were sampled along two sections (Section 1 and Section 2) across the Preparis Channel (Fig. 1b). The instruments involved were a shipboard SBE 911-plus CTD instrument and a Teledyne RD Instruments 300-kHz lowered ADCP (LADCP). A free-fall vertical microstructure profiler (VMP; Rockland Scientific International Inc., Victoria, British Columbia, Canada) was cast 10 times to acquire profiling measurements of the microscale velocity shear and temperature in the Preparis Channel (Fig. 1b). These microscale observations were carried out using a tethered free-falling instrument (VMP-500) equipped with two shear probes that sampled shear at 1 024 Hz and obtained data down to 450 m. Considering possible contamination by surface waves and ship wakes, the top 10 m of each turbulent mixing dissipation rate profile is discarded.
3.
Results
3.1
Temporal variability of deep flow below 400 m
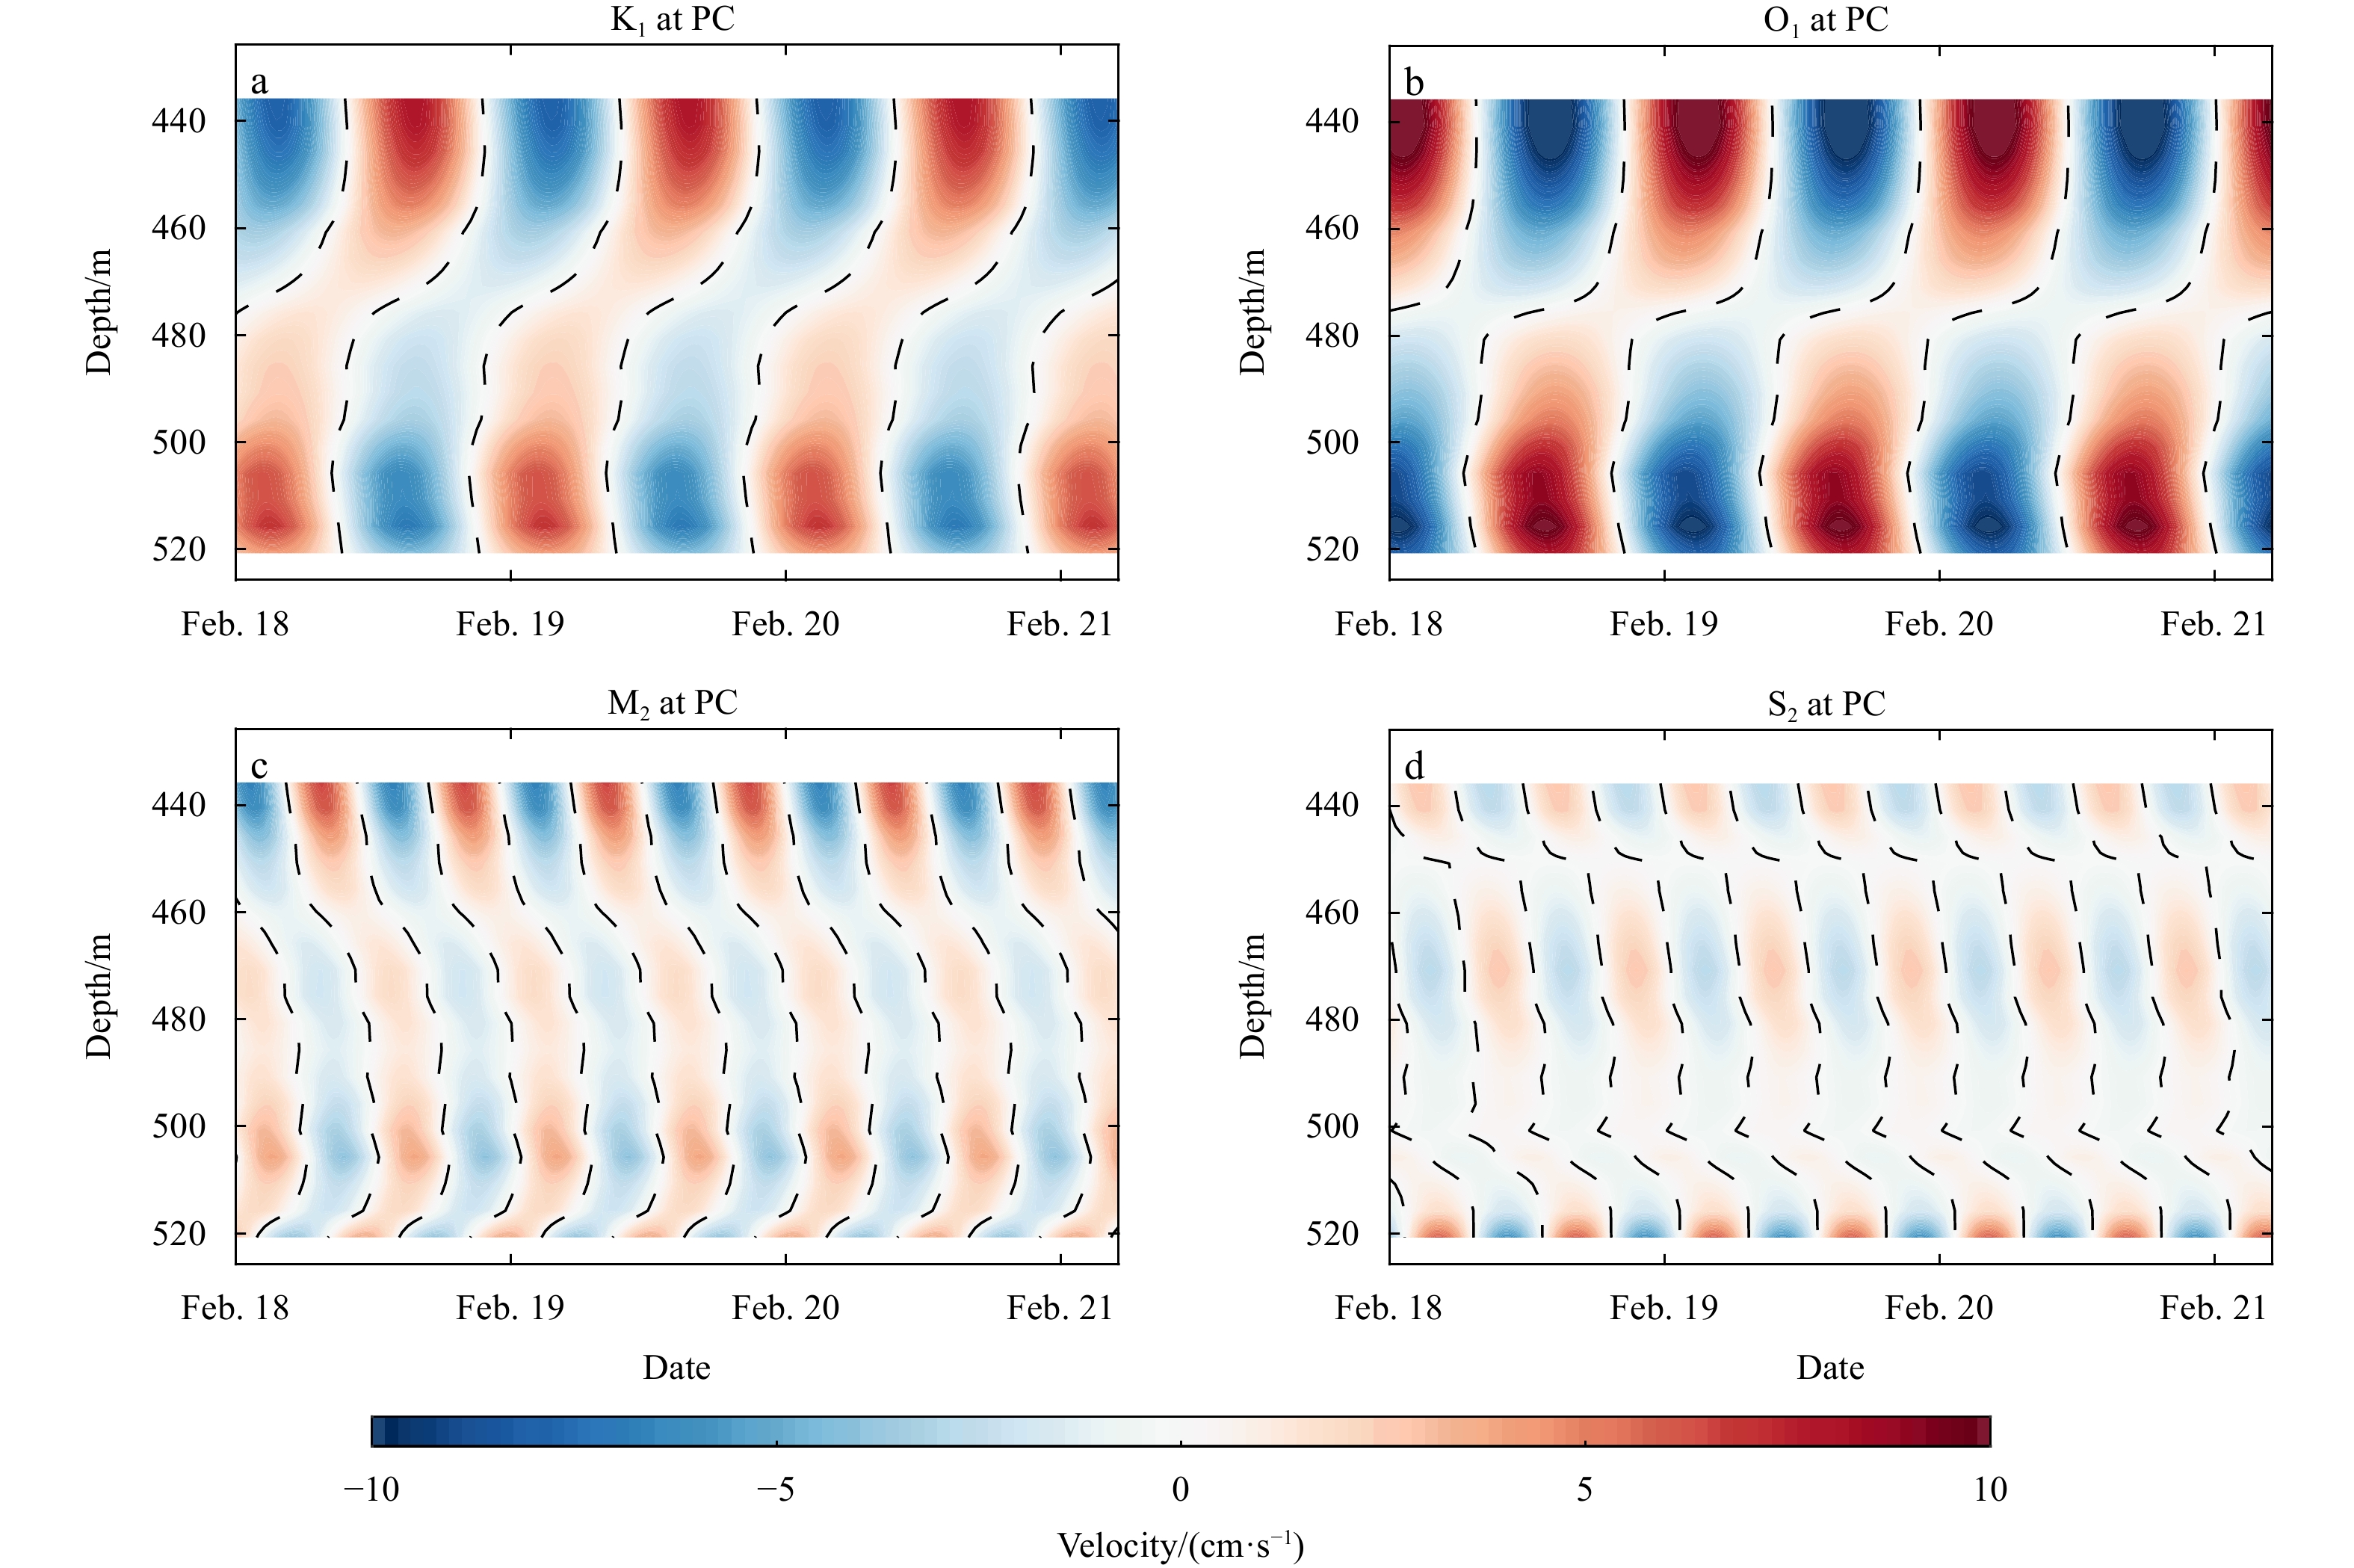
First, the raw velocity time series acquired from the upward-looking ADCP at PC exhibited significant tidal signals. Semidiurnal and diurnal tidal signals were extracted by harmonic analysis based on the approach of Godin (1972) (Fig. 2). The maximum magnitude of diurnal tidal signals is about 18.39 cm/s, and that of semidiurnal tidal signals is approximately 14.90 cm/s. Comparatively, the diurnal internal tides are stronger than the semidiurnal internal tides at PC, and the diurnal internal tide O1 is the largest tidal constituent in the deep narrow passage (below 400 m) of the Preparis Channel. In addition, both diurnal and semidiurnal internal tides at the mooring location show significant vertical high-mode structures (Fig. 2).
Figure
2.
Diurnal internal tides K1 (a) and O1 (b) and semidiurnal internal tides M2 (c) and S2 (d) measured by the moored upward-looking 300-kHz ADCP. The dashed line indicates zero velocity.
To illustrate the vertical structure of the deep current in the Preparis Channel, we decomposed the horizontal velocity into along-stream component and cross-stream component based on the zonal and meridional components of the velocity, with maximum magnitude monitored by the RCM and estimated along-stream direction being 76.2° counterclockwise from the north (reference coordinate of redecomposition is displayed in Fig. 3d). Notably, the along-stream and cross-stream velocities obtained by the upward-looking 300-kHz ADCP at PC display significant temporal variability (Figs 3a, b), and a persistent flow toward the BoB exists between approximately 440 m and 500 m (Fig. 3a). In addition, the time series of velocities monitored by the deep RCM at 540 m indicate that the along-stream velocities dominate the cross-stream velocities (Fig. 3c), and that the mean velocity vector reflects a strong deep flow at PC, directing toward the BoB with a mean velocity of 25.26 cm/s (Fig. 3d).
Figure
3.
Detided along-stream (a) and cross-stream (b) velocities acquired by the moored upward-looking 300-kHz ADCP. The dashed line indicates zero velocity, and the reference coordinate of redecomposition is indicated in d; c. detided along-stream (red line) and cross-stream (black line) velocities acquired by the deepest instrument recording current meter (RCM); d. mean detided velocity vector obtained by the RCM, where the orange contour represents the 400-m isobaths, and the purple contour is the 600-m isobath.
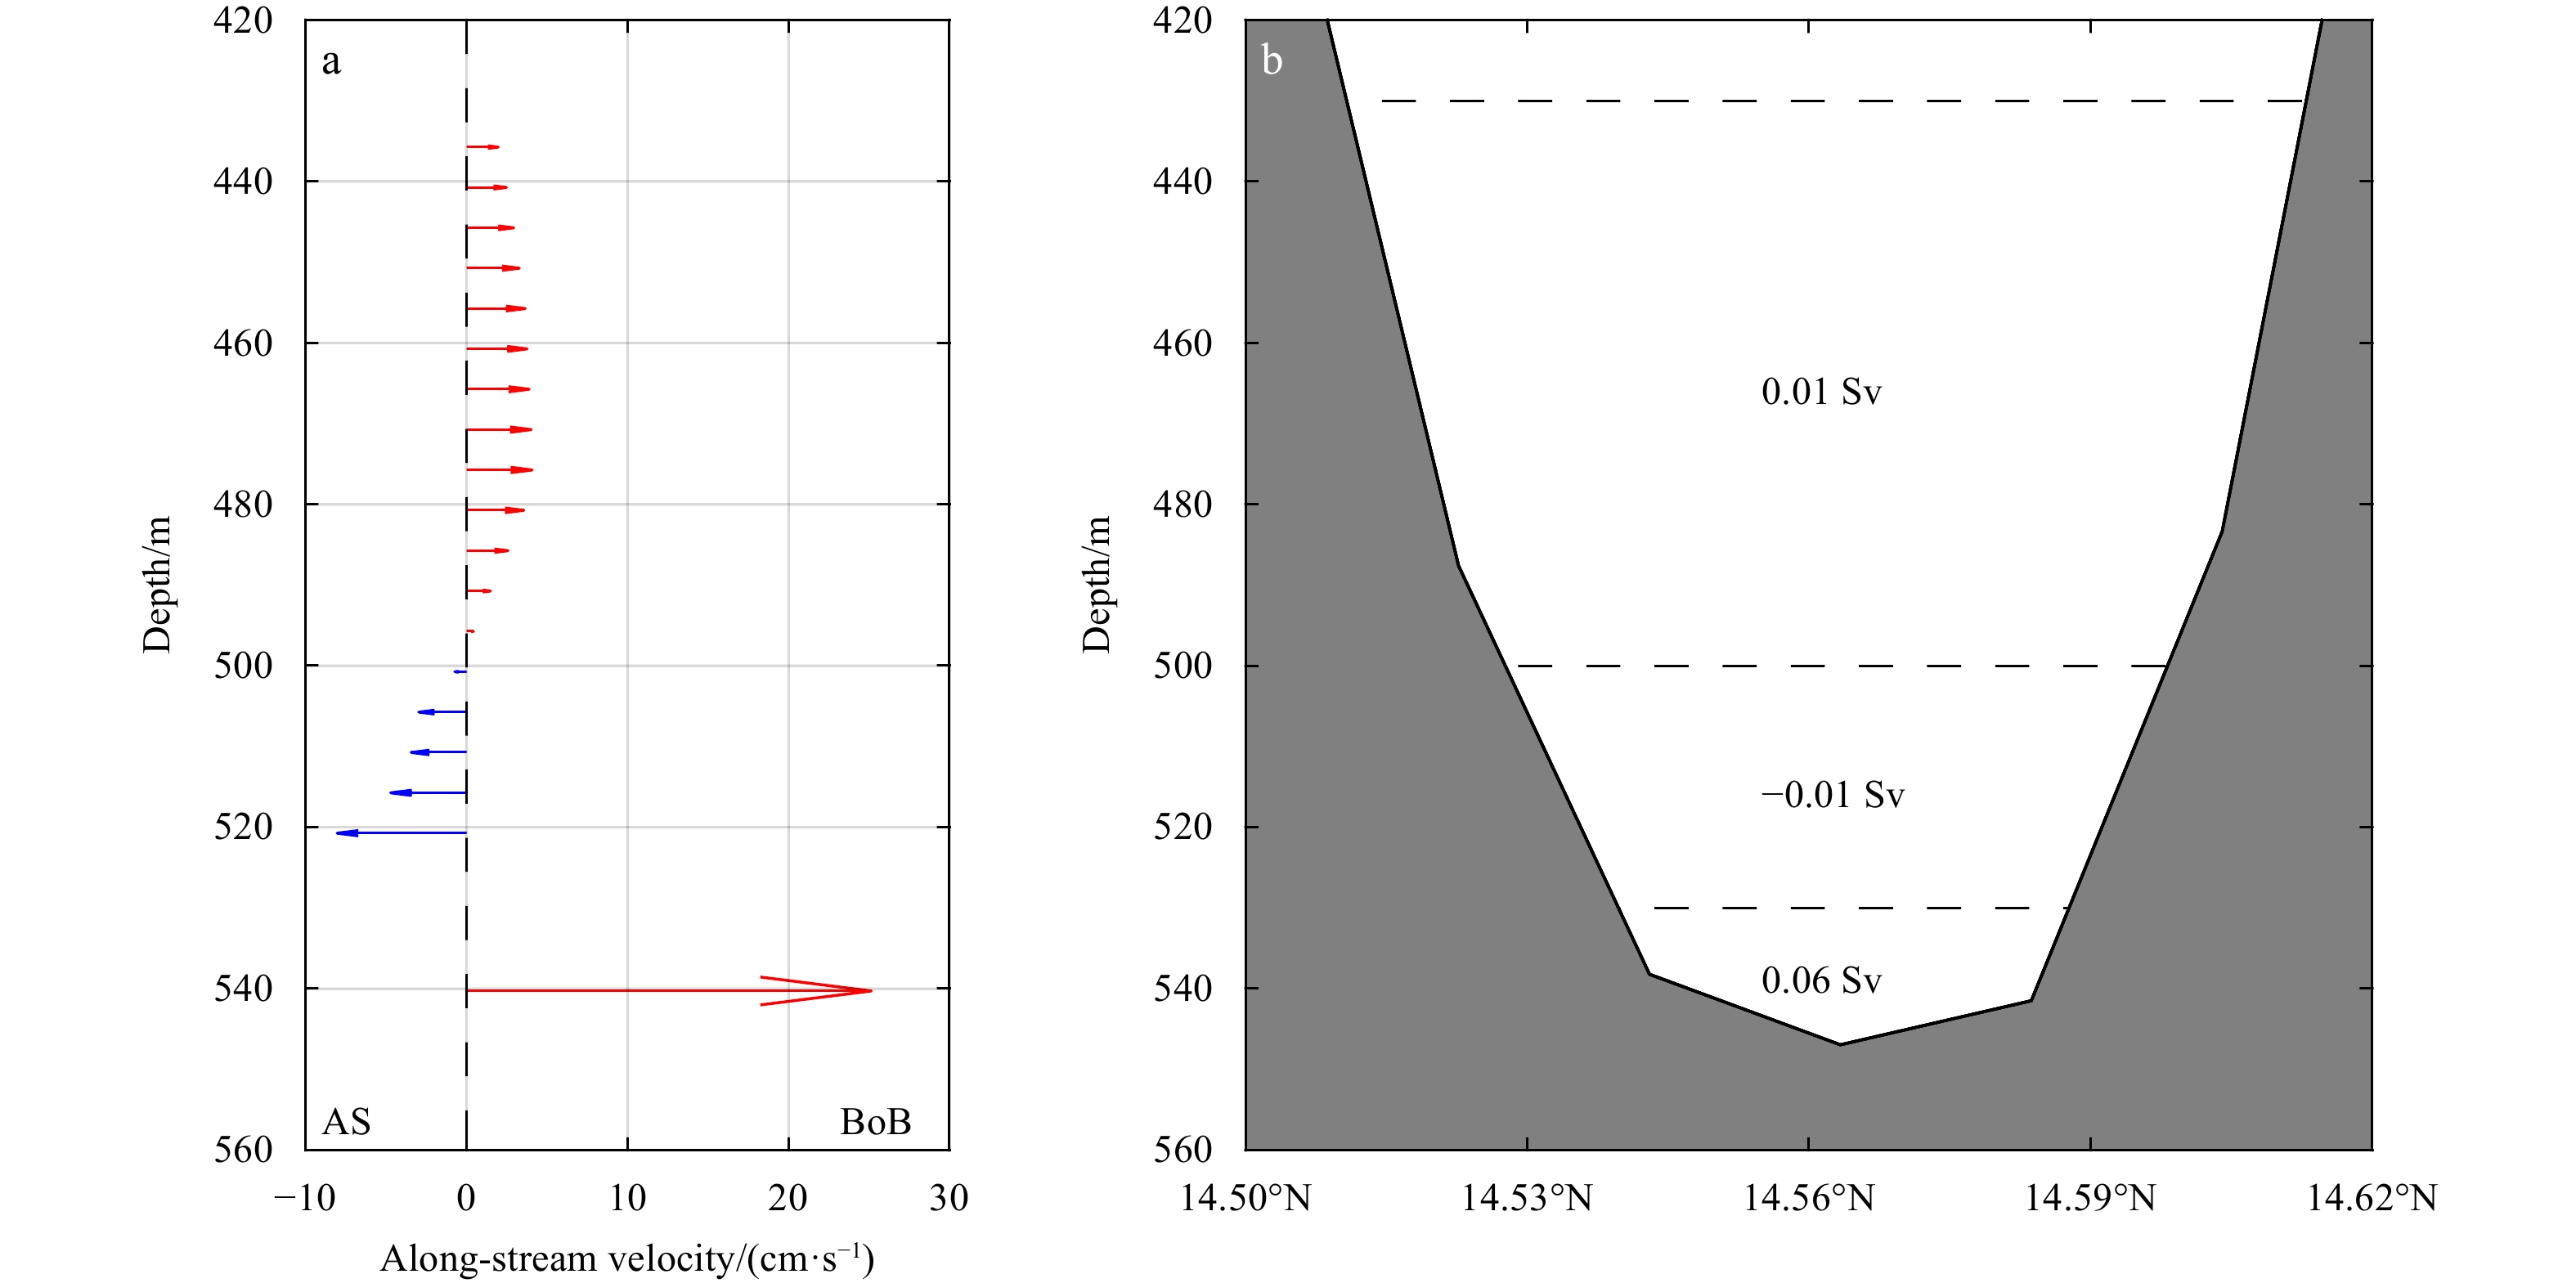
Based on the redecomposition of the current velocity, the vertical structure of the deep current at PC was obtained (Fig. 4a). Notably, below 400 m, a sandwich structure exists for the deep current in the Preparis Channel, with a relatively weak flow toward the BoB between 430 m and 500 m, a flow toward the AS between 500 m and 520 m, and a strong flow toward the BoB at 540 m. Considering the vertical structure of the deep current in the Preparis Channel (Fig. 4a), we take the depth of 430 m as the upper boundary of the deep current in the channel to estimate the volume transport of the deep current. In the ocean, estimates of volume transport through a channel depend on the flow structure across the channel (Sprintall et al., 2012; Wang et al., 2021). In an ideal situation, horizontal high-resolution velocity profiles can give more accurate estimate of volume transport. When based on an individual profile, horizontal interpolation is necessary. In this study, we linearly interpolated the along-stream velocity profile vertically with an interval of 5 m, and then applied a cubic spline interpolation horizontally with the assumption of zero velocity at the two sidewalls. Similar interpolation method was utilized previously to estimate the volume transport of deep flow through the Luzon Strait based on individual velocity profiles (Zhao et al., 2014; Zhou et al., 2014; Ye et al., 2019). Zhao et al. (2016) confirmed that the interpolation based on individual velocity profile can fit well with the horizontal structure of deep current when the local Rossby radius is larger than the width of the channel. Based on the 1′-resolution global bathymetric data (Smith and Sandwell, 1997), we calculated the width of the deep narrow passage of the Preparis Channel at the depth of 430 m as 11.5 km and local Rossby radius at the deep mooring site as 53.4 km based on the formula in Qu et al. (2006). With local Rossby radius larger than the width of the deep narrow passage in the Preparis Channel, we believe that it is reasonable to estimate the volume transport of the current below 400 m in the Preparis Channel based on the interpolation method. Based on the bathymetry of Smith and Sandwell (1997), with cross-section topography displayed in Fig. 4b, the mean volume transport of the current below 400 m is estimated to be 0.06 Sv (1 Sv = 106 m3/s) from the AS to the BoB (Fig. 4b). However, whether the volume transport of the deep current in the Preparis Chanel has seasonal variability remains unknown. Previously, based on the simulation of a high-resolution model, Liao et al. (2020) suggested that water mass transport through the Preparis Channel experiences seasonal variability, with a net transport of 1.45 Sv in July and −0.05 Sv in October. Due to the fact that circulations in the northern AS are dominated by monsoons (Rodolfo, 1969, 1975; Liao et al., 2020; Liu et al., 2020), further investigations are required to determine if the volume transport through the deep narrow passage of the Preparis Channel has seasonal variation.
Figure
4.
Vertical profiles of the mean detided along-stream velocity vector in the Prepari Channel; the red arrows indicate the flow toward the BoB, and the blue arrows show the flow toward the AS (a); section of topography extracted along the dashed black line in Fig. 1c, based on the 1′-resolution global bathymetric data (Smith and Sandwell, 1997); the numbers are the estimated volume transports, and the horizontal dashed black lines indicate the boundaries of the transport layers (b).
The two sections of hydrographic measurements in the Preparis Channel (see Fig. 1b for locations) were used to evaluate the water properties in the channel. Figure 5 shows the vertical distribution of the water mass at Section 1. The depth of the thermocline becomes shallower toward the continental slope of the AS (Fig. 5a), and nearly flat contours of potential density in the BoB between 100 m and 300 m curves toward the steep continental shelf of the AS; this change might be associated with the large-scale background current. Additionally, a warm “tongue” with temperature greater than 26.20℃ appears between 50 m and 100 m (Fig. 5a). A low-salinity region with salinity less than 32.10 exists in the upper layer over the steep continental slope at Section 1 between 93.0°E and 93.5°E (Fig. 5b), which may be associated with the freshwater input from the Irrawaddy River. High dissolved oxygen (DO) concentrations mainly exist in the upper layer, and the thickness of the high DO concentration decreases from the BoB to the AS (Fig. 5c). Over the continental slope at Section 1, the turbidity increases toward the bottom (Fig. 5d).
Figure
5.
Vertical sections of potential temperature (a), salinity (b), dissolved oxygen concentration (c), and turbidity (d) along Section 1 shown in Fig. 1b. The solid black contours indicate potential density, and green triangles with vertical dashed lines denote CTD profiles.
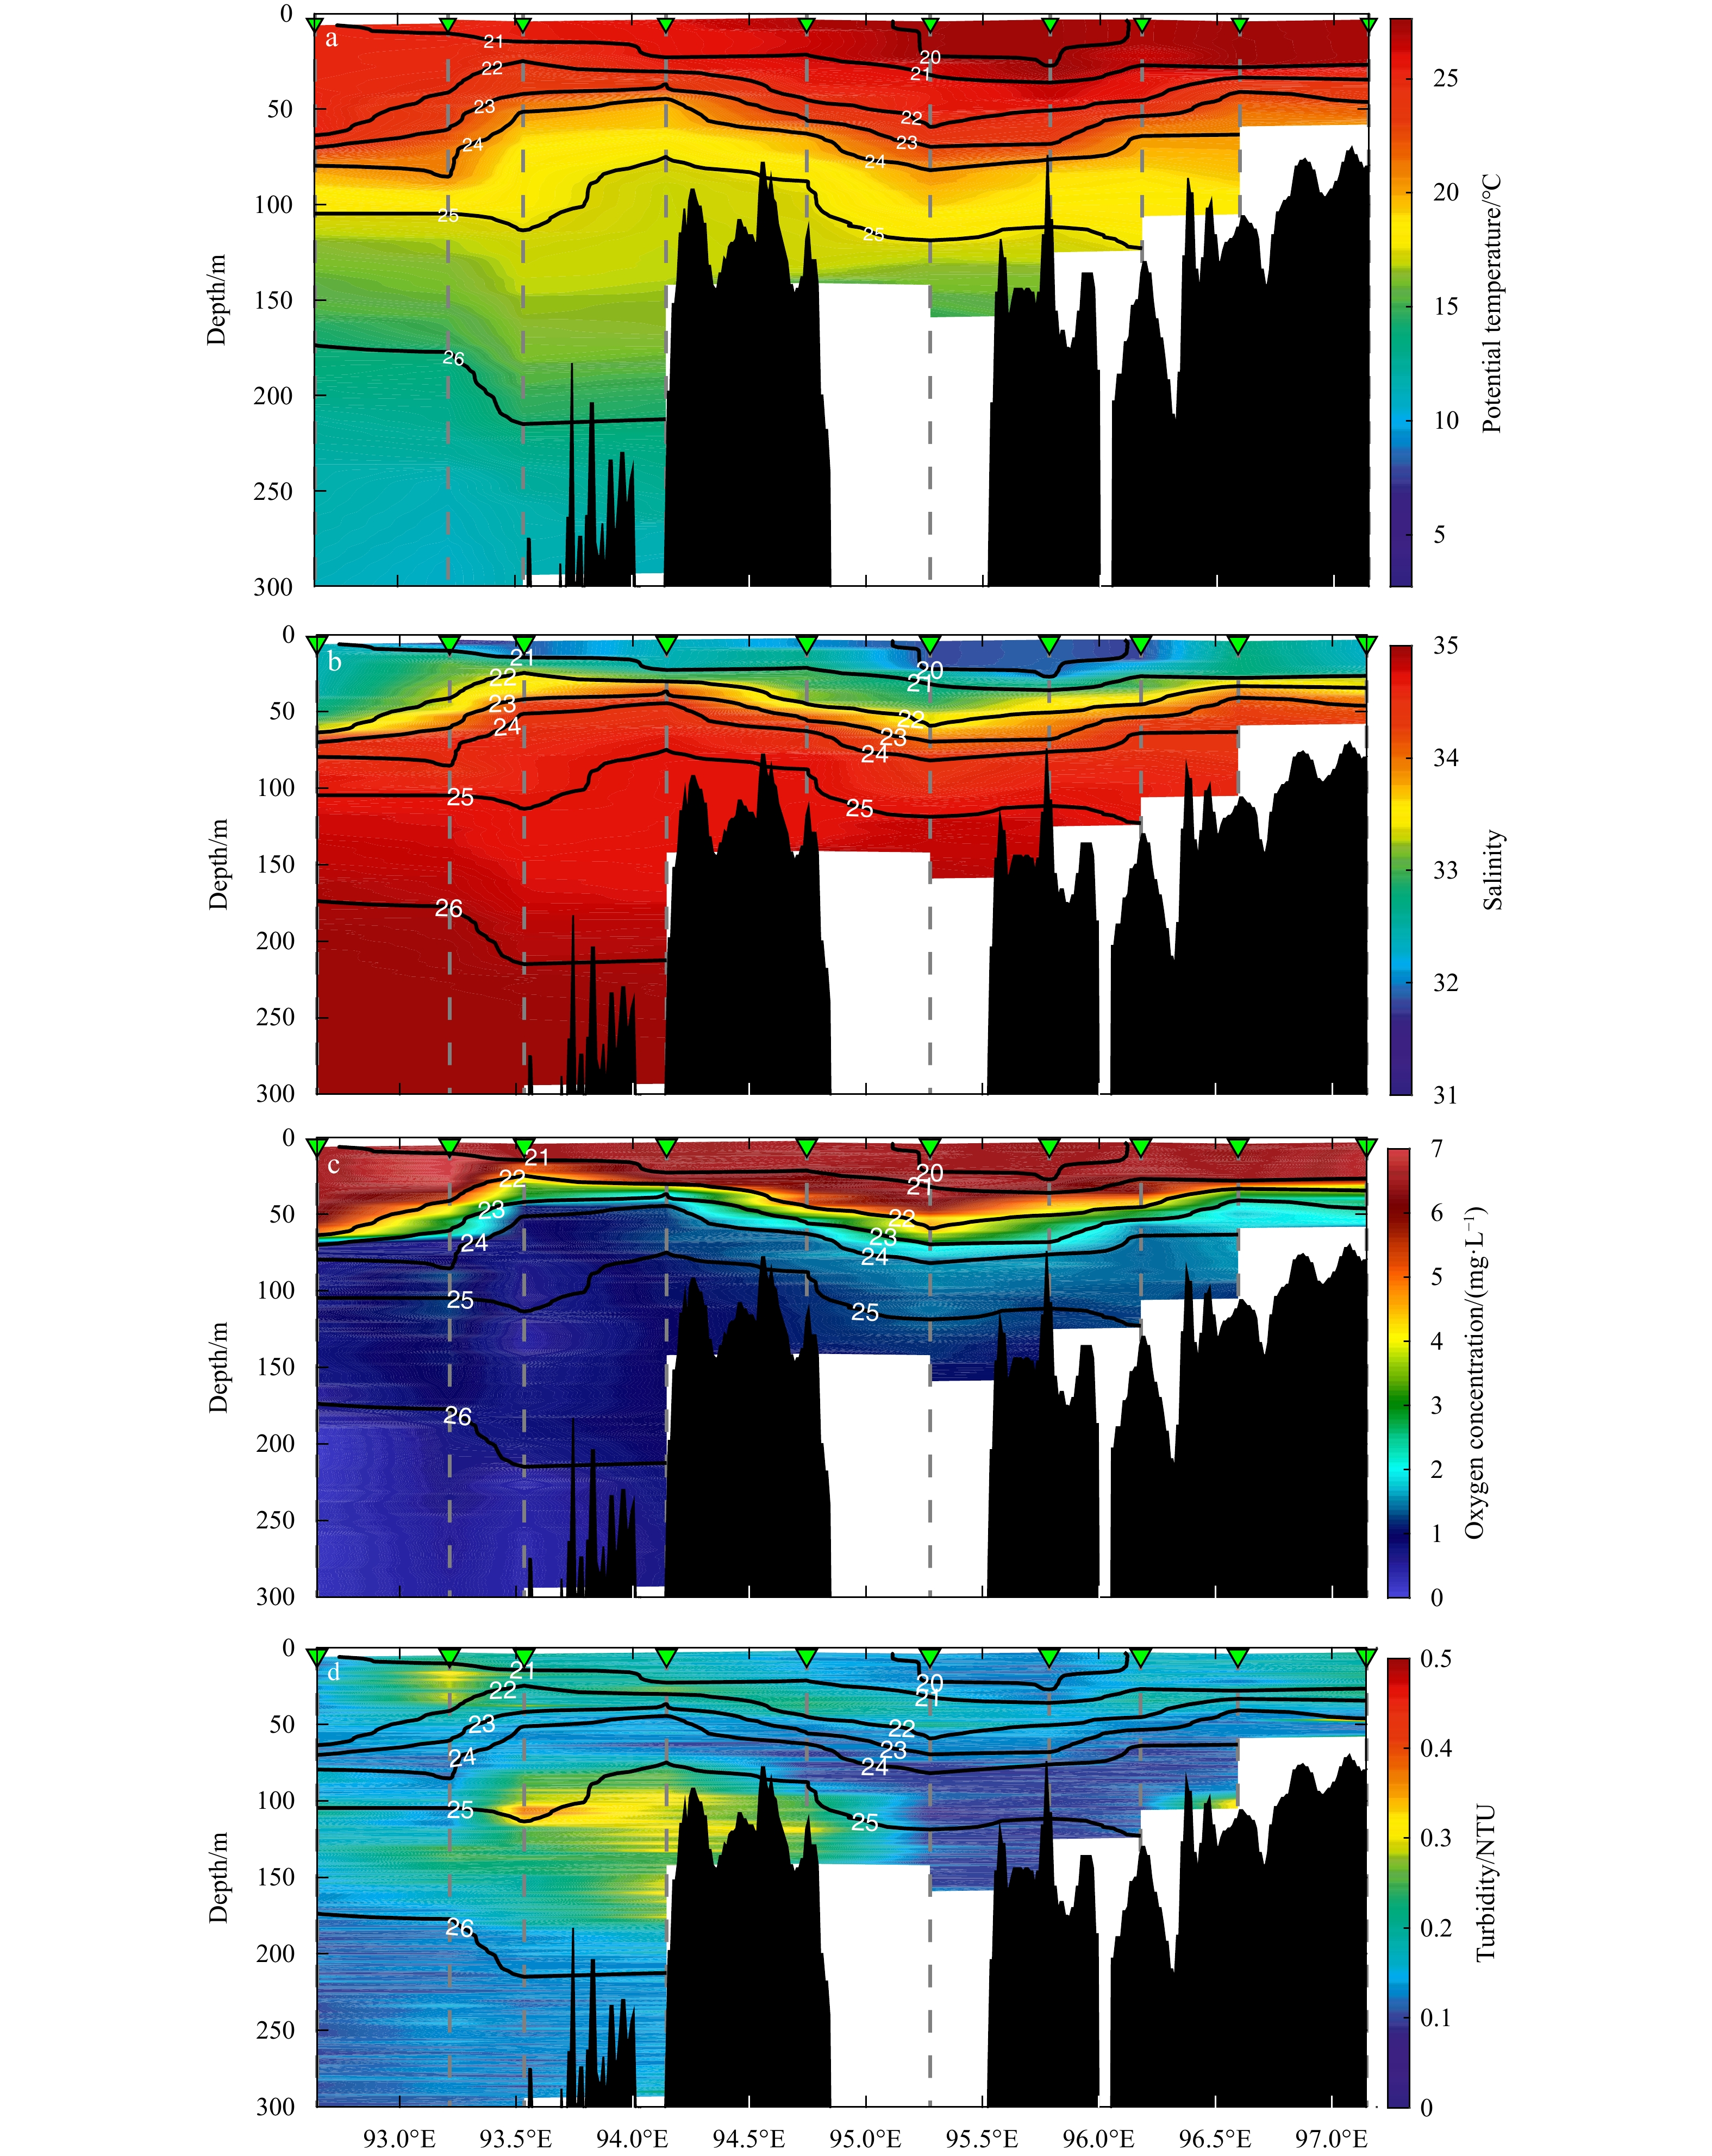
Along Section 2, water mass in the upper layer of the AS is relatively warmer and fresher than that in the BoB (Figs 6a, b). Low-salinity regions with salinity less than 32.10 are also observed in the upper layer between 93.0°E and 94.0°E and between 95.0°E and 96.5°E (Fig. 6b). The spatial distribution of the DO concentration displays zonal variability (Fig. 6c). Moreover, a “hotspot” of turbidity is found at the mooring site at a depth of approximately 100 m between 93.5°E and 94.5°E, and the “hotspot” of turbidity corresponds to the location of elevated turbulent mixing in the channel. Previous studies revealed that internal waves encountering topographic features not only tend to resuspend bottom sediment (Tian et al., 2019), but also produce elevated turbulent mixing (Polzin et al., 1997; Ledwell et al., 2000; Naveira Garabato et al., 2004). Also, the Irrawaddy River delivers a large amount of sediment into the Preparis Channel (Liu et al., 2020). Thus, we speculate that the “hotspot” of turbidity be associated with the energetic internal tides in the Preparis Channel and the abundant sediments from the Irrawaddy River.
Figure
6.
Vertical sections of potential temperature (a), salinity (b), dissolved oxygen concentration (c), and turbidity (d) along Section 2 shown in Fig. 1b. The solid black contours indicate potential density, and green triangles with vertical dashed lines denote CTD profiles.
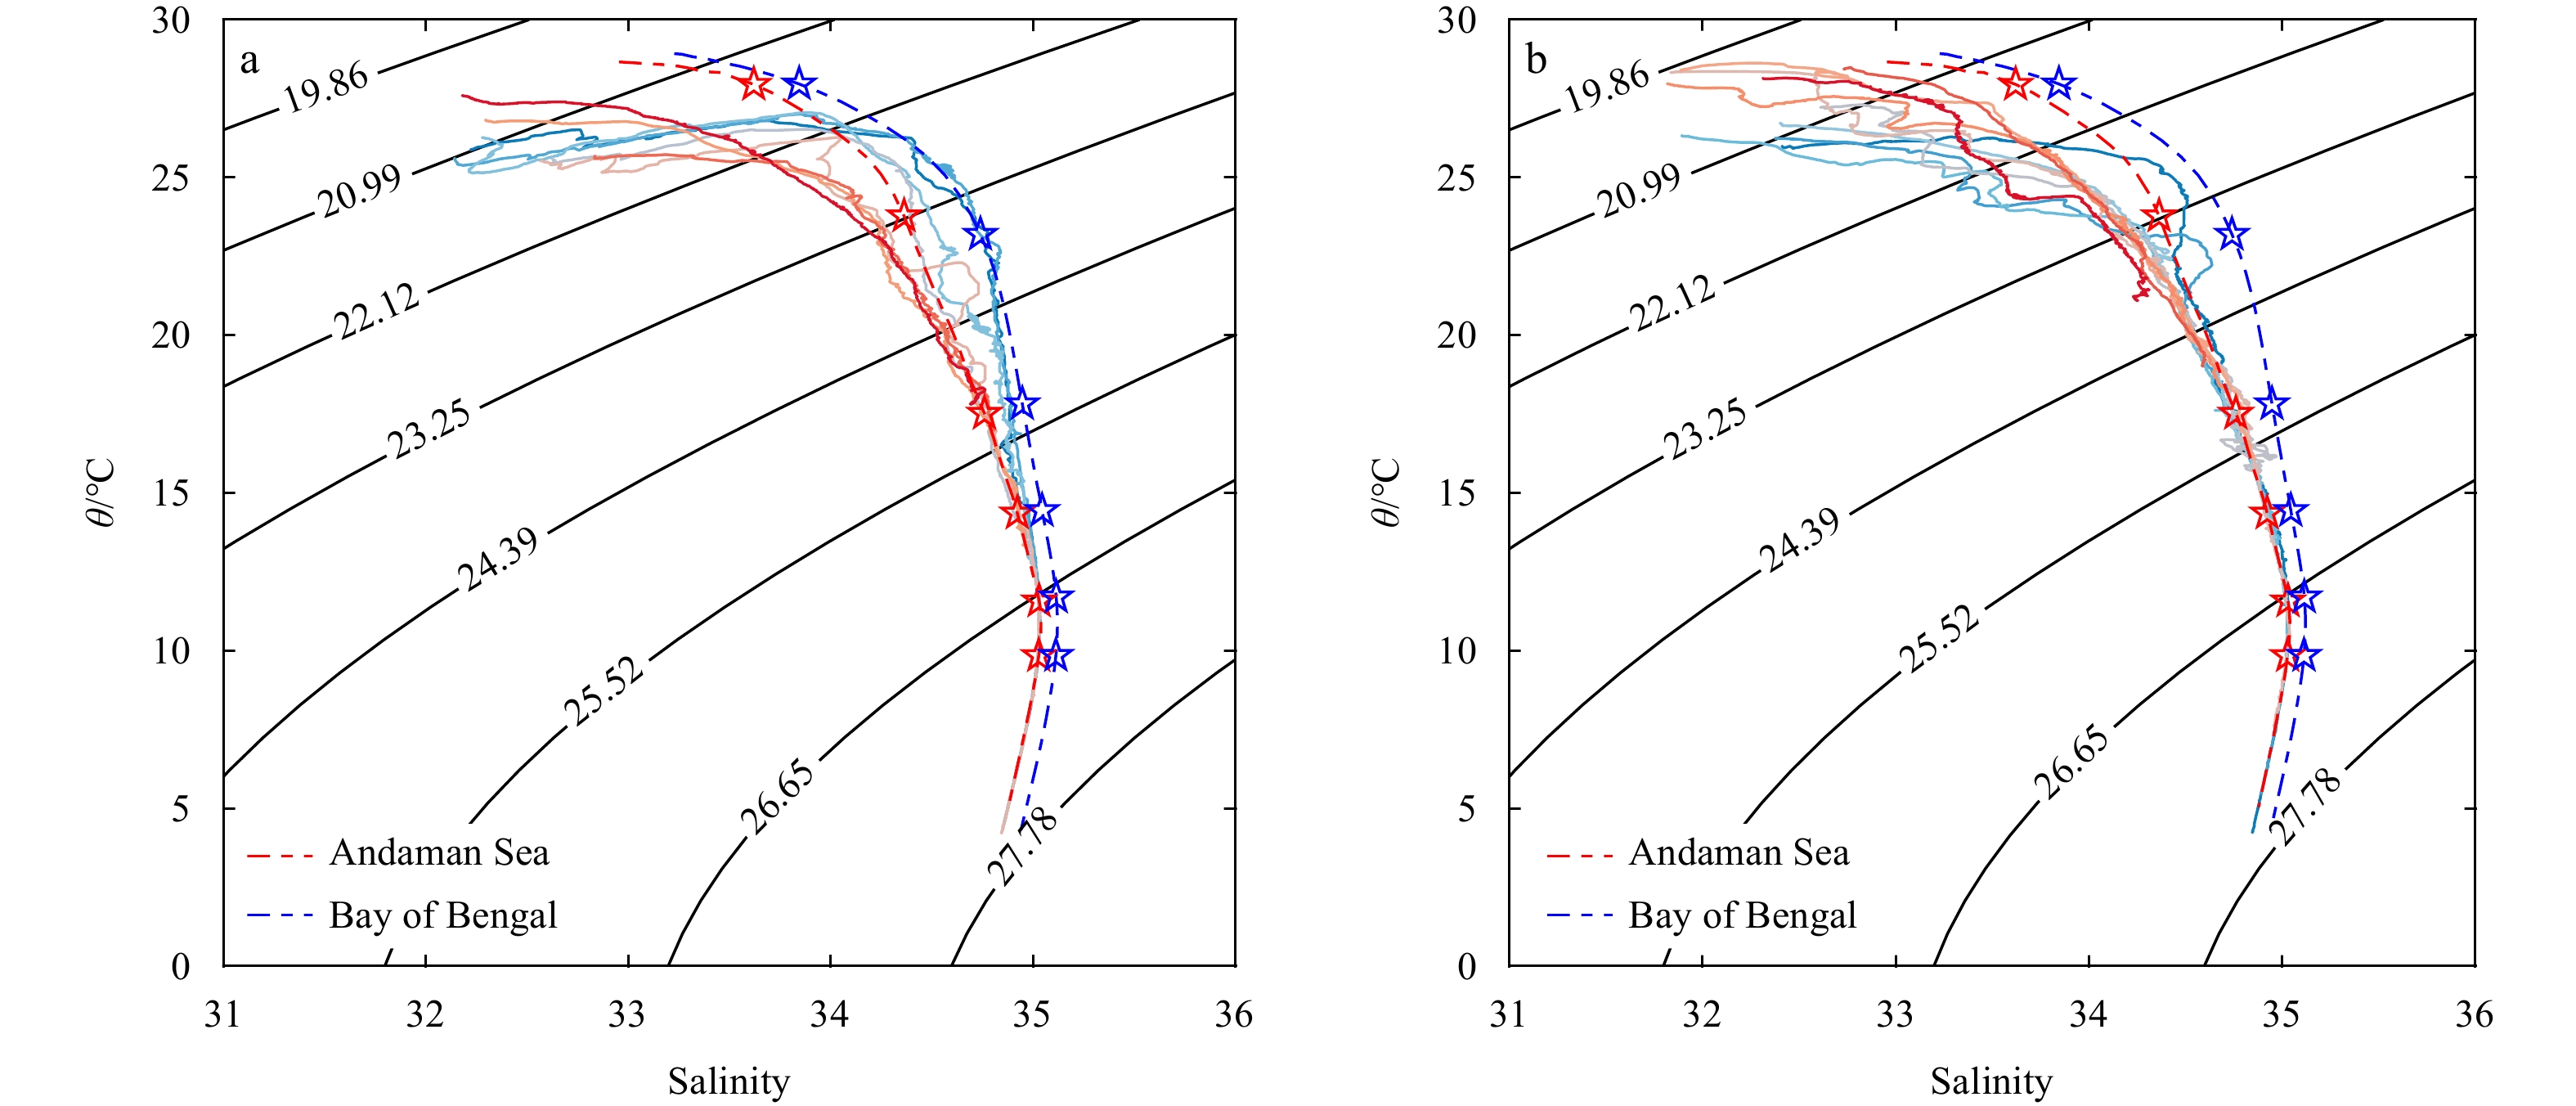
We also utilized historical hydrographic data from the World Ocean Database 2018 (WOD18; Boyer et al., 2018) to analyze the water masses in the BoB and AS. Figure 7 shows the T-S diagram at all the stations along Sections 1 and 2. Notably, the water masses display a huge difference between the BoB and AS (Fig. 7a). In the upper layer of Section 1 (Fig. 7a), the water mass in the AS is comparatively fresher than that in the BoB, and the water masses deeper than 150 m show mixed features of waters of the BoB and AS, with T-S profiles located between the mean T-S profile of the BoB and AS (Fig. 7a). On the other hand, the water mass in the upper layer of Section 2 is relatively warmer and saltier than that of Section 1 (Fig. 7b). The T-S distributions of Sections 1 and 2 indicate that water masses in the upper layer at Sections 1 and 2 be diluted by the input of fresh water from the Irrawaddy River (Fig. 7).
Figure
7.T-S diagrams of water mass across the Preparis Channel. Dashed red and blue lines show the mean T-S profiles within the Andaman Sea and Bay of Bengal directly outside the channel, respectively, estimated from the World Ocean Database 2018 (WOD18). Solid lines with colors from blue to red indicate the profiles of CTD stations along Section 1 (a) and Section 2 (b) from the Bay of Bengal to the Andaman Sea. Red (blue) stars indicate depths of 50 m, 100 m, 150 m, 200 m, 300 m, and 500 m for the T-S profiles in the Andaman Sea (the Bay of Bengal).
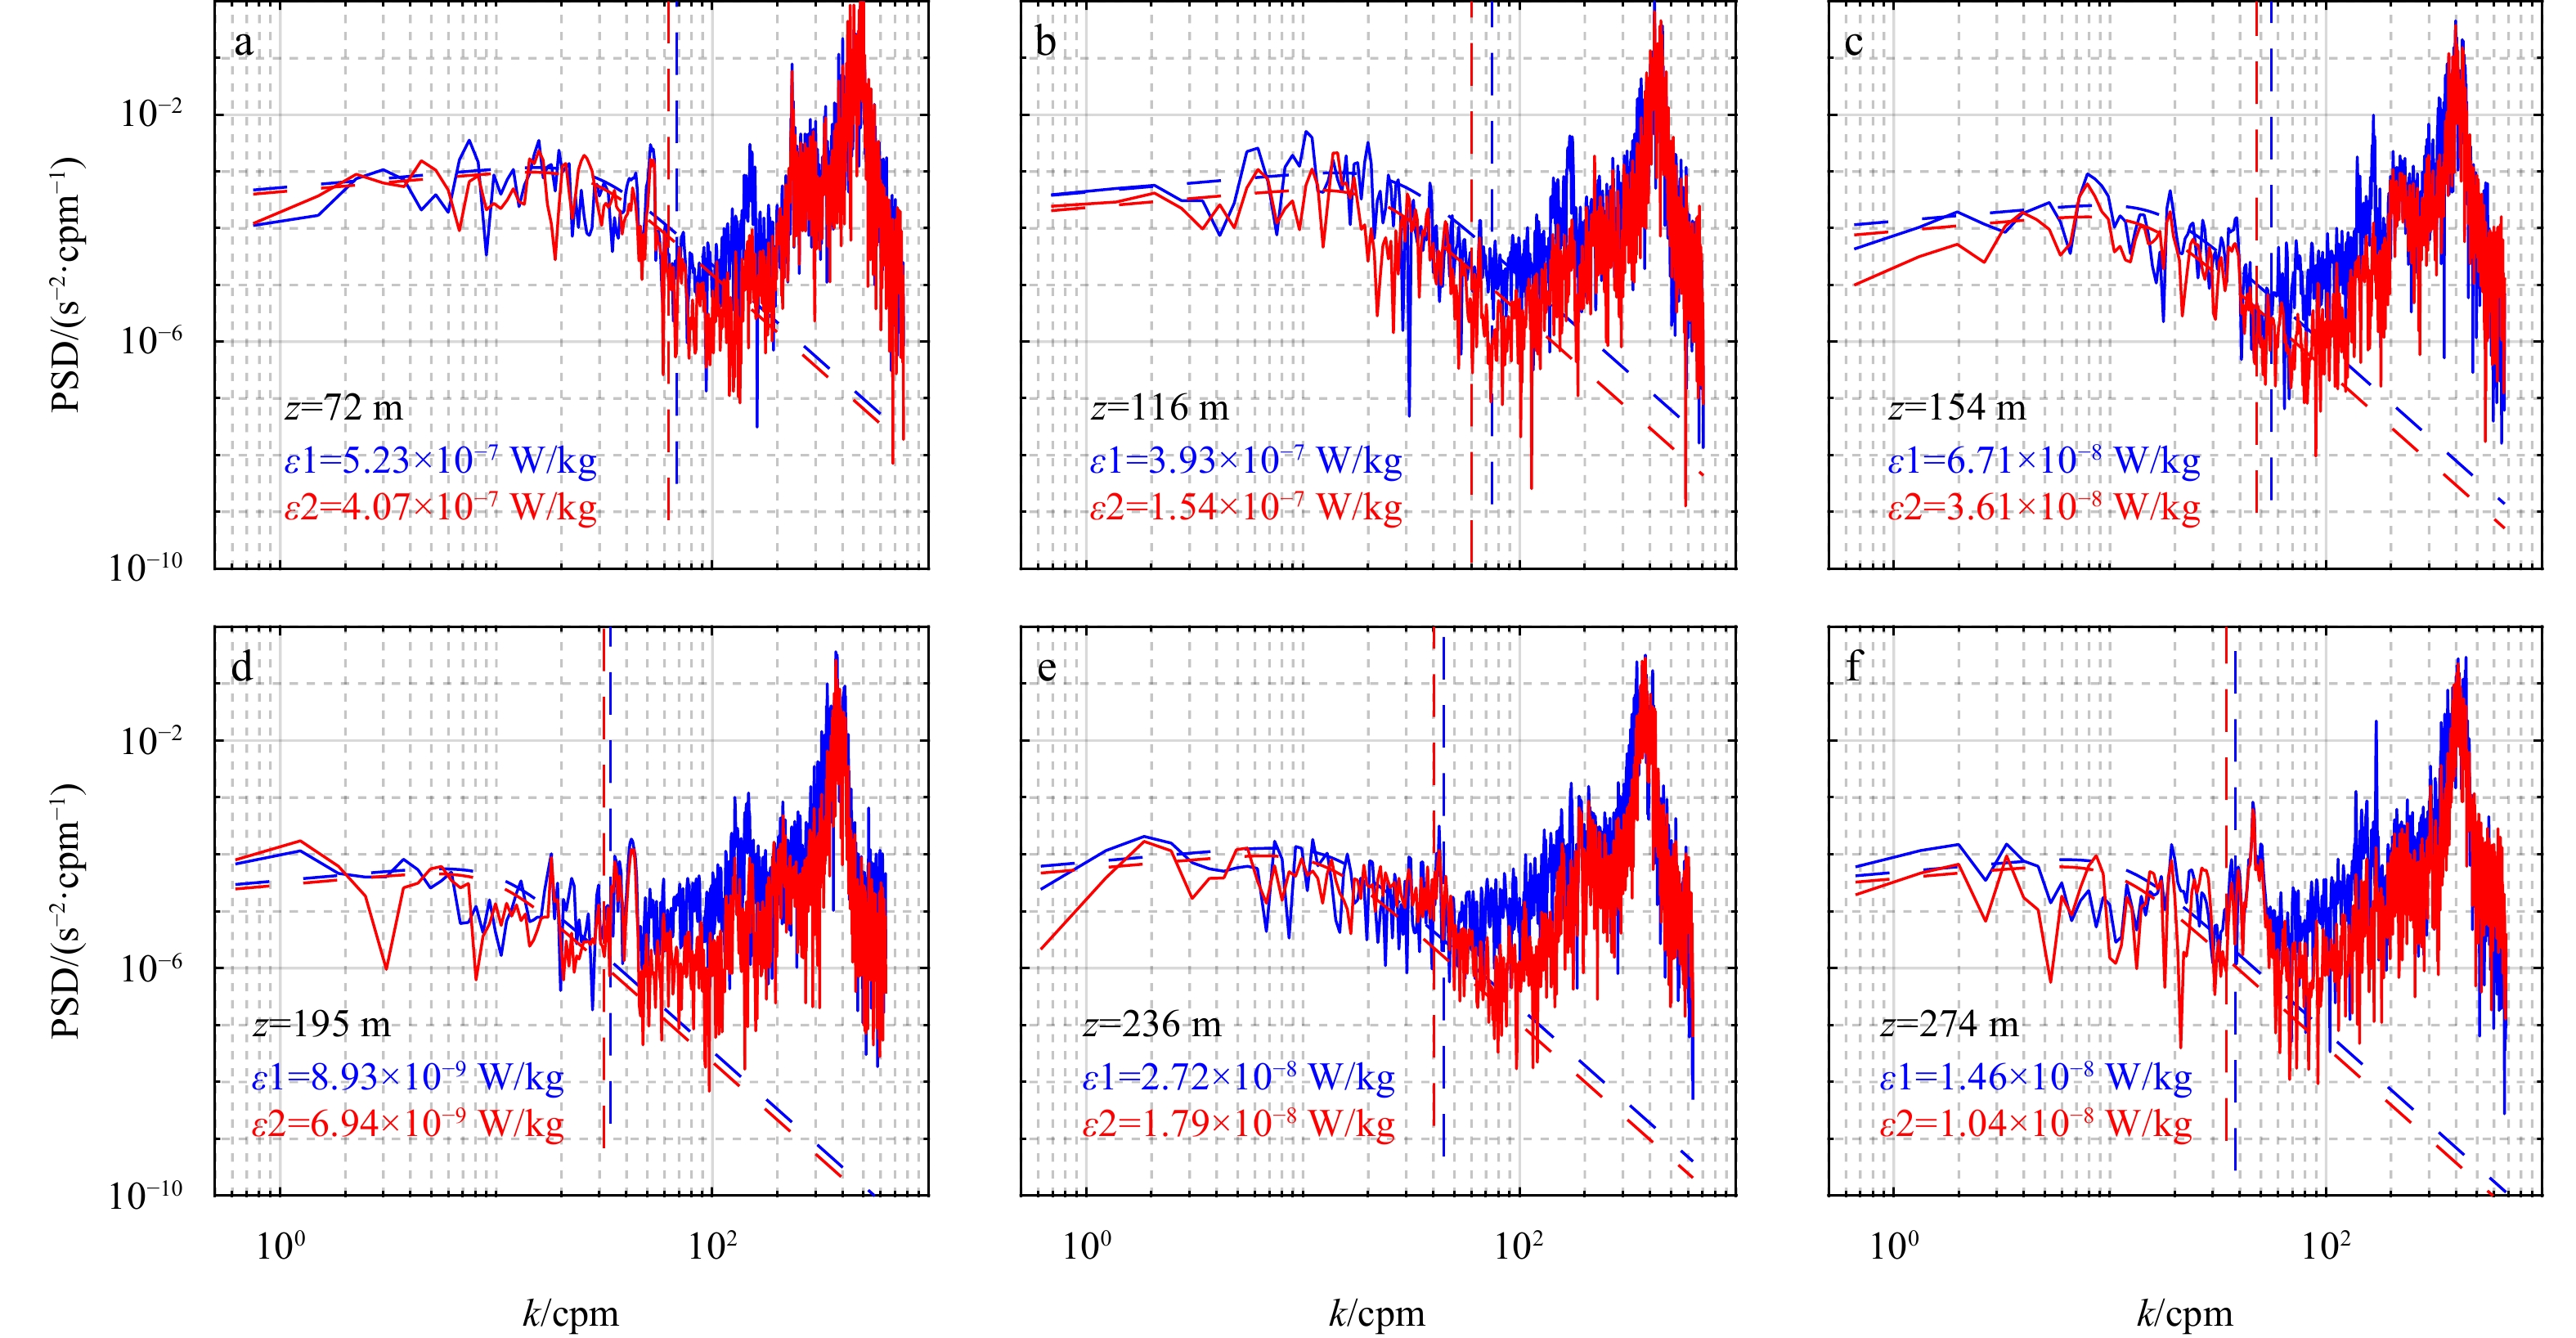
During the cruise, a tethered free-falling VMP-500 was cast 10 times to explore the spatial distribution of turbulent mixing in the Preparis Channel (Fig. 1b). The turbulent dissipation rate (ε) was calculated by fitting the Nasmyth spectrum to the measured shear spectra (Fig. 8; Shay and Gregg, 1986; Peters et al., 1988). The turbulent diffusivity was estimated using the Osborn’s relation (Osborn, 1980) of κρ=Γε/N2, where ε is the turbulent dissipation rate estimated from VMP measurements, N2 is the buoyancy frequency calculated from simultaneous CTD casts, and Γ is the mixing efficiency. Here, a varied mixing efficiency Γ associated with the buoyancy Reynolds number $ {Re}_{\mathrm{b}} $ is adopted according to Mashayek et al. (2017):
Figure
8.
Examples of shear spectra at different depths of turbulent mixing station S6 (shown in Fig. 1b). Shear wavenumber spectra (solid blue and red lines), the upper integration bound (dashed thin vertical red and blue lines), and the Namsyth spectra (thick dashed red and blue lines) are shown. PSD: power spectral density; cpm: cycle per meter.
where Reb=$ {\varepsilon } $/(νN2) and $ {{\varGamma }}^{\mathrm{*}} $ is the maximum value of mixing efficiency at ${Re}_{\mathrm{b}}$=${Re}_{\mathrm{b}}^{\mathrm{*}}$. ν is the kinematic viscosity of sea water. Lower bounds with (${Re}_{\mathrm{b}}^{\mathrm{*}}$, ${{\varGamma }}^{\mathrm{*}}$)=(100, 0.2) of Mashayek et al. (2017) are adopted in estimating turbulent diffusivity in this study.
To explore the vertical distribution of turbulent mixing in the Preparis Channel, we use Fig. 9 to display vertical profiles of various quantities at four stations in the Preparis Channel. Comparatively, turbulent mixing in different regions of the Preparis Channel shows different vertical distribution. At station S1 in the BoB, the shear variance is relatively smaller than the buoyancy frequency squared over the observed water column (Fig. 9b), the turbulent dissipation rate shallower than 220 m oscillates between 3.5×10⁻⁹ W/kg and 4.9×10⁻⁸ W/kg, and the turbulent dissipation rate below 220 m is less variable with an order of 10−8 W/kg (Fig. 9d). The turbulent diffusivity is intensified with increasing depth and its magnitude is below O(10−4 m2/s) over the observed water column (Fig. 9e). At station S6, the shear variance exceeds the buoyancy frequency squared at some depths (Fig. 9g), and the Richardson number at the depth of 100 m is near the critical value of 0.25, which is favorable for shear instability (Fig. 9h). Correspondingly, turbulent dissipation rate and turbulent diffusivity are also elevated at the depth of 100 m (Figs 9i, j), indicating that shear instability might contribute to the elevated turbulent mixing. In addition, at the depth of 100 m, the elevated turbulent mixing overlaps with a region of high turbidity and exceeds 0.35 nephelometric turbidity units (NTU) (Fig. 6d). At stations S7 and S9 over the continental slope in the Preparis Channel, shear variance is slightly smaller than the buoyancy frequency squared (Figs 9l, q), and the Richardson number values are larger than 0.25 (Figs 9m, r), while turbulent dissipation rate and turbulent diffusivity are more variable than those at station S1 in the BoB (Figs 9s, t), which might be associated with the energetic internal tides over the continental slope in the northern part of the AS (Jithin et al., 2020; Peng et al., 2021).
Figure
9.
From top to bottom: four sets of profiles of turbulent mixing stations S1, S6, S7, and S9 (shown in Fig. 1b). For each station, quantities plotted are (from left to right) potential density, shear variance (red) and buoyancy frequency squared (black), Richardson number (the vertical line for Ri=0.25), observed original (red line) and depth-averaged (black line) turbulent dissipation rates, and observed turbulent diffusivity (vertically averaged over 10-m bins).
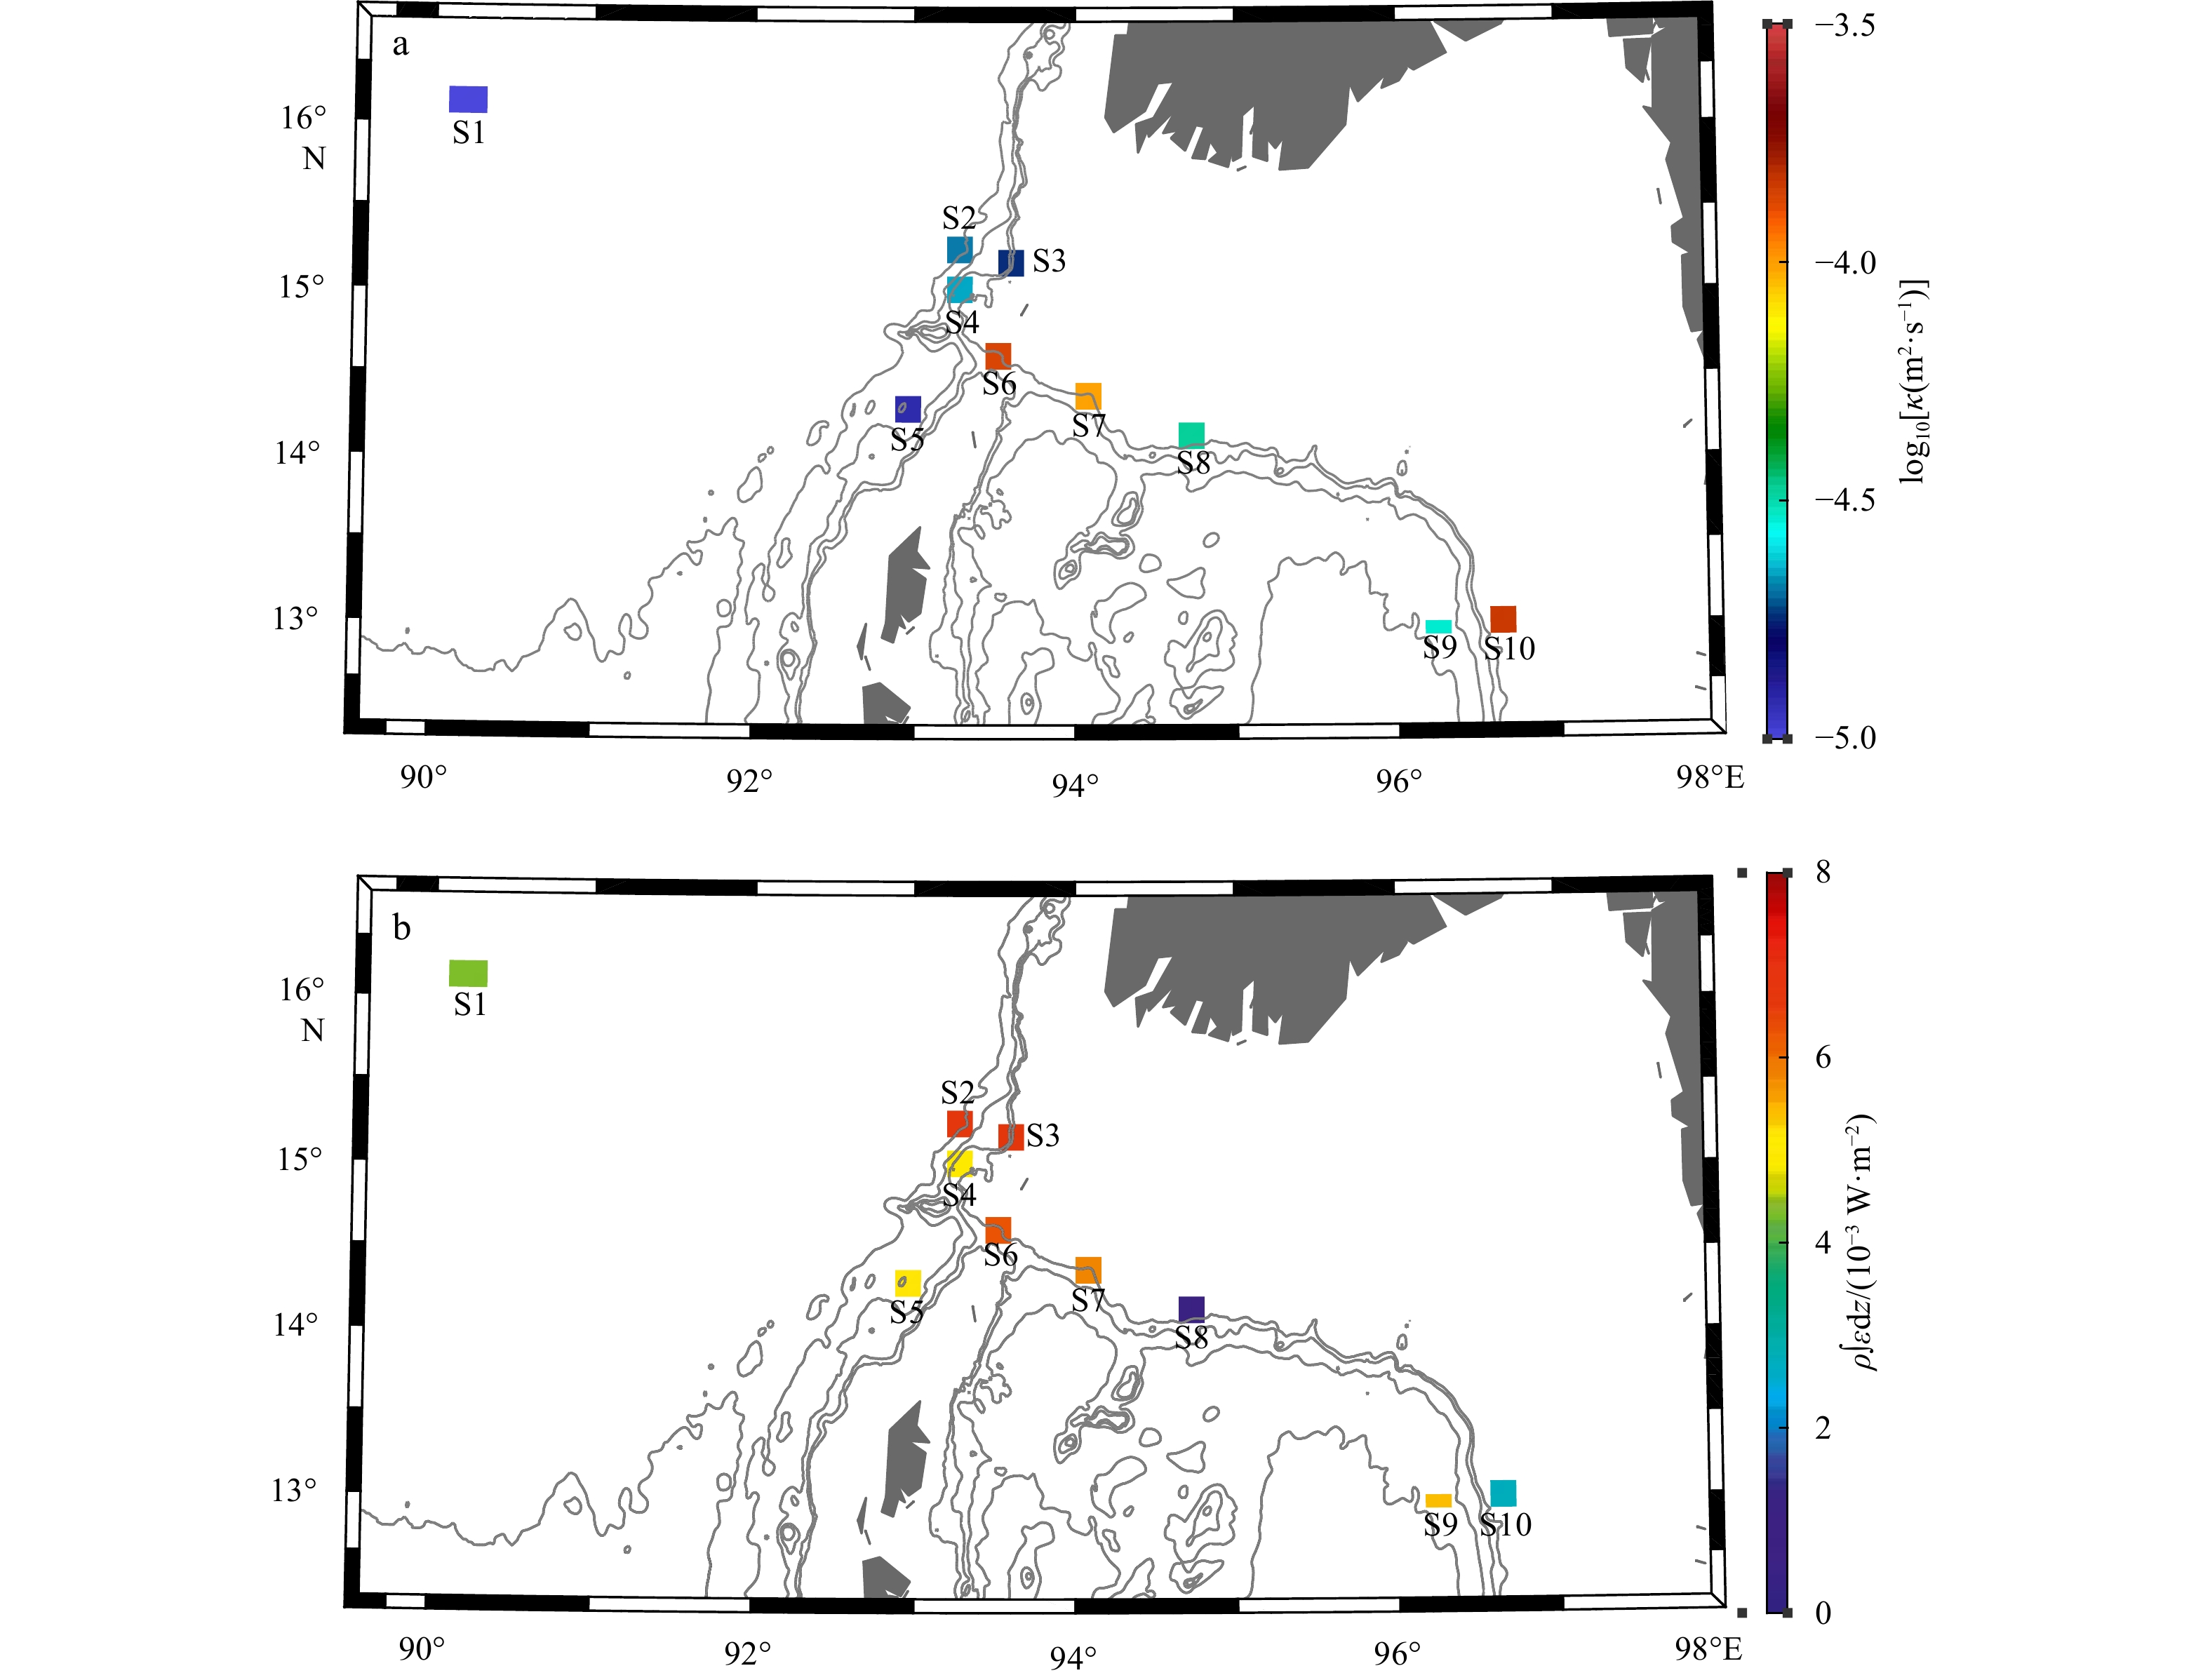
Figure 10 shows the horizontal distribution of depth-averaged diffusivity and depth-integrated turbulent dissipation rate in the upper layer of the Preparis Channel. We can see that energetic turbulent mixing exists in the narrows of the Preparis Channel, and the order of turbulent diffusivity there can reach 10−4 m2/s, one order larger than that in the BoB (Fig. 10a). In addition, the horizontal distribution of depth-integrated turbulent dissipation rate displays depth-integrated turbulent dissipation rate in the Preparis Channel is larger than that in the BoB, with similar patterns as those revealed by Peng et al. (2021) except for the magnitude (Fig. 10b). As mentioned above, internal tides in the Preparis Channel exhibit a high-mode vertical structure, and the background flow displays strong shear in the vertical direction, which are propitious to the growth of shear instability and turbulent mixing. We speculate that energetic internal tides and the complex topography of the Preparis Channel may account for the elevated turbulent mixing in the Preparis Channel.
Figure
10.
Maps of depth-averaged (0–150 m) turbulent diffusivity (logarithmic scale) (a) and depth-integrated (0–300 m) turbulent dissipation rate (b) in the Preparis Channel.
Based on in situ observations in February, we revealed a strong outflow from the AS to the BoB in the deep passage of the southern Preparis Channel with a net volume transport of 0.06 Sv. The result is different from that of Liao et al. (2020) who suggest an annual mean transport from the BoB to the AS. One of the probable reason is that their model only captured the water transport in the upper layer shallower than 300 m but failed in recognizing the deep current below 400 m in the Preparis Channel due to the coarse resolution (~9 km). In the meanwhile, they also indicated the strong seasonality of the transport direction and magnitude, and showed a similar outflow (0.15 Sv) in April. On the other hand, our mooring observations also revealed energetic internal tides with vertical high-mode structure in the Preparis Channel with dominant diurnal internal tide O1. Hydrographic measurements revealed that the water mass in the upper layer of the AS is warmer and fresher than that in the BoB. A low-salinity region with salinity lower than 32.10 was observed in the upper layer of Sections 1 and 2; we speculate it be associated with the intrusion of fresh water from the Irrawaddy River.
Microstructure profiler observations revealed that the magnitude of turbulent mixing in the Preparis Channel is enhanced to 10−4 m2/s, approximately one order larger than that in the BoB. The strong turbulent mixing overlaps with a region of high turbidity (Fig. 6d). It could be expected that energetic internal tides and deep flow in the Preparis Channel play significant roles in redistributing bottom sediment and affecting the water properties of the BoB and AS. Through our analysis of the flow, water mass and turbulent mixing from in situ observations, the significance of the Preparis Channel to the exchange between the AS and BoB is demonstrated. However, both the AS and BoB is dominated by monsoons with significant temporal variability, the dynamic processes across the channel require further investigation in a relatively long scale in the future.
Acknowledgements:
Bathymetry data for the AS were acquired from global seafloor topography (https://topex.ucsd.edu/cgi-bin/get_data.cgi). The authors thank the crew of R/V Xiangyanghong 06 and R/V Xiangyanghong 10 for their considerable assistance in the cruise observation.
Awasthi N, Ray J S, Singh A K, et al. 2014. Provenance of the Late Quaternary sediments in the Andaman Sea: implications for monsoon variability and ocean circulation. Geochemistry, Geophysics, Geosystems, 15(10): 3890–3906,
Boyer T P, Baranova O K, Coleman C, et al. 2018. World ocean database 2018. Silver Spring: NOAA
Chandran S T, Raj S B, Ravindran S, et al. 2018. Upper layer circulation, hydrography, and biological response of the Andaman waters during winter monsoon based on in situ and satellite observations. Ocean Dynamics, 68(7): 801–815. doi: 10.1007/s10236-018-1160-x
Chatterjee A, Shankar D, McCreary J P, et al. 2017. Dynamics of Andaman Sea circulation and its role in connecting the equatorial Indian Ocean to the Bay of Bengal. Journal of Geophysical Research: Oceans, 122(4): 3200–3218. doi: 10.1002/2016JC012300
Cheng Xuhua, Xie Shangping, McCreary J P, et al. 2013. Intraseasonal variability of sea surface height in the Bay of Bengal. Journal of Geophysical Research: Oceans, 118(2): 816–830. doi: 10.1002/jgrc.20075
Furuichi T, Win Z, Wasson R J. 2009. Discharge and suspended sediment transport in the Ayeyarwady River, Myanmar: centennial and decadal changes. Hydrological Processes, 23(11): 1631–1641. doi: 10.1002/hyp.7295
Godin G. 1972. The Analysis of Tides. Toronto: University of Toronto Press, 264
Hacker P, Firing E, Hummon J, et al. 1998. Bay of Bengal currents during the Northeast Monsoon. Geophysical Research Letters, 25(15): 2769–2772. doi: 10.1029/98GL52115
Hu Zhentao, Ma Xiao, Peng Yingyu, et al. 2022. A large subsurface anticyclonic eddy in the eastern Equatorial Indian Ocean. Journal of Geophysical Research: Oceans, 127(3): e2021JC018130. doi: 10.1029/2021JC018130
Jithin A K, Francis P A. 2020. Role of internal tide mixing in keeping the deep Andaman Sea warmer than the Bay of Bengal. Scientific Reports, 10(1): 11982. doi: 10.1038/s41598-020-68708-6
Jithin A K, Francis P A. 2021. Formation of an intrathermocline eddy triggered by the coastal-trapped wave in the northern Bay of Bengal. Journal of Geophysical Research: Oceans, 126(12): e2021JC017725. doi: 10.1029/2021JC017725
Jithin A K, Francis P A, Unnikrishnan A S, et al. 2020. Energetics and spatio-temporal variability of semidiurnal internal tides in the Bay of Bengal and Andaman Sea. Progress in Oceanography, 189: 102444. doi: 10.1016/j.pocean.2020.102444
Ledwell J R, Montgomery E T, Polzin K L, et al. 2000. Evidence for enhanced mixing over rough topography in the abyssal ocean. Nature, 403(6766): 179–182. doi: 10.1038/35003164
Liao Jiawen, Peng Shiqiu, Wen Xixi. 2020. On the heat budget and water mass exchange in the Andaman Sea. Acta Oceanologica Sinica, 39(7): 32–41. doi: 10.1007/s13131-019-1627-8
Liu J P, Kuehl S A, Pierce A C, et al. 2020. Fate of Ayeyarwady and Thanlwin Rivers Sediments in the Andaman Sea and Bay of Bengal. Marine Geology, 423: 106137. doi: 10.1016/j.margeo.2020.106137
Mashayek A, Salehipour H, Bouffard D, et al. 2017. Efficiency of turbulent mixing in the abyssal ocean circulation. Geophysical Research Letters, 44(12): 6296–6306. doi: 10.1002/2016GL072452
Naveira Garabato A C, Polzin K L, King B A, et al. 2004. Widespread intense turbulent mixing in the Southern Ocean. Science, 303(5655): 210–213. doi: 10.1126/science.1090929
Osborn T R. 1980. Estimates of the local rate of vertical diffusion from dissipation measurements. Journal of Physical Oceanography, 10(1): 83–89. doi: 10.1175/1520-0485(1980)010<0083:EOTLRO>2.0.CO;2
Peng Shiqiu, Liao, Jiawen, Wang, Xiaowei, et al. 2021. Energetics-Based estimation of the Diapycnal mixing induced by internal tides in the Andaman Sea. Journal of Geophysical Research: Oceans, 126(4): e2020JC016521
Peters H, Gregg M C, Toole J M. 1988. On the parameterization of equatorial turbulence. Journal of Geophysical Research: Oceans, 93(C2): 1199–1218. doi: 10.1029/JC093iC02p01199
Polzin K L, Toole J M, Ledwell J R, et al. 1997. Spatial variability of turbulent mixing in the abyssal ocean. Science, 276(5309): 93–96
Qu Tangdong, Girton J B, Whitehead J A. 2006. Deepwater overflow through Luzon Strait. Journal of Geophysical Research: Oceans, 111(C1): C01002
Ramesh Babu V, Sastry J S. 1976. Hydrography of the Andaman Sea during late winter. Indian Journal of Geo-Marine Sciences, 5(2): 179–189
Rizal S, Damm P, Wahid M A, et al. 2012. General circulation in the Malacca Strait and Andaman Sea: a numerical model study. American Journal of Environmental Sciences, 8(5): 479–488. doi: 10.3844/ajessp.2012.479.488
Robinson R A J, Bird M I, Oo N W, et al. 2007. The Irrawaddy River sediment flux to the Indian Ocean: the original nineteenth-century data revisited. The Journal of Geology, 115(6): 629–640. doi: 10.1086/521607
Rodolfo K S. 1969. Bathymetry and marine geology of the Andaman Basin, and tectonic implications for Southeast Asia. GSA Bulletin, 80(7): 1203–1230. doi: 10.1130/0016-7606(1969)80[1203:BAMGOT]2.0.CO;2
Rodolfo K S. 1975. The Irrawaddy Delta: tertiary setting and modern offshore sedimentation. In: Broussard M L, ed. Deltas, Models for Exploration. 2nd ed. Houston: Houston Geological Society, 329–348
Sarma V V S S, Narvekar P V. 2001. A study on inorganic carbon components in the Andaman Sea during the post monsoon season. Oceanologica Acta, 24(2): 125–134. doi: 10.1016/S0399-1784(00)01133-6
Sen Gupta R, Moraes C, George M D, et al. 1981. Chemistry and hydrography of the Andaman Sea. Indian Journal of Geo-Marine Sciences, 10(3): 228–233
Shay T J, Gregg M C. 1986. Convectively driven turbulent mixing in the upper ocean. Journal of Physical Oceanography, 16(11): 1777–1798. doi: 10.1175/1520-0485(1986)016<1777:CDTMIT>2.0.CO;2
Smith W H F, Sandwell D T. 1997. Global sea floor topography from satellite altimetry and ship depth soundings. Science, 277(5334): 1956–1962. doi: 10.1126/science.277.5334.1956
Sprintall J, Gordon A L, Flament P, et al. 2012. Observations of exchange between the South China Sea and the Sulu Sea. Journal of Geophysical Research: Oceans, 117(5): C05036
Tian Zhuangcai, Jia Yonggang, Zhang Shaotong, et al. 2019. Bottom and intermediate nepheloid layer induced by shoaling internal solitary waves: impacts of the angle of the wave group velocity vector and slope gradients. Journal of Geophysical Research: Oceans, 124(8): 5686–5699. doi: 10.1029/2018JC014721
Varkey M J, Murty V S N, Suryanarayana A. 1996. Physical oceanography of the Bay of Bengal and Andaman Sea. In: Ansell A D, Gibson R N, Barnes M, eds. Oceanography and Marine Biology: An Annual Review. London: Aberdeen University Press, 1–70
Wain D J, Rehmann C R. 2010. Transport by an intrusion generated by boundary mixing in a lake. Water Resources Research, 46(8): W08517. doi: 10.1029/2009WR008391
Wang Jianing, Wang Fan, Lu Youyu, et al. 2021. Pathways, volume transport, and seasonal variability of the lower deep limb of the Pacific Meridional overturning circulation at the Yap-Mariana Junction. Frontiers in Marine Science, 8: 672199. doi: 10.3389/fmars.2021.672199
Ye Ruijie, Zhou Chun, Zhao Wei, et al. 2019. Variability in the deep overflow through the Heng-Chun Ridge of the Luzon Strait. Journal of Physical Oceanography, 49(3): 811–825. doi: 10.1175/JPO-D-18-0113.1
Zhao Wei, Zhou Chun, Tian Jiwei, et al. 2014. Deep water circulation in the Luzon Strait. Journal of Geophysical Research: Oceans, 119(2): 790–804. doi: 10.1002/2013JC009587
Zhao Xiaolong, Zhou Chun, Zhao Wei, et al. 2016. Deepwater overflow observed by three bottom-anchored moorings in the Bashi Channel. Deep-Sea Research Part I: Oceanographic Research Papers, 110: 65–74. doi: 10.1016/j.dsr.2016.01.007
Zhou Chun, Zhao Wei, Tian Jiwei, et al. 2014. Variability of the deep-water overflow in the Luzon Strait. Journal of Physical Oceanography, 44(11): 2972–2986. doi: 10.1175/JPO-D-14-0113.1
Ruijie Ye, Feng Zhou, Xiao Ma, Dingyong Zeng, Feilong Lin, Hongliang Li, Chenggang Liu, Soe Moe Lwin, Hlaing Swe Win, Soe Pyae Aung. Observed characteristics of flow, water mass, and turbulent mixing in the Preparis Channel[J]. Acta Oceanologica Sinica, 2023, 42(2): 83-93. doi: 10.1007/s13131-022-2021-5
Ruijie Ye, Feng Zhou, Xiao Ma, Dingyong Zeng, Feilong Lin, Hongliang Li, Chenggang Liu, Soe Moe Lwin, Hlaing Swe Win, Soe Pyae Aung. Observed characteristics of flow, water mass, and turbulent mixing in the Preparis Channel[J]. Acta Oceanologica Sinica, 2023, 42(2): 83-93. doi: 10.1007/s13131-022-2021-5
Figure 1. Location of in situ observation measurements and bathymetric map of the Preparis Channel. a. Bottom topography of the Bay of Bengal and Andaman Sea from the global bathymetry data with 1′ resolution (Smith and Sandwell, 1997); the black box indicates the study area. b. Bottom topography of the Preparis Channel; the red star marks the deep mooring, brown filled circles indicate the CTD/LADCP stations, and black dots denoting VMP stations; Sections 1 and 2 (cyan curves) are defined to evaluate the spatial distributions of water mass in the Preparis Channel. c. Expanded view of the bottom topography of the deep mooring station in the Preparis Channel; the dashed black line indicates the section topography displayed in Fig. 4b; the orange contour represents the 400-m isobath, and the magenta contour is the 600-m isobath.
Figure 2. Diurnal internal tides K1 (a) and O1 (b) and semidiurnal internal tides M2 (c) and S2 (d) measured by the moored upward-looking 300-kHz ADCP. The dashed line indicates zero velocity.
Figure 3. Detided along-stream (a) and cross-stream (b) velocities acquired by the moored upward-looking 300-kHz ADCP. The dashed line indicates zero velocity, and the reference coordinate of redecomposition is indicated in d; c. detided along-stream (red line) and cross-stream (black line) velocities acquired by the deepest instrument recording current meter (RCM); d. mean detided velocity vector obtained by the RCM, where the orange contour represents the 400-m isobaths, and the purple contour is the 600-m isobath.
Figure 4. Vertical profiles of the mean detided along-stream velocity vector in the Prepari Channel; the red arrows indicate the flow toward the BoB, and the blue arrows show the flow toward the AS (a); section of topography extracted along the dashed black line in Fig. 1c, based on the 1′-resolution global bathymetric data (Smith and Sandwell, 1997); the numbers are the estimated volume transports, and the horizontal dashed black lines indicate the boundaries of the transport layers (b).
Figure 5. Vertical sections of potential temperature (a), salinity (b), dissolved oxygen concentration (c), and turbidity (d) along Section 1 shown in Fig. 1b. The solid black contours indicate potential density, and green triangles with vertical dashed lines denote CTD profiles.
Figure 6. Vertical sections of potential temperature (a), salinity (b), dissolved oxygen concentration (c), and turbidity (d) along Section 2 shown in Fig. 1b. The solid black contours indicate potential density, and green triangles with vertical dashed lines denote CTD profiles.
Figure 7. T-S diagrams of water mass across the Preparis Channel. Dashed red and blue lines show the mean T-S profiles within the Andaman Sea and Bay of Bengal directly outside the channel, respectively, estimated from the World Ocean Database 2018 (WOD18). Solid lines with colors from blue to red indicate the profiles of CTD stations along Section 1 (a) and Section 2 (b) from the Bay of Bengal to the Andaman Sea. Red (blue) stars indicate depths of 50 m, 100 m, 150 m, 200 m, 300 m, and 500 m for the T-S profiles in the Andaman Sea (the Bay of Bengal).
Figure 8. Examples of shear spectra at different depths of turbulent mixing station S6 (shown in Fig. 1b). Shear wavenumber spectra (solid blue and red lines), the upper integration bound (dashed thin vertical red and blue lines), and the Namsyth spectra (thick dashed red and blue lines) are shown. PSD: power spectral density; cpm: cycle per meter.
Figure 9. From top to bottom: four sets of profiles of turbulent mixing stations S1, S6, S7, and S9 (shown in Fig. 1b). For each station, quantities plotted are (from left to right) potential density, shear variance (red) and buoyancy frequency squared (black), Richardson number (the vertical line for Ri=0.25), observed original (red line) and depth-averaged (black line) turbulent dissipation rates, and observed turbulent diffusivity (vertically averaged over 10-m bins).
Figure 10. Maps of depth-averaged (0–150 m) turbulent diffusivity (logarithmic scale) (a) and depth-integrated (0–300 m) turbulent dissipation rate (b) in the Preparis Channel.


 DownLoad:


 DownLoad: