School of Oceanography, Shanghai Jiao Tong University, Shanghai 200030, China
2.
Key Laboratory for Polar Science of Ministry of Natural Resources, Polar Research Institute of China, Shanghai 200136, China
Funds:
The National Natural Science Foundation of China under contract Nos 41921006, 41890801 and 42076227; the Impact and Response of Antarctic Seas to Climate Change, Grant 583 under contract No. IRASCC 1-02-01B.
A thorough understanding of the biogeochemical cycling of trace metals in the ocean is crucial because of the important role these elements play in regulating metabolism in marine biotas and thus, the climate. However, a precise and accurate analysis of trace metals in seawater is difficult because they are present at extremely low concentrations in a high salt matrix. In this study, we report an analytical method for the preconcentration and separation of six trace metals, Fe, Ni, Cu, Zn, Cd and Pb, in seawater using a seaFAST automatic solid-phase extraction device, analysis by a triple quadrupole collision/reaction technique with inductively coupled plasma mass spectrometry (ICP-MS), and quantification by the isotope dilution technique. A small volume (10 mL) of seawater sample was mixed with a multi-element isotope spike and subjected to seaFAST procedures. The preconcentrate solution was then analyzed using the optimized collision/reaction cell mode of ICP-MS, with NH3 gas for Fe and Cd with a flow rate of 0.22 mL/min and He for Ni, Cu, Zn and Pb with a flow rate of 4.0 mL/min. The procedure blanks were 130 pmol/L, 3.0 pmol/L, 6.8 pmol/L, 37 pmol/L, 0.29 pmol/L and 0.42 pmol/L, for Fe, Ni, Cu, Zn, Cd and Pb, respectively. The method was validated using five reference materials (SLRs-6, SLEW-3, CASS-6, NASS-7 and GEOTRACE-GSC), and our results were consistent with the consensus values. The method was further validated by measuring full-water-column seawater samples from the subtropical Northwest Pacific Ocean, and our results demonstrated good oceanic consistency.
The concentrations of trace metals in the ocean range from picomoles per liter to nanomoles per liter, yet they play an important role in regulating marine primary production and carbon cycling in the ocean (Li et al., 2017; Sohrin et al., 2008; Zhang et al., 2019b). Some metals (such as Fe, Ni, and Zn) act as micronutrients for phytoplankton by participating in many enzymatic processes in marine biota (Nishioka and Obata, 2017; Norisuye et al., 2007). Cu can also be beneficial to marine organisms; however, it can become toxic above a certain level (Sunda, 2012). The relationship between Cd and P in the ocean can be used as a tracer to understand the nutrient conditions in the past and biogeochemical properties in the present (Zhang et al., 2019a). Pb can act as a tracer to reveal anthropogenic footprints in the ocean (Jiang et al., 2018). Concentrations of trace metals in the ocean are determined by their sources and sinks and the internal cyclings. For example, Fe, Zn, Ni, Cu, Cd and Pb in the Northwest Pacific ranged of 0.09−1.00 nmol/L, 0.1−10.0 nmol/L, 2.1−10.5 nmol/L, 0.6−4.5 nmol/L, 0.01−1.22 nmol/L and 0.02−0.07 nmol/L, respectively (Boyle et al., 2005; Jiang et al., 2021; Liao et al., 2020; Zheng et al., 2019). In the remote and less stratified Southern Ocean, Fe, Zn, Ni, Cu, Cd and Pb ranged of 0.05−0.80 nmol/L, 0.1−8.0 nmol/L, 2.0−8.0 nmol/L, 0.4−3.0 nmol/L, 0.1−1.0 nmol/L and 0.01−0.02 nmol/L, respectively (Janssen et al., 2020).
The analysis of trace metals in seawater is difficult because of their extremely low concentration in a high-salt matrix and the difficulty of uncontaminated sampling in the ocean. To better understand the cycling of trace metals in the ocean, an analytical method that is fast, accurate, and allows the processing of multiple elements simultaneously is required. Before the instrumental measurement, preconcentration and purification steps, such as solvent extraction, co-precipitation, and solid phase extraction (SPE) with chelating resins, are typically applied. Solvent extraction was the first widely used method; however, it was gradually replaced by co-precipitation or SPE due to drawbacks such as time consumption, and the requirement for large sample and reagent volumes (Komjarova and Blust, 2006). One or multiple steps of Mg(OH)2 coprecipitation have been applied to pretreat for trace metal analysis in seawater; however, the resulting high Mg content increased the matrix effects and the risk of hardware corrosion (Freslon et al., 2011; Wu, 2007). Recently, the solid-phase SPE method, which involves the use of chelating resins such as 8-hydroxyquinoline, iminodiacetate, nitrilotriacetic acid and ethylenediaminetriacetic acid, has been widely applied to the separation and preconcentration of trace metals. The advantages include simple configuration, high efficiency, low cost, and environmental friendliness (AlSuhaimi et al., 2019; He et al., 2017). For example, 8-hydroxyquinoline resin has been used to extract Zr, Hf, Nb, Ta, W, Mo and V from seawater for multi-element analysis (Firdaus et al., 2007; Rimskaya-Korsakova et al., 2017), iminodiacetate resin has been used to extract V, Mn, Co, Ni, Cu, Zn, Cd, and Pb from seawater (Vegueria et al., 2013; Warnken et al., 2000), and nitrilotriacetic acid resin has been used to extract Cu, Cd, Pb and Fe from seawater for analysis (de Jong et al., 2008; Lee et al., 2011). Another advantage of SPE is its potential for automation. seaFAST is a recently developed automatic SPE device that can achieve rapid matrix effect removal and preconcentration and provide a very low blank for trace metal analysis (An et al., 2020). Many studies have used seaFAST in online or offline mode with inductively coupled plasma mass spectrometry (ICP-MS) to determine the concentrations of multiple metals in seawater (Behrens et al., 2016; Rapp et al., 2017; Wuttig et al., 2019).
ICP-MS is a widely used analytical instrument for metal concentration determination, with advantages such as low blanks, high sensitivity, a wide linear range, and multi-element analysis capability (Biller and Bruland, 2012). Nevertheless, one of the most significant drawbacks of ICP-MS is polyatomic interference, which is generated from interactions with the carrier gas, atmospheric gas (Trueman et al., 2019). Polyatomic interference can seriously affect sensitivity and accuracy. Strategies to minimize interference include the optimization of pretreatment procedures and optimization of ICP-MS settings, including nebulizer gas flow (Bianchi et al., 2003), aerosol desolvation (Masson et al., 2000), and mathematical correction (Almeida et al., 2002). Hardware improvements to the magnet sector and electrostatic sector, and collision/reaction cell (CRC) techniques, have also been developed to minimize interference in ICP-MS. The CRC technique requires an additional cell in front of a quadrupole mass filter. The main principle involves reducing interference by colliding the ion beam with non-reactive gases such as He to reduce the kinetic energy spread, or by reacting the ion beam with reactive gases to minimize interference (Jackson et al., 2018). However, with the CRC technique, the elimination of interfering ions is sometimes accompanied by the production of new interferences after the reaction (Yamada, 2015). The recently developed inductively coupled plasma tandem mass spectrometry (ICP-MS/MS) technique can significantly reduce new interferences generated by reactive gases, through the use of an additional quadrupole filter in front of the CRC that excludes interfering ions from entering the cell (Yamada, 2015). The isotope dilution method is an efficient, highly accurate, and precise quantification method that overcomes the problems of matrix effects and recovery efficiency during analysis (Hwang and Jiang, 1997; Lee et al., 2011; Pickhardt et al., 2006; Song et al., 2019). Combining seaFAST with ICP-MS for the measurements of dissolved trace elements have been developed for several years. For precise and accurate analysis, high resolution ICP-MS (e.g., Thermo Fisher Element 2) was usually applied after preconcentration of trace metals by seaFAST (Behrens et al., 2016; Rapp et al., 2017; Vassileva et al., 2019; Wuttig et al., 2019). The newly developed triple quadrupole ICP-MS/MS offered a less expensive method to achieve trace metals analysis in seawater. Recently, Jackson et al. (2018) developed a method to analysis trace metals concentrations using seaFAST and an Agilent triple quadrupole ICP-MS/MS 8800 with 20−40 mL seawater. However, sample size of 20−40 mL required multiple loading times because of the 10 mL volume limit of sampling loop in seaFAST, and it is time consuming.
In this study, we present an alternative method for the rapid and accurate determination of six trace metals in seawater (10 mL) with an SPE-based automated seaFAST system and a Thermo Fisher triple quadrupole ICP-MS/MS iCAP TQ, Fe, Ni, Cu, Zn, Cd and Pb. The iCAP TQ coupled with an isotope dilution method was applied for determination and quantification. The accuracy and precision of the method were validated by analyzing the GEOTRACES intercalibration samples (GSC) and four certified reference materials (CASS-6, NASS-7, SLEW-3 and SLRs-6). The practicability of the method was validated by analysis of a full seawater column from the subtropical Northwest Pacific.
2.
Experiments
2.1
Reagents and materials
All experimental operations were conducted in class-100 high-efficiency particulate air filtered flow benches in a class-1000 trace metal clean laboratory at Shanghai Jiao Tong University. Ultrapure deionized water (18.2 MΩ·cm, Milli-Q), obtained from a Q-POD Element system (Merck, Germany) was used throughout the experiment. A multi-element standard solution containing the six elements (10 μg/L in 0.5 mol/L HNO3) was prepared from single standard stock solutions (ICP-MS grade, Inorganic Ventures, USA) with concentrations of 100 mg/L in 3% (v/v) HNO3. The enriched isotope spikes were prepared from purified mono-isotopic solutions of 57Fe, 62Ni, 65Cu, 67Zn, 110Cd and 207Pb, obtained from Isoflex USA. The buffer used in seaFAST is an ammonia-acetic acid buffer with a pH of 6.0±0.2. The reagents, including nitric acid (HNO3), hydrochloric acid (HCl), ammonia (NH3), and acetic acid, used in the experiment were optima grade and were purchased from Fisher Scientific. All plastic labware, such as low-density polyethylene (LDPE) bottles (Nalgene, USA), polyethylene centrifuge tubes (metal-free; VWR, China), and 4 mL×125 mL blocks LDPE backet (ESI, USA) were cleaned in a clean lab followed the description in Zhang et al. (2019b), by soaking in 2% Citranox (Alconox, China) detergent for 24 h, rinsing with ultrapure water (UPW) seven times, then soaking in a 10% HCl (tracemetal grade, Fisher Scientific) bath for seven days, rinsing with UPW seven times, and sealing inside three layers of plastic before use. The carrier gas (Ar) and collision/reaction gas (H2, He, NH3, and O2) for ICP-MS were ultra-pure grade (>99.999%) and purchased from a local supplier.
2.2
The seaFAST
2.2.1
The seaFAST settings
In this study, seawater samples were pretreated using an automatic solid-phase extraction device, the seaFAST S2 system (ESI, USA), to preconcentrate and remove the major ion matrix. An offline mode was chosen to acquire the preconcentration analytes for ICP-MS/MS. The sample preparation procedure and seaFAST settings are described as follows:
(1) Sample loading: 10 mL of sample was drawn into the quantification loop, and the sample and 1.0 mL buffer solution in the quantification loop were then mixed online into the sample pre-concentration column. The trace metals were selectively adsorbed by the chelating resin in the column, whereas the major ions were not.
(2) Matrix washing: The column was rinsed with a mixture of 0.5 mL buffer and 7.5 mL UPW to remove interfering ions and unchelated matrix major ions, such as Na, K, Mg and Cl.
(3) Column elution: 0.5 mL of eluent (0.5 mol/L HNO3) was used to elute the preconcentrated analytes from the column into the 4 mL×125 mL blocks LDPE backet.
(4) Column regeneration: The 1.0 mL buffer and 4.5 mL UPW were mixed online and passed through the column to balance the pH in preparation for the pre-concentration of the next sample.
2.2.2
The seaFAST sequence
Before each batch was run, 10% HCl and UPW were run as samples to prime the system and clean the pipeline, respectively, according to the process described in Section 2.2.1. The samples were ordered from the estimated lowest to highest concentration to reduce sample-cross contamination. UPW adjusted to pH 2 was added in triplicate every 10 samples to monitor the recovery efficiency and procedure blanks.
2.3
ICP-MS
A Thermo Fisher triple quadrupole ICP-MS/MS iCAP TQ instrument was used in this study. The iCAP TQ was equipped with CRC technology, which involves the adoption of various gases, such as H2, He, NH3 and O2. At the front end, the iCAP TQ was equipped with a baffled cyclonic quartz spray chamber using Peltier cooling technology, a C-flow s-Type PFA nebulizer with sample tubing for a flow rate of 50 μL/min (Savillex, USA), and an ESI-2DX autosampler (Elements Scientific Inc., USA). The general operating parameters are listed in Table 1. For each measurement, the ICP-MS/MS was auto-tuned to optimize the sensitivity and stability. A tuning solution with 10 μg/L 7Li, 59Co, 115In, 209Bi and 238U was applied to obtain the optimal instrument settings, such as the voltage of the CR bias, focus lens, D2 lens, and quad entry lens, as well as the CRC gas flow rate.
Table
1.
ICP-MS/MS operating conditions
Parameter
Operating condition
Focus lens/V
He mode: 1.25 NH3 mode: –0.5
D1 lens/V
–350
D2 lens/V
He mode: –148 NH3 mode: –147.5
CRC gas flow/(mL·min−1)
He mode: 4.0 NH3 mode: 0.22
Deflection lens/V
–30
Spray chamber temperature/°C
2.7
Peristaltic pump speed/(r·min−1)
40
Cool flow/(L·min−1)
14
Sampling depth/mm
5
Plasma power/W
1550
Auxiliary flow/(L·min−1)
0.8
Extraction lens/V
–120
Nebulizer flow/(L·min−1)
1.08
Note: CRC is abbreviation of collision/reaction cell.
Isotope dilution is a highly precise quantification method that can help to overcome some problems with quantification, including low recovery, matrix effects, and instrument fluctuations (Evans and Clough, 2005; Rottmann and Heumann, 1994). The reference isotopes used in this study were 56Fe, 60Ni, 63Cu, 66Zn, 114Cd and 208Pb, and the spike isotopes were 57Fe, 62Ni, 65Cu, 67Zn, 110Cd and 207Pb. The elements to be measured in the unknown samples have a natural isotope abundance ratio. When an enriched isotope (with a known abundance ratio) is spiked into the sample, the number of elements to be measured can be calculated according to the following formula (Kato et al., 1990):
where C is the metal concentration; M is the mass of the sample; MS is the mass of the added isotope spike; R is the measured isotope abundance ratio (refer to spike ratio); K is the ratio of natural and spike atomic masses (natural to spike); $f\ ^r_S $ is the abundance of reference isotope in the spike; $f\ ^S_S $ is the abundance of the spike isotope in the spike; $f\ ^r_n $ is the natural abundance of reference isotopes; and $f\ ^S_n $ is the natural abundance of spike isotope.
2.5
Reference materials
The reference materials, including SLEW-3, SLRs-6, CASS-6 and NASS-7, were purchased from the National Research Council, Canada. The intercalibration seawater sample GSC was obtained from the GEOTRACES program (an international study of the marine biogeochemical cycles of trace elements and their isotopes), through Moffett at the University of Southern California. Information and the consensus values for GSC intercalibration seawater sample (GEOTRACES coastal surface seawater) can be found at https://www.geotraces.org/standards-and-reference-materials/. A full water seawater column (11°00′N, 149°50′E) was collected from a GEOTRACES cruise GP09 (R/V Tan Kah Kee, April 25–October 6, 2019) in the subtropical Northwest Pacific. Seawater samples were taken from a trace-metal rosette equipped with 24 Teflon-coated OTE niskin bottles with a Teflon-coated external spring (Ocean Test Equipment, USA). Once on deck, the OTE niskin bottles were immediately transferred into a clean container, seawater samples were then filtered with a 0.2 μm capsule filter into a pre-cleaned 1 L LDPE bottle. All operations were performed according to standard procedures recommended by GEOTRACES.
3.
Results and discussion
3.1
Optimizing the ICP-MS settings
The goal of this study was to achieve the accurate and precise determination of six elements in a sample of small volume (0.5 mL, after seaFAST preconcentration). A smaller preconcentrated volume results in a larger enrichment factor for trace metal analysis. The iCAP TQ is equipped with a CRC, which is located between two quadrupoles (Q1-CRC-Q2, Q1 is the first quadrupole in front of CRC; Q2 is the second quadrupole behind CRC). The iCAP TQ has the capability to conduct the analysis between a single-quad (SQ) mode and a triple-quad (TQ) mode. It allows the application of a variety of combinations with different types of collision/reaction gases and analysis modes to achieve the best possible analysis. However, the combination of modes and gas affects the analytical duration and, thus, the analytical sample volume. The aim of the experiments reported in this section was to optimize the performance while reducing the analysis duration of the iCAP TQ ICP-MS. A combination of high sensitivity and low background equivalent concentrations (BECs) was considered optimal.
3.1.1
Effect of single and triple quad on sensitivity and BEC
Figure 1 shows the signal intensity and BEC in the TQ and SQ modes. Solutions with Fe, Ni, Cu, Zn, Cd and Pb at a concentration of 5 μg/L in 0.5 mol/L HNO3, and 10 μg/L Mo in 0.5 mol/L HNO3 were used for intensity and BEC tests, respectively. The isotopes selected for the six-element analysis were 56Fe, 60Ni, 63Cu, 66Zn, 114Cd, and 208Pb. Auto-tuning was performed in each mode. As shown in Fig.1, the TQ mode generally exhibited a better BEC compared to the SQ mode. The lower BEC resulted from its interference elimination capability, and is consistent with results from other studies (Jackson et al., 2018). However, when the CRC was pressurized with O2, many elements demonstrated a higher signal intensity and lower BEC in the TQ mode than in the SQ mode; for example, the sensitivity of Fe increased by 38% while BEC was reduced by 99%. The interference-removal capability is higher in TQ mode than in SQ mode, which improves the overall performance in TQ mode. For example, the TQ mode reduced the BEC of Fe determination to 16 ng/L, which is ~5 fold lower than that in SQ mode.
Figure
1.
Signal intensity and background equivalent concentration (BEC) of each element analyzed using ten different combinations of collision/reaction cell gases and single-quad/triple-quad modes. All modes are auto-tuned by the instrument before the experiment. N/A represents no gas; the cps means counts per second.
As shown in Fig. 1, five CRC modes, no gas, H2, He, NH3 and O2, were compared in this study. As the effect of CRC gas on sensitivity is similar in the SQ and TQ modes, and due to the lower BEC in TQ mode, only the behavior of each CRC gas in TQ mode is discussed. Usually, the introduction of CRC gas decreases the sensitivity, especially for reactive gases (Jackson et al., 2018). For example, the sensitivities of Ni, Cu, and Zn decreased by 57%–68% after pressurizing with NH3. H2 was found to decrease the signal intensity of Fe, Ni, Cu and Zn by 58%–97% and increase the sensitivity of Cd and Pb by 26%–87%. However, the sensitivity of Ni, Cu, Zn, Cd and Pb increased with the addition of He in this study using the iCAP TQ. The effect of oxygen as a CRC gas on the sensitivity was mostly suppressed, and the signal intensities of Fe, Ni, Cu, Zn and Cd were reduced, with the exception of Pb, which had an elevated intensity.
The interferences can be removed by pressurizing various gases into the CRC cell. Different types of gases have different effects on the interference for each element. The effects of the CRC gas on the BEC in the SQ and TQ modes are different, as shown in Fig. 1. The results demonstrate that the pressurized CRC gas increased the BEC level in SQ mode, and reduced the interference in TQ mode by generating a lower BEC level. Our results demonstrated that Q1 effectively filtered many ions in TQ mode, which prevented them from entering the CRC. Our results indicate that the CRC gases, including He, NH3, and O2, removed the interference successfully, thus lowering the BEC level. It is possible to combine the modes to generate an optimized system that analyzes all the elements; however, switching between different modes requires a longer extraction time and a higher sample volume. For a sample volume of 0.5 mL, two modes, TQ-NH3 for Fe and Cd and TQ-He for Ni, Cu, Zn, and Pb, were chosen for subsequent experiments.
3.1.3
Effect of CRC gas flow rate on sensitivity and interference removal
The flow rate of the CRC gas affected the sensitivity and interference removal. To examine the effect of He and NH3 flow rates on the sensitivity and interference removal, we measured the signal intensity and BEC in TQ mode for Fe and Cd with NH3 flow rates of 0.1 mL/min, 0.15 mL/min, 0.2 mL/min, 0.22 mL/min, 0.25 mL/min, 0.3 mL/min, 0.4 mL/min, 0.5 mL/min, 0.6 mL/min, 0.7 mL/min, 0.8 mL/min, 0.9 mL/min, 1.0 mL/min, 1.1 mL/min, 1.2 mL/min; and Ni, Cu, Zn, and Pb with He flow rates of 1.0 mL/min, 2.0 mL/min, 3.0 mL/min, 3.5 mL/min, 4.0 mL/min, 4.5 mL/min, 5.0 mL/min, 5.5 mL/min, 6.0 mL/min, 7.0 mL/min, 8.0 mL/min, 9.0 mL/min, 10.0 mL/min, 11.0 mL/min, 12.0 mL/min. The concentration of six elements for evaluation is 5 μg/L.
With both He and NH3 CRC gases, the sensitivity of the six elements increased with increasing flow rate, reaching a maximum and then decreasing as the flow rate continued to increase (Fig. 2). There was no obvious trend in the change in BEC with changing CRC gas flow rate. A balance between sensitivity, BEC, and the capability for multi-element analysis was sought to determine the optimal gas flow rate. In He mode, the highest sensitivities of Ni, Cu, and Zn correspond to a flow rate of 4.0 mL/min, while the highest sensitivity for Pb was observed at a flow rate of 5.5 mL/min. The BEC levels for Ni, Cu, and Zn did not change much when the flow rate was less than 8.0 mL/min, in contrast to that of Pb. Finally, a flow rate of 4.0 mL/min, which allows a high sensitivity and low BEC level, was chosen to use in He mode. In the NH3 mode, a lower flow rate markedly improved the sensitivity and reduced the BEC for Fe and Cd. The results suggested that the addition of NH3 nearly eliminated all interference from 98Mo16O+ on 114Cd. Nevertheless, when analyzing Fe, the BEC is significantly affected by the NH3 flow rate. Thus, a flow rate of 0.22 mL/min was chosen to minimize the interference and maintain a high sensitivity in the measurement of Fe, even though some sensitivity is sacrificed in the analysis of Cd.
Figure
2.
Effect of flow rate on the sensitivity and background equivalent concentration (BEC) of the analytical elements. Hollow circles and solid circles represent He and NH3, respectively, as the collision/reaction cell. The cps means counts per second.
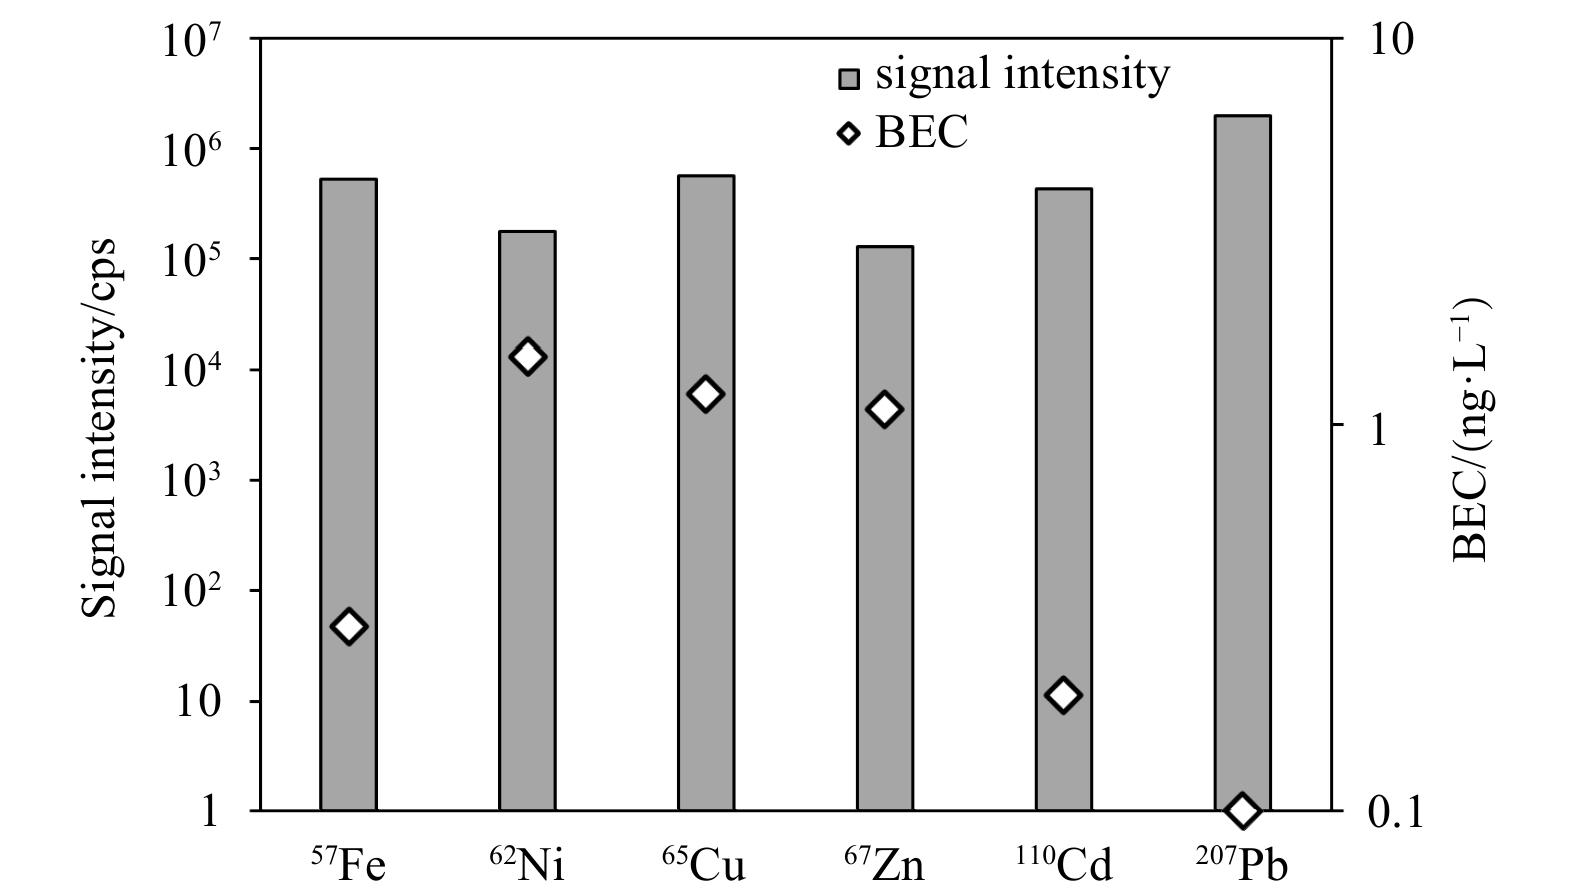
In this study, Fe, Ni, Cu, Zn, Cd and Pb were calculated by adding enriched 57Fe, 62Ni, 65Cu, 67Zn, 110Cd and 207Pb as isotope spikes. To obtain more accurate isotopic abundance ratios, the same modes were chosen to measure the signal intensity of the enriched isotopes. We used the optimized instrumental analysis mode to evaluate the signal intensity and BEC of the six enriched isotopes, with a flow rate of 0.22 mL/min NH3 in TQ mode for 57Fe and 110Cd, and a flow rate of 4.0 mL/min He in TQ mode for 62Ni, 65Cu, 67Zn, and 207Pb. The signals were measured from a solution containing six enriched isotopes at a concentration of 10 μg/L in the 0.5 mol/L HNO3 solution. As shown in Fig. 3, the selected modes achieved high signal intensity and low BEC, and met the requirements for the analysis of enriched isotopes.
Figure
3.
Signal intensities of 57Fe, 62Ni, 65Cu, 67Zn, 110Cd, and 207Pb in the enriched isotopes spiked at a concentration of 10 μg/L, as well as the background equivalent concentration (BEC) for each enriched isotope. The cps means counts per second.
The procedure blank was prepared from a mixture of 10 mL UPW and 10 μL of seawater from the surface of the tropical Northwest Pacific Ocean. Surface water was collected at the same location as for the full water column. The mixture was adjusted to pH 2 with ultrapure HCl to match the matrix of the seawater samples. The procedure blank samples were extracted by seaFAST and determined by isotope dilution using the same procedure as for the regular samples. The procedure blanks were monitored five times during a period of one month. In each instance, ten replicates were performed. The method detection limit (MDL) was defined as three times the standard deviation (3σ) of the procedure blank samples. The procedure blanks produced different results every time, which may be attributed to instrument fluctuations and sample processing. We used the average of the blanks and the MDL for five monitoring sessions in one month. As shown in Table 2, the levels in the procedure blank ranged from a minimum of 0.000 29 nmol/L for Cd to 0.13 nmol/L for Fe, and the MDL ranged from 0.13 nmol/L for Cd to 28 nmol/L for Fe. Our procedure blanks were comparable to those of previous studies, thus meeting the requirements for the analysis of trace metal concentrations in seawater, even for the extremely low concentrations found in the open ocean.
Table
2.
Procedure concentration blanks (nmol/L) and detection limits of this method
Four certified reference samples, including CASS-6, NASS-7, SLEW-3 and SLRs-6, from the National Research Council, Canada, and a consensus standard intercalibration seawater sample, GSC, from the GEOTRACES program, were analyzed to verify the accuracy of our method. As shown in Table 3. The results reported in this study for Fe, Ni, Cu, Zn, Cd and Pb agree with the certified values and are within the analytical uncertainty.
Table
3.
Fe, Ni, Cu, Zn, Cd and Pb concentrations analysis of standard materials
GSC, n=10
NASS-7, n=10
CASS-6, n=10
Measured value/(nmol·L−1)
Consensus value/(nmol·L−1)
Measured value/(μg·L−1)
Consensus value/(μg·L−1)
Measured value/(μg·L−1)
Consensus value/(μg·L−1)
Fe
1.554±0.115
1.535±0.115
0.337±0.029
0.351±0.026
1.60±0.09
1.56±0.12
Ni
4.261±0.024
4.393±0.205
0.244±0.007
0.248±0.018
0.420±0.002
0.418±0.040
Cu
1.240±0.024
1.099±0.149
0.198±0.004
0.199±0.001
0.541±0.003
0.530±0.032
Zn
1.498±0.024
1.433±0.103
0.44±0.01
0.42±0.08
1.30±0.09
1.27±0.18
Cd
0.386±0.004
0.364±0.022
0.016 3±0.000 3
0.016 1±0.001 6
0.021 3±0.000 8
0.021 7±0.001 8
Pb
0.041±0.001
0.039±0.004
0.002 9±0.000 1
0.002 6±0.000 8
0.010 7±0.000 9
0.010 6±0.004 0
SLEW-3, n=10
SLRs-6, n=10
Measured value/(μg·L−1)
Consensus value/(μg·L−1)
Measured value/(μg·L−1)
Consensus value/(μg·L−1)
Fe
0.595±0.012
0.569±0.059
86.3±1.1
84.3±3.6
Ni
1.31±0.01
1.23±0.07
0.619±0.044
0.616±0.022
Cu
1.54±0.07
1.55±0.12
22.4±0.3
23.9±1.8
Zn
0.165±0.006
0.201±0.037
1.80±0.07
1.76±0.12
Cd
0.049±0.001
0.048±0.004
0.006 3±0.002 2
0.006 3±0.001 4
Pb
0.008±0.000
0.009 0±0.001 4
0.180±0.002
0.17±0.026
Note: GSC is the abbreviation of GEOTRACES intercalibration samples.
3.4
Application to a full water column in the Northwest Pacific
This method was further validated using a full water column to examine the oceanic consistency from the GEOTRACES GP09 cruise in the subtropical Northwest Pacific. The vertical distribution of six metals from a full column at K9 (11°00′N, 149°50′E) is shown in Fig. 4, and all samples were processed using the method reported in this study. As shown in Fig. 4, all six metals exhibited a typical distribution in an oligotrophic ocean with good oceanic consistency (Jensen et al., 2019; Kuma et al., 2003; Mackey et al., 2002; Wu et al., 2010). To identify the robust of the method used in this study, the comparison profiles with nearby GEOTRACES cross stations were taken for Ni, Cu, Zn and Cd (29°59′N, 165°00′E; Zheng et al., 2021), for Fe and Pb reported by Boyle et al. (2005) and Jiang et al. (2021). For example, the dissolved Fe concentration was high at the surface due to the atmospheric deposition, exhibited a minimum in the subsurface layer close to the depth of the chlorophyll maximum layer, then reached a maximum value at medium depth (500–1 500 m, 0.61–0.70 nmol/L), and then decreased as the depth increased (>1 500 m, 0.38−0.60 nmol/L). Dissolved Zn, Cu, Ni and Cd exhibited typical nutrient-type distributions, with minimum concentrations at the surface due to biological uptake and increases in concentration with depth due to remineralization. The slightly shallower Zn, Cu, Ni and Cd maximum in the intermedium depth at Station K9 than the northern station (29°59′N, 165°00′E; Zheng et al., 2021) that is coincidence with a shallower North Pacific intermediate low oxygen water in the edge of the subtropical gyre at Station K9. The concentration of dissolved Pb was low in surface water (24 pmol/L at 15 m). It increased with depth from 15–200 m (24–64 pmol/L), and then decreased with depth. The Pb distribution pattern in the upper Northwest Pacific Ocean is in agreement with the observations by Zheng et al. (2019), and the deep water Pb distribution was consistence with the data reported by Boyle et al. (2005).
Figure
4.
Vertical profiles of dissolved Fe, Zn, Pb, Ni, Cu and Cd in the subtropical Northwest Pacific (GEOTRACES GP09; Station K9, 11°00′N, 149°50′E). The comparison profiles were taken from the nearby GEOTRACES cross station (29°59′N, 165°00′E) for Zn, Ni, Cu, and Cd (Zheng et al., 2021), Fe and Pb were from the previous literature in the North Pacific reported by Boyle et al. (2005) and Jiang et al. (2021).
In this study, a high-precision, accurate, fast, and automated analysis method for dissolved Fe, Ni, Cu, Zn, Cd and Pb in seawater was developed. This method combined a seaFAST offline pre-concentration system, ICP-MS/MS, and quantification by isotope dilution spectrometry. To improve the performance of the ICP-MS method, the optimum gases and flow rates, NH3 with a flow rate of 0.22 mL/min and He with a flow rate of 4.0 mL/min, were found to significantly reduce interference during the determination of six elements while maintaining high sensitivities. The procedure blanks and MDLs were low, which indicated that the method is suitable for the analysis of open ocean seawater samples. Our results agree with the GEOTRACES consensus standard GSC and four reference materials (CASS-6, NASS-7, SLEW-3 and SLRs-6). This method provides a way to measure six trace metals in 10 mL seawater with only a one-step seaFAST pretreatment. The automation, high throughput, and small sample volume requirements of this method make it an effective way for laboratories to quickly and accurately obtain multi-element data from seawater.
Acknowledgements
We would like to thank ThermoFisher Scientific Corp. for their generosity in providing us with the ICAP TQ ICP-MS for conducting this study. This work was also supported by the Shanghai Frontiers Science Center of Polar Science.
Almeida C, Vasconcelos M, Barbaste M, et al. 2002. ICP-MS multi-element analysis of wine samples—a comparative study of the methodologies used in two laboratories. Analytical and Bioanalytical Chemistry, 374(2): 314–322. doi: 10.1007/s00216-002-1467-8
[2]
AlSuhaimi A O, AlRadaddi S M, Ali A K A S, et al. 2019. Silica-based chelating resin bearing dual 8-Hydroxyquinoline moieties and its applications for solid phase extraction of trace metals from seawater prior to their analysis by ICP-MS. Arabian Journal of Chemistry, 12(3): 360–369. doi: 10.1016/j.arabjc.2017.10.006
[3]
An B, Can S Z, Bakırdere S. 2020. Traceable and accurate quantification of iron in seawater using isotope dilution calibration strategies by triple quadrupole ICP-MS/MS: characterization measurements of iron in a candidate seawater CRM. Talanta, 209: 120503. doi: 10.1016/j.talanta.2019.120503
[4]
Behrens M K, Muratli J, Pradoux C, et al. 2016. Rapid and precise analysis of rare earth elements in small volumes of seawater—Method and intercomparison. Marine Chemistry, 186: 110–120. doi: 10.1016/j.marchem.2016.08.006
[5]
Bianchi F, Careri M, Maffini M, et al. 2003. Use of experimental design for optimisation of the cold plasma ICP-MS determination of lithium, aluminum and iron in soft drinks and alcoholic beverages. Rapid Communications in Mass Spectrometry, 17(3): 251–256. doi: 10.1002/rcm.907
[6]
Biller D V, Bruland K W. 2012. Analysis of Mn, Fe, Co, Ni, Cu, Zn, Cd, and Pb in seawater using the Nobias-chelate PA1 resin and magnetic sector inductively coupled plasma mass spectrometry (ICP-MS). Marine Chemistry, 130–131: 12–20
[7]
Boyle E A, Bergquist B A, Kayser R A, et al. 2005. Iron, manganese, and lead at Hawaii Ocean Time-series Station ALOHA: temporal variability and an intermediate water hydrothermal plume. Geochimica et Cosmochimica Acta, 69(4): 933–952. doi: 10.1016/j.gca.2004.07.034
[8]
de Jong J, Schoemann V, Lannuzel D, et al. 2008. High-accuracy determination of iron in seawater by isotope dilution multiple collector inductively coupled plasma mass spectrometry (ID-MC-ICP-MS) using nitrilotriacetic acid chelating resin for pre-concentration and matrix separation. Analytica Chimica Acta, 623(2): 126–139. doi: 10.1016/j.aca.2008.06.013
[9]
Evans E H, Clough R. 2005. Isotope dilution analysis. In: Worsfold P, Townshend A, eds. Encyclopedia of Analytical Science. 2nd ed. Amsterdam: Elsevier, 545–553
[10]
Firdaus M L, Norisuye K, Sato T, et al. 2007. Preconcentration of Zr, Hf, Nb, Ta and W in seawater using solid-phase extraction on TSK-8-hydroxyquinoline resin and determination by inductively coupled plasma-mass spectrometry. Analytica Chimica Acta, 583(2): 296–302. doi: 10.1016/j.aca.2006.10.033
[11]
Freslon N, Bayon G, Birot D, et al. 2011. Determination of rare earth elements and other trace elements (Y, Mn, Co, Cr) in seawater using Tm addition and Mg(OH)2 co-precipitation. Talanta, 85(1): 582–587. doi: 10.1016/j.talanta.2011.04.023
[12]
He Man, Huang Lijin, Zhao Bingshan, et al. 2017. Advanced functional materials in solid phase extraction for ICP-MS determination of trace elements and their species—A review. Analytica Chimica Acta, 973: 1–24. doi: 10.1016/j.aca.2017.03.047
[13]
Hwang T J, Jiang S J. 1997. Determination of trace amounts of zinc in water samples by flow injection isotope dilution inductively coupled plasma mass spectrometry. Analyst, 122(3): 233–237. doi: 10.1039/a606577e
[14]
Jackson S L, Spence J, Janssen D J, et al. 2018. Determination of Mn, Fe, Ni, Cu, Zn, Cd and Pb in seawater using offline extraction and triple quadrupole ICP-MS/MS. Journal of Analytical Atomic Spectrometry, 33(2): 304–313. doi: 10.1039/C7JA00237H
[15]
Janssen D J, Sieber M, Ellwood M J, et al. 2020. Trace metal and nutrient dynamics across broad biogeochemical gradients in the Indian and Pacific sectors of the Southern Ocean. Marine Chemistry, 221: 103773. doi: 10.1016/j.marchem.2020.103773
[16]
Jensen L T, Wyatt N J, Twining B S, et al. 2019. Biogeochemical cycling of dissolved zinc in the western Arctic (Arctic GEOTRACES GN01). Global Biogeochemical Cycles, 33(3): 343–369. doi: 10.1029/2018GB005975
[17]
Jiang Shuo, Zhang Jing, Zhang Ruifeng, et al. 2018. Dissolved lead in the East China Sea with implications for impacts of marginal seas on the open ocean through cross-shelf exchange. Journal of Geophysical Research, 123(8): 6004–6018. doi: 10.1029/2018JC013955
[18]
Jiang Shuo, Zhang Jing, Zhou Hui, et al. 2021. Concentration of dissolved lead in the upper northwestern Pacific Ocean. Chemical Geology, 577: 120275. doi: 10.1016/j.chemgeo.2021.120275
[19]
Kato T, Nakamura S, Morita M. 1990. Determination of nickel, copper, zinc, silver, cadmium and lead in seawater by isotope dilution inductively coupled plasma mass spectrometry. Analytical Sciences, 6(4): 623–626. doi: 10.2116/analsci.6.623
[20]
Komjarova I, Blust R. 2006. Comparison of liquid-liquid extraction, solid-phase extraction and co-precipitation preconcentration methods for the determination of cadmium, copper, nickel, lead and zinc in seawater. Analytica Chimica Acta, 576(2): 221–228. doi: 10.1016/j.aca.2006.06.002
[21]
Kuma K, Isoda Y, Nakabayashi S. 2003. Control on dissolved iron concentrations in deep waters in the western North Pacific: Iron(III) hydroxide solubility. Journal of Geophysical Research, 108(C9): 3289. doi: 10.1029/2002JC001481
[22]
Lee J M, Boyle E A, Echegoyen-Sanz Y, et al. 2011. Analysis of trace metals (Cu, Cd, Pb, and Fe) in seawater using single batch nitrilotriacetate resin extraction and isotope dilution inductively coupled plasma mass spectrometry. Analytica Chimica Acta, 686(1−2): 93–101. doi: 10.1016/j.aca.2010.11.052
[23]
Li Li, Wang Xiaojing, Liu Jihua, et al. 2017. Dissolved trace metal (Cu, Cd, Co, Ni, and Ag) distribution and Cu speciation in the southern Yellow Sea and Bohai Sea, China. Journal of Geophysical Research, 122(2): 1190–1205. doi: 10.1002/2016JC012500
[24]
Liao Wen-Hsuan, Takano S, Yang Shun-Chung, et al. 2020. Zn isotope composition in the water column of the northwestern Pacific Ocean: the importance of external sources. Global Biogeochemical Cycles, 34(1): e2019GB006379
[25]
Mackey D J, O’Sullivan J E, Watson R J, et al. 2002. Trace metals in the western Pacific: temporal and spatial variability in the concentrations of Cd, Cu, Mn and Ni. Deep-Sea Research Part I: Oceanographic Research Papers, 49(12): 2241–2259. doi: 10.1016/S0967-0637(02)00124-3
[26]
Masson P, Vives A, Orignac D, et al. 2000. Influence of aerosol desolvation from the ultrasonic nebulizer on the matrix effect in axial view inductively coupled plasma atomic emission spectrometry. Journal of Analytical Atomic Spectrometry, 15(5): 543–547. doi: 10.1039/a909651e
[27]
Nishioka J, Obata H. 2017. Dissolved iron distribution in the western and central subarctic Pacific: HNLC water formation and biogeochemical processes. Limnology and Oceanography, 62(5): 2004–2022. doi: 10.1002/lno.10548
[28]
Norisuye K, Ezoe M, Nakatsuka S, et al. 2007. Distribution of bioactive trace metals (Fe, Co, Ni, Cu, Zn and Cd) in the Sulu Sea and its adjacent seas. Deep-Sea Research Part II: Topical Studies in Oceanography, 54(1−2): 14–37. doi: 10.1016/j.dsr2.2006.04.019
[29]
Pickhardt C, Izmer A V, Zoriy M V, et al. 2006. On-line isotope dilution in laser ablation inductively coupled plasma mass spectrometry using a microflow nebulizer inserted in the laser ablation chamber. International Journal of Mass Spectrometry, 248(3): 136–141. doi: 10.1016/j.ijms.2005.11.001
[30]
Rapp I, Schlosser C, Rusiecka D, et al. 2017. Automated preconcentration of Fe, Zn, Cu, Ni, Cd, Pb, Co, and Mn in seawater with analysis using high-resolution sector field inductively-coupled plasma mass spectrometry. Analytica Chimica Acta, 976: 1–13. doi: 10.1016/j.aca.2017.05.008
[31]
Rimskaya-Korsakova M N, Berezhnaya E D, Dubinin A V. 2017. Analysis of molybdenum, tungsten, and vanadium in surface water of the Atlantic Ocean using solid phase extraction with 8-hydroxyquinoline and ICP MS determination. Oceanology, 57(4): 530–538. doi: 10.1134/S0001437017040154
[32]
Rottmann L, Heumann K G. 1994. Development of an on-line isotope dilution technique with HPLC/ICP-MS for the accurate determination of elemental species. Fresenius’ Journal of Analytical Chemistry, 350(4): 221–227
[33]
Sohrin Y, Urushihara S, Nakatsuka S, et al. 2008. Multielemental determination of GEOTRACES key trace metals in seawater by ICPMS after preconcentration using an ethylenediaminetriacetic acid chelating resin. Analytical Chemistry, 80(16): 6267–6273. doi: 10.1021/ac800500f
[34]
Song Panshu, Wang Jun, Chao Jingbo, et al. 2019. Accurate determination of trace molybdenum in drinking water by isotope dilution inductively coupled plasma mass spectrometry. Analytical Sciences, 35(7): 807–809. doi: 10.2116/analsci.19N010
[35]
Sunda W G. 2012. Feedback interactions between trace metal nutrients and phytoplankton in the ocean. Frontiers in Microbiology, 3: 304
[36]
Trueman C N, Rodgers K J, McLellan I S, et al. 2019. Geochemistry| Inorganic. In: Worsfold P, Poole C F, Townshend A, et al., eds. Encyclopedia of Analytical Science. 3rd ed. Cambridge: Elsevier, 271–282
[37]
Vassileva E, Wysocka I, Orani A M, et al. 2019. “Off-line preconcentration and inductively coupled plasma sector field mass spectrometry simultaneous determination of Cd, Co, Cu, Mn, Ni, Pb and Zn mass fractions in seawater: procedure validation. Spectrochimica Acta Part B: Atomic Spectroscopy, 153: 19–27. doi: 10.1016/j.sab.2019.01.001
[38]
Vegueria S F J, Godoy J M, de Campos R C, et al. 2013. Trace element determination in seawater by ICP-MS using online, offline and bath procedures of preconcentration and matrix elimination. Microchemical Journal, 106: 121–128. doi: 10.1016/j.microc.2012.05.032
[39]
Warnken K W, Tang Degui, Gill G A, et al. 2000. Performance optimization of a commercially available iminodiacetate resin for the determination of Mn, Ni, Cu, Cd and Pb by on-line preconcentration inductively coupled plasma-mass spectrometry. Analytica Chimica Acta, 423(2): 265–276. doi: 10.1016/S0003-2670(00)01137-5
[40]
Wu Jingfeng. 2007. Determination of picomolar iron in seawater by double Mg(OH)2 precipitation isotope dilution high-resolution ICPMS. Marine Chemistry, 103(3–4): 370–381. doi: 10.1016/j.marchem.2006.10.006
[41]
Wu Jingfeng, Rember R, Jin Meibin, et al. 2010. Isotopic evidence for the source of lead in the North Pacific abyssal water. Geochimica et Cosmochimica Acta, 74(16): 4629–4638. doi: 10.1016/j.gca.2010.05.017
[42]
Wuttig K, Townsend A T, van der Merwe P, et al. 2019. Critical evaluation of a seaFAST system for the analysis of trace metals in marine samples. Talanta, 197: 653–668. doi: 10.1016/j.talanta.2019.01.047
[43]
Yamada N. 2015. Kinetic energy discrimination in collision/reaction cell ICP-MS: theoretical review of principles and limitations. Spectrochimica Acta Part B: Atomic Spectroscopy, 110: 31–44. doi: 10.1016/j.sab.2015.05.008
[44]
Zhang Ruifeng, Jensen L T, Fitzsimmons J N, et al. 2019a. Dissolved cadmium and cadmium stable isotopes in the western Arctic Ocean. Geochimica et Cosmochimica Acta, 258: 258–273. doi: 10.1016/j.gca.2019.05.028
[45]
Zhang Ruifeng, Zhu Xunchi, Yang Chenghao, et al. 2019b. Distribution of dissolved iron in the Pearl River (Zhujiang) Estuary and the northern continental slope of the South China Sea. Deep-Sea Research Part II: Topical Studies in Oceanography, 167: 14–24. doi: 10.1016/j.dsr2.2018.12.006
[46]
Zheng Linjie, Minami T, Konagaya W, et al. 2019. Distinct basin-scale-distributions of aluminum, manganese, cobalt, and lead in the North Pacific Ocean. Geochimica et Cosmochimica Acta, 254: 102–121. doi: 10.1016/j.gca.2019.03.038
[47]
Zheng Linjie, Minami T, Takano S, et al. 2021. Sectional distribution patterns of Cd, Ni, Zn, and Cu in the North Pacific Ocean: relationships to nutrients and importance of scavenging. Global Biogeochemical Cycles, 35(7): e2020GB006558
Figure 1. Signal intensity and background equivalent concentration (BEC) of each element analyzed using ten different combinations of collision/reaction cell gases and single-quad/triple-quad modes. All modes are auto-tuned by the instrument before the experiment. N/A represents no gas; the cps means counts per second.
Figure 2. Effect of flow rate on the sensitivity and background equivalent concentration (BEC) of the analytical elements. Hollow circles and solid circles represent He and NH3, respectively, as the collision/reaction cell. The cps means counts per second.
Figure 3. Signal intensities of 57Fe, 62Ni, 65Cu, 67Zn, 110Cd, and 207Pb in the enriched isotopes spiked at a concentration of 10 μg/L, as well as the background equivalent concentration (BEC) for each enriched isotope. The cps means counts per second.
Figure 4. Vertical profiles of dissolved Fe, Zn, Pb, Ni, Cu and Cd in the subtropical Northwest Pacific (GEOTRACES GP09; Station K9, 11°00′N, 149°50′E). The comparison profiles were taken from the nearby GEOTRACES cross station (29°59′N, 165°00′E) for Zn, Ni, Cu, and Cd (Zheng et al., 2021), Fe and Pb were from the previous literature in the North Pacific reported by Boyle et al. (2005) and Jiang et al. (2021).


 DownLoad:


 DownLoad:


 DownLoad: