Xiaomin Chang, Longchun Ye, Guangyu Zuo, Jingyue Li, Keyu Wei, Yinke Dou. Characteristics of sea ice kinematics from the marginal ice zone to the packed ice zone observed by buoys deployed during the 9th Chinese Arctic Expedition[J]. Acta Oceanologica Sinica, 2022, 41(7): 113-127. doi: 10.1007/s13131-022-1990-8
Citation:
Xiaomin Chang, Longchun Ye, Guangyu Zuo, Jingyue Li, Keyu Wei, Yinke Dou. Characteristics of sea ice kinematics from the marginal ice zone to the packed ice zone observed by buoys deployed during the 9th Chinese Arctic Expedition[J]. Acta Oceanologica Sinica, 2022, 41(7): 113-127. doi: 10.1007/s13131-022-1990-8
Xiaomin Chang, Longchun Ye, Guangyu Zuo, Jingyue Li, Keyu Wei, Yinke Dou. Characteristics of sea ice kinematics from the marginal ice zone to the packed ice zone observed by buoys deployed during the 9th Chinese Arctic Expedition[J]. Acta Oceanologica Sinica, 2022, 41(7): 113-127. doi: 10.1007/s13131-022-1990-8
Citation:
Xiaomin Chang, Longchun Ye, Guangyu Zuo, Jingyue Li, Keyu Wei, Yinke Dou. Characteristics of sea ice kinematics from the marginal ice zone to the packed ice zone observed by buoys deployed during the 9th Chinese Arctic Expedition[J]. Acta Oceanologica Sinica, 2022, 41(7): 113-127. doi: 10.1007/s13131-022-1990-8
Characteristics of sea ice kinematics from the marginal ice zone to the packed ice zone observed by buoys deployed during the 9th Chinese Arctic Expedition
College of Water Resources Science and Engineering, Taiyuan University of Technology, Taiyuan 030024, China
2.
College of Electrical and Power Engineering, Taiyuan University of Technology, Taiyuan 030024, China
Funds:
The National Key Research and Development Program of China under contract No. 2016YFC1402702; the Basic Research Program of Shanxi Province under contract No. 202103021224054.
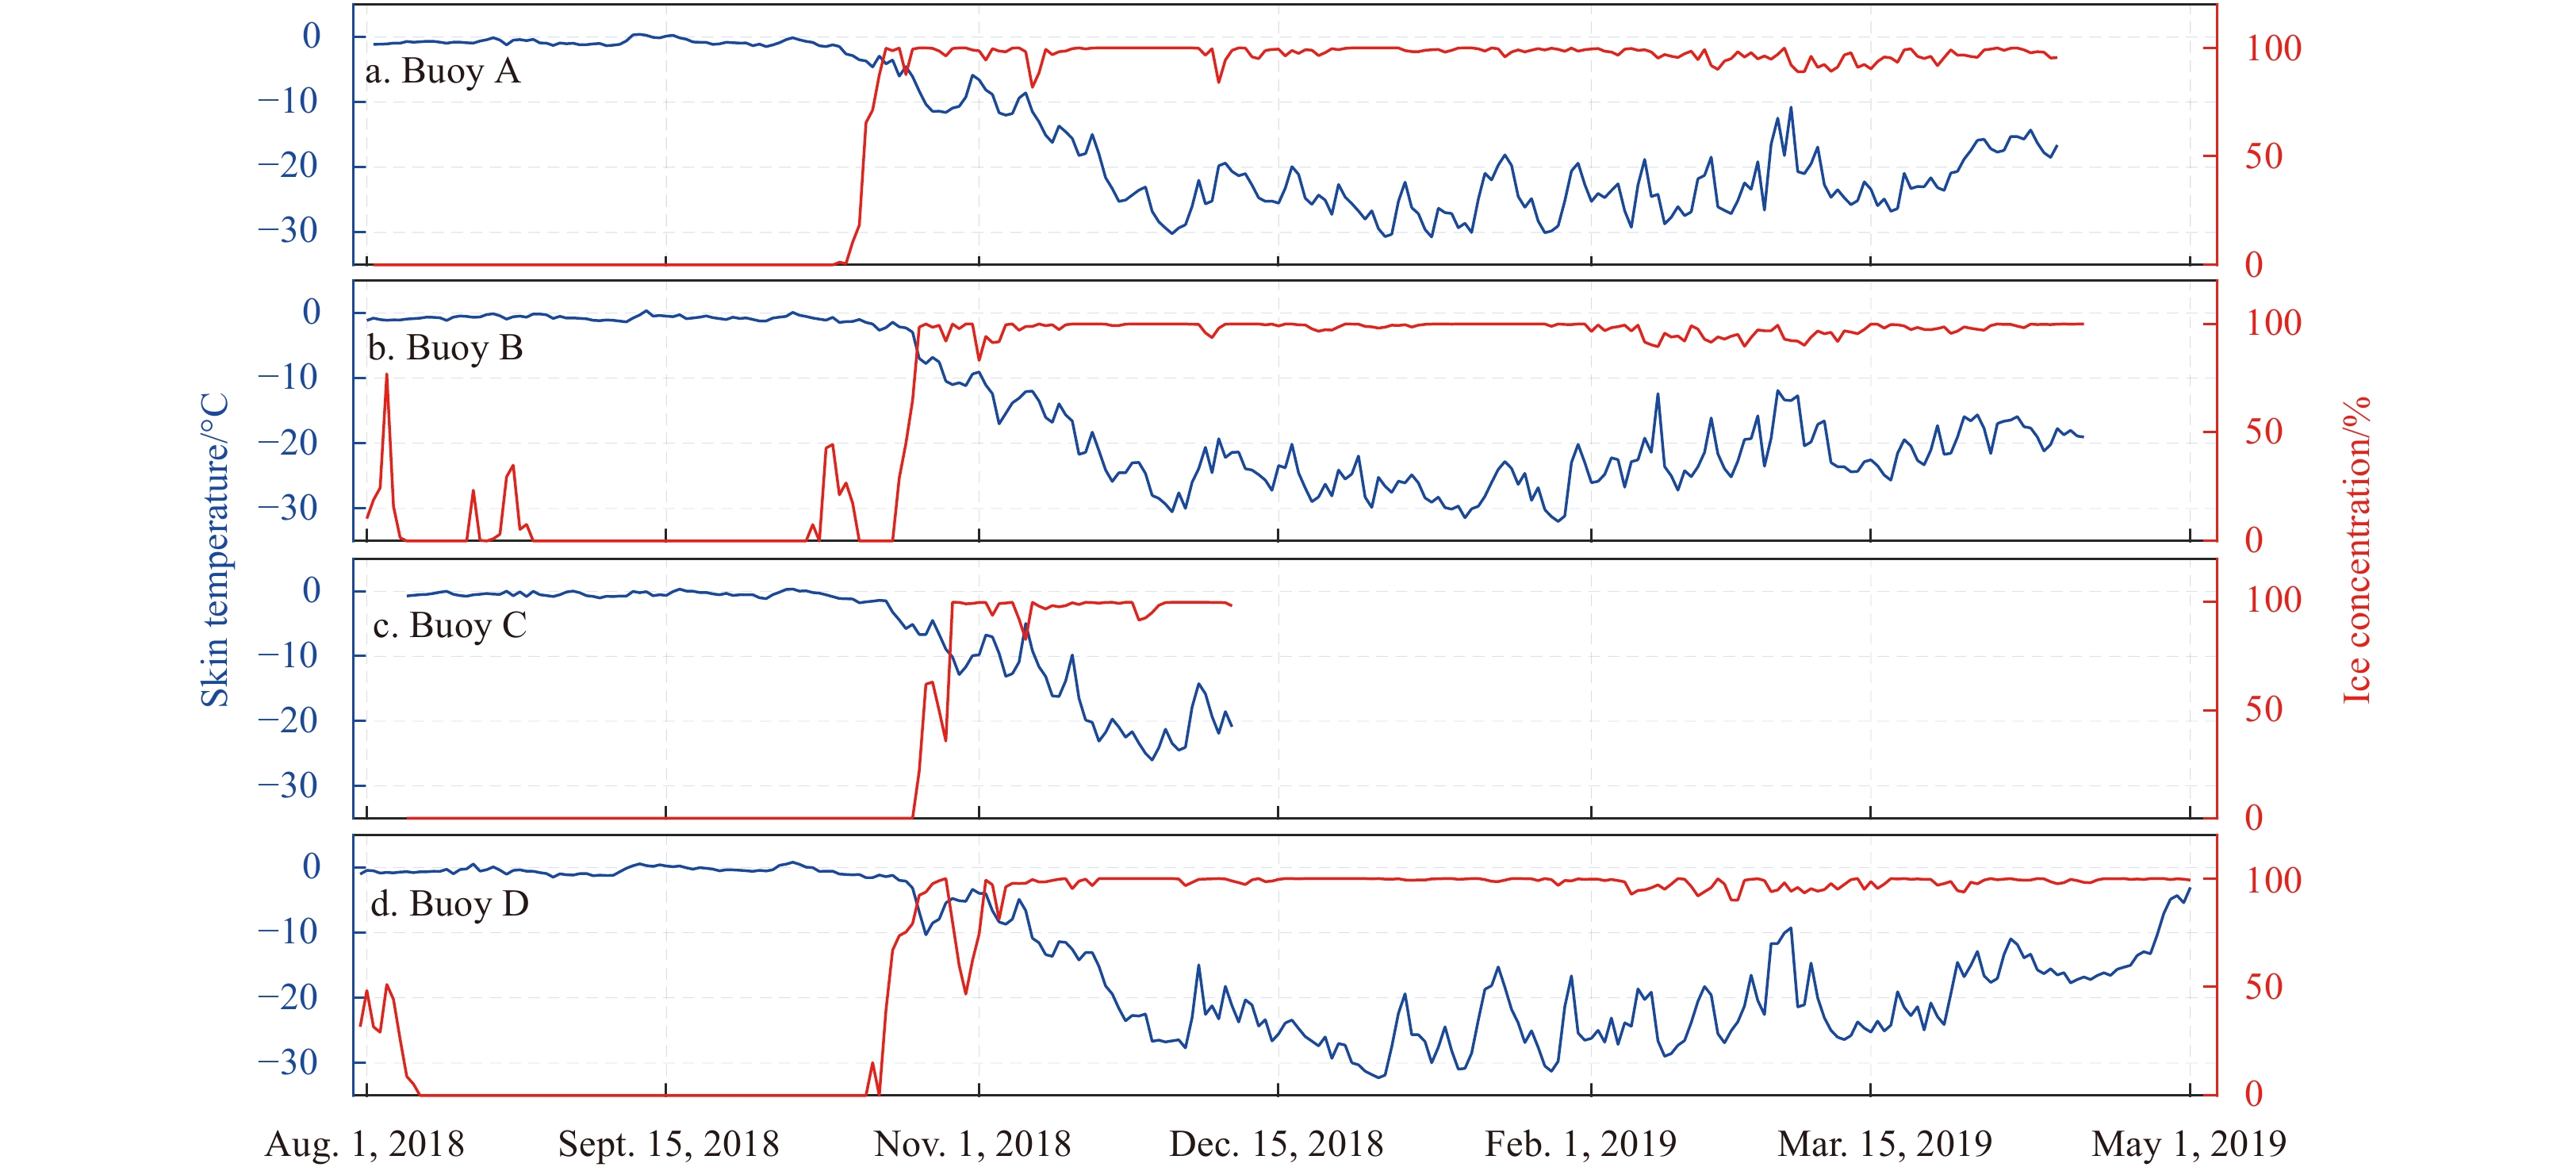
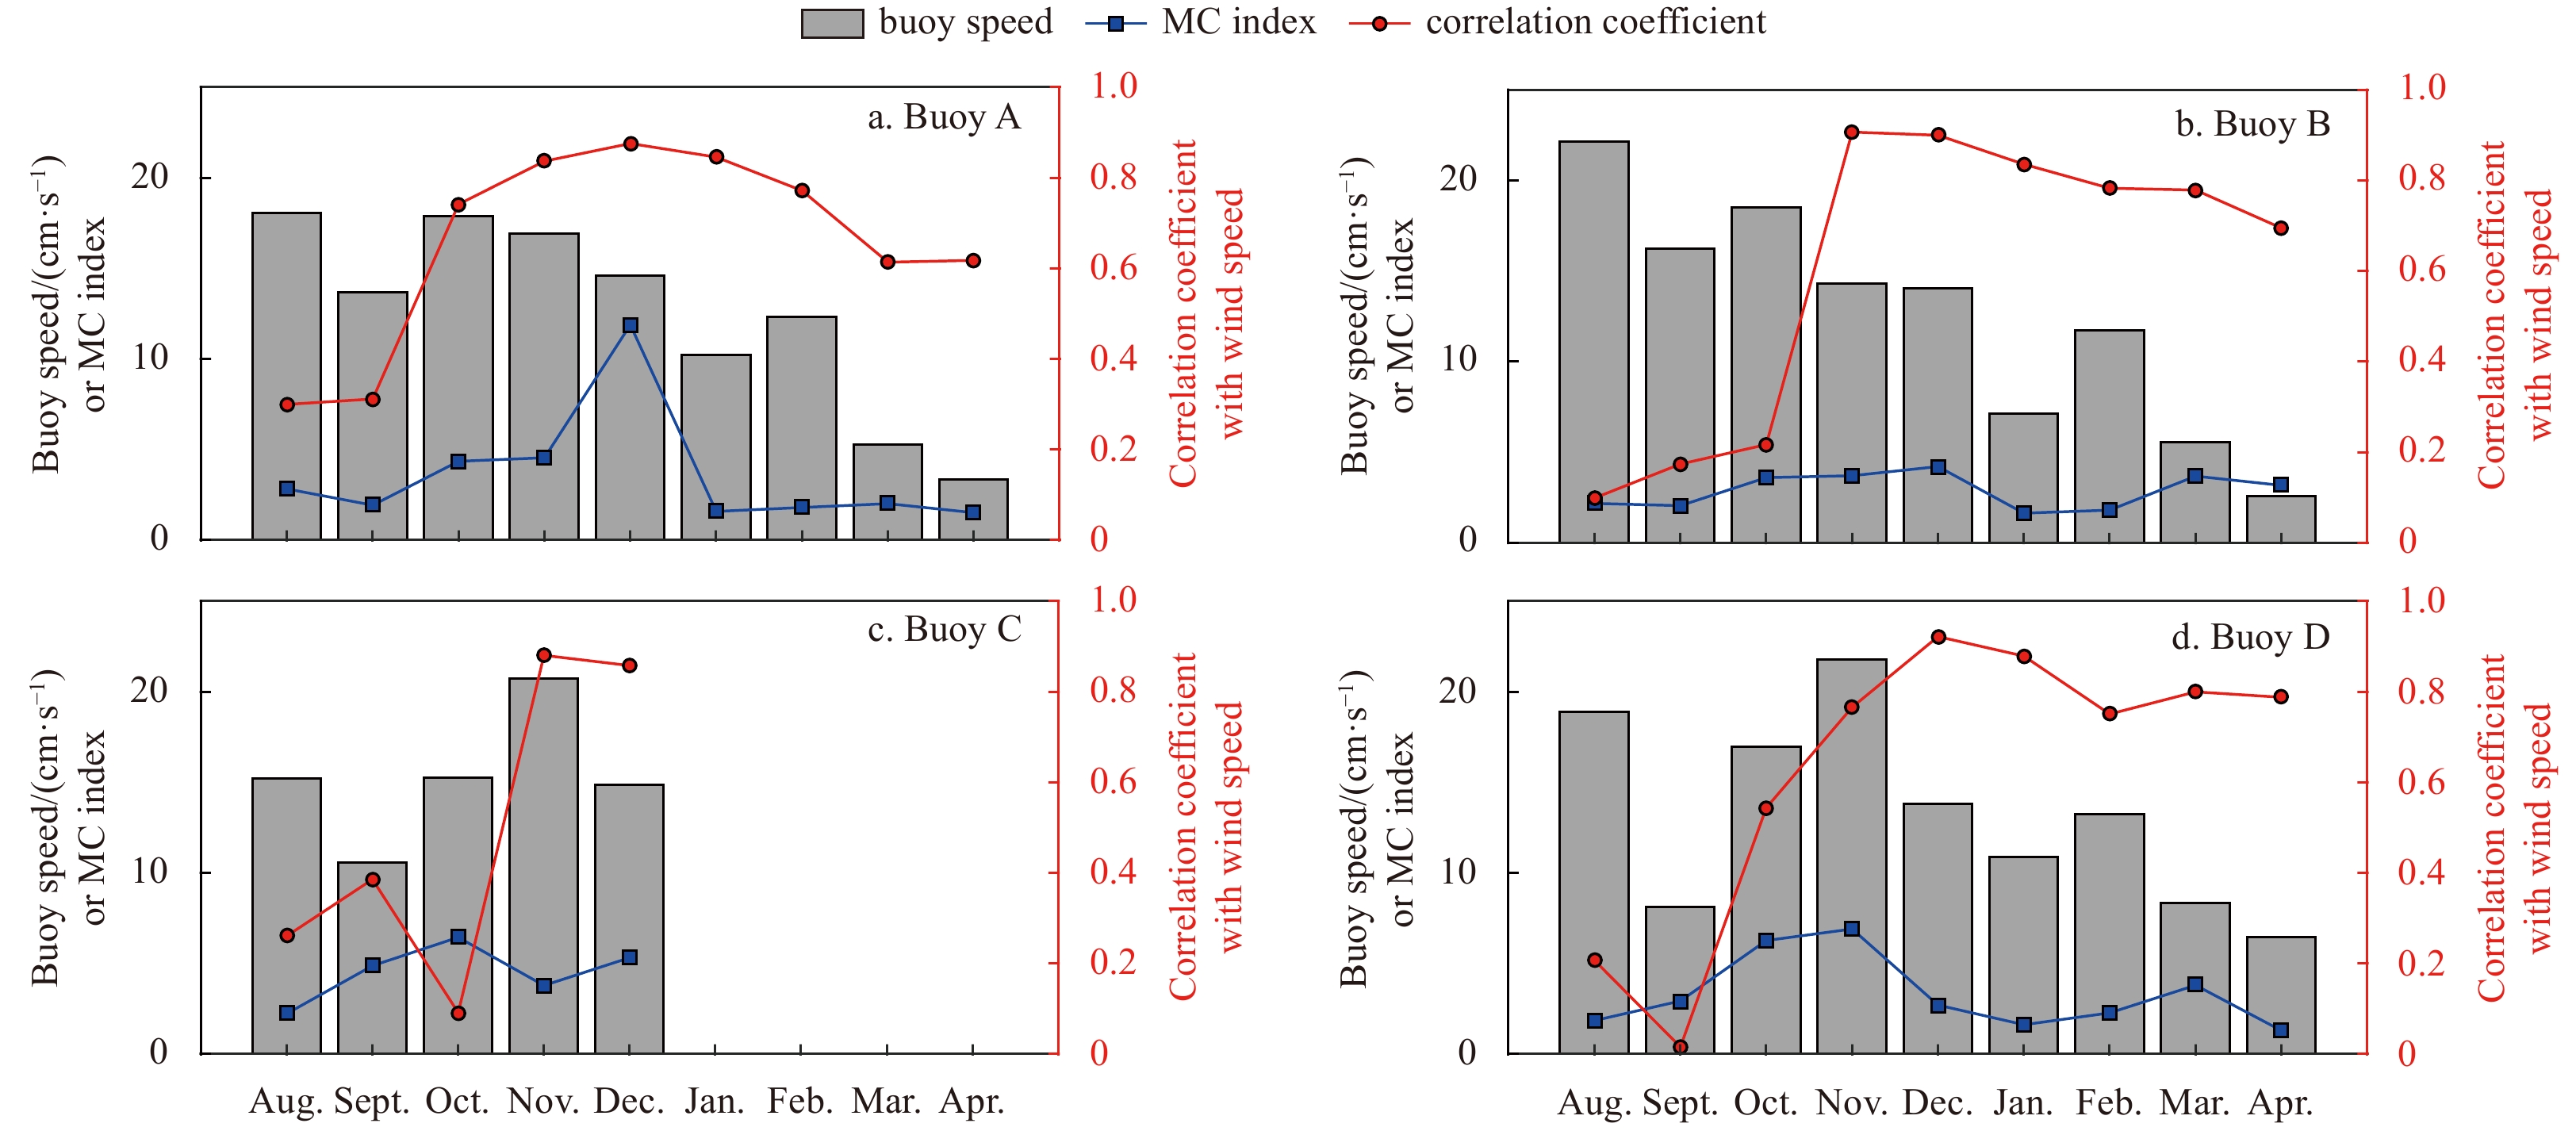
Sea ice growth and consolidation play a significant role in heat and momentum exchange between the atmosphere and the ocean. However, few in situ observations of sea ice kinematics have been reported owing to difficulties of deployment of buoys in the marginal ice zone (MIZ). To investigate the characteristics of sea ice kinematics from MIZ to packed ice zone (PIZ), eight drifting buoys designed by Taiyuan University of Technology were deployed in the open water at the ice edge of the Canadian Basin. Sea ice near the buoy constantly increased as the buoy drifted, and the kinematics of the buoy changed as the buoy was frozen into the ice. This process can be determined using sea ice concentration, sea skin temperature, and drift speed of buoy together. Sea ice concentration data showed that buoys entered the PIZ in mid-October as the ice grew and consolidated around the buoys, with high amplitude, high frequency buoy motions almost ceasing. Our results confirmed that good correlation coefficient in monthly scale between buoy drift and the wind only happened in the ice zone. The correlation coefficient between buoys and wind was below 0.3 while the buoys were in open water. As buoys entered the ice zone, the buoy speed was normally distributed at wind speeds above 6 m/s. The buoy drifted mainly to the right of the wind within 45° at wind speeds above 8 m/s. During further consolidation of the ice in MIZ, the direct forcing on the ice through winds will be lessened. The correlation coefficient value increased to 0.9 in November, and gradually decreased to 0.7 in April.
Magmatism at mid-ocean ridges is one of our planet’s most important geological processes as it forms the oceanic crust, which covers nearly two-thirds of the Earth’s surface. Unlike fast spreading ridges, it is widely accepted that ultraslow–spreading ridges have relatively low extents of melting and magmatism, thinner crust, and experience limited crustal processes (Dick, 1989). Although ultraslow–spreading ridges are characterized by low magma supplies, there is also evidence of substantial magmatic processes in magma reservoirs, rather than the stable magma chambers present under some segments (Dick et al., 2003; Coogan et al., 2001; Jian et al., 2017). Until now, how magmas behave in the crust and how the thermal and dynamic regimes of the magma reservoirs and conduit systems effect the eruption mechanism of magmas from ultraslow mid-ocean ridges (MORs) has received comparatively little attention. As the product of erupted magma, mid-ocean ridge basalts (MORBs) can provide information about the magmatism under ridges (Yang et al., 2013). Therefore, unraveling the chemical effects of magmatic processes reflected by the MORBs is key to determining the details of the magma plumbing system beneath ultraslow oceanic spreading centers.
Previous studies have mainly focused on the whole–rock geochemical and isotopic compositions of MORBs from ultraslow–spreading ridges (Dick et al., 2003; Yang et al., 2013, 2017). However, whole–rock geochemistry cannot provide information about the magmatic processes occurring within the crust, which we are attempting to understand, because the bulk–rock compositions of MORBs reflect the variable overprinting of the low–pressure differentiation of mantle–derived primary liquids (Stolper, 1980; Yang et al., 2013). Unlike whole–rock compositions, the major and trace element contents of plagioclase phenocrysts are easily preserved and are sensitive to the physicochemical conditions of the melt from which they crystallized (Ginibre et al., 2004; Mollo et al., 2011; Mutch et al., 2019; Bennett et al., 2019). Their geochemical compositions and morphology are commonly used to obtain information about the conditions of the magmatic system from which they crystallized. For example, Mutch et al. (2019) established an element diffusion model for plagioclase to constrain the timescales of magmatic processes. Bennett et al. (2019) demonstrated that various plagioclase textures in mid–ocean ridge basalts can be used as indicators of various magmatic processes. In addition, the composition of plagioclase can provide information about the conditions of the magmatic system, such as the water content, temperature, and melt composition (Hellevang and Pedersen, 2008; Lange et al., 2013; Coote and Shane, 2016). These conditions are related to magma mixing, fractional crystallization, and assimilation processes. Therefore, plagioclase phenocrysts have the potential to record a magmatic history that might be obscured at the whole–rock geochemical scale. However, compared with continental and other oceanic settings, plagioclase phenocrysts are still underutilized in the study of MORBs from ultraslow spreading ridges.
In recent years, the China Ocean Mineral Resources R&D Association (COMRA) has provided support for scientific expeditions to the Southwest Indian Ridge (SWIR), during which a large number of new samples were collected (Tao et al., 2012). Among the various types of MORBs, plagioclase ultraphyric basalts (PUBs), defined by Cullen et al. (1989), are valuable due to their high plagioclase contents (10%–54%). These plagioclase phenocrysts contain unique information about crustal processes and the characteristics of the magmatic array present in the lower oceanic crust (Hellevang and Pedersen, 2008; Lange et al., 2013; Bennett et al., 2019). In this study, we examined the compositions of plagioclase phenocrysts from PUBs erupted on the SWIR (51°E), which is a typical ultraslow spreading ridge. Microanalysis of these phenocrysts provides an opportunity to investigate the geochemical changes that occurred, and thus, provides insights into the details of the magma reservoirs beneath the ultraslow oceanic spreading centers.
2.
Geologic setting
The SWIR is a typical ultraslow spreading ridge, with a half–spreading rate of around 7–9 mm/a (Dick et al., 2003). It separates the African Plate from the Antarctic Plate. The SWIR extends for 8 000 km from the Rodrigues Triple Junction (RTJ, 70°E) at its eastern end to the Bouvet Triple Junction at its western end (BTJ, 0°) (Fig. 1a). The SWIR is characterized by strong segmentation and discontinuous magmatism. Bathymetric data has revealed a shallow central region between the Prince Edward Transform Fracture Zone (35.5°E) and the Gallieni Fracture Zone (52.3°E), with an average depth of ~3 200 m compared with the deeper western (~4 000 m) and the eastern (~4 500 m) sections of the ridge (Cannat et al., 2008). As a result of the Marion hotspot to the southwest, this region has strong negative residual mantle Bouguer gravity anomalies, indicating relatively active crust–mantle exchange, deep magmatism, moderate levels of melting, and a moderate heat supply (Georgen et al., 2001; Sauter et al., 2009).
Figure
1.
Bathymetric map of the Southwest Indian Ridge (SWIR) (a) and location of the sample (b) (http://www.geomapapp.org). The location of the sample used in this study is marked by the star. BTJ: Bouvet Triple Junction; RTJ: Rodrigues Triple Junction; PE: Prince Edward Transform Fracture Zone; IFZ: Indomed Fracture Zone; GFZ: Gallieni Fracture Zone.
The study area and the sample sites are located between the Indomed (46°E) and Gallieni fracture zones (IFZ–GFZ) on the shallow central region of the SWIR (Fig. 1b). Previous geophysical and geochemical studies have been conducted on the ridge segment between the IFZ and GFZ. The center of this segment has anomalously thick crust (up to 10 km) (Niu et al., 2015) compared with that of the neighboring ridge sections. This thick oceanic crust indicates a robust magma supply in this area, which has been inferred to be associate with the Crozet hotspot (Sauter et al., 2009; Zhang et al., 2013) or with tectonic processes (Jian et al., 2017). Segments with robust magma supplies are also promising areas for hydrothermal activity (Tao et al., 2012).
3.
Sample descriptions and analytical methods
The PUB sample examined in this study was collected by television–guided grabs (TVGs) during the R/V Dayang Yihao Cruise DY115–21 to the 51°E magmatic segment in 2010. The sample was collected at a water depth of about 1 655 m. Optical microscopy analysis indicates that lavas from the SWIR are porphyritic and contain ~15% phenocrysts. The phenocrysts are mostly euhedral to subhedral plagioclase with polysynthetic twinning. The other main phase is subhedral to anhedral olivine (<1%). The plagioclase crystals contain abundant melt inclusions. The groundmass is primarily composed of suhedral, lath–like plagioclase and subordinate, anhedral olivine (Fig. 2).
Figure
2.
Photographs and representative photomicrographs (cross–polarized) of the PUB from the SWIR. a. Hand specimens of the sample; b. enhedral to subhedral plagioclase phenocrysts with melt inclusions; and c suhedral. lath–like plagioclase and subordinate, anhedral olive. Pl: plagioclase, Ol: olivine, MI: melt–melt inclusion.
Backscattered electron (BSE) imaging of the plagioclase in polished thin sections was used to characterize the textures of the crystals. Mineral analysis of the plagioclase was conducted using the JEOL JXA 8100 electron microprobe at the Key Laboratory of Submarine Geosciences (KLSG), Ministry of Natural Resources (MNR). The analytical conditions were as follows: a 15 kV accelerating voltage, a 20 nA specimen current, and a 1 μm focused beam. The peak counting times were 90 s for Fe and Mg, and 20 s for all of the other major elements. The detection limits for most of the elements, except for Ti, were lower than 400×10–6, depending on the abundance of the elements. The detection limit of Ti was 600×10–6 due to its lower content. The following natural and synthetic standards were used for the specified elements: Olivine (Si, Mg), Apatite (Ca, P), Hematite (Fe), Albite (Na, Al), Orthoclase (K), Rhodonite (Mn), Rutile (Ti), and Tugtupite (Cl). The raw data was corrected using the ZAF correction. The chemical formulas of the plagioclase phenocrysts were calculated from the mineral analysis results based on 24 anions.
4.
Results
4.1
Texture of the plagioclases
The plagioclase phenocrysts (typically >0.5 mm) from the SWIR are predominantly euhedral to subhedral in shape with tabular habits. They exhibit three textural types (Figs 3a–c). Type 1 plagioclase crystals are characterized by oscillatory zoning, surrounded by a thin rim (<50 μm). Type 2 plagioclase crystals are also characterized by oscillatory zoning, but have wider rims (50–150 μm) than Type 1 plagioclase (<50 μm). Type 3 plagioclase crystals contain numerous circular melt inclusions and do not exhibit oscillatory zoning. The plagioclase in the groundmass varies in size. The relatively large microphenocrysts typically have sizes of 0.01–0.50 mm and are primarily unzoned, whereas the relatively small groundmass microlites are <0.01 mm (Fig. 3d).
Figure
3.
Back-scattered-electron (BSE) images of the different types of plagioclase in the PUB. a. Type 1 plagioclase phenocryst; b. Type 2 plagioclase phenocryst; c. Type 3 plagioclase phenocryst; and d. plagioclase microphenocrysts. MI: melt inclusion.
A total of 25 microprobe analyses were performed on the studied sample. Representative chemical data for the plagioclases are presented in Table 1. These phenocrysts have An contents of 58 to 82. No distinct compositional differences exist among the three types of plagioclase phenocrysts. All of the phenocrysts have calcic cores (An74–82) and sodic rim growth (~An67–71). The variation from the core to the rim is 10–20 mol% An. The plagioclase crystals found within the microphenocrysts and microlites are sodic (An58–63), similar to the rims of the phenocrysts. On the ternary classification diagram, the plagioclase in the studied sample display a continuous range from bytownite to labradorite, with An decreasing from 82 to 58. The cores of the plagioclase phenocrysts are bytownite, while the rims range from bytownite to labradorite. All of the plagioclase crystals in the groundmass are labradorite with lower An contents (Fig. 4).
Table
1.
Representative microprobe data for the plagioclase from the SWIR of this study
Element
Phenocrystal
Groundmass1)
Type I
Type II
Type III
Pl-m
Pl-g
Core
Rim
Core
Rim
Core
Rim
SiO2
48.25
51.42
50.73
52.24
48.80
51.74
53.70
54.69
TiO2
0.06
0.10
0.05
0.00
0.00
0.11
0.08
0.17
Al2O3
31.49
30.03
30.28
29.61
31.70
29.81
28.41
26.72
FeO
0.29
0.40
0.50
0.54
0.38
0.62
0.58
1.41
MnO
0.04
0.00
0.04
0.00
0.00
0.00
0.00
0.00
MgO
0.15
0.19
0.24
0.18
0.20
0.20
0.18
0.37
CaO
16.80
14.52
14.94
14.01
16.29
14.13
12.77
11.92
Na2O
1.99
3.25
2.92
3.42
2.21
3.22
4.15
4.64
K2O
0.01
0.02
0.01
0.03
0.01
0.02
0.04
0.06
P2O5
0.01
0.03
0.00
0.02
0.01
0.00
0.01
0.05
Total
99.08
99.95
99.71
100.04
99.59
99.86
99.92
100.02
Calculated atoms based on 24 oxygens
Si
6.704
7.031
6.962
7.127
6.736
7.072
7.311
7.457
Ti
0.006
0.010
0.005
0.000
0.000
0.011
0.008
0.017
Al
5.157
4.840
4.899
4.761
5.157
4.803
4.559
4.294
Fe
0.034
0.046
0.057
0.062
0.043
0.071
0.066
0.161
Mn
0.005
0.000
0.004
0.000
0.000
0.000
0.000
0.000
Mg
0.031
0.039
0.049
0.036
0.041
0.041
0.037
0.074
Ca
2.501
2.127
2.198
2.047
2.409
2.070
1.863
1.742
Na
0.536
0.862
0.776
0.905
0.591
0.852
1.096
1.225
K
0.002
0.003
0.002
0.005
0.001
0.003
0.007
0.011
P
0.002
0.003
0.000
0.002
0.001
0.000
0.001
0.005
Total
14.977
14.961
14.953
14.945
14.980
14.924
14.947
14.987
An
0.82
0.71
0.74
0.69
0.80
0.71
0.63
0.58
Ab
0.18
0.29
0.26
0.31
0.20
0.29
0.37
0.41
Or
0.00
0.00
0.00
0.00
0.00
0.00
0.00
0.01
FeO/MgO
1.91
2.12
2.08
3.04
1.90
3.06
3.16
3.87
Ca/Na
4.67
2.47
2.83
2.26
4.07
2.43
1.70
1.42
T/°C2)
1296
1108
1237
1098
1280
1129
1063
1042
Note: 1) Pl-m and Pl-g represent plagioclase microphenocrysts and microlites in groundmass, respectively; 2) crystallization temperature is calculated according to Kudo and Weill (1983).
In terms of the major elements, the FeO and MgO concentrations of the plagioclase do not vary significantly. The FeO and MgO concentrations are 0.29%–1.41% (wt) and 0.15%–0.37% (wt), respectively. The FeO and MgO concentrations of the plagioclase cores are relatively depleted compared with those of the plagioclase rims and groundmass.
5.
Discussion
5.1
Crystallization temperature
Plagioclase compositions are a useful indicator of crystallization temperature (Kudo and Weill, 1970; Mollo et al., 2011). In this study, the plagioclase–melt geothermometry method proposed by Kudo and Weill (1970) was used to estimate the crystallization temperature of the plagioclase. Before applying the geothermometry method, the pressures must be determined. According to Chen et al. (2002), the pressures of the plagioclase rims and cores are approximately 0.5×10⁸ and 1.0×10⁸ Pa, respectively. Similarly, the plagioclase in the groundmass is estimated to have crystallized at shallower depths, within the upper crust or on the seabed. The pressure of the groundmass is also assumed to be 0.5×10⁸ Pa according to Chen et al. (2002). Based on the assumptions stated above, Eqs (1) and (2) were used to calculate the crystallization temperatures of the plagioclase crystals:
where $ \lambda$=(XNaXSi/XCaXAl) is for the groundmass, $ \sigma$=(XAbγAb/XAnγAn) is for the plagioclase, and $ \varphi$=(XCa+XAl–XSi–XNa) is for the groundmass. X represents the mole fraction of the component. Although the groundmass is microcrystalline and lacks glass, Lange et al. (2013) demonstrated that PUB hosted glasses have the same range of compositions as aphyric lavas from the same segment. Therefore, in the calculation process, we use the average whole–rock compositions of the aphyric basalts from the same segment, which were reported by Yang et al. (2014), as an approximate proxy for the groundmass.
According to the plagioclase geothermometer described above, the crystallization temperatures of the phenocryst cores and rims are (1 273±18)°C and (1 099±10)°C, respectively. From the core to the rim of the phenocryst, the crystallization temperature decreases by about 200°C. The crystallization temperatures of the microphenocrysts and microlites in the groundmass range from 1 063°C to 1 087°C (average = 1 072°C), which is similar to the crystallization temperature of the phenocryst rims (Table 1).
In previous studies, the crystallization temperatures of high–An (An≥70%) plagioclase phenocrysts, which were estimated from the entrapment temperature of melt inclusions in samples from ultraslow spreading ridges, were found to range from 1 230°C to 1 260°C (Nielsen et al., 1995; Drignon et al., 2019). Whereas the minimum estimation of the crystallization temperature of low An (An<70%) plagioclase is 1 100°C (Yang et al., 2019). The crystallization temperatures in our study are consistent with these results, which suggests that our calculated results are reasonable and the plagioclases thermometer by Kudo and Weill (1970) can be used to calculate the crystallization temperatures of plagioclase phenocrysts from MORBs beneath ultraslow ridges.
5.2
Plagioclase–melt equilibrium
5.2.1
Major elements
In plagioclase, the diffusion rates of major elements, such as the NaSi–CaAl exchange, are extremely slow (Grove et al., 1984). The geochemical zoning of the crystals likely reflects the magmatic conditions, and thus, it can be used to investigate the likelihood of plagioclase–melt equilibrium. Previous experiments have demonstrated that the partition coefficient of Ca/Na (KCa/Na) between plagioclase and melt mainly positively depends on the water content of the magma (Sisson and Grove, 1993; Martel et al., 2006). For basaltic magmas from mid-ocean ridges, when the magmatic water content is 3%, KCa/Na is typically ~1 for mid to upper lithospheric pressures (<10×108 Pa) (Sisson and Grove, 1993). The magmatic water contents of the SWIR lavas are close to the global average value for the upper mantle (0.3%–0.4%) (Robinson et al., 2001), which indicates that their KCa/Na value is less than 1.
In addition to the KCa/Na value, a representative melt composition is required to assess the equilibrium composition of the plagioclase phenocrysts. The groundmass of these rocks is microcrystalline and lacks glass, so it represents the final melt. Thus, as was discussed above, the average whole–rock composition of the aphyric basalts from the same segment is representative of the groundmass composition. The reported composition of the basalts and glass from this ridge segment do not vary significantly, with molar Ca/Na values ranging from 2.11 to 2.68 (Yang et al., 2014; Bézos and Humler, 2005). The molar Ca/Na values of the plagioclase phenocrysts in equilibrium with the melt are consistently≤2.68 (Fig. 5). The molar Ca/Na values of the plagioclase rims and groundmass range from 1.42 to 2.47, which is in equilibrium with the melt (Fig. 5). However, the compositions of the plagioclase cores (Ca/Na = 3 to 4) are higher than the upper limit of the equilibrium melt (Ca/Na = 2.68) (Fig. 5). In addition, the crystallization temperatures of the plagioclase cores (average of 1 273°C) are close to the experimental melting point of basaltic magma (~1 300°C) and the estimated upper mantle potential temperature of the SWIR lavas (~1 280°C) (Kamenetsky et al., 2000; Robinson et al., 2001). Therefore, the plagioclase cores are unlikely to have formed in the host magma. Instead, they are most likely xenocrysts, which crystallized from a more calcic melt.
Figure
5.
Ca/Na molecular ratio of the plagioclase compared with that of the melt. The melt represents the range of glass and whole-rock compositions, the data are obtained from Yang et al. (2014) and Bézos and Humler (2005). The K values and water contents are from Martel et al. (2006). Equilibrium between the plagioclase and melts is possible in the shaded area.
It is worth noting that compared with the plagioclase rims, the plagioclase phenocrysts in the groundmass have lower Ca/Na ratios (<2). Their more sodic compositions are most likely due to decreasing magmatic water contents caused by the fact that the KCa/Na between the plagioclase and the melt decreases as of the water content of the magma increases (Martel and Schmidt, 2003). Water is lost during the late-stage of magma ascent through the conduit due to ascent–driven decompression of the water-saturated magma. Thus, the compositional variations can be explained by the variations in the magmatic water content.
5.2.2
Mg and Fe contents of the plagioclase
The MgO zoning patterns of the plagioclase phenocrysts have the potential to record the magmatic composition because the Mg contents of the plagioclase phenocrysts reflect the composition of the host melt (Ginibre et al., 2002). Although it is difficult to accurately estimate the Mg partition coefficient (KMg) between plagioclase and melt, empirical studies have suggested an Arrhenius-like relationship of decreasing KMg with increasing XAn (Bindeman et al., 1998). To investigate the equilibrium relationship between the SWIR plagioclase and the host magma, we estimated the KMg based on this empirical relationship, which is often used to determine whether plagioclase phenocrysts are in equilibrium with the melt in magmatic systems (Bindeman et al., 1998; Coote and Shane, 2016). The majority of the plagioclase phenocrysts analyzed in this study are more enriched in MgO than the modeled melt compositions for a crystallization temperature of ~1099°C, which is based on the plagioclase geothermometer described above (Fig. 6a). This implies that the plagioclase in the PUBs analyzed in this study could not have crystallized from the basaltic host melt (MgO of 6.38%–8.87% (wt), average of 7.77% (wt)) and would require a more mafic melt (MgO of up to 14% (wt)). This agrees with the major element modeling (Ca/Na) of the plagioclase cores, but does not agree with the equilibrium between the rims and the melt suggested by the Ca/Na ratios (Fig. 5).
Figure
6.
Compositional plots of An versus MgO (a) and FeO/MgO (b) for the plagioclase. The curves represent plagioclase equilibrium compositions based on the KMg values from Bindeman et al. (1998) and a temperature of 1099℃ obtained from the plagioclase geothermometer. The average crystallization temperature of the phenocryst rims is 1099°C. The following melt parameters were used: (1) MgO=14%, the upper limit of the MgO content of the matrix melt according to a simulation based on the model of Bindeman et al. (1998); (2) MgO=7.77%, the average whole-rock composition of the aphyric basalts in the same segment from the literature, which is representative of the matrix.
The rimward increase in Mg and decrease in An appear to be similar to the trends described in previous diffusion studies (Costa et al., 2003; Moore et al., 2014). When minerals crystallize due to large degrees of undercooling and the diffusion in the melt cannot keep pace with the crystal formation, it is possible for late–stage rapid disequilibrium crystallization to produce a boundary layer melt enriched in incompatible (Fe, Mg) elements (Ginibre et al., 2002; Coote et al., 2018). This could explain the elevated MgO contents of the plagioclase rims and the groundmass plagioclase relative to the equilibrium values (Fig. 6a). The internal disequilibrium in the MgO contents can be explained by the mixing of primitive (MgO=14% (wt)) and more evolved magmas (MgO=7.77%(wt)).
Additionally, in plagioclase, the post–crystallization diffusion of Fe is slower than that of Mg (Costa et al., 2003). Thus, the highest FeO/MgO ratios occur in the outermost parts of the rims and in the groundmass plagioclase (Fig. 6b) due to the fact that FeO diffuses into the plagioclase more slowly than MgO, and thus, more FeO accumulates in the boundary layer during a short residence time. However, it is worth noting that since the FeO content of the plagioclase depends on both the melt composition and the oxygen fugacity, it is difficult to assess the plagioclase–melt equilibrium using only the FeO content (Coote et al., 2018). Therefore, disequilibrium diffusion within a short time period can result in elevated Mg contents compared with the equilibrium values and the highest FeO/MgO ratios occurring in the plagioclase rims (Coote and Shane, 2016; Moore et al., 2014). Whereas the discrepancies in the plagioclase–melt equilibrium inferred from the major elements (Ca/Na) and the Mg contents are likely an artifact of disequilibrium diffusion (Coote and Shane, 2016).
5.3
Implications for the SWIR magma system
In the SWIR, the crystallization temperature and composition of the plagioclase cores are distinctly different from those of the rims (Table 1), which indicates that the plagioclase cores and rims have different thermal histories.
The plagioclase cores are usually uniform and exhibit oscillatory zoning. The oscillatory zoning results in small-scale compositional variations, which suggests a regime of near–constant intensive parameters (pressure, temperature) (Landi et al., 2004; Shcherbakov et al., 2011). These characteristics suggest the cores crystallized from a stable environment and do not have complex crystallization histories. Besides, the presence of cores in plagioclase that are too primitive to be in equilibrium with the host magma indicates that they crystallized from a more primitive region in the plumbing system and were picked up by a more evolved melt later. Thus, we propose that the plagioclase cores grew in a stable mush zone where the temperature was high and constant, and were later entrained into a more evolved melt.
The thin plagioclase rims (normally < 150 μm) have lower crystallization temperatures and lower An values than the cores, and their major elements (Ca/Na) are in equilibrium with the host magma. These characteristics demonstrate that they crystallized from the host melt, which is more evolved than the magma from which the cores crystalized. Similarly, the plagioclase microphenocrysts and microlites are also in equilibrium (Ca/Na) values with the host magma, which suggests that they crystallized from the host magma as well. Compared with fast to intermediate spreading ridges, there are generally no stable magma chambers and the volume of melt may be low under ultraslow mid–ocean ridges (Dick et al., 2003). Thus, the transport of magma into cooler regions of the reservoir would be expected to result in abrupt, strong undercooling of the magma. Due to these large degrees of rapid cooling, the plagioclase phenocrysts in SWIR PUBs generally have thin rims. The plagioclase rims of the phenocrysts exhibit major element (Fe, Mg) enrichment because these elements cannot reach equilibrium when diffusing from the host magma into the plagioclase phenocrysts. The MgO contents of the outermost rims of the plagioclase can be used to calculate the maximum time between the incorporation of the plagioclase into the host melt and quenching on the seafloor (Costa et al., 2003; Moore et al., 2014). We used Eq. (8) in Costa et al. (2003) to determine the Mg diffusion coefficient of the plagioclase. The maximum residence time of the plagioclases in the host melt was nearly 5–8 d. The close temporal relationship between the evolved magma replenishment and the eruption suggests that replenishment plays an important role in driving the eruption, which has also been suggested for other MORB eruptions on slow and intermediate ridges (Costa et al., 2010). Overall, our favored model is that replenishment by an evolved melt under the SWIR ridges (51°E) drives the eruption over a short period of time.
6.
Conclusions
(1) The plagioclase cores with high An values have higher crystallization temperatures (1 273±18)°C than the rims (1 099±10)°C. The range of crystallization temperatures for the microphenocrysts and microlites in the groundmass is similar to that of the phenocryst rims.
(2) The compositions of the plagioclase cores from the SWIR indicate that they did not form in the host magma, but xenocrysts are crystallized from a more mafic melt composition. Whereas the plagioclase rims and the microphenocrysts and microlites in the groundmass are in equilibrium with the host basaltic melts.
(3) The disequilibrium MgO contents and the higher FeO/MgO ratios of the rims of the plagioclase phenocrysts reflect shorter magmatic residence time periods than would be resulting from equilibrium diffusion.
(4) An evolved melt replenished the magma under the SWIR ridges (51°E), driving the eruption over a short period of time.
Acknowledgements
We are grateful to Yin-Jia Jin and two anonymous reviewers for their careful editing and constructive comments, which improved the manuscript. We also thank the crew and scientists involved in the R/V Dayang Yihao Cruise DY115–21.
Aksenov Y, Popova E E, Yool A, et al. 2017. On the future navigability of Arctic sea routes: High-resolution projections of the Arctic Ocean and sea ice. Marine Policy, 75: 300–317. doi: 10.1016/j.marpol.2015.12.027
[2]
Alam A, Curry J A. 1998. Evolution of new ice and turbulent fluxes over freezing winter leads. Journal of Geophysical Research: Oceans, 103(C8): 15783–15802. doi: 10.1029/98JC01188
[3]
Assmy P, Fernández-Méndez M, Duarte P, et al. 2017. Leads in Arctic pack ice enable early phytoplankton blooms below snow-covered sea ice. Scientific Reports, 7(1): 40850. doi: 10.1038/srep40850
[4]
Aulicino G, Wadhams P, Parmiggiani F. 2019. SAR pancake ice thickness retrieval in the terra nova bay (Antarctica) during the PIPERS expedition in winter 2017. Remote Sensing, 11(21): 2510. doi: 10.3390/rs11212510
[5]
Beitsch A, Kaleschke L, Kern S. 2014. Investigating high-resolution AMSR2 sea ice concentrations during the February 2013 fracture event in the Beaufort Sea. Remote Sensing, 6(5): 3841–3856. doi: 10.3390/rs6053841
[6]
Boutin G, Lique C, Ardhuin F, et al. 2020. Towards a coupled model to investigate wave–sea ice interactions in the Arctic marginal ice zone. The Cryosphere, 14(2): 709–735. doi: 10.5194/tc-14-709-2020
[7]
Clem K R, Fogt R L, Turner J, et al. 2020. Record warming at the South Pole during the past three decades. Nature Climate Change, 10(8): 762–770. doi: 10.1038/s41558-020-0815-z
[8]
Delhasse A, Kittel C, Amory C, et al. 2020. Brief communication: Evaluation of the near-surface climate in ERA5 over the Greenland Ice Sheet. The Cryosphere, 14(3): 957–965. doi: 10.5194/tc-14-957-2020
[9]
Doble M J. 2009. Simulating pancake and frazil ice growth in the Weddell Sea: A process model from freezing to consolidation. Journal of Geophysical Research: Oceans, 114(C9): C09003
[10]
Doble M J, Wadhams P. 2006. Dynamical contrasts between pancake and pack ice, investigated with a drifting buoy array. Journal of Geophysical Research: Oceans, 111(C11): C11S24
[11]
Gentemann C L, Scott J P, Mazzini P L F, et al. 2020. Saildrone: Adaptively sampling the marine environment. Bulletin of the American Meteorological Society, 101(6): E744–E762. doi: 10.1175/BAMS-D-19-0015.1
[12]
Gimbert F, Jourdain N C, Marsan D, et al. 2012a. Recent mechanical weakening of the Arctic sea ice cover as revealed from larger inertial oscillations. Journal of Geophysical Research: Oceans, 117(C11): C00J12
[13]
Gimbert F, Marsan D, Weiss J, et al. 2012b. Sea ice inertial oscillations in the Arctic Basin. The Cryosphere, 6(5): 1187–1201. doi: 10.5194/tc-6-1187-2012
[14]
Griebel J. 2020. Improvements and analyzes of sea ice drift and deformation retrievals from SAR images [dissertation]. Bremen: University of Bremen
[15]
Haller M, Brümmer B, Müller G. 2014. Atmosphere–ice forcing in the transpolar drift stream: results from the DAMOCLES ice-buoy campaigns 2007–2009. The Cryosphere, 8(1): 275–288. doi: 10.5194/tc-8-275-2014
[16]
Heil P, Hutchings J K, Worby A P, et al. 2008. Tidal forcing on sea-ice drift and deformation in the western Weddell Sea in early austral summer, 2004. Deep-Sea Research Part II: Topical Studies in Oceanography, 55(8–9): 943–962. doi: 10.1016/j.dsr2.2007.12.026
[17]
Horvat C, Tziperman E. 2017. The evolution of scaling laws in the sea ice floe size distribution. Journal of Geophysical Research: Oceans, 122(9): 7630–7650. doi: 10.1002/2016JC012573
[18]
Howell S E L, Tivy A, Yackel J J, et al. 2008. Changing sea ice melt parameters in the Canadian Arctic Archipelago: Implications for the future presence of multiyear ice. Journal of Geophysical Research: Oceans, 113(C9): C09030
[19]
Hutchings J K, Hibler W D III. 2008. Small-scale sea ice deformation in the Beaufort Sea seasonal ice zone. Journal of Geophysical Research: Oceans, 113(C8): C08032
[20]
Itkin P, Spreen G, Hvidegaard S M, et al. 2018. Contribution of deformation to sea ice mass balance: A case study from an N-ICE2015 storm. Geophysical Research Letters, 45(2): 789–796. doi: 10.1002/2017GL076056
[21]
Lee C M, Thomson J, The Marginal Ice Zone Team, et al. 2017. An autonomous approach to observing the seasonal ice zone in the western Arctic. Oceanography, 30(2): 56–68. doi: 10.5670/oceanog.2017.222
[22]
Lei Ruibo, Gui Dawei, Yuan Zhouli, et al. 2020. Characterization of the unprecedented polynya events north of Greenland in 2017/2018 using remote sensing and reanalysis data. Acta Oceanologica Sinica, 39(9): 5–17. doi: 10.1007/s13131-020-1643-8
[23]
Lei Ruibo, Heil P, Wang Jia, et al. 2016. Characterization of sea-ice kinematic in the Arctic outflow region using buoy data. Polar Research, 35(1): 22658. doi: 10.3402/polar.v35.22658
[24]
Lei Ruibo, Hoppmann M, Cheng Bin, et al. 2021. Seasonal changes in sea ice kinematics and deformation in the Pacific sector of the Arctic Ocean in 2018/19. The Cryosphere, 15(3): 1321–1341. doi: 10.5194/tc-15-1321-2021
[25]
Leppäranta M. 2011. The Drift of Sea Ice. 2nd ed. Berlin: Springer, 51–56
[26]
Liu Yue, Pang Xiaoping, Zhao Xi, et al. 2021. Prediction of the Antarctic marginal ICE zone extent based upon its multifractal property. Fractals, 29(2): 2150035. doi: 10.1142/S0218348X21500353
[27]
Lund B, Graber H C, Persson P O G, et al. 2018. Arctic sea ice drift measured by shipboard marine radar. Journal of Geophysical Research: Oceans, 123(6): 4298–4321. doi: 10.1029/2018JC013769
[28]
Lüpkes C, Vihma T, Birnbaum G, et al. 2008. Influence of leads in sea ice on the temperature of the atmospheric boundary layer during polar night. Geophysical Research Letters, 35(3): L03805
[29]
Manda A, Takahashi T, Komori S, et al. 2002. Validation of a new type of Lagrangian drifter using a GPS cellular phone. International Journal of Offshore and Polar Engineering, 12(3): 213–216
[30]
Moore G W K, Schweiger A, Zhang J, et al. 2018. Collapse of the 2017 winter Beaufort High: A response to thinning sea ice?. Geophysical Research Letters, 45(6): 2860–2869. doi: 10.1002/2017GL076446
[31]
Nansen F. 1902. Oceanography of the North Polar basin: the Norwegian North Polar Expedition 1893–96. Scientific Results, 3(9): 427
[32]
Notz D, Community S. 2020. Arctic sea ice in CMIP6. Geophysical Research Letters, 47(10): e2019GL086749
[33]
Qu Meng, Pang Xiaoping, Zhao Xi, et al. 2021. Spring leads in the Beaufort Sea and its interannual trend using Terra/MODIS thermal imagery. Remote Sensing of Environment, 256: 112342. doi: 10.1016/j.rse.2021.112342
[34]
Rampal P, Weiss J, Marsan D. 2009. Positive trend in the mean speed and deformation rate of Arctic sea ice, 1979–2007. Journal of Geophysical Research: Oceans, 114(C5)
[35]
Roach L A, Horvat C, Dean S M, et al. 2018a. An emergent sea ice floe size distribution in a global coupled ocean-sea ice model. Journal of Geophysical Research: Oceans, 123(6): 4322–4337. doi: 10.1029/2017JC013692
[36]
Roach L A, Smith M M, Dean S M. 2018b. Quantifying growth of pancake sea ice floes using images from drifting buoys. Journal of Geophysical Research: Oceans, 123(4): 2851–2866. doi: 10.1002/2017JC013693
[37]
Screen J A, Bracegirdle T J, Simmonds I. 2018. Polar climate change as manifest in atmospheric circulation. Current Climate Change Reports, 4(4): 383–395. doi: 10.1007/s40641-018-0111-4
[38]
Serreze M C, Barrett A P. 2011. Characteristics of the Beaufort Sea high. Journal of Climate, 24(1): 159–182. doi: 10.1175/2010JCLI3636.1
[39]
Shen H H, Ackley S F. 1991. A one-dimensional model for wave-induced ice-floe collisions. Annals of Glaciology, 15: 87–95. doi: 10.3189/1991AoG15-1-87-95
[40]
Shu Qi, Ma Hongyu, Qiao Fangli. 2012. Observation and simulation of a floe drift near the North Pole. Ocean Dynamics, 62(8): 1195–1200. doi: 10.1007/s10236-012-0554-4
[41]
Spreen G, Kaleschke L, Heygster G. 2008. Sea ice remote sensing using AMSR-E 89-GHz channels. Journal of Geophysical Research: Oceans, 113(C2): C02S03
[42]
Stroeve J C, Kattsov V, Barrett A, et al. 2012. Trends in Arctic sea ice extent from CMIP5, CMIP3 and observations. Geophysical Research Letters, 39(16)
[43]
Strong C, Foster D, Cherkaev E, et al. 2017. On the definition of marginal ice zone width. Journal of Atmospheric and Oceanic Technology, 34(7): 1565–1584. doi: 10.1175/JTECH-D-16-0171.1
[44]
Strong C, Rigor I G. 2013. Arctic marginal ice zone trending wider in summer and narrower in winter. Geophysical Research Letters, 40(18): 4864–4868. doi: 10.1002/grl.50928
[45]
Taylor M H, Losch M, Bracher A. 2013. On the drivers of phytoplankton blooms in the Antarctic marginal ice zone: A modeling approach. Journal of Geophysical Research: Oceans, 118(1): 63–75. doi: 10.1029/2012JC008418
[46]
Timmermans M L, Marshall J. 2020. Understanding Arctic Ocean circulation: a review of ocean dynamics in a changing climate. Journal of Geophysical Research: Oceans, 125(4): e2018JC014378
[47]
Uotila J, Vihma T, Launiainen J. 2000. Response of the Weddell Sea pack ice to wind forcing. Journal of Geophysical Research: Oceans, 105(C1): 1135–1151. doi: 10.1029/1999JC900265
[48]
Vichi M, Eayrs C, Alberello A, et al. 2019. Effects of an explosive polar cyclone crossing the Antarctic marginal ice zone. Geophysical Research Letters, 46(11): 5948–5958. doi: 10.1029/2019GL082457
[49]
Vihma T, Tisler P, Uotila P. 2012. Atmospheric forcing on the drift of Arctic sea ice in 1989–2009. Geophysical Research Letters, 39(2): L02501
[50]
Vinje T. 2001. Anomalies and trends of sea-ice extent and atmospheric circulation in the Nordic Seas during the period 1864–1998. Journal of Climate, 14(3): 255–267. doi: 10.1175/1520-0442(2001)014<0255:AATOSI>2.0.CO;2
[51]
Wang Jia, Zhang Jinlun, Watanabe E, et al. 2009. Is the Dipole Anomaly a major driver to record lows in Arctic summer sea ice extent?. Geophysical Research Letters, 36(5): L05706
[52]
Weeks W F, Ackley S F. 1986. The growth, structure, and properties of sea ice. In: Untersteiner N, ed. The Geophysics of Sea Ice. NATO ASI Series (Series B: Physics). Boston: Springer, 9–164
[53]
Willmes S, Heinemann G. 2016. Sea-ice wintertime lead frequencies and regional characteristics in the Arctic, 2003–2015. Remote Sensing, 8(1): 4
[54]
Wright N C, Polashenski C M. 2018. Open-source algorithm for detecting sea ice surface features in high-resolution optical imagery. The Cryosphere, 12(4): 1307–1329. doi: 10.5194/tc-12-1307-2018
Wu Bingyi, Wang Jia, Walsh J E. 2006. Dipole anomaly in the winter Arctic atmosphere and its association with sea ice motion. Journal of Climate, 19(2): 210–225. doi: 10.1175/JCLI3619.1
[57]
Yang H, Choi J K, Park Y J, et al. 2014. Application of the Geostationary Ocean Color Imager (GOCI) to estimates of ocean surface currents. Journal of Geophysical Research: Oceans, 119(6): 3988–4000. doi: 10.1002/2014JC009981
[58]
Yu Yining, Xiao Wanxin, Zhang Zhilun, et al. 2021. Evaluation of 2-m air temperature and surface temperature from ERA5 and ERA-I using buoy observations in the Arctic during 2010–2020. Remote Sensing, 13(14): 2813. doi: 10.3390/rs13142813
[59]
Zhang Jinlun, Lindsay R, Schweiger A, et al. 2012. Recent changes in the dynamic properties of declining Arctic sea ice: A model study. Geophysical Research Letters, 39(20): L20503
[60]
Zhang Jinlun, Schweiger A, Steele M, et al. 2015. Sea ice floe size distribution in the marginal ice zone: Theory and numerical experiments. Journal of Geophysical Research: Oceans, 120(5): 3484–3498. doi: 10.1002/2015JC010770
[61]
Zuo Guangyu, Dou Yinke, Chang Xiaomin, et al. 2018a. Design and performance analysis of a multilayer sea ice temperature sensor used in polar region. Sensors, 18(12): 4467
[62]
Zuo Guangyu, Dou Yinke, Lei Ruibo. 2018b. Discrimination algorithm and procedure of snow depth and sea ice thickness determination using measurements of the vertical ice temperature profile by the ice-tethered buoys. Sensors, 18(12): 4162. doi: 10.3390/s18124162
Table
1.
Representative microprobe data for the plagioclase from the SWIR of this study
Element
Phenocrystal
Groundmass1)
Type I
Type II
Type III
Pl-m
Pl-g
Core
Rim
Core
Rim
Core
Rim
SiO2
48.25
51.42
50.73
52.24
48.80
51.74
53.70
54.69
TiO2
0.06
0.10
0.05
0.00
0.00
0.11
0.08
0.17
Al2O3
31.49
30.03
30.28
29.61
31.70
29.81
28.41
26.72
FeO
0.29
0.40
0.50
0.54
0.38
0.62
0.58
1.41
MnO
0.04
0.00
0.04
0.00
0.00
0.00
0.00
0.00
MgO
0.15
0.19
0.24
0.18
0.20
0.20
0.18
0.37
CaO
16.80
14.52
14.94
14.01
16.29
14.13
12.77
11.92
Na2O
1.99
3.25
2.92
3.42
2.21
3.22
4.15
4.64
K2O
0.01
0.02
0.01
0.03
0.01
0.02
0.04
0.06
P2O5
0.01
0.03
0.00
0.02
0.01
0.00
0.01
0.05
Total
99.08
99.95
99.71
100.04
99.59
99.86
99.92
100.02
Calculated atoms based on 24 oxygens
Si
6.704
7.031
6.962
7.127
6.736
7.072
7.311
7.457
Ti
0.006
0.010
0.005
0.000
0.000
0.011
0.008
0.017
Al
5.157
4.840
4.899
4.761
5.157
4.803
4.559
4.294
Fe
0.034
0.046
0.057
0.062
0.043
0.071
0.066
0.161
Mn
0.005
0.000
0.004
0.000
0.000
0.000
0.000
0.000
Mg
0.031
0.039
0.049
0.036
0.041
0.041
0.037
0.074
Ca
2.501
2.127
2.198
2.047
2.409
2.070
1.863
1.742
Na
0.536
0.862
0.776
0.905
0.591
0.852
1.096
1.225
K
0.002
0.003
0.002
0.005
0.001
0.003
0.007
0.011
P
0.002
0.003
0.000
0.002
0.001
0.000
0.001
0.005
Total
14.977
14.961
14.953
14.945
14.980
14.924
14.947
14.987
An
0.82
0.71
0.74
0.69
0.80
0.71
0.63
0.58
Ab
0.18
0.29
0.26
0.31
0.20
0.29
0.37
0.41
Or
0.00
0.00
0.00
0.00
0.00
0.00
0.00
0.01
FeO/MgO
1.91
2.12
2.08
3.04
1.90
3.06
3.16
3.87
Ca/Na
4.67
2.47
2.83
2.26
4.07
2.43
1.70
1.42
T/°C2)
1296
1108
1237
1098
1280
1129
1063
1042
Note: 1) Pl-m and Pl-g represent plagioclase microphenocrysts and microlites in groundmass, respectively; 2) crystallization temperature is calculated according to Kudo and Weill (1983).
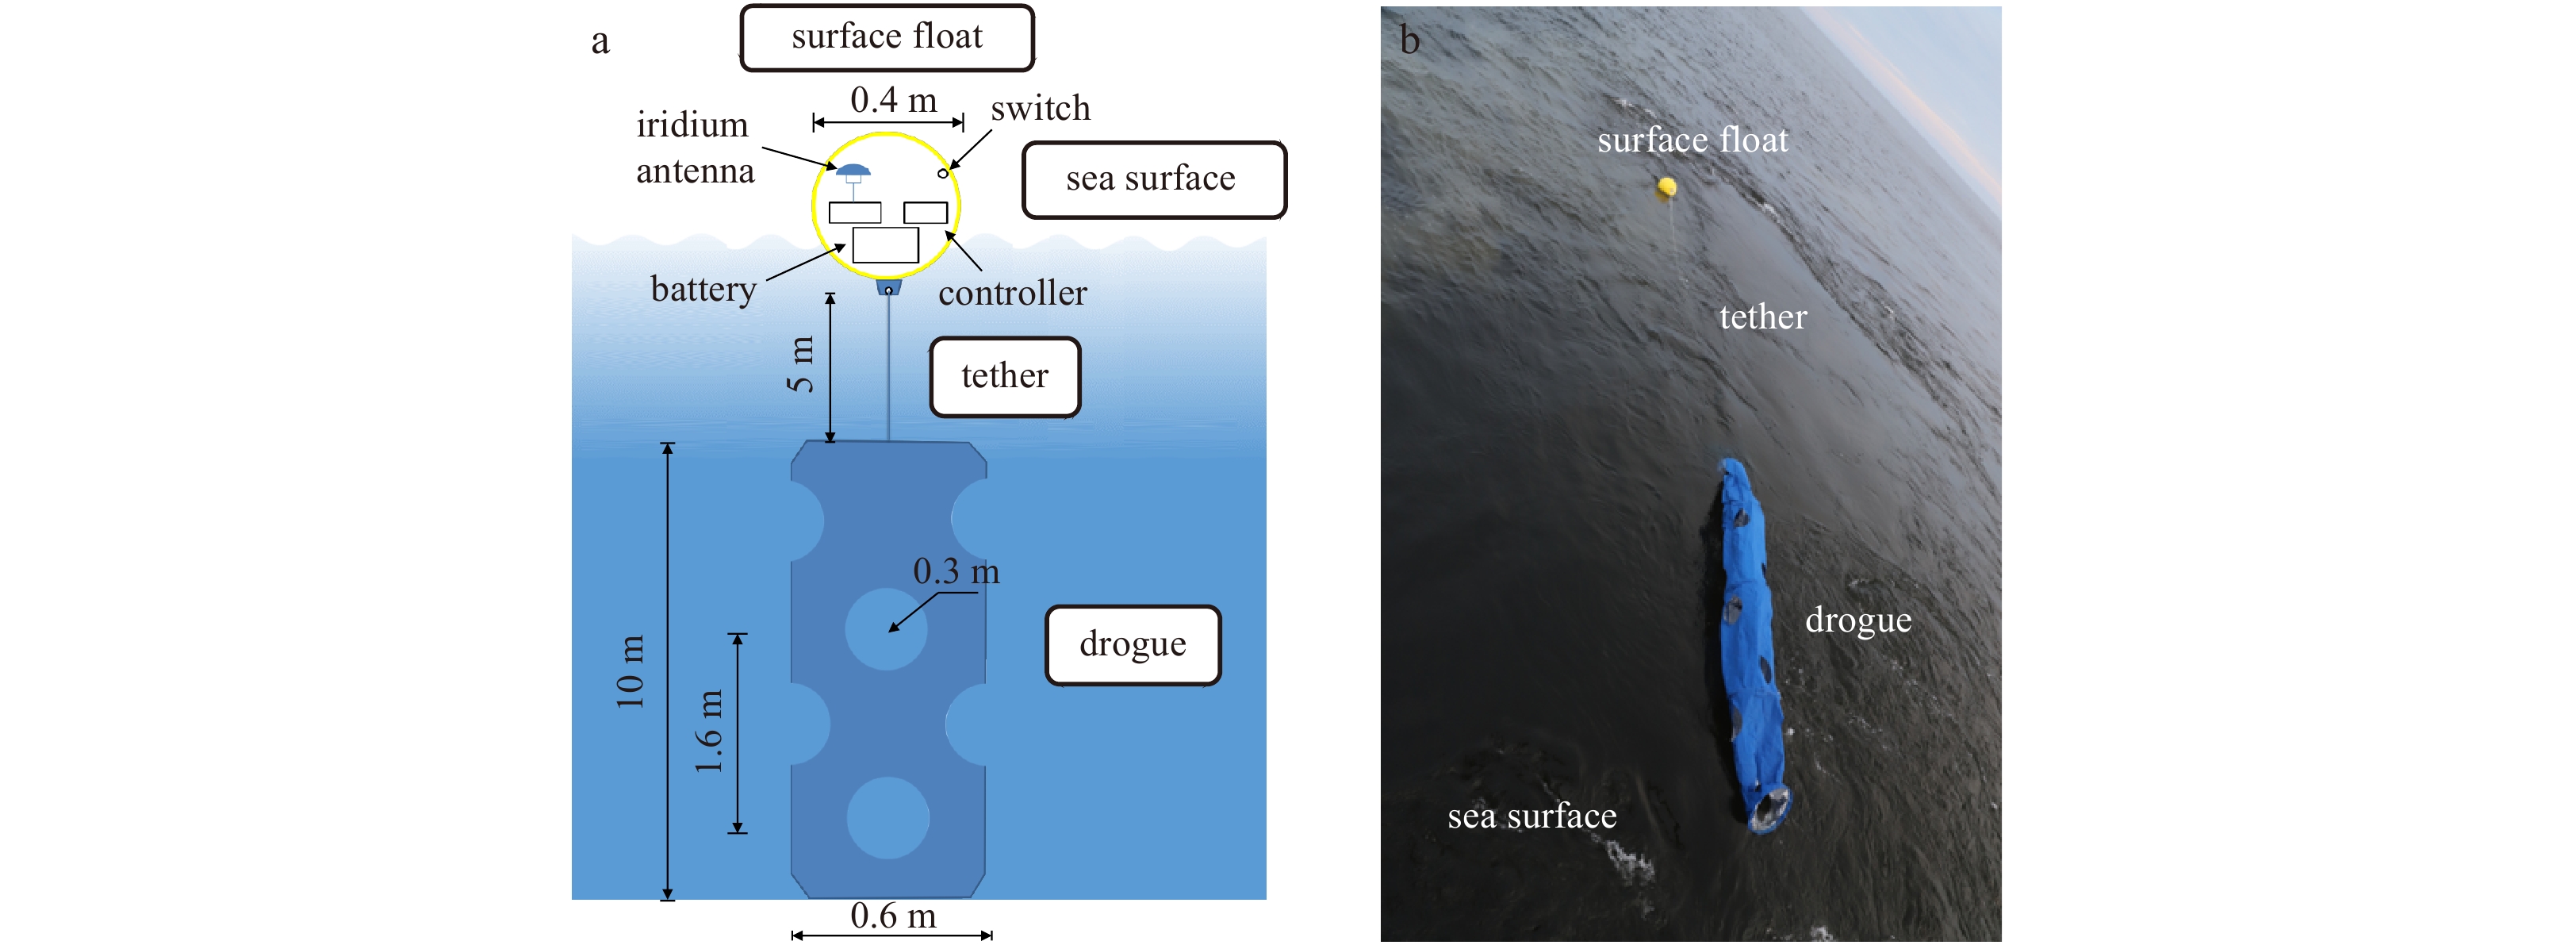
Figure 1. Taiyuan University of Technology (TUT) buoy mainly consists of surface float, a tether and drogue. The surface float is responsible for sending position data, drogue pulls the float by the tether with the ocean current as buoy in the open water. a. Schematic depiction of TUT buoy; b. Buoy A, shortly after deployment at the site of 74.63°N, 164.95°W with the drogue floated on the sea.
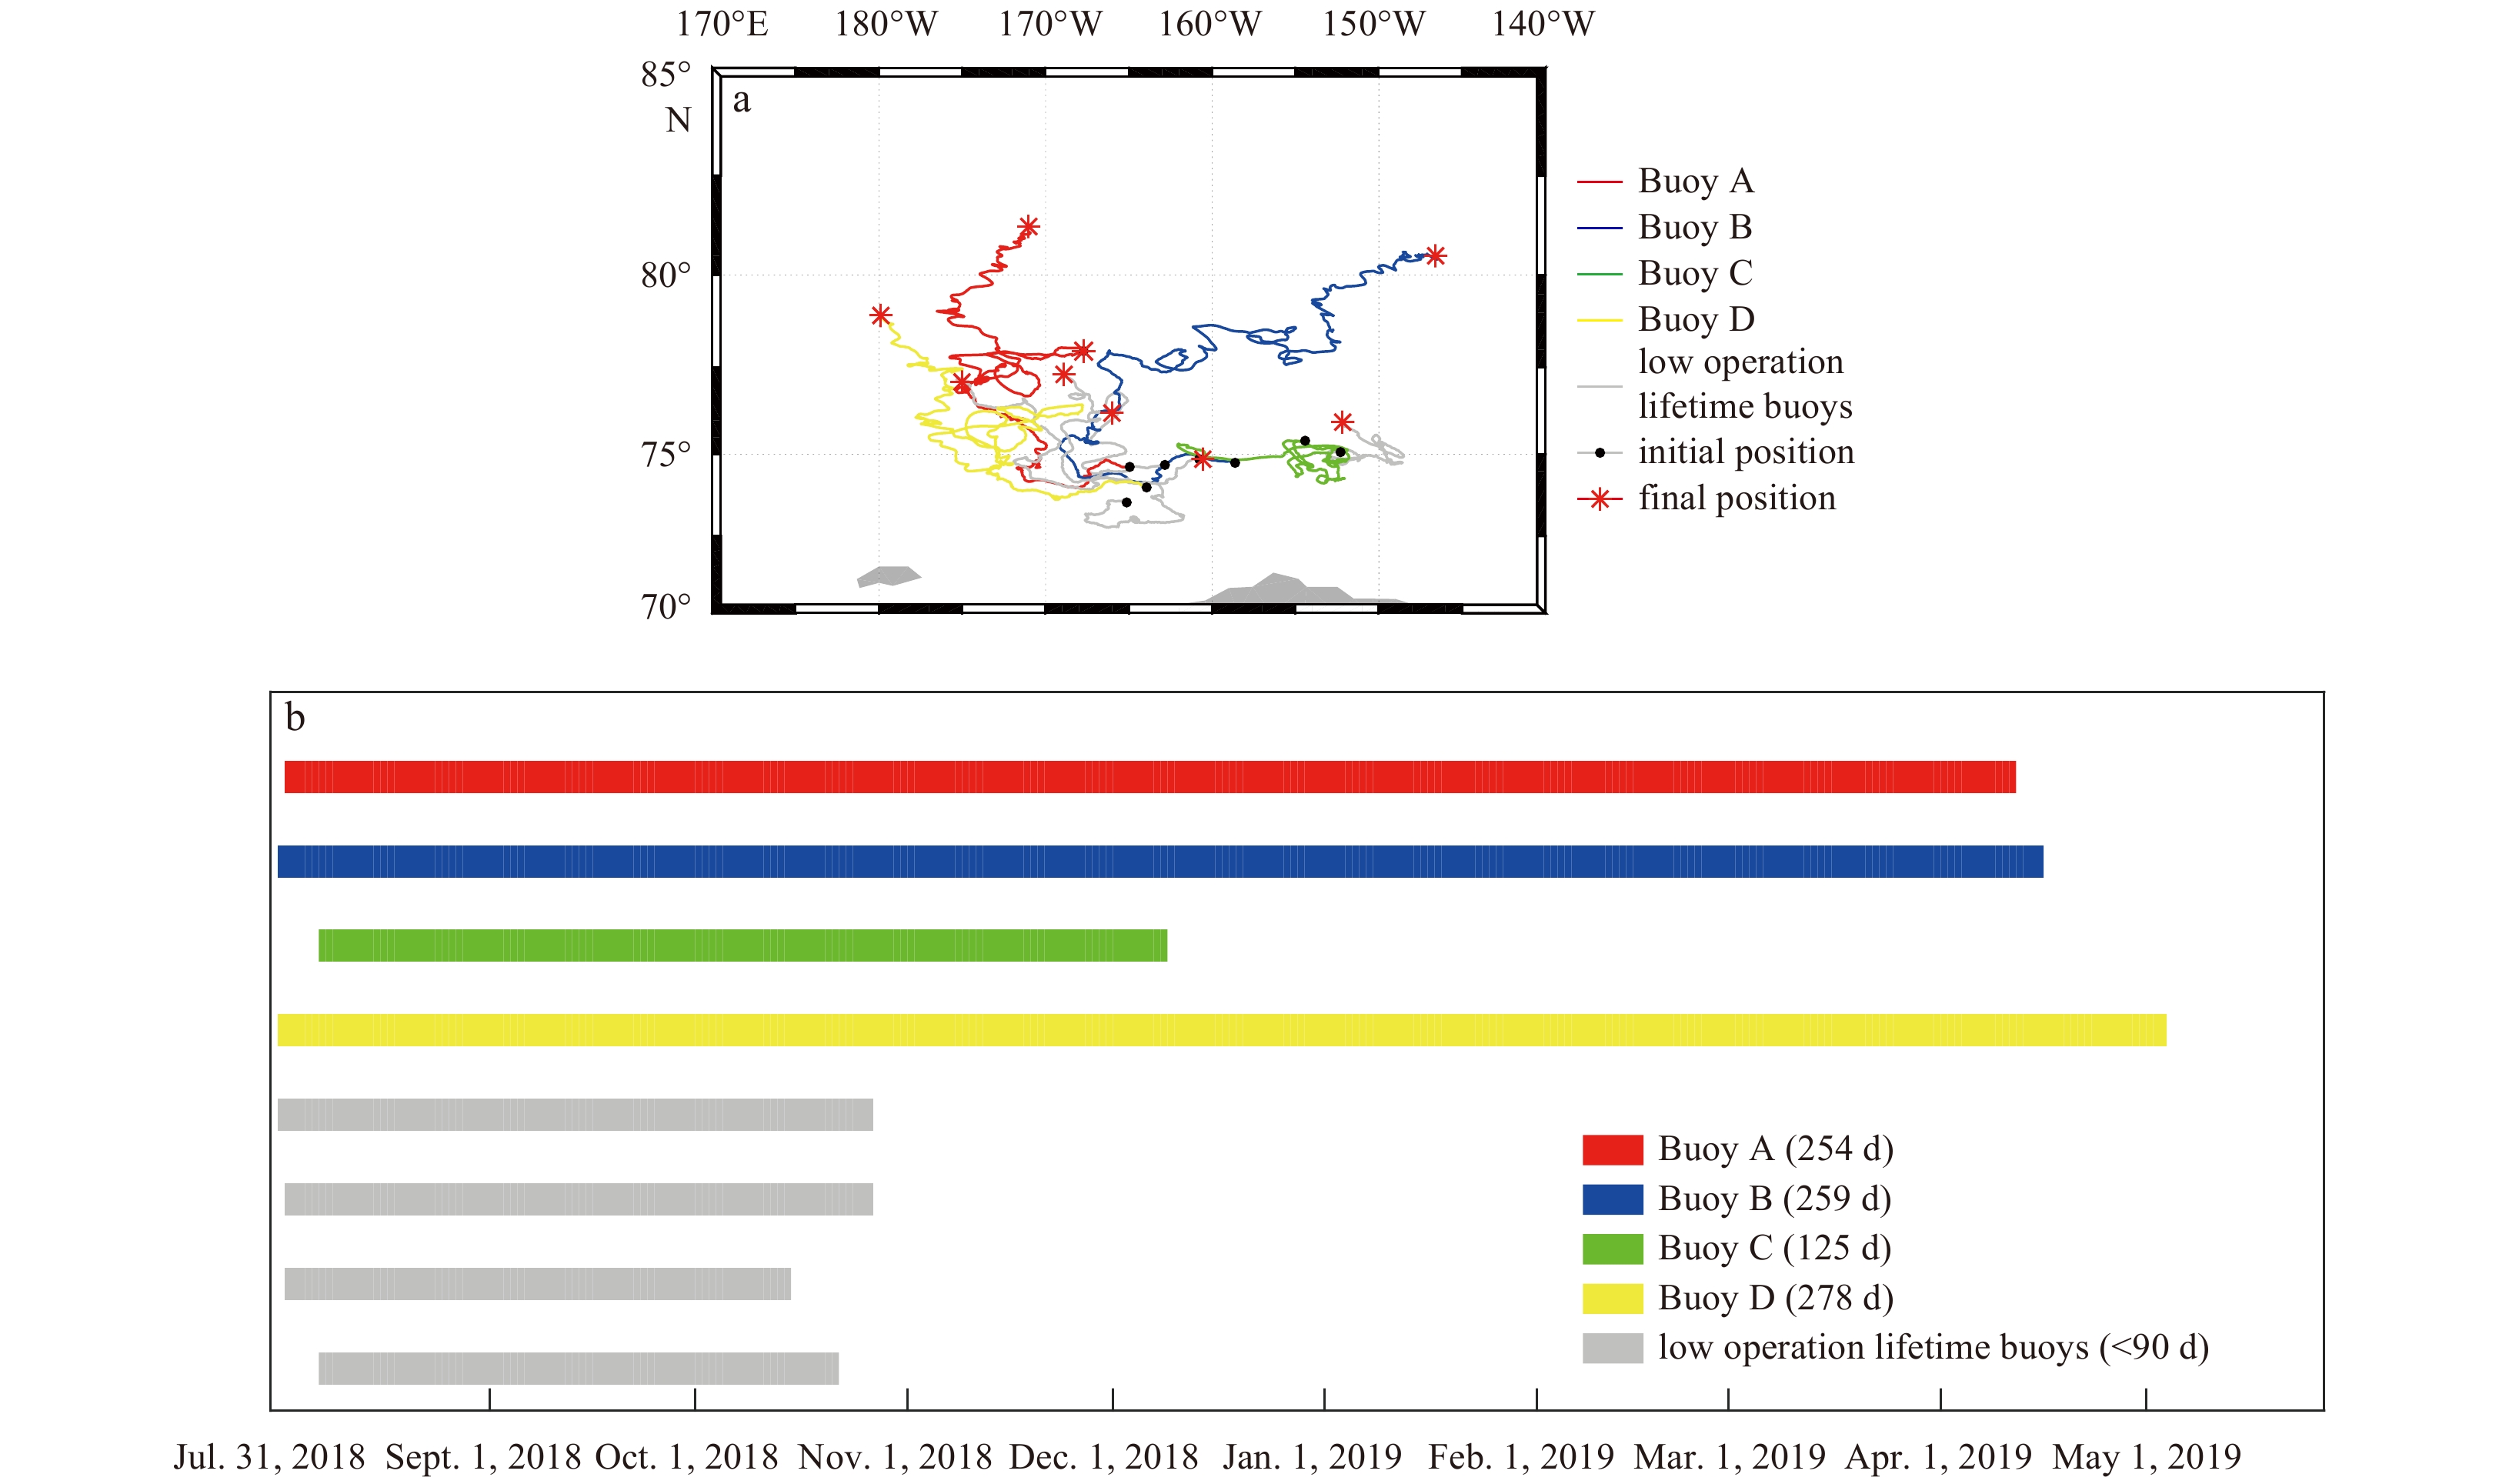
Figure 2. Operation of the buoys deployed in the 9th Chinese National Arctic Research Expedition (CHINARE). a. Map of all eight Taiyuan University of Technology (TUT) buoys drift tracks in 2018–2019; deployment locations (black point) and final position (red asterisk) are shown; b. time series of observations by all eight TUT buoys deployed during the 9th CHINARE.
Figure 3. Ice concentration (red) and skin temperature (blue) near Buoys A–D during the operation period.
Figure 4. Changes in monthly Arctic oscillation (AO) index (red) and monthly Beaufort High (BH) index (blue) from August to April in 1979 –2019.
Figure 5. Changes in monthly dipole anomaly (DA) index (red) and monthly central Arctic index (CAI) (blue) from August to April in 1979–2019.
Figure 6. Anomalies of near-surface air temperature (${T}_{2\;\mathrm{m}}$) over the Canadian Basin during August 2018 and April 2019 relative to 1979–2018 climatology; arrows indicate monthly average wind vectors (black) and trajectories of Buoy A (yellow), Buoy B (green), Buoy C (blue) and Buoy D (red). The points and asterisks represent the intial locations and final positions of the buoys in different months, respectively.
Figure 7. Variations in buoys velocities measured by Buoys A–D are plotted with 1 h resolution (grey solid), 1 d resolution (blue solid) and with monthly filter (red dash). High amplitude and high frequency buoy motions ceasing rapidly after buoy entered the ice zone (mid-October).
Figure 8. Speed changes in Buoys A–D as a function of position data resampling interval for various months in 2018 and 2019.
Figure 9. Monthly average speed (left y axis, grey bar), monthly average meander coefficient (left y axis, blue line) and correlation coefficient between buoy speed and wind speed (right y axis, red line) among Buoys A–D. MC: meander coefficient.
Figure 10. Monthly direction distributions (%, scaled by numbers in black) of wind heading (blue) and buoy drift (red) at Buoy D from August 2018 to April 2019.
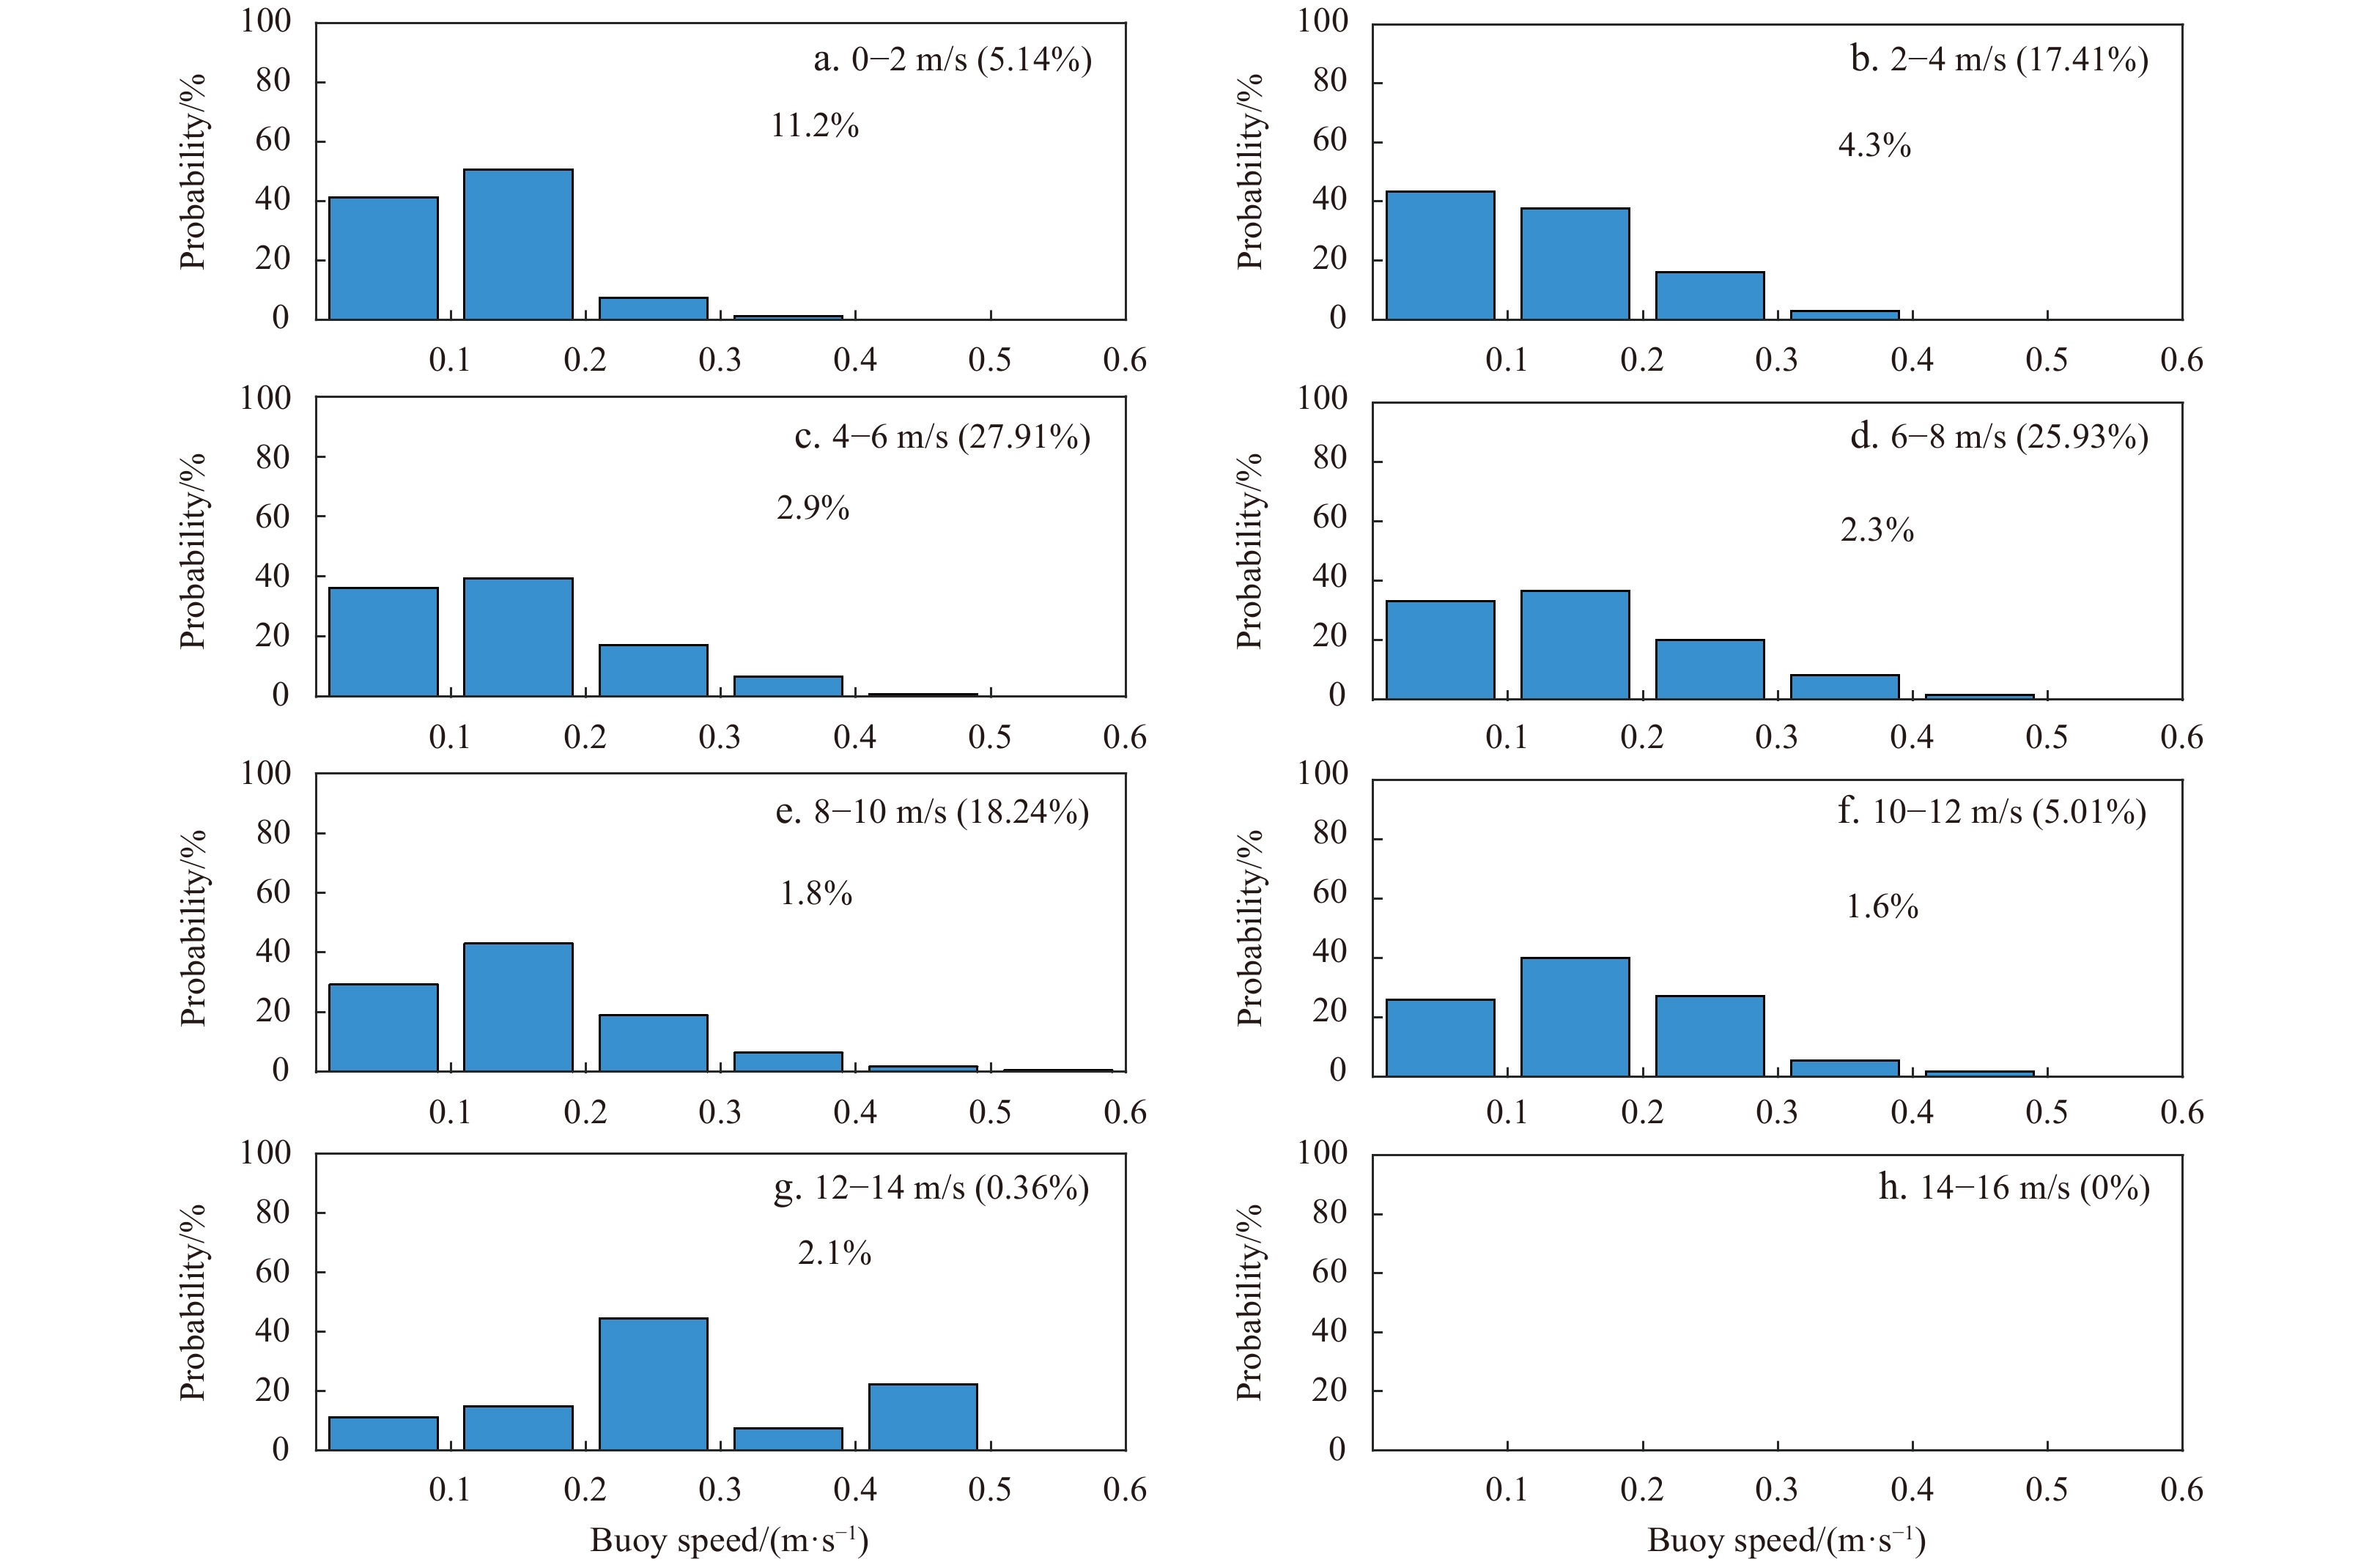
Figure 11. Distribution of buoy velocity among Buoys A–D for 2 m/s magnitude bands of wind speed for ice concentrations <50%. The probability of each wind-speed class is shown in brackets, and the mean wind factor is shown below the wind-speed class.
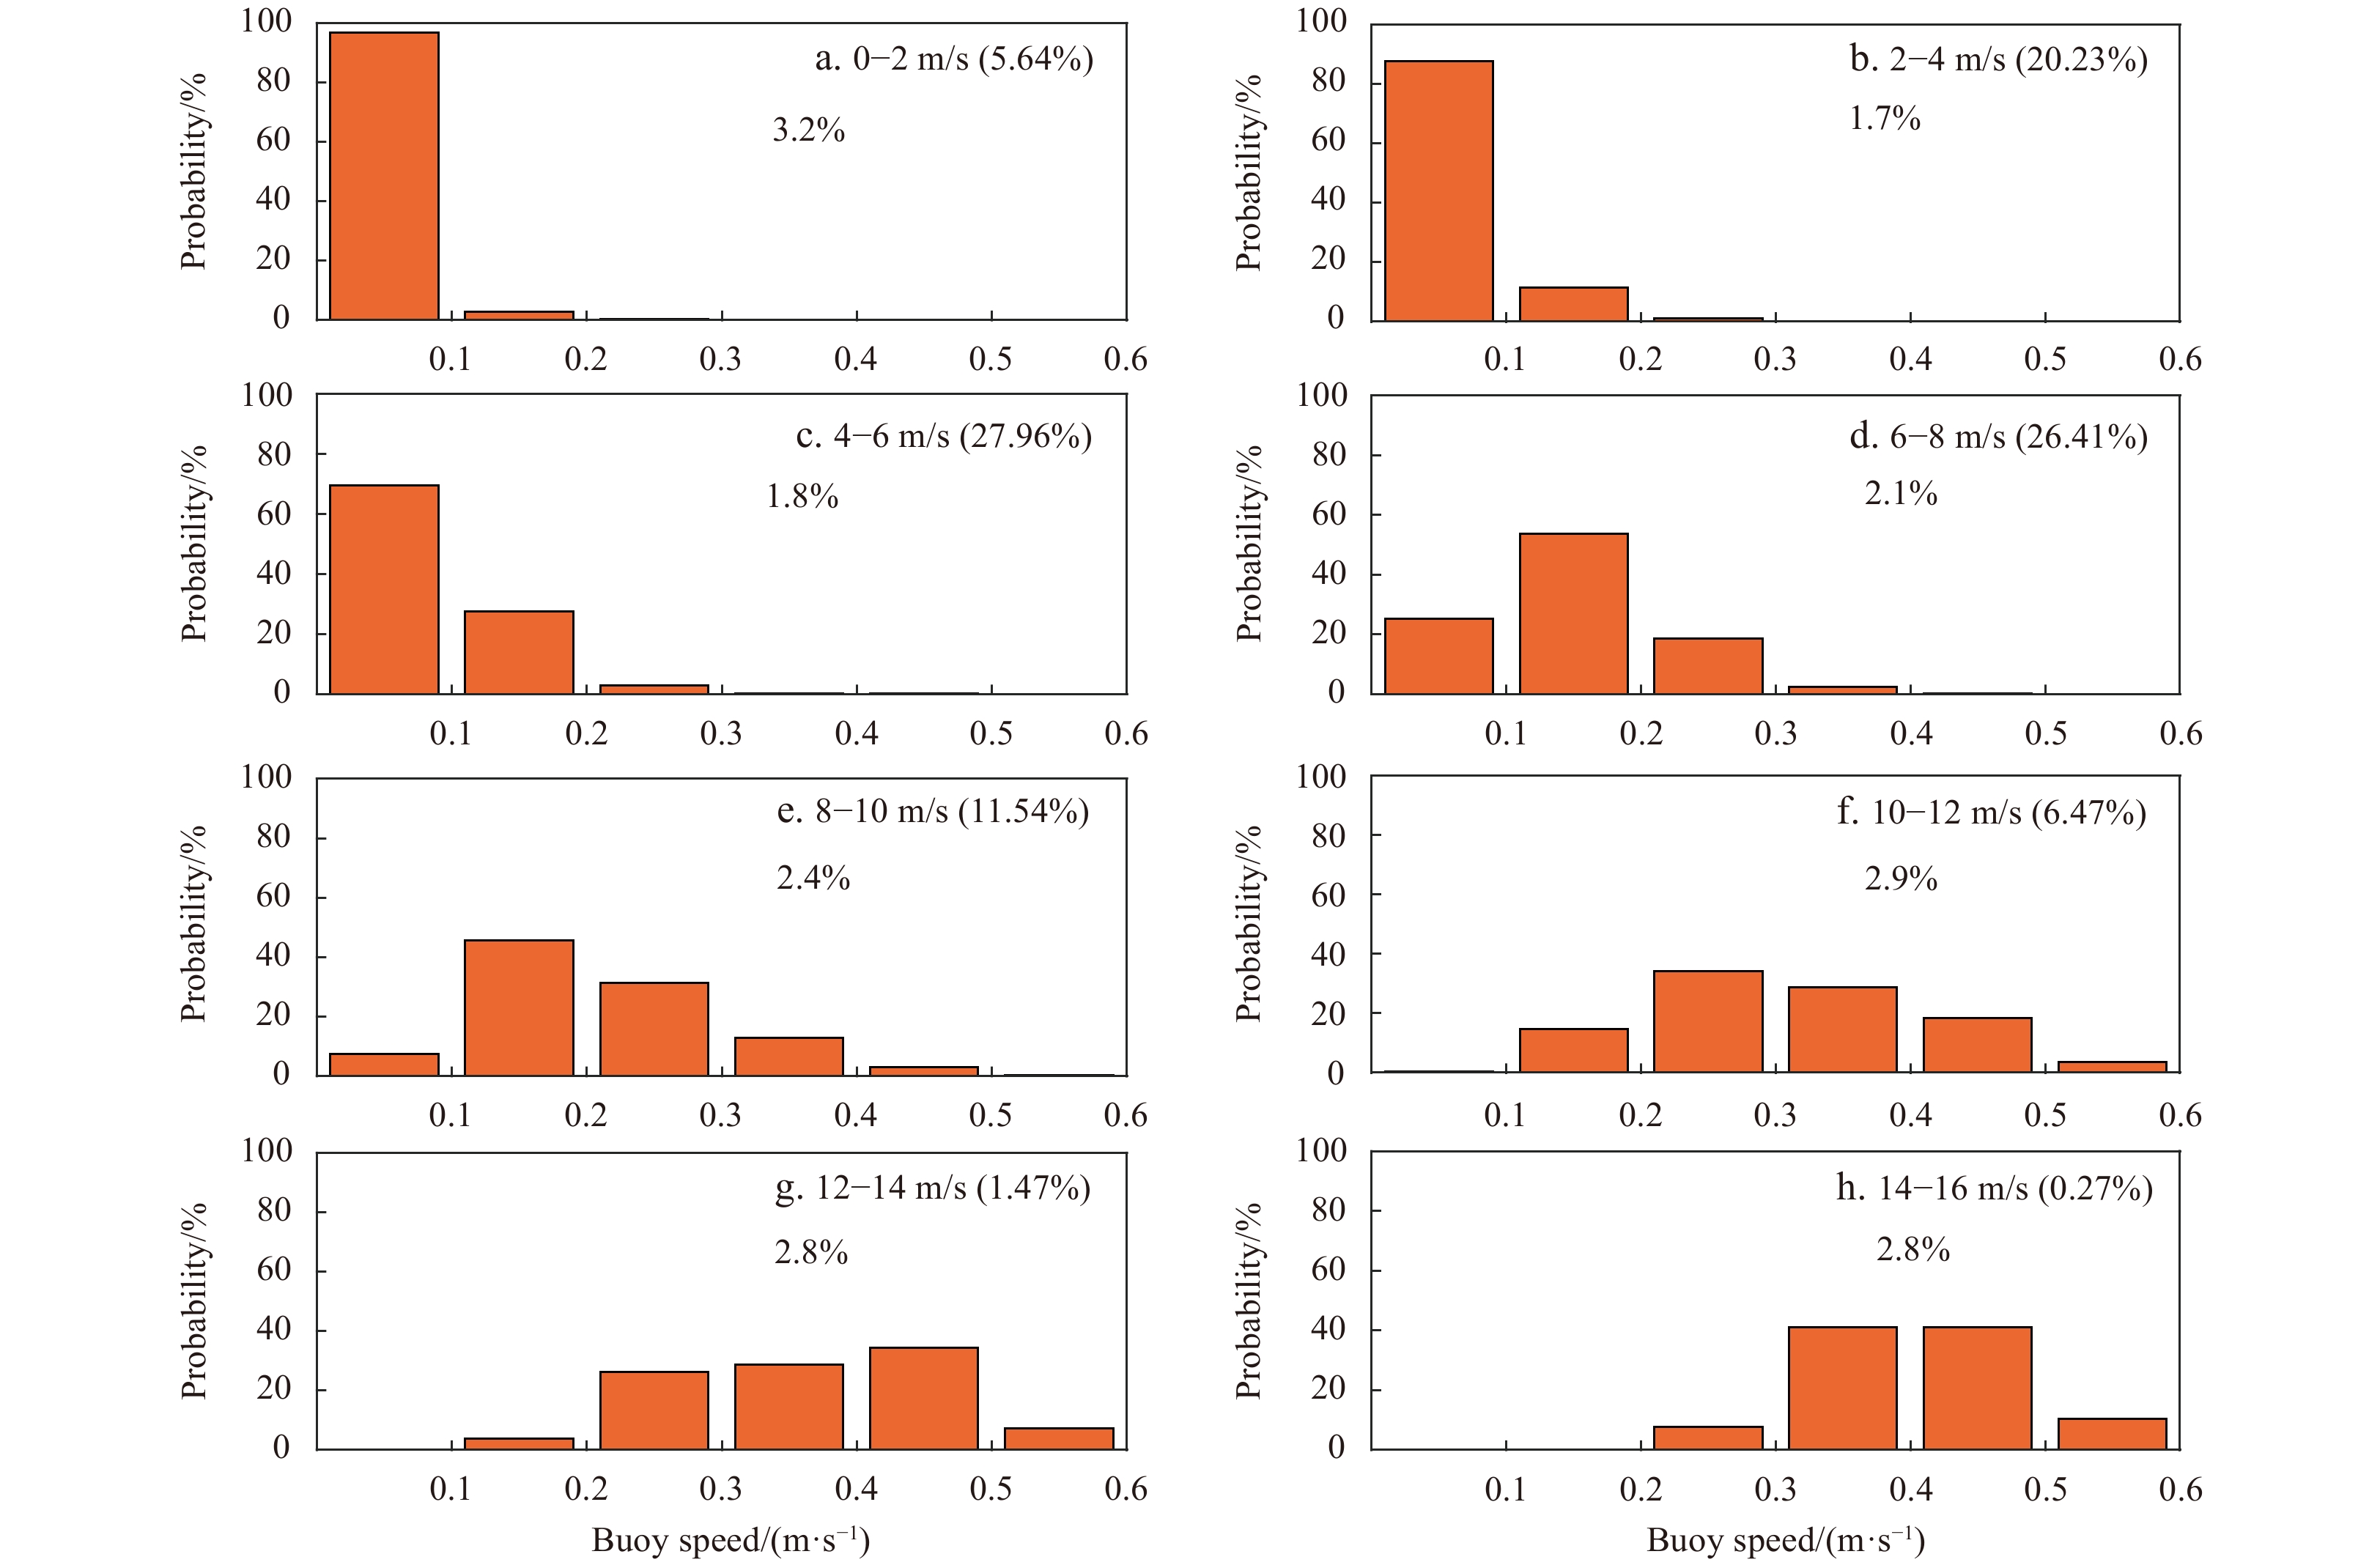
Figure 12. Distribution of buoy velocity among Buoys A–D for 2 m/s magnitude bands of wind speed for ice concentrations >50%. The probability of each wind-speed class is shown in brackets, and the mean wind factor is shown below the wind-speed class.
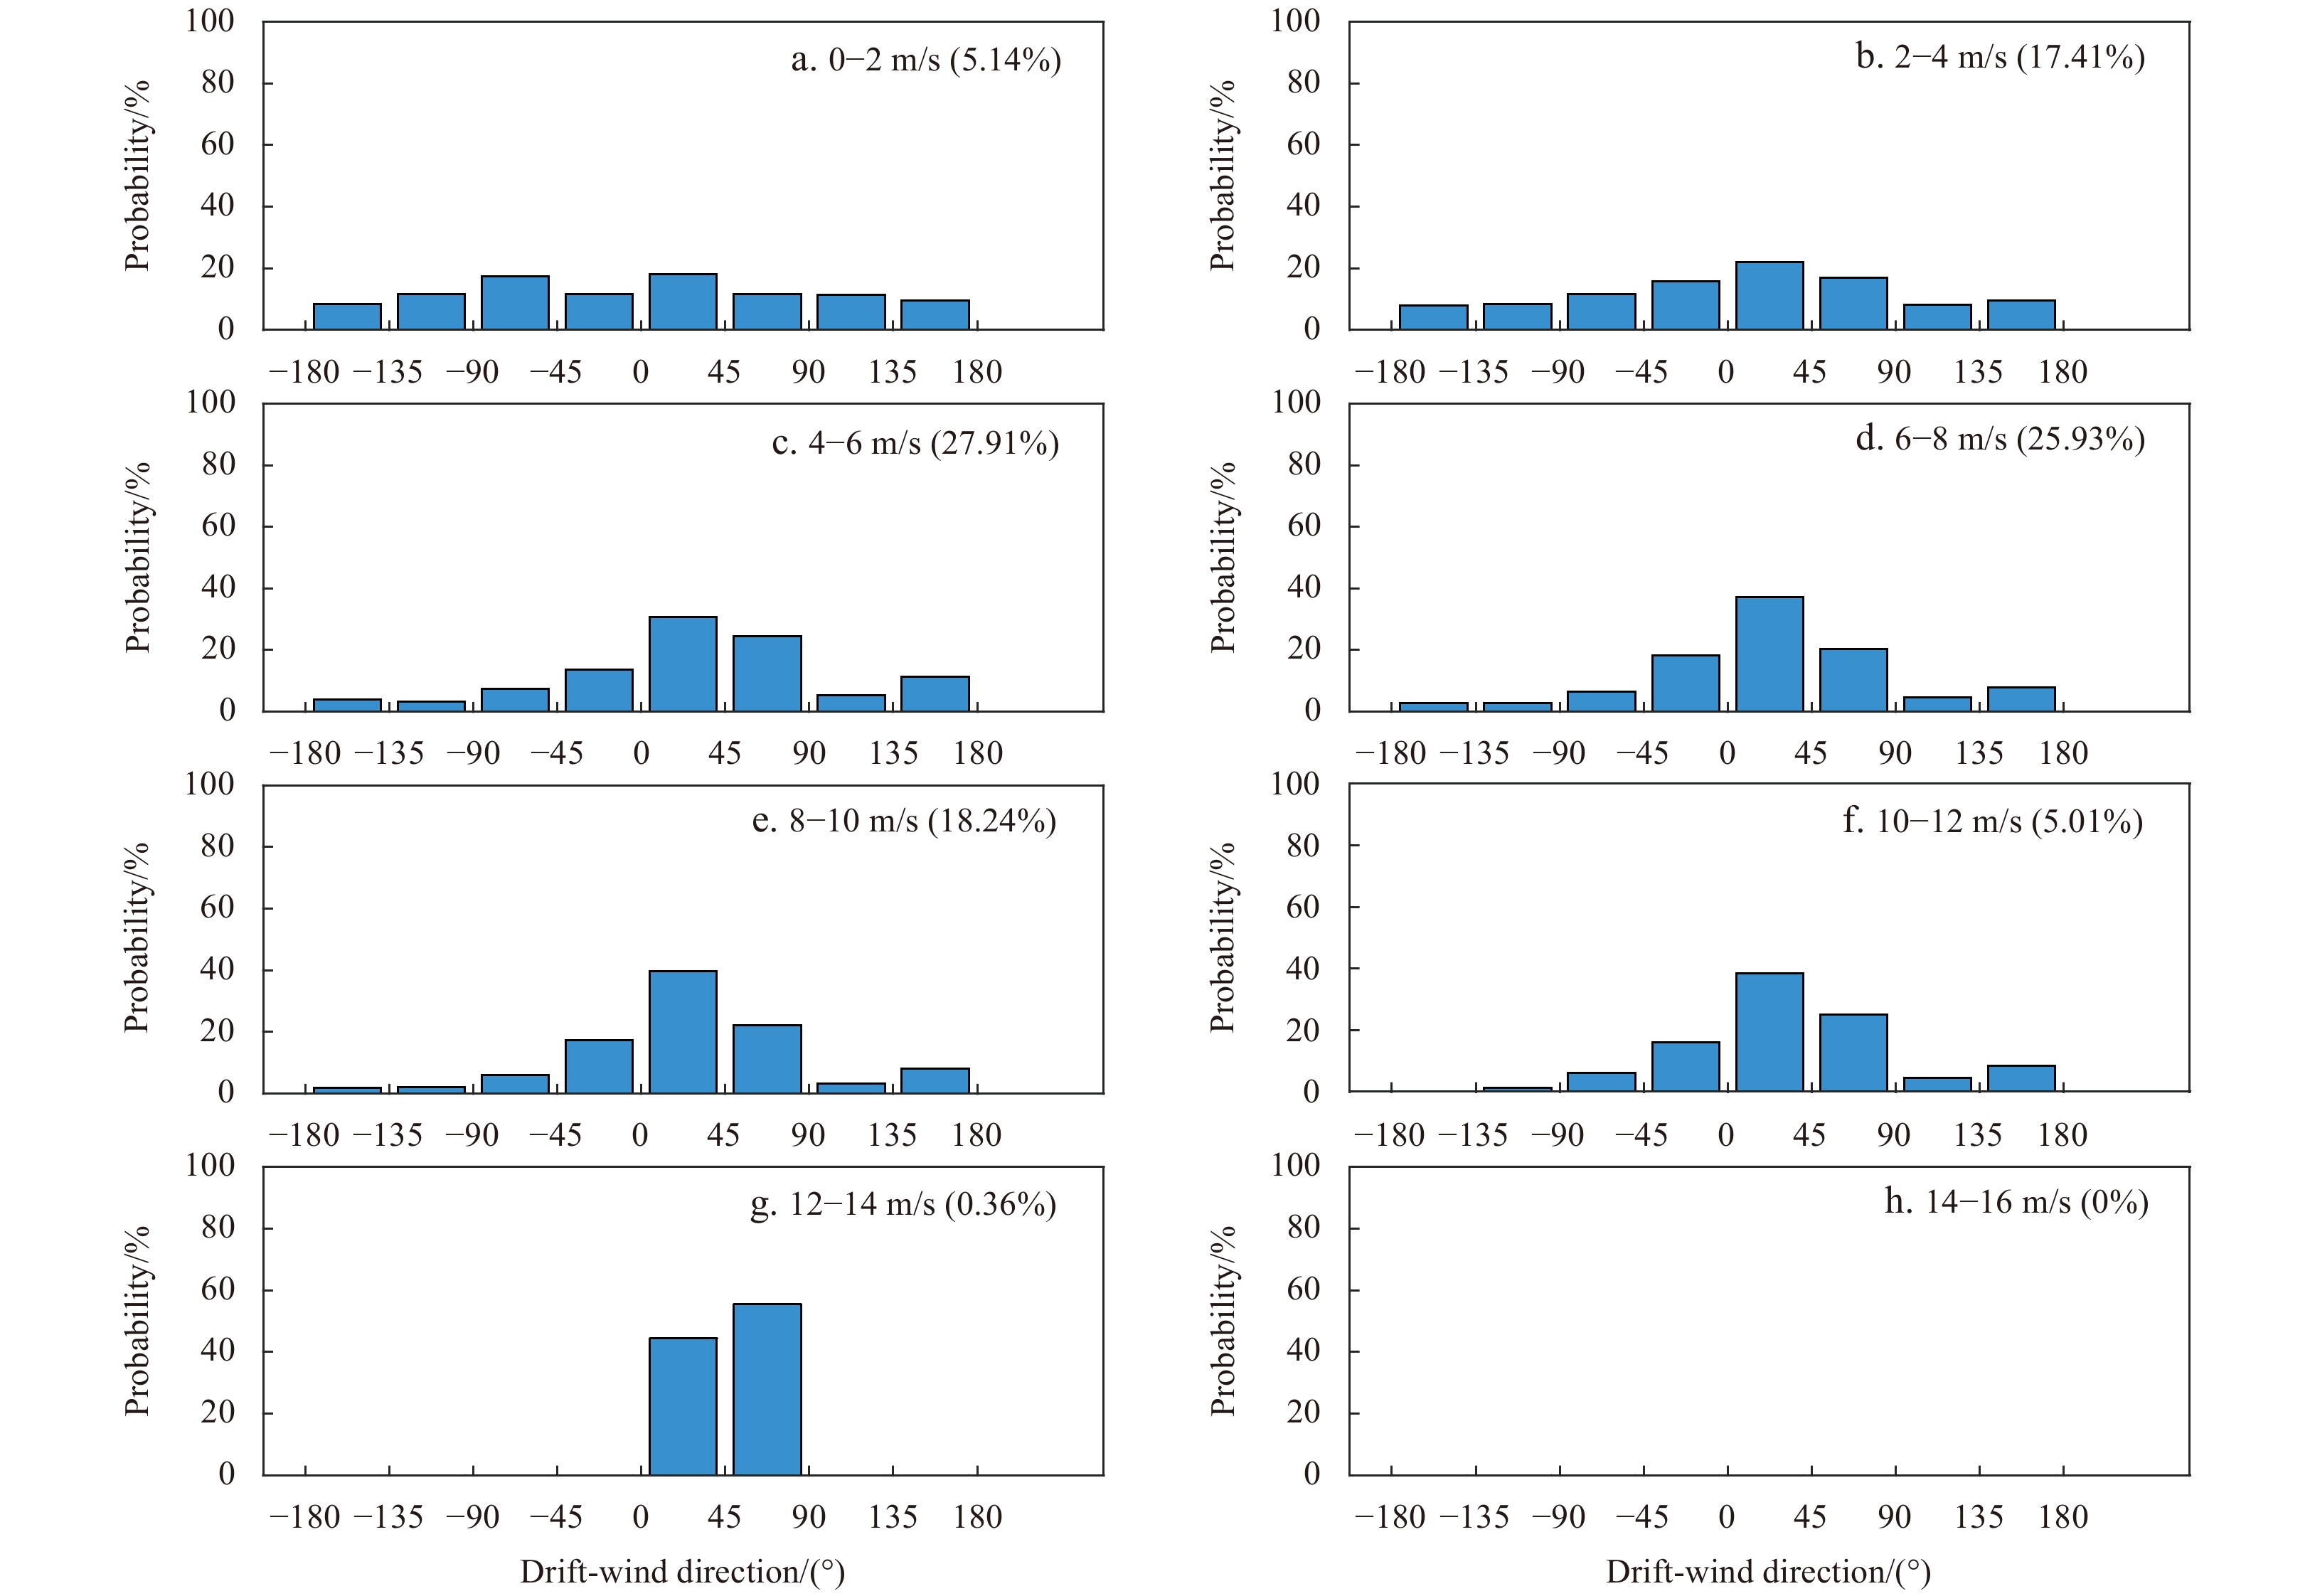
Figure 13. Distribution of buoys drift turning angle with wind vectors for 2 m/s magnitude bands of wind speed for ice concentrations <50%. The probability of each wind-speed class is shown in brackets. Positive turning angle means buoys drift to the right of the wind.
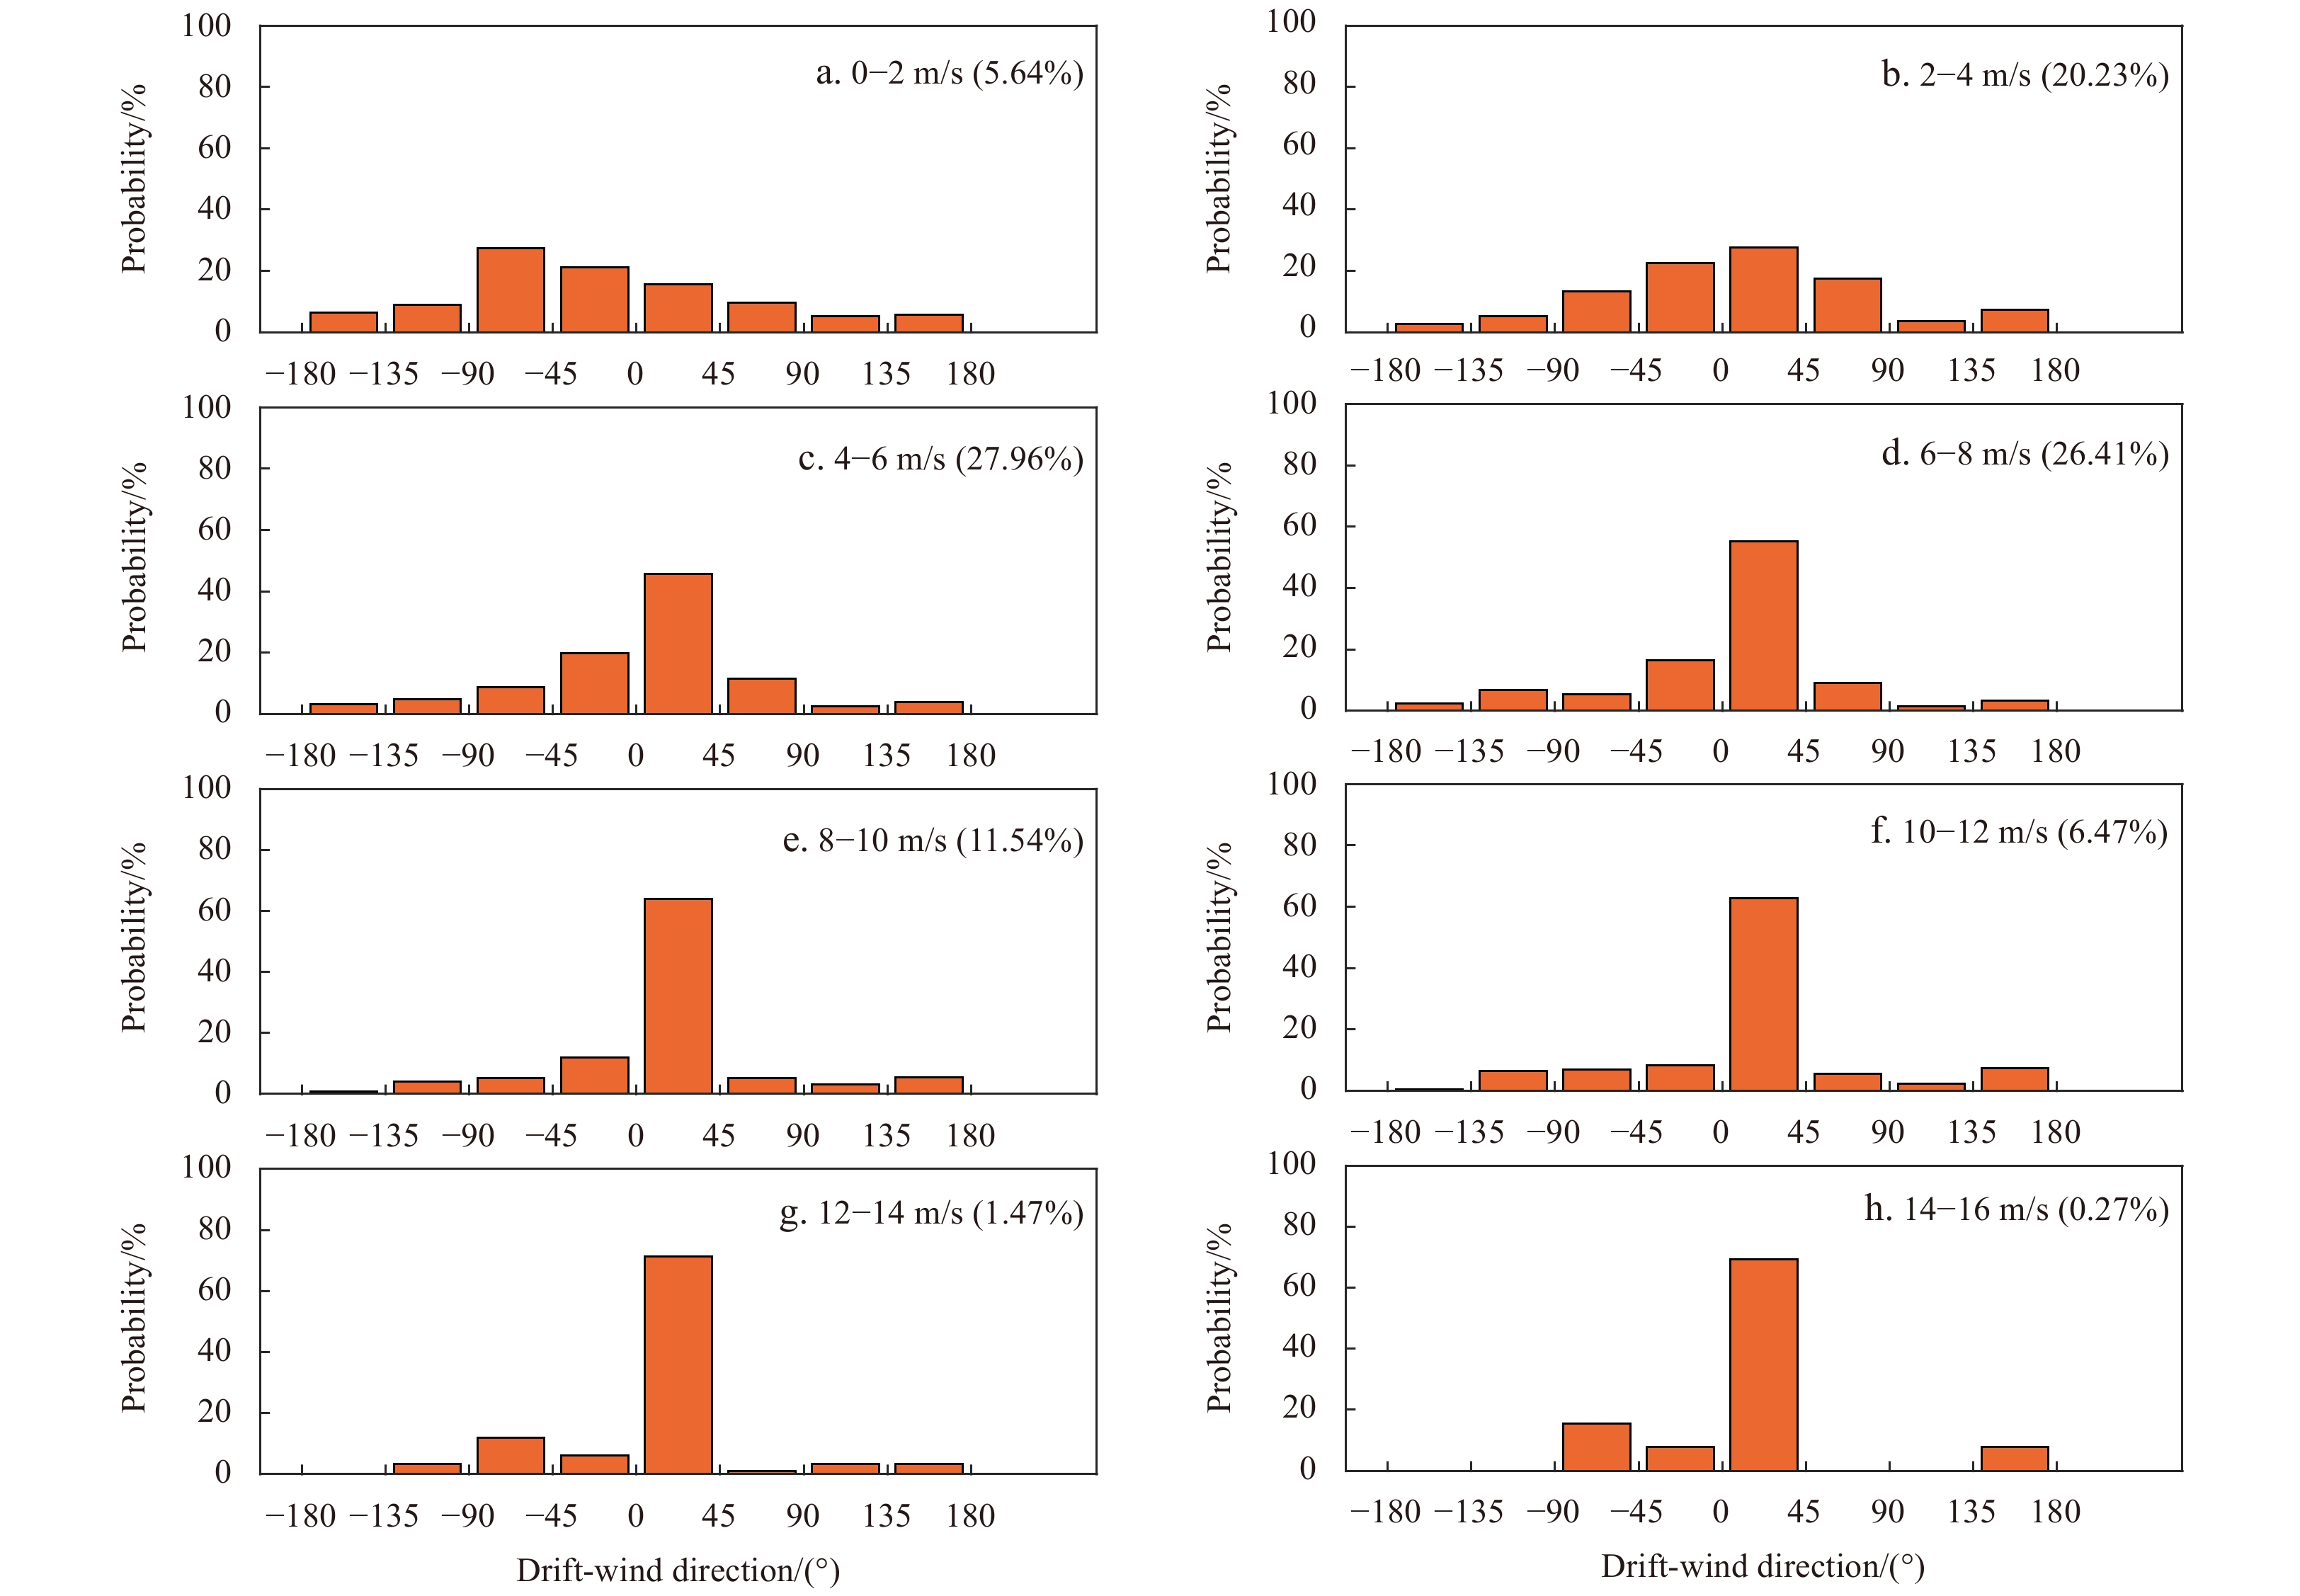
Figure 14. Distribution of buoys drift turning angle with wind vectors for 2 m/s magnitude bands of wind speed for ice concentrations >50%. The probability of each wind-speed class is shown in brackets. Positive turning angle means buoys drift to the right of the wind.
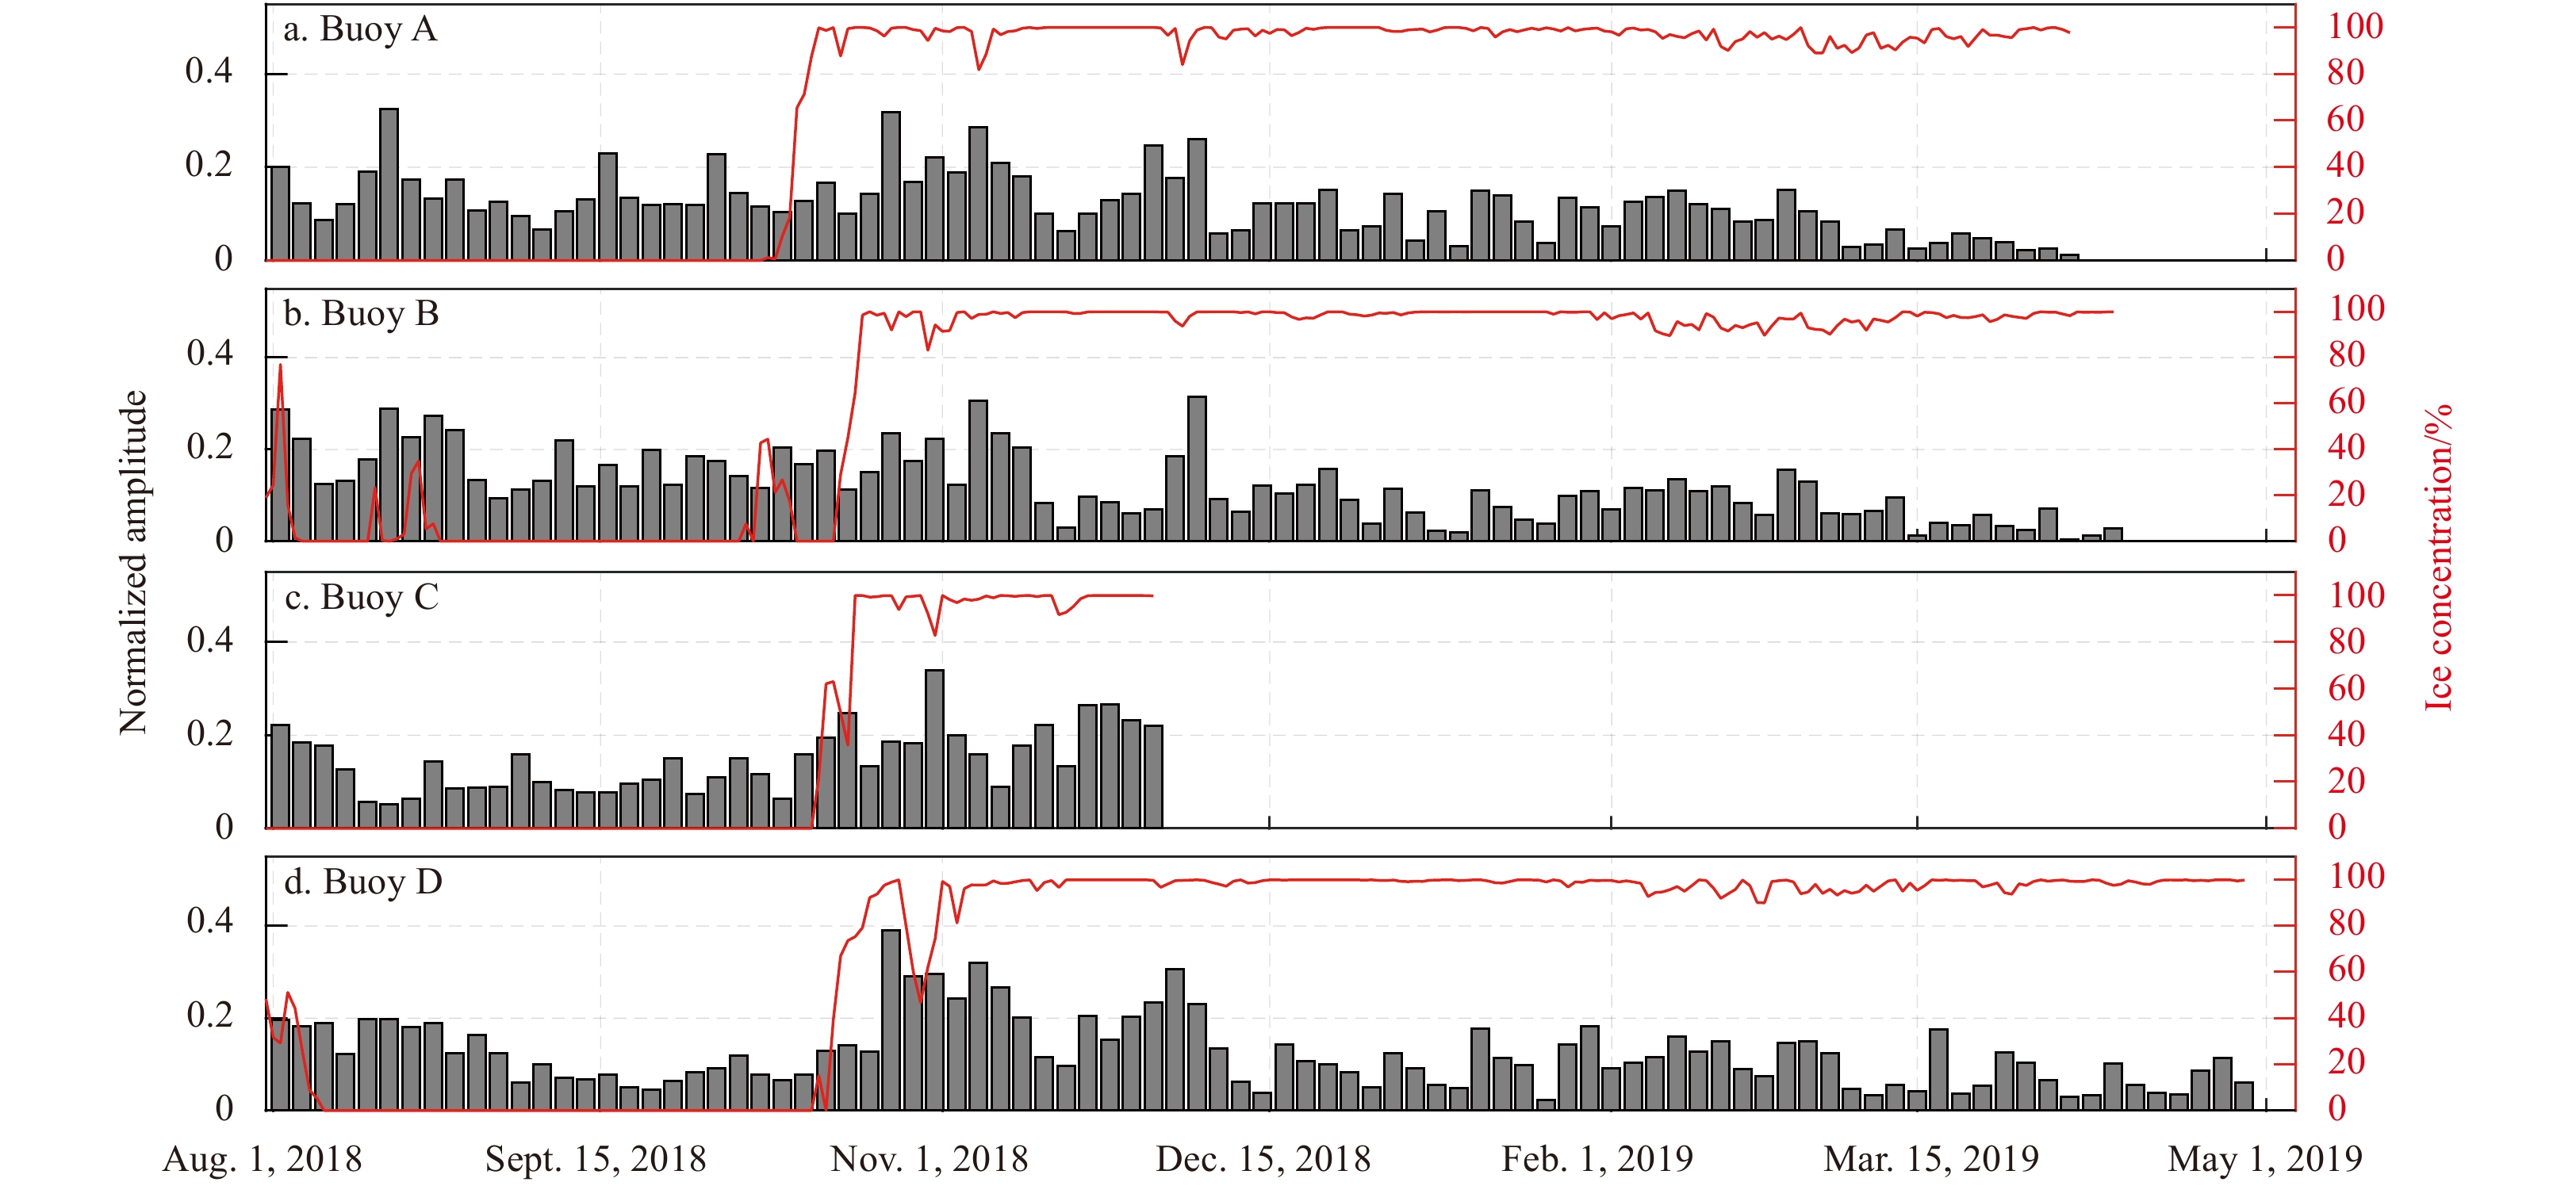
Figure 15. Amplitude after Fourier transformation corresponding to the 12-h cycle of the normalized velocities for a sliding three-day window and near ice concentration of Buoys A–D.


 DownLoad:


 DownLoad: