Cheng He, Sha Xu, Shuqun Song, Caiwen Li. Spatial and diel variations of the prokaryotic community in the Phaeocystis globosa blooms area of Beibu Gulf, China[J]. Acta Oceanologica Sinica, 2022, 41(12): 87-97. doi: 10.1007/s13131-022-1984-6
Citation:
Cheng He, Sha Xu, Shuqun Song, Caiwen Li. Spatial and diel variations of the prokaryotic community in the Phaeocystis globosa blooms area of Beibu Gulf, China[J]. Acta Oceanologica Sinica, 2022, 41(12): 87-97. doi: 10.1007/s13131-022-1984-6
Cheng He, Sha Xu, Shuqun Song, Caiwen Li. Spatial and diel variations of the prokaryotic community in the Phaeocystis globosa blooms area of Beibu Gulf, China[J]. Acta Oceanologica Sinica, 2022, 41(12): 87-97. doi: 10.1007/s13131-022-1984-6
Citation:
Cheng He, Sha Xu, Shuqun Song, Caiwen Li. Spatial and diel variations of the prokaryotic community in the Phaeocystis globosa blooms area of Beibu Gulf, China[J]. Acta Oceanologica Sinica, 2022, 41(12): 87-97. doi: 10.1007/s13131-022-1984-6
North China Sea Environmental Monitoring Center, State Oceanic Administration, Qingdao 266033, China
2.
Key Laboratory of Ecological Prewarning, Protection and Restoration of Bohai Sea, Ministry of Natural Resources, Qingdao 266033, China
3.
Key Laboratory of Marine Ecology and Environmental Sciences, Chinese Academy of Sciences, Qingdao 266071, China
4.
Marine Ecology and Environmental Science Laboratory, Pilot National Laboratory for Marine Science and Technology (Qingdao), Qingdao 266237, China
5.
Center for Ocean Mega-Science, Chinese Academy of Sciences, Qingdao 266071, China
6.
Shaanxi Provincial Academy of Environmental Science, Xi’an 710061, China
Funds:
The National Key Research and Development Program of the Ministry of Science and Technology, China, under contract No. 2017YFC1404300; the Scientific and Technological Innovation Project of the Pilot National Laboratory for Marine Science and Technology (Qingdao) under contract No. 2016ASKJ02; the Aoshan Talents Program of the Pilot National Laboratory for Marine Science and Technology (Qingdao) under contract No. 2015ASTP.
While prokaryotes play key roles in nutrient cycling and energy flow during Phaeocystis globosa blooms, the information on the spatial and diel temporal distribution of the prokaryotic community during Phaeocystis blooms remains scarce. In January 2019, we used high-throughput sequencing of the 16S rRNA gene to explore the spatial and diel variations of particle-attached (PA) and free-living (FL) prokaryotic communities during the blooming phase of P. globosa in Beibu Gulf, Guangxi, China. The results suggested a significant spatial variation pattern in the horizontal distribution of prokaryotic communities, while there was no significant difference in the vertical direction. Both spatial distance and environmental variables shaped the horizontal distribution of the prokaryotic community structure, while environmental variables, particularly the abundance of P. globosa colony and Chl a, showed more significant influence and were closely related to the structure and variation of the prokaryotic community. Strong vertical mixing of the water column disrupted the vertical structure heterogeneity of the prokaryotic community in winter. There were significant differences in the diel samples of PA prokaryotic communities, but not in the FL prokaryotic communities. Nitrate, ammonium and the abundance of P. globosa colony were the key environmental variables impacting the diel variations of prokaryotic communities over the sampling period. The present study provided valuable information to depict the spatial-temporal variations of the microbial community and its association with environmental parameters during P. globosa bloom in the tropical gulf.
The harmful microalga Phaeocystis globosa Scherffel frequently forms dense blooms in colonial form, resulting in negative impacts on the marine ecosystem and consequent economic losses to local fisheries, aquaculture, and coastal landscapes (Schoemann et al., 2005; Spilmont et al., 2009; Xu et al., 2019), as well as threatening the safety of cooling systems of nearshore nuclear power plants (Yu et al., 2017). During large-scale P. globosa blooms, massive amounts of organic matter, particularly DMS or dimethylsulfoniopropionate (DMSP), are generated by primary production, highlighting its non-negligible roles in global biogeochemical cycles of carbon and sulphur (van Rijssel et al., 2000; Qi et al., 2002; Schoemann et al., 2005). In addition, most of the biomass produced (ungrazed senescent colonies and/or aggregates) in the blooms were remineralized in the water column by free-living and attached bacteria (Becquevort et al., 1998; Rousseau et al., 2000; Schoemann et al., 2005). Therefore, the profound interactions between P. globosa colonies and microbial communities were the key processes involved in nutrient supply and metabolic activities of marine plankton in affected seawaters (Janse et al., 2000; Alderkamp et al., 2007; Wöhlbrand et al., 2017; Li et al., 2020). To better understand the microbial roles in the P.globosa blooms, it is essential to characterize the spatial and temporal distribution of microbial communities in natural ecosystems.
The Beibu Gulf, located in the northwest of the South China Sea, is a semi-enclosed gulf surrounded by the land territories of China and Vietnam. It is less than 200 n mile at its widest point and covers an area of approximately 12.8×10⁴ km2 (Chen et al., 2011). The isobath distribution trend in this sea area is roughly parallel to the coastline. The coastal water from the coast of Guangxi to Leizhou Peninsula is shallow with a depth of less than 30 m, and is a high-incidence area of P. globosa blooms during the last decade (Xu et al., 2019). In the gulf, both environmental factors and geographic distance could affect microbial community composition and structure (Martiny et al., 2006), and it might even be possible that persistent environmental heterogeneity overwhelmed geographic separation in shaping microbial distribution (Wang et al., 2015). Moreover, the strong and stable northeast monsoon and cyclonic circulation intensify the vertical mixing in the shallow water area in winter (Zu, 2005; Gao et al., 2014). Such shallow depths and strong vertical mixing may allow microbes to interact frequently in the water column, and thus lead to a microbial ecological shift in both surface and bottom layers of coastal waters (García et al., 2015; Salter et al., 2015; Hernando-Morales et al., 2018; Yu et al., 2018). The microbial community in the water column may also be affected by Phaeocystis colonies that mixed down to tens of meters, but still growing actively and releasing transparent exopolymer particles after disruption of the senescent colonies (Peperzak et al., 2000; Mari et al., 2005; Schoemann et al., 2005; Smith et al., 2017).
Monthly variability of the prokaryotic community in the P. globosa blooms area of Beibu Gulf have been previously reported (Li et al., 2020; He et al., 2021). However, the temporal dynamics of prokaryotic communities have not been studied on a finer resolution (time scale in hours) during the P. globosa blooms. The prokaryotic community structure was assessed by diel changes in growth conditions such as light and nutrients in other coastal areas (Fuhrman et al., 1985; Ghiglione et al., 2007; Gilbert et al., 2010). Phytoplankton also impacted the diel variability of the prokaryotic community (Ghiglione et al., 2007; Lau et al., 2007; Celussi et al., 2008; Rink et al., 2008). The diel coupling relationship between phytoplankton and bacteria may be due to the release and consumption of photosynthate driven by sunlight energy on circadian cycles (Fuhrman et al., 1985; Gasol et al., 1998; Ghiglione et al., 2007). The northern Beibu Gulf is a typical diurnal tidal area with a range of approximately 2.3–2.5 m and a maximum tidal depth of 5.8 m (Chen, 2013; Lai et al., 2014), and tidal change was an essential factor in controlling prokaryotic communities in coastal waters (Celussi et al., 2008; Rink et al., 2008; Olapade, 2012).
Thus, a comprehensive field study was conducted in the high incidence area of P. globosa blooms of the Beibu Gulf to reveal the spatial (horizontal and vertical) and diel differences in prokaryotic communities. Water and bacteria samples were collected from representative stations during the outbreak phase of the bloom in January 2019. The composition and structure of the prokaryotic communities were further explored with the assistance of high-throughput sequencing technology. The major objectives were to (1) determine the spatial distributions of the composition and structure of the prokaryotic communities during the outbreak of P. globosa bloom, (2) depict the dynamics of prokaryotic community within a diel cycle of the algal bloom, and (3) examine the role of the major environmental parameters (e.g., physicochemical parameters, P. globosa bloom) as the main factors acting on the variability.
2.
Materials and methods
2.1
Cruise and fieldsampling
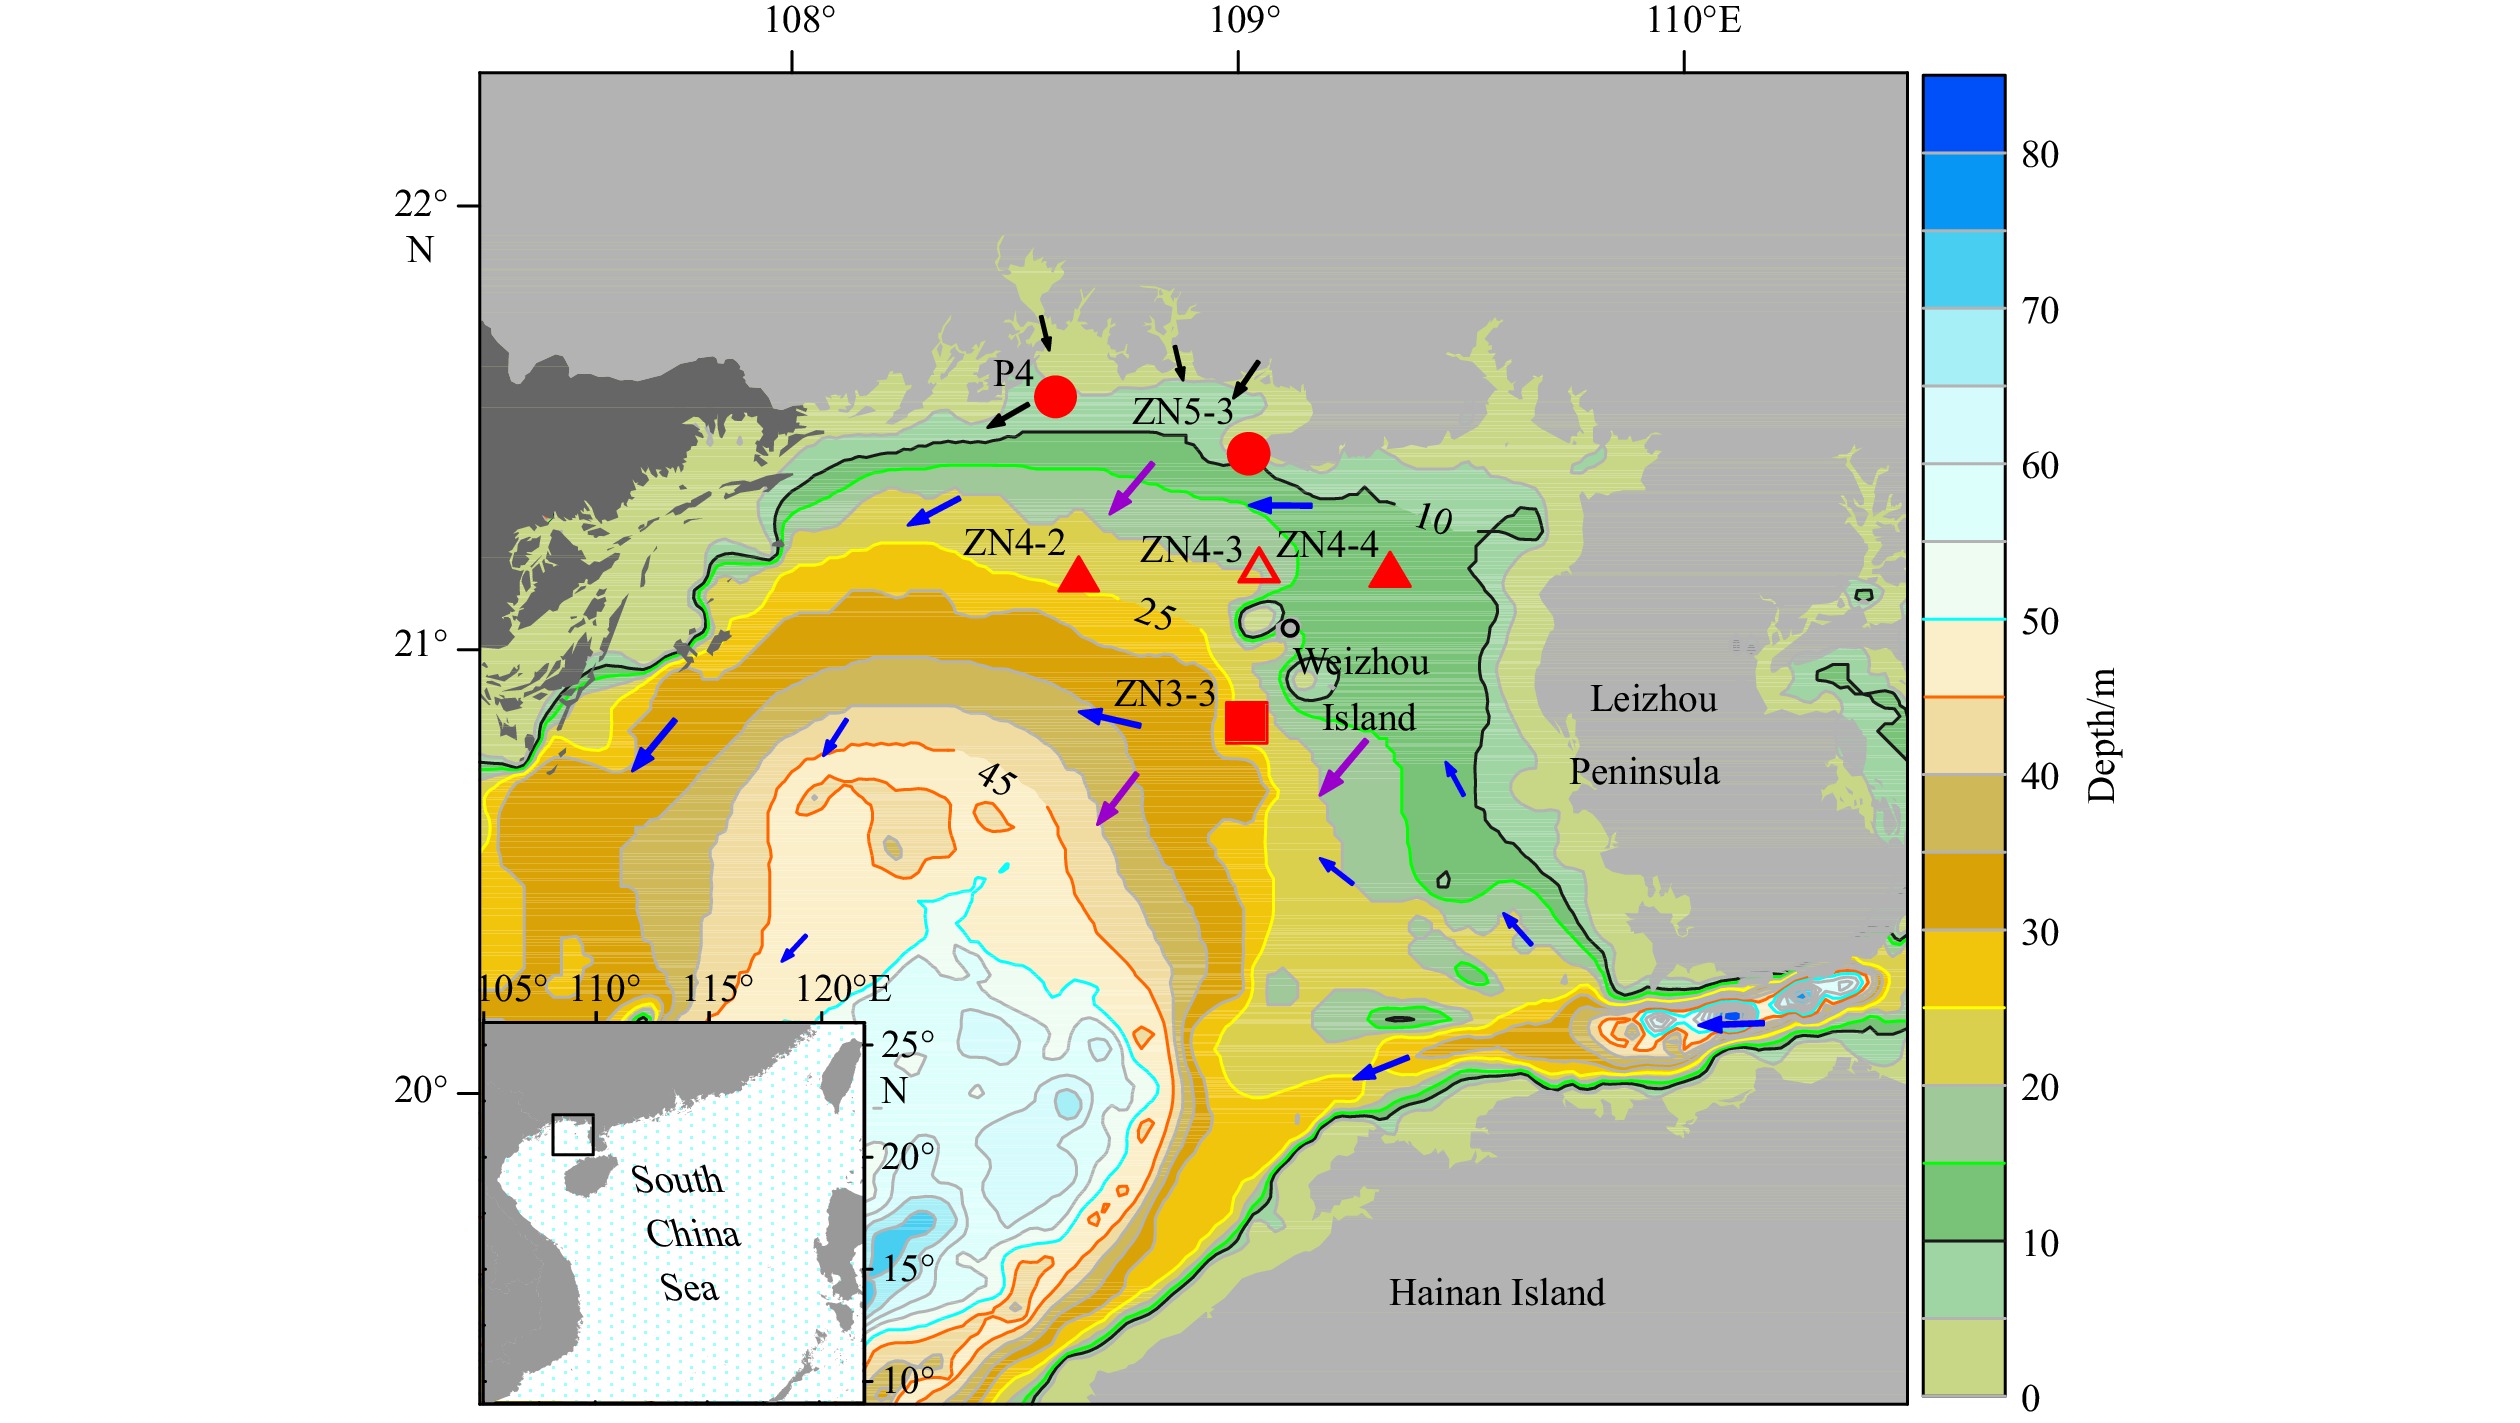
In January 2019, a field cruise (R/V Yuezhanyuke-10) was conducted in Beibu Gulf, Guangxi, China. Environmental water samples were collected from the stations in the high-incidence area of P. globosa blooms from Guangxi coast to Weizhou Island (Fig. 1) with Niskin bottles attached to a Sea-Bird 911 plus Conductivity-Temperature-Depth (CTD) system (Sea-Bird Electronics Inc., Bellevue, WA, USA). The surface (2 m) and bottom (2–3 m above sediment) seawater samples (referring to spatial samples in the following sections) were collected from six stations (coastal stations: P4 and ZN5-3; ZN4-X section: ZN4-2, ZN4-3, and ZN4-4; deeper water station: ZN3-3). Diel sampling was performed in the central area (Station ZN4-3) of the bloom. Samples (referring to diel samples in the following sections) were taken every 6 h starting from 23:00 of January 11 (T0) until 23:00 of the next day (T4) in the surface layer (2 m). For data analyses, samples collected from Stations ZN3-3, ZN4-2, ZN4-3, ZN4-4, and ZN5-3 were abbreviated as Z3.3, Z4.2, Z4.3, Z4.4, and Z5.3, respectively.
Figure
1.
Location of sampling stations in the northern Beibu Gulf, China. The circles represent coastal stations, the square represents the deeper water station, and the triangles represent stations of the ZN4-X section, among which the empty triangle indicates the diel sampling station. Blue arrows indicate the general pattern of cyclonic circulation, purple arrows show the northeastern monsoon in winter, and black arrows point out riverine inputs in the sampling area (Bauer et al., 2013; Chen, 2013).
2.2
Environmental data collecting and sampleprocessing
Temperature (T) and salinity (S) were measured with a CTD, and pH was measured using a pH meter (PHSJ-4A, Rex, INESA Scientific Instrument Co. Ltd., Shanghai, China). Dissolved oxygen (DO) was quantified immediately after sample collection using the Winkler method (Strickland and Parsons, 1972). The chlorophyll a (Chl a) was collected by filtering 250–500 mL of seawater through Whatman GF/F filters in turn under low vacuum pressure (<0.04 MPa), and further measured by a Turner Design fluorometer after extraction with 90% (v/v) acetone (Strickland and Parsons, 1972). Water samples were filtered through Whatman GF/F filter membranes to analyze inorganic nutrients (${{\rm {NO}}_3^-} $, ${{\rm {NO}}_2^-} $, ${{\rm {NH}}_4^+} $, ${{\rm {PO}}_4^{3-}} $, and ${{\rm {SiO}}_3^{2-}} $), which were analyzed by a SKALAR Flow Analyzer (San++ system, Skalar, Netherland). The tidal height data were obtained from the National Marine Data Information Service, Tianjin, China.
Immediately after collecting water samples, P. globosa colonies, which are visible to the naked eye (approximately 1–10 mm), were counted in a tray, and their abundances in the water layer were calculated (Huang et al., 1999). For prokaryotic community analysis, triplicate seawater samples (approximately 500 mL) were filtered through a 3 μm pore size polycarbonate membrane (47 mm diameter, Millipore, Boston, MA, USA) and subsequent 0.2 μm pore size polycarbonate membrane (47 mm diameter, Millipore, Boston, MA, USA) to collect particle-attached (PA) prokaryotes and free-living (FL) prokaryotes, respectively. The filtered membranes were immediately frozen in liquid nitrogen and transported back to the laboratory, where they were stored at −80℃ until further processed for molecular analysis.
2.3
DNA extraction, PCR amplification, and sequencing
Total DNA was directly extracted from samples using the CTAB method (Lutz et al., 2011). The DNA concentration and purity were monitored by electrophoresis on 1% agarose gels. According to the concentration, DNA was diluted to 1 ng/μL using sterile water. The universal prokaryotic primers 341F (5′-CCTAYGGGRBGCASCAG-3′) and 806R (5′-GGACTACNNGGGTATCTAAT-3′) (Takahashi et al., 2014) were used to amplify the V3-V4 hypervariable regions of the 16S rRNA gene for all samples. All PCR reactions were carried out with Phusion® High-Fidelity PCR Master Mix (New England Biolabs, Ipswich, MA, USA). The PCR products were mixed with 1× loading buffer (contained SYBR green) and estimated on 2% agarose gel by electrophoresis. Samples with the bright main strip between 400–450 bp were chosen for further experiments. The PCR products were then purified with Qiagen Gel Extraction Kit (Qiagen, Hilden, Germany), and sequencing libraries were generated using TruSeq® DNA PCR-Free Sample Preparation Kit (Illumina, San Diego, CA, USA). The library quality was assessed on the Qubit@ 2.0 Fluorometer (Thermo Fisher Scientific, Waltham, MA, USA) and Agilent Bioanalyzer 2100 system (Agilent Technologies, Santa Clara, CA, USA). Finally, sequencing was conducted on an Illumina Novaseq6000 platform, and 250 bp paired-end reads were generated. Notably, due to low DNA concentrations and/or unclear technical challenges, library construction failed for the PA prokaryote at Stations ZN3-3 and ZN4-4 in spatial samples and the FL prokaryote at T1 in diel samples. Sequencing and analysis of DNA from all samples were performed at Novogene Bioinformatics Technology Co. Ltd., Beijing, China. Raw data files in FASTQ format were deposited in the NCBI Sequence Read Archive (SRA) under BioProject number PRJNA778620.
2.4
Sequence data processing and statistical analysis
Paired-end reads were first assigned to samples, truncated by cutting off the barcode and primer sequence, then merged using FLASH (V1.2.7) to obtain raw tags. According to the QIIME (Version 1.9.1) quality control process, the raw tags were filtered and developed into high-quality tags. UCHIME was used to remove chimeras by comparing the tags with the reference database (Silva database, Version 132) to obtain effective tags. The Uparse software (Version 7.0.1001) was used to generate operational taxonomic units (OTUs). Sequences with ≥97% similarity threshold were clustered into the same OTUs. Representative sequence for each OTU was screened for further annotation. We made taxonomic information annotation for each representative sequence based on Mothur algorithm (Version 1.25.0) using the Silva Database (Version 132). Nonprokaryotic OTUs (eukaryotes, chloroplast, and mitochondria), as well as singletons (defined as OTUs containing only one read with a single occurrence in the combined data from all samples), were removed from the dataset. The MUSCLE software (Version 3.8.31) was used to perform multiple sequence alignments for all representative OTU sequences. The OTUs abundance information was normalized using a standard of sequence number corresponding to the sample with the least sequences (27 058 for spatial samples and 43 018 for diel samples). These normalized output data were used for all downstream analyses.
The microbial distribution in the samples was visualized using R based on community composition information at taxonomic levels. The alpha and beta diversity indexes were calculated with QIIME (Version 1.9.1). The non-parametric Wilcoxon test was performed in the agricolae package in R for estimation of significant differences in α-diversities among sample groups as the data normality and homoscedasticity of variance were not assured (Salazar et al., 2015). The differences in community structure among samples were investigated by nonmetric multidimensional scaling (NMDS) based on Bray-Curtis distances among samples (Kruskal, 1964), and Analysis of Similarity (ANOSIM) was performed to determine whether samples from each group were significantly different (Clarke, 1993). NMDS and ANOSIM were all analyzed using the vegan package in R. Distance-based Redundancy Analyses (dbRDA) were used to determine the influence of environmental variables on sample distribution (McArdle and Anderson, 2001), further generating the plots using vegan and ggplot2 packages in R. Collinearity among the variables was assessed based on the variance inflation factor (VIF<10) calculated using the car package in R. ENVFIT functions used to test the significance of each environmental variable were analyzed using the vegan package in R. Spearman rank correlations relating environmental variables with the community α-diversity and relative abundance of dominant taxa were calculated using the psych package in R and visualized by the pheatmap package.
Pearson correlation coefficients were used to analyze the relationship between environmental variables. One-way analysis of variation (ANOVA) and least significance difference test (LSD, 0.5 confidence threshold) were conducted to determine the environmental dissimilarity in the spatial sample group. Pearson correlation and one-way ANOVA were carried out with the software SPSS 19.0. The relationships between the Bray-Curtis distances and geographic distances and environmental distances (Euclidean) were analyzed based on the general linear model in the software Origin 2019b.
3.
Results
3.1
Characterization of environmental parameters
The corresponding environmental variables of the water samples collected in the northern Beibu Gulf, China are summarized in Table S1. Water temperatures ranged from 13.35℃ to 19.68℃, with lower temperatures at the coastal station and higher temperatures at the offshore stations. Salinity varied in the range of 30.06–32.31, indicating a gradual increase from the coastal station to offshore stations. Temperature and salinity were distributed uniformly with depth, and there was no stratification in the water column (Fig. S1), indicating strong vertical mixing in the sampling area. One-way ANOVA confirmed the similarity of environmental variables in the surface and bottom layers (p>0.05). Latitude showed a negative relationship with water depth (Pearson correlations analysis, Table S2a, p<0.01), which is consistent with the topographic feature that water depth increases from the shallow coastal Station P4 to the Station ZN3-3. The environmental variables (except for the abundance of P. globosa colony, nitrite, and ammonium) were significantly related to latitude and water depth (p<0.01). One-way ANOVA and LSD test confirmed the dissimilarity of environmental variables (except for ammonium) among different sampling stations (p<0.05).
Colonies of P. globosa were found at all six stations, but the abundance of colonies in the surface and bottom layers differed at each station. For example, no P. globosa colony was observed in the surface layer at Station ZN3-3, with a few colonies appearing in the bottom layer with the abundance of 11.67 colonies/L. The highest abundance of P. globosa colony appeared in both surface and bottom layers at Station ZN4-3, with the abundance of 360.00 colonies/L and 370.00 colonies/L, respectively. In the subsequent diel sampling, however, the abundance of P. globosa colony in the surface layer at this station decreased sharply, with the highest value at midnight being only 22.00 colonies/L, and no colony was observed at noon (Table S1b). Temperature and salinity fluctuated in a small range throughout the tidal cycle. The maximum value of Chl a appeared at low tide, when the content of nitrate, nitrite, ammonium, and silicate is the lowest in the water (Table S1b). Pearson correlation analyses indicated that only the abundance of P. globosa colony and DO were significantly correlated with tidal height (Table S2b, p<0.05).
3.2
Spatial variation of prokaryotic community and its association with environmental variables
A total of 3 727 941 effective tags were obtained and clustered into 7 066 OTUs (97% similarity). The high coverage values (97.4%–99.4%) combined with the saturated rarefaction curves (data not shown) suggest that the sequencing effort was sufficient to cover the prokaryotic community diversity. The number of OTUs changed from 496 to 1 568 across spatial samples, with the highest OTU numbers seen in the PA fraction of the surface layer sample at Station P4 (Table S3a). In general, the α-diversities between the surface and bottom layers showed no remarkable difference except for the Shannon index of the FL fraction (p>0.05), while remarkable differences were observed between different sampling areas, especially in the PA fraction (p<0.05). Further analyses indicated remarkable differences between samples collected from the same layer at various stations (p<0.05). The α-diversity was more closely related to environmental variables in the PA fraction than that of the FL fraction (Spearman correlation analysis, Fig. S2a). In the PA fraction, the community Shannon and Chao 1 indexes showed significantly negative correlations with water depth, T, S, and inorganic nutrients (p<0.05), however, the indexes showed a significant positive correlation with Chl a and DO (p<0.05). In the FL fraction, only the Shannon index showed significant negative correlations with depth, ${{\rm {NO}}_3^-} $, ${{\rm {NH}}_4^+} $ and ${{\rm {SiO}}_3^{2-}} $ (p<0.05), and significant positive correlations with the abundance of P. globosa colony, Chl a, and pH (p<0.05), while the Chao 1 index was not significantly correlated with environmental variables (p>0.05). There was no significant correlation between α-diversity and collection depth (p>0.05), implying that the α-diversity in the bottom layer was similar to that of the surface layer. However, there was a significantly negative correlation between the Shannon index and water depth (p<0.05), indicating that the diversities of various stations were different.
The primary prokaryotic sequences in the spatial samples were affiliated with 35 families of 8 phyla, namely, the Proteobacteria, Cyanobacteria, Actinobacteria, Bacteroidetes, Thaumarchaeota, Euryarchaeota, Verrucomicrobia, and Firmicutes (Fig. 2a). Each of these 35 families accounted for 1% or more in at least one sample. Further analysis of the taxonomic distribution in the heatmap revealed the different aggregation degrees in prokaryotic assemblages at the family level in different stations, layers, and fractions. For example, in the FL fraction, the community compositions between the surface and bottom layers at ZN4-X section stations were similar, except that Hyphomonadaceae gathered more in the bottom layer at Station ZN4-4. The community compositions between the surface and bottom layers at coastal stations were also similar, while the compositions of the two regions were different. Besides, at Station ZN3-3, Pseudoalteromonadaceae, unidentified family of Alteromonadales, Bacteriovoracaceae, Alteromonadaceae, unidentified family of Thermoplasmata, and Nitrosopumilaceae mainly concentrated in the bottom layer, while Rhodobacteraceae and Halomonadaceae gathered mainly in the surface layer. Compared with the FL fraction, there was a lower similarity in the compositions of the PA fraction among stations.
Figure
2.
The heatmap of prokaryotic community composition in spatial (a) and diel (b) samples at the family level. The information of samples and species annotation were demonstrated along X-axis and Y-axis, respectively. The clustering tree was generated based on the family with the relative abundance >1.0% in at least one sample. The relative values in the heatmap depicted by colors after normalization indicated the aggregation degree or content of prokaryotic species among samples at the family level. Prefix: J, January. Suffix: BA, bottom particle-attached prokaryotes; SA, surface particle-attached prokaryotes; BF, bottom free-living prokaryotes; SF, surface free-living prokaryotes; SNA, surface night particle-attached prokaryotes; SDA, surface day particle-attached prokaryotes; SNF, surface night free-living prokaryotes; SDF, surface day free-living prokaryotes.
The NMDS ordination analysis and ANOSIM analysis (Fig. 3a, Table S4) displayed a clear separation between PA and FL fractions in both surface and bottom layers (r, 0.518 and 0.527, respectively; p<0.05), however, the differences between the surface and bottom layers of PA and FL fractions were not significant (p>0.05), and the difference between the surface layer and the bottom layer of the PA fraction was even lower than that within the group (r=−0.015; p=0.536). The NMDS analysis (Figs 3b, c) also clearly showed that there were significant differences in the community structure between the coastal stations and ZN4-X section stations in both PA and FL fractions (p<0.05), and there were significant differences between various stations (p<0.05). The degree of segregation in vertical stratification was relatively low between the surface and bottom communities except for the FL fraction at Station ZN3-3. The dissimilarity in prokaryotic communities between any two stations increased with increasing geographic distance (Figs S3a–d), which was consistent with NMDS analysis. Except for samples in the PA fraction of the bottom layer, the Euclidean distance of environmental variables exhibited stronger correlations with prokaryotic dissimilarities than geographic distance, which could be observed by the higher $r^2_{{\rm{adj}}}$ values (Fig. S3).
Figure
3.
Non-metric multidimensional scaling (NMDS) ordination showed dissimilarities in the prokaryotic communities based on Bray-Curtis distances. Results from the first 2 ordination axes are given, with 80% confidence ellipses around the sample groups. a. NMDS plots of all spatial samples. b. The spatial samples in particle-attached (PA) fraction. c. The spatial samples in free-living (FL) fraction. d. NMDS plots of all diel samples. e. The diel samples in PA fraction. f. The diel samples in FL fraction. Prefix: J, January. Suffix: BA, bottom particle-attached prokaryotes; SA, surface particle-attached prokaryotes; BF, bottom free-living prokaryotes; SF, surface free-living prokaryotes; SNA, surface night particle-attached prokaryotes; SDA, surface day particle-attached prokaryotes; SNF, surface night free-living prokaryotes; SDF, surface day free-living prokaryotes (the results of ANOSIM are listed in Table S4).
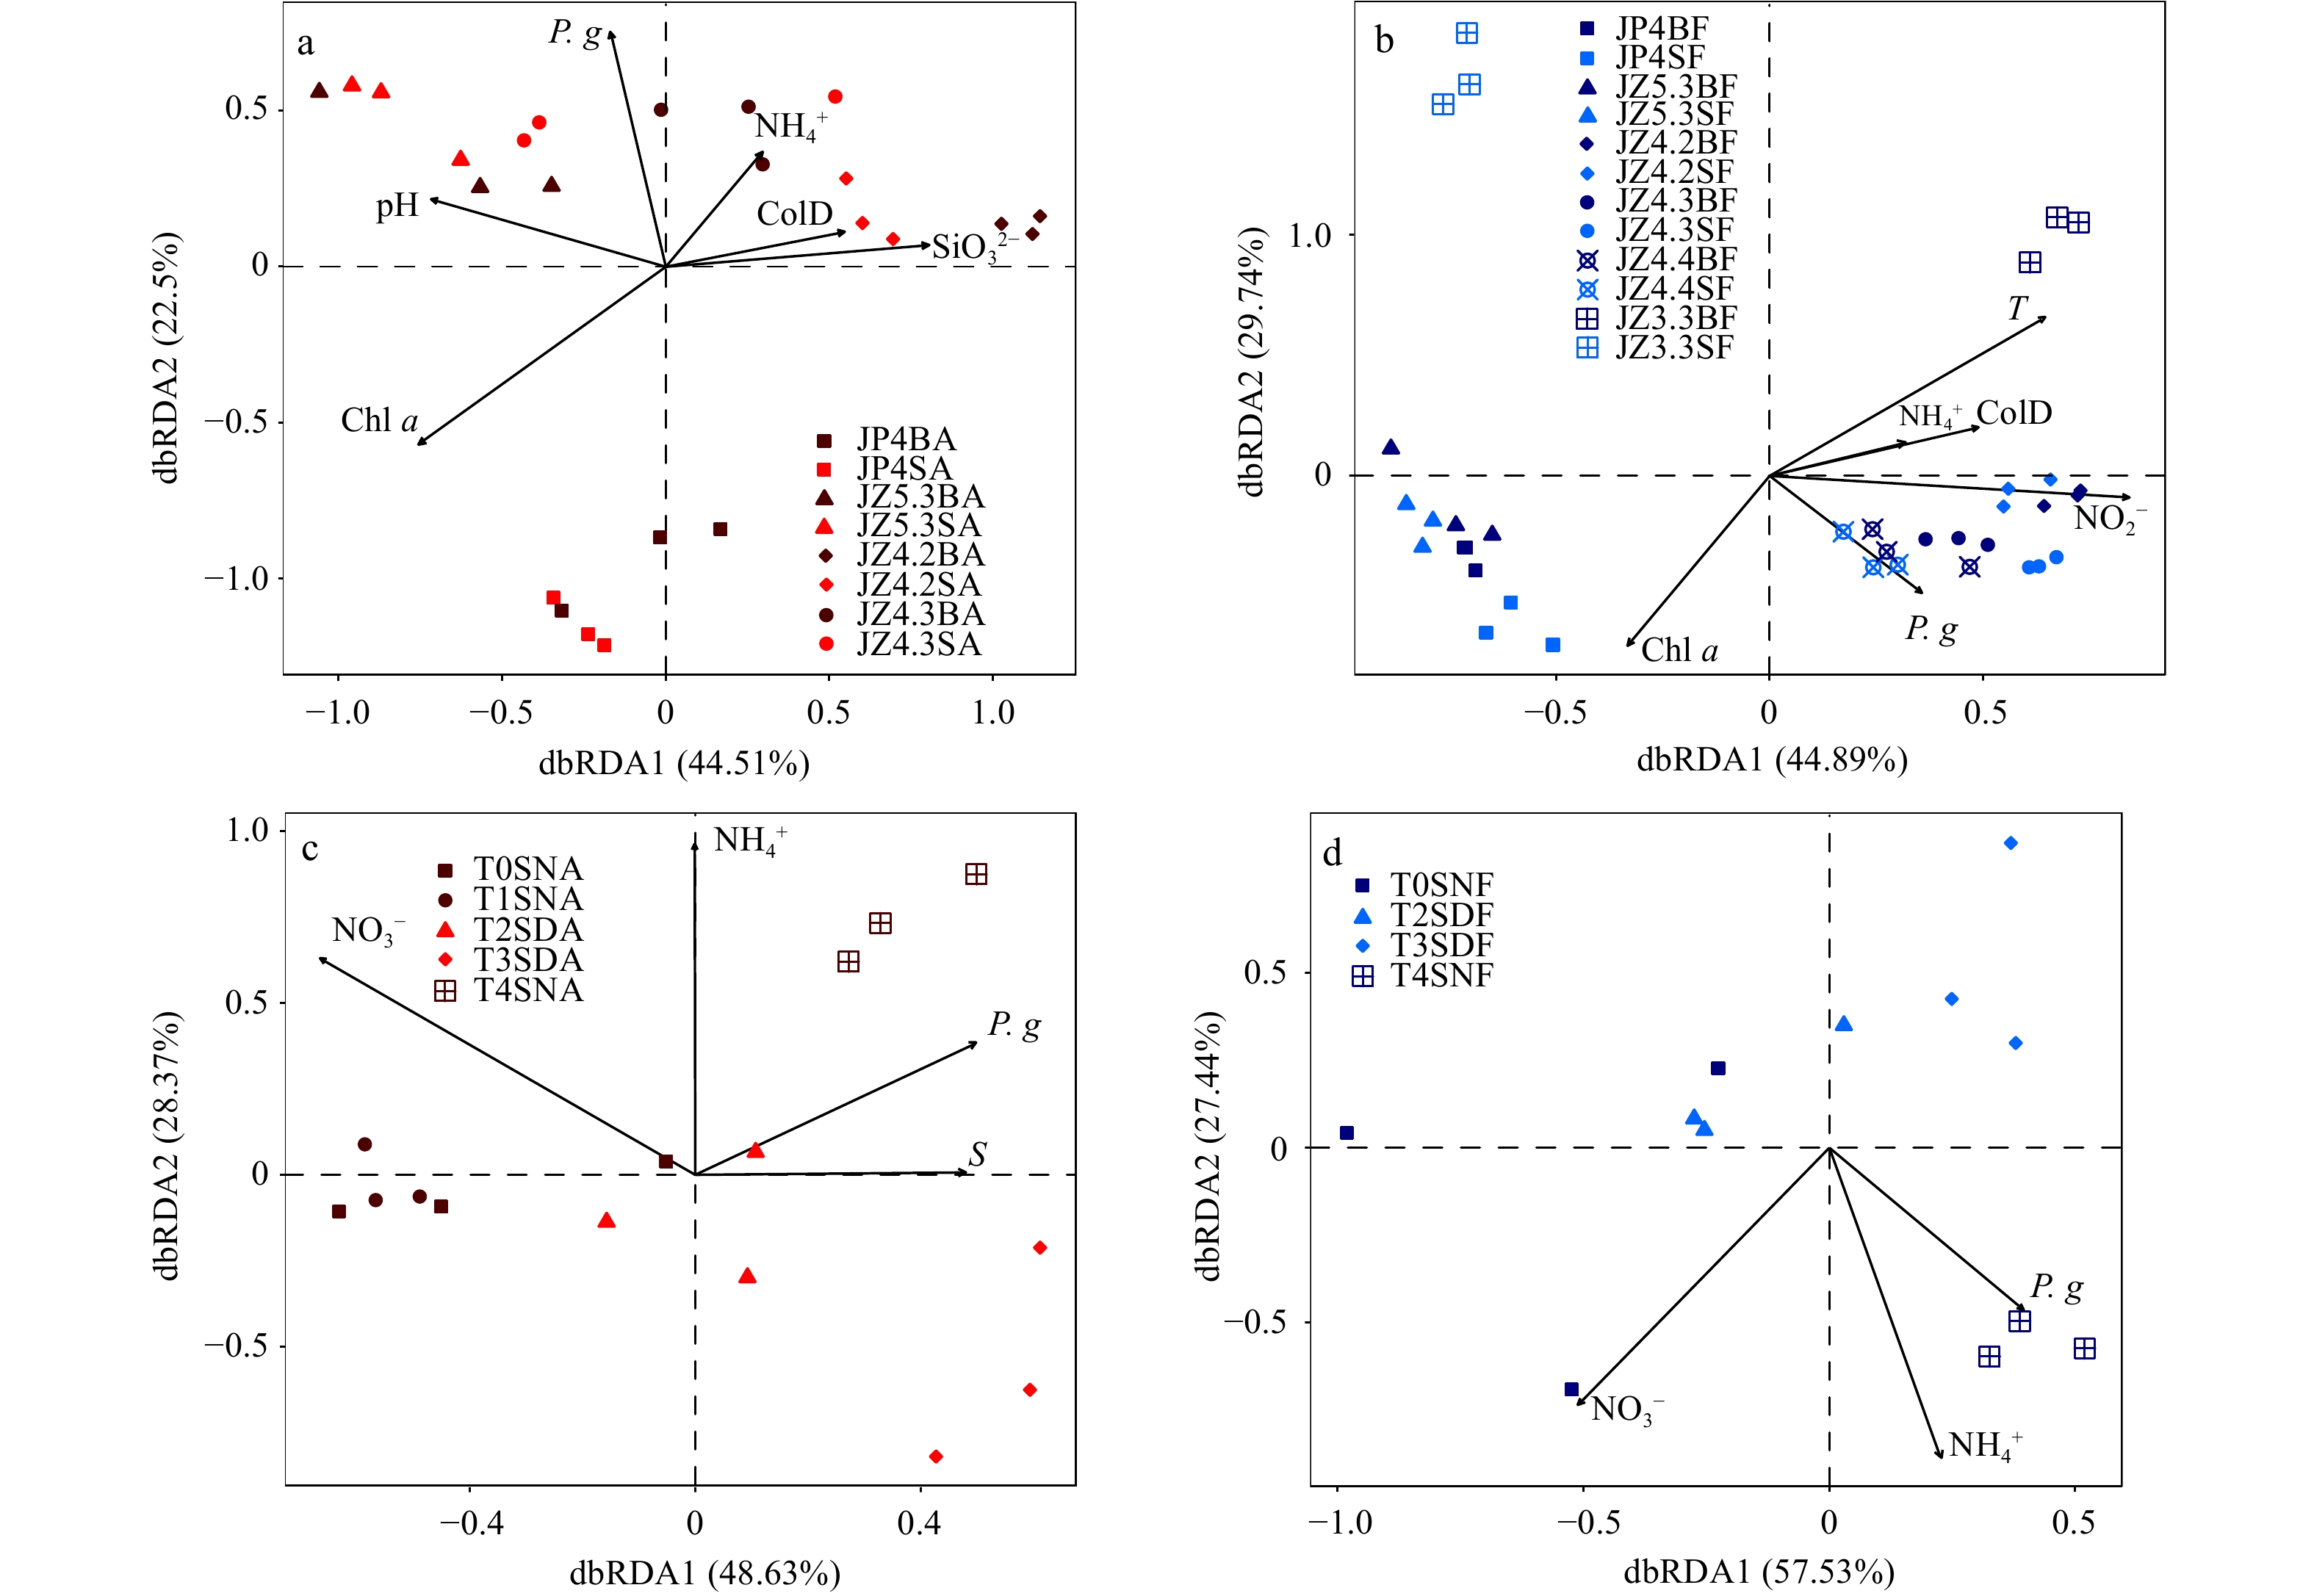
Different environmental variables exhibited different effects on PA and FL prokaryotic communities (dbRDA analysis), wherein the main influence factors also varied among stations (Figs 4a, b). The dbRDA axis1 explained 44.51% of the total variance data in the PA fraction, while the dbRDA axis2 explained 22.5%. Among the tested environmental variables, collection depth (p=0.039), the abundance of P. globosa colony (p=0.000 5), Chl a (p=0.000 5), pH (p=0.001 5), and ${{\rm {SiO}}_3^{2-}} $ (p=0.000 5) were significantly correlated with PA prokaryotic community structure. The dbRDA axis1 explained 44.89% of the total variance data in the FL fraction, while the dbRDA axis2 explained 29.74%. Moreover, collection depth (p=0.006), T (p=0.001 5), the abundance of P. globosa colony (p=0.004 5), Chl a (p=0.000 5), and ${{\rm {NO}}_2^-} $ (p=0.000 5) were significantly correlated with the FL prokaryotic community structure. The correlation pattern of major taxa of PA and FL prokaryotes with environmental variables was highly variable (Spearman correlation analysis, Fig. S4). The abundance of P. globosa colony was significantly positively correlated with unidentified family Alphaproteobacteria, unidentified family Gammaproteobacteria, Crocinitomicaceae, and Flavobacteriaceae in the FL fraction (p<0.05), while Chl a was significantly positively correlated with Cryomorphaceae and unidentified family of Acidimicrobiia in both fractions (p<0.05).
Figure
4.
Distance-based Redundancy Analyses (dbRDA) ordination plot represented the environmental variables that have influences (arrows) on the distribution of prokaryotic communities based on operationaltaxonomic unit (OTU) abundance. a. The spatial samples in particle-attached (PA) fraction. b. The spatial samples in free-living (FL) fraction. c. The diel samples in PA fraction. d. The diel samples in FL fraction. Prefix: J, January. Suffix: BA, bottom particle-attached prokaryotes; SA, surface particle-attached prokaryotes; BF, bottom free-living prokaryotes; SF, surface free-living prokaryotes; SNA, surface night particle-attached prokaryotes; SDA, surface day particle-attached prokaryotes; SNF, surface night free-living prokaryotes; SDF, surface day free-living prokaryotes (the significance of each environmental variable is listed in Table S5). T, temperature; S, salinity; Chl a, chlorophyll a; P. g, the abundance of P. globosa colony; ColD, collection depth; ${\rm{NO}}_3^- $, nitrate nitrogen; ${\rm{NO}}_2^- $, nitrite nitrogen; ${\rm{NH}}_4^+ $, ammonia nitrogen, μmol/L; ${\rm{SiO}}_3^{2-} $, silicate.
3.3
Diel variation of prokaryotic community and its association with environmental variables
A total of 1 716 850 effective tags were obtained and clustered into 3 266 OTUs at a 97% similarity threshold. The high coverage values (99.0%–99.5%) combined with the saturated rarefaction curves (data not shown) suggest that the sequencing effort was sufficient to cover the prokaryotic community diversity. Although the α-diversity between day samples and night samples showed no significant difference (p>0.05), the α-diversity during the day was slightly higher than at night (Table S3b), and there were apparent diel temporal variations in the α-diversity in both PA and FL fractions (Table S3b). There was no significant correlation between α-diversity and environmental variables (Spearman correlation analysis, Fig. S2b, p>0.05), while the abundance of P. globosa colony and ${{\rm {NO}}_3^-} $ had stronger effects on diversity than other environmental variables.
The primary prokaryotic sequences in diel samples were affiliated with 20 families of 6 phyla, namely, the Proteobacteria, Cyanobacteria, Actinobacteria, Bacteroidetes, Thaumarchaeota, and Euryarchaeota (Fig. 2b). Each of these 20 families accounted for 1% or more in at least one sample. Further analysis of the taxonomic distribution in the heatmap revealed the different aggregation degrees in prokaryotic assemblages at the family level, with an apparent diel temporal variation in different fractions. For example, in the PA fraction, the relative abundance of Woeseiaceae, unidentified family of Cyanobacteria, unidentified family of Synechococcales, and Halieaceae was higher only during the day time and then decreased at night, while Sphingomonadaceae and Moraxellaceae mainly concentrated at night. In the FL fraction, unidentified family of Alphaproteobacteria, Rhodobacteraceae, Methylophilaceae, unidentified family of Rhodospirillales gathered mainly in the day samples, while Pseudoalteromonadaceae and unidentified family of Thermoplasmata gathered mainly in the night samples. At 23:00 of the next day, when the abundance of P. globosa colony was highest, Flavobacteriaceae, Halomonadaceae, unidentified family of Alteromonadales, and Idiomarinaceae became dominant families in both fractions.
The NMDS ordination analysis and ANOSIM analysis (Fig. 3d, Table S4) displayed a clear separation between PA and FL fractions during the day or night (r=0.365, p=0.006, and r=0.177, p=0.074, respectively). The community structure showed apparent diel temporal variations in the PA and FL fractions (Figs 3e, f), the difference between day and night in the PA fraction was significant (p<0.05), while the difference in the FL fraction was not significant (p>0.05). The dbRDA analysis indicated that the environmental variables exhibited similar effects on PA and FL prokaryotic communities (Figs 4c, d). The dbRDA axis1 explained 48.63% of the total variance data in the PA fraction, while the dbRDA axis2 explained 28.37%. The dbRDA axis1 explained 57.53% of the total variance data in the FL fraction, while the dbRDA axis2 explained 27.44%. Among the tested environmental variables, ${{\rm {NO}}_3^-} $ and ${{\rm {NH}}_4^+} $ were significantly correlated with PA and FL prokaryotic community structure (p<0.05). Additionally, the abundance of P. globosa colony exhibited a minor correlation to PA and FL fractions (p=0.089 5 and p=0.208 9, respectively). Different microbial taxa had specific correlations with environmental variables (Spearman correlation analysis, Fig. S5). Flavobacteriaceae, Halomonadaceae, Idiomarinaceae, and unidentified family of Alteromonadales were positively correlated with the abundance of P. globosa colony. Members of Alphaproteobacteria were positively correlated with ${{\rm {NO}}_3^-} $. Flavobacteriaceae, Alteromonadaceae, and Methylophilaceae showed significantly positive correlations with ${{\rm {NH}}_4^+} $.
4.
Discussion
4.1
Spatial distributions of prokaryotic communities
Linking the horizontal variations in prokaryotic communities with geographical distance and environmental variables could explain the differences in community structure between sampling stations. In the present study, both environmental variables and geographic distance significantly influenced the PA and FL prokaryotic communities. The prokaryotic communities were more strongly correlated with environmental factors than geographical distance, except for the PA prokaryotic communities in the bottom layer. The limited range of distances between different sampling stations (the minimum and maximum distances were 29.08 km and 92.61 km, respectively) may account for the relatively slight effect of geographical distance, whereas environmental variables exerted stronger effects on prokaryotic communities at small spatial scales than spatial effects (Martiny et al., 2006). Furthermore, prokaryotic community distribution is an adaptation to the contemporary environment, and environmental selection has a prominent role in shaping microbial biogeographic patterns (Hanson et al., 2012). For example, nitrite was closely related to the FL prokaryotic community, which may be associated with the high abundance of certain special prokaryotes (e.g., Nitrosopumilaceae), which can gain energy by oxidizing ammonia to nitrite (Bayer et al., 2019). The apparent differences in environmental parameters between sampling stations implied the formation of specific habitats, facilitating the horizontal variations of prokaryotic communities. Besides, the migration patterns of PA prokaryotes were influenced by their comparatively larger size (Martiny et al., 2006), which may result in a more significant correlation between geographic distance and the PA prokaryotic communities in the bottom layer than environmental variables.
Our results showed that Chl a and the abundance of P. globosa colony had the most influence in shaping the horizontal distribution of prokaryotic communities. However, the interactions between prokaryote and phytoplankton during the blooms are complicated (Buchan et al., 2014). Our previous study showed that diatoms were the absolute dominant taxa in the study area (He et al., 2019), and Chl a was not significantly correlated with P. globosa and Cyanobacteria in this study, suggesting that the variation in phytoplankton biomass (represented by Chl a) was mainly driven by other phytoplankton (diatoms). It has been reported for some coastal stations strongly affected by anthropogenic activities that the increase of phytoplankton biomass affected the local trophic structure, and impacted the prokaryotic community subsequently (Rooney-Varga et al., 2005; Chen et al., 2011). For example, Cryomorphaceae and an unidentified family of Acidimicrobiia (closely associated with Chl a) gathered at coastal stations (P4 and ZN5-3), which may be explained by the correlation between these families and diatoms (Buchan et al., 2014; Nelson et al., 2014).
The presence of massive P. globosa colonies in the ZN4-X section stations caused a discrepancy in the composition and structure of the prokaryotic community and that of coastal stations. Phaeocystis colonies provided specific environmental conditions (nutrient sources and availability) for the prokaryotic community (Hahnke et al., 2013; Buchan et al., 2014), which accounted for the accumulation of prokaryotes closely related to P. globosa colonies, such as unidentified family Alphaproteobacteria, unidentified family Gammaproteobacteria, Crocinitomicaceae, and Flavobacteriaceae at ZN4-X section stations. In which, members of Alphaproteobacteria and Gammaproteobacteria were the dominant lineages associated with Phaeocystis bloom and appeared to be major players in processing algal derived organic matter (Sapp et al., 2007; Delmont et al., 2014; Sheik et al., 2014), and the Flavobacteriales lineage (Crocinitomicaceae and Flavobacteriaceae) is specifically adapted to degradation of complex mucopolysaccharides produced by Phaeocystis (Janse et al., 2000; Alderkamp et al., 2007). Further research is needed to understand the potential influences of environmental variations on the biogeochemical processes and to identify the particular prokaryotic group involved in the demise of P. globosa blooms.
The northeast monsoon, circulation, and tidal action resulted in strong vertical mixing in the northern Beibu Gulf (Zu, 2005; Bauer et al., 2013; Gao et al., 2014). The mixed-layer depth reached the bottom in the sampling sea area, and there was no significant difference between the surface and bottom layers of the PA and FL prokaryotic communities. Strong vertical mixing of the water mass could enhance passive dispersal of prokaryotes through the water column, as well as expand the frequent exchange of prokaryotic communities in different water layers (Salter et al., 2015; Hernando-Morales et al., 2018), which made prokaryotic communities from the same area cluster together regardless of the depth where they were sampled. Additionally, mixing increases the homogeneity of substrates, the homogeneous distribution of phytoplankton and inorganic nutrients in the water column may indirectly affect the similarity of prokaryotic communities (García et al., 2015; Salter et al., 2015).
4.2
Diel variations of prokaryotic communities
The prokaryotic communities exhibited remarkable diel temporal variations in the Beibu Gulf during the blooming event of P. globosa, and such rapid changes were first reported in the sea area. The diel variations of the prokaryotic community were attributed to phytoplankton, zooplankton, virus, fish, and physical factors (e.g., ultraviolet radiation, tide) in other coastal or oceanic waters (Winter et al., 2004; Ghiglione et al., 2007; Fuhrman et al., 2015). In this study, nitrate and ammonium were the key factors affecting the diel variations of PA and FL prokaryotic communities. Nitrogen concentration may be directly related to the prokaryotic community or indirectly through phytoplankton (Kuipers et al., 2000; Sapp et al., 2007; Gilbert et al., 2010). Phytoplankton and prokaryotes could reduce ${{\rm {NO}}_3^-} $ into ${{\rm {NH}}_4^+} $ in cells and release nitrogen in the form of ammonium or dissolved organic nitrogen (DON), then DON was further reduced into ${{\rm {NH}}_4^+} $ by the microbial mineralization (Zehr and Kudela, 2010; Hong, 2013). During the sampling period, ${{\rm {NH}}_4^+} $ was significantly correlated with the prokaryotic structure, indicating that the degree of remineralization of organic matter was high in this area.
The abundance of P. globosa colony showed the apparent temporal change, disappearing at noon and reaching its peak at midnight, which may affect the diel changes of prokaryotic communities through the production and excretion of organic matter (e.g., carbohydrate, glycolate) (Alderkamp et al., 2006; Lau et al., 2007). Both Alteromonadales and Flavobacteriaceae can release various extracellular enzymes and degrade large carbohydrate compounds (e.g., Phaeocystis-derived mucopolysaccharides) (Janse et al., 2000; Alderkamp et al., 2007; Sheik et al., 2014). Certain members of Halomonadaceae grew on DMSP or acrylate derived from Phaeocystis as sole carbon sources (Todd et al., 2010). In the present study, these observations were further manifested by their significant positive correlation with the abundance of P. globosa colony. The study area is a typical diurnal tidal area, with a tidal cycle superimposing on the diel cycle. The tidal height showed apparent collinearity with other environmental variables (VIF>10), especially negatively correlated with the abundance of P. globosa colony. The prokaryotic communities were not affected by the tidal dynamics, but by local environmental changes induced by tides (Rink et al., 2008; Olapade, 2012). The diel variation of prokaryotic communities and its influence factors are very complex, we need to increase the sampling frequency and extend the sampling time in further field investigation to obtain more data, and relate environmental alterations with diel variations of the prokaryotic community more comprehensively.
5.
Conclusions
Our results indicate that spatial distance and environmental variables shaped the horizontal distribution of prokaryotic communities, while environmental variables seem to have more significant influence, in particular, the abundance of P. globosa colony and Chl a were most closely correlated with the prokaryotic community. Strong vertical mixing of the water mass in winter disrupted vertical heterogeneity and resulted in the insignificant vertical difference of the prokaryotic community. The diel variation of the prokaryotic community in the P. globosa blooming area of Beibu Gulf was firstly reported. The diel difference of particle-attached prokaryotic community was significant, while that of free-living prokaryotic community was not. The present study suggested that nitrogen and the abundance of P. globosa colony were key environmental variables affecting the diel variation of prokaryotic communities over the sampling period.
Acknowledgements:
The hospitality and assistance of the R/V Yuezhanyuke-10 crew are gratefully acknowledged. We thank the team of Zhiming Yu at Institute of Oceanology, Chinese Academy of Sciences for five inorganic nutrients, the team of Junxiang Lai at Guangxi Academy of Sciences for DO and pH, and the team of Weibing Guan at Second Institute of Oceanography, Ministry of Natural Resources for temperature and salinity measurements.
Alderkamp A C, Buma A G J, van Rijssel M. 2007. The carbohydrates of Phaeocystis and their degradation in the microbial food web. Biogeochemistry, 83(1–3): 99–118
Alderkamp A C, Nejstgaard J C, Verity P G, et al. 2006. Dynamics in carbohydrate composition of Phaeocystis pouchetii colonies during spring blooms in mesocosms. Journal of Sea Research, 55(3): 169–181. doi: 10.1016/j.seares.2005.10.005
Bauer A, Radziejewska T, Liang Kai, et al. 2013. Regional differences of hydrographical and sedimentological properties in the Beibu Gulf, South China Sea. Journal of Coastal Research, 66(2): 49–71
Bayer B, Vojvoda J, Reinthaler T, et al. 2019. Nitrosopumilus adriaticus sp. nov. and Nitrosopumilus piranensis sp. nov., two ammonia-oxidizing archaea from the Adriatic Sea and members of the class Nitrososphaeria. International Journal of Systematic and Evolutionary Microbiology, 69(7): 1892–1902. doi: 10.1099/ijsem.0.003360
Becquevort S, Rousseau V, Lancelot C. 1998. Major and comparable roles for free-living and attached bacteria in the degradation of Phaeocystis-derived organic matter in Belgian coastal waters of the North Sea. Aquatic Microbial Ecology, 14(1): 39–48
Buchan A, LeCleir G R, Gulvik C A, et al. 2014. Master recyclers: features and functions of bacteria associated with phytoplankton blooms. Nature Reviews Microbiology, 12(10): 686–698. doi: 10.1038/nrmicro3326
Celussi M, Paoli A, Aubry F B, et al. 2008. Diel microbial variations at a coastal northern Adriatic station affected by Po River outflows. Estuarine, Coastal and Shelf Science, 76(1): 36–44
Chen Zhenhua. 2013. Numerical simulation on seasonal variation of ocean circulation and its dynamic mechanism in the Beibu Gulf (in Chinese)[dissertation]. Qingdao: Ocean University of China
Chen Zuozhi, Cai Wengui, Xu Shannan, et al. 2011. Risk assessment of coastal ecosystem in Beibu Gulf, Guangxi of South China. Chinese Journal of Applied Ecology (in Chinese), 22(11): 2977–2986
Clarke K R. 1993. Non-parametric multivariate analyses of changes in community structure. Australian Journal of Ecology, 18(1): 117–143. doi: 10.1111/j.1442-9993.1993.tb00438.x
Delmont T O, Hammar K M, Ducklow H W, et al. 2014. Phaeocystis antarctica blooms strongly influence bacterial community structures in the Amundsen Sea polynya. Frontiers in Microbiology, 5: 646
Fuhrman J A, Cram J A, Needham D M. 2015. Marine microbial community dynamics and their ecological interpretation. Nature Reviews Microbiology, 13(3): 133–146. doi: 10.1038/nrmicro3417
Fuhrman J A, Eppley R W, Hagstrom A, et al. 1985. Diel variations in bacterioplankton, phytoplankton, and related parameters in the southern California Bight. Marine Ecology Progress Series, 27(1–2): 9–20
Gao Jingsong, Shi Maochong, Chen Bo, et al. 2014. Responses of the circulation and water mass in the Beibu Gulf to the seasonal forcing regimes. Acta Oceanologica Sinica, 33(7): 1–11. doi: 10.1007/s13131-014-0506-6
García F C, Alonso-Sáez L, Morán X A G, et al. 2015. Seasonality in molecular and cytometric diversity of marine bacterioplankton: the re-shuffling of bacterial taxa by vertical mixing. Environmental Microbiology, 17(10): 4133–4142. doi: 10.1111/1462-2920.12984
Gasol J M, Doval M D, Pinhassi J, et al. 1998. Diel variations in bacterial heterotrophic activity and growth in the northwestern Mediterranean Sea. Marine Ecology Progress Series, 164: 107–124. doi: 10.3354/meps164107
Ghiglione J F, Mevel G, Pujo-Pay M, et al. 2007. Diel and seasonal variations in abundance, activity, and community structure of particle-attached and free-living bacteria in NW Mediterranean Sea. Microbial Ecology, 54(2): 217–231. doi: 10.1007/s00248-006-9189-7
Gilbert J A, Field D, Swift P, et al. 2010. The taxonomic and functional diversity of microbes at a temperate coastal site: a ‘Multi-Omic’ study of seasonal and diel temporal variation. PLoS ONE, 5(11): e15545. doi: 10.1371/journal.pone.0015545
Hahnke S, Sperling M, Langer T, et al. 2013. Distinct seasonal growth patterns of the bacterium Planktotalea frisia in the North Sea and specific interaction with phytoplankton algae. FEMS Microbiology Ecology, 86(2): 185–199. doi: 10.1111/1574-6941.12151
Hanson C A, Fuhrman J A, Horner-Devine M C, et al. 2012. Beyond biogeographic patterns: processes shaping the microbial landscape. Nature Reviews Microbiology, 10(7): 497–506. doi: 10.1038/nrmicro2795
He Cheng, Song Shuqun, Li Caiwen. 2019. The spatial-temperal distribution of Phaeocystis globosa colonies and related affecting factors in Guangxi Beibu Gulf. Oceanologia et Limnologia Sinica, 50(3): 630–643
He Cheng, Xu Sha, Kang Zhenjun, et al. 2021. Prokaryotic community composition and structure during Phaeocystis globosa blooms in the Beibu Gulf, China. Aquatic Microbial Ecology, 86: 137–151. doi: 10.3354/ame01962
Hernando-Morales V, Varela M M, Needham D M, et al. 2018. Vertical and seasonal patterns control bacterioplankton communities at two horizontally coherent coastal upwelling sites off Galicia (NW Spain). Microbial Ecology, 76(4): 866–884. doi: 10.1007/s00248-018-1179-z
Hong Yiguo. 2013. Marine nitrogen cycle recorded by nitrogen and oxygen isotope fractionation of nitrate. Advances in Earth Science (in Chinese), 28(7): 751–764
Huang Changjiang, Dong Qiaoxiang, Zheng Lei. 1999. Taxonomic and ecological studies on a large scale Phaeocystis pouchetii bloom in the southeast coast of China during late 1997. Oceanologia et Limnologia Sinica (in Chinese), 30(6): 581–590
Janse I, Zwart G, van der Maarel M J E C, et al. 2000. Composition of the bacterial community degrading Phaeocystis mucopolysaccharides in enrichment cultures. Aquatic Microbial Ecology, 22(2): 119–133
Kruskal J B. 1964. Nonmetric multidimensional scaling: a numerical method. Psychometrika, 29(2): 115–129. doi: 10.1007/BF02289694
Kuipers B, van Noort G J, Vosjan J, et al. 2000. Diel periodicity of bacterioplankton in the euphotic zone of the subtropical Atlantic Ocean. Marine Ecology Progress Series, 201: 13–25. doi: 10.3354/meps201013
Lai Junxiang, Jiang Fajun, Ke Ke, et al. 2014. Nutrients distribution and trophic status assessment in the northern Beibu Gulf, China. Chinese Journal of Oceanology and Limnology, 32(5): 1128–1144. doi: 10.1007/s00343-014-3199-y
Lau W W Y, Keil R G, Armbrust E V. 2007. Succession and diel transcriptional response of the glycolate-utilizing component of the bacterial community during a spring phytoplankton bloom. Applied and Environmental Microbiology, 73(8): 2440–2450. doi: 10.1128/AEM.01965-06
Li Nan, Zhao Huaxian, Jiang Gonglingxia, et al. 2020. Phylogenetic responses of marine free-living bacterial community to Phaeocystis globosa bloom in Beibu Gulf, China. Frontiers in Microbiology, 11: 1624. doi: 10.3389/fmicb.2020.01624
Lutz K A, Wang Wenqin, Zdepski A, et al. 2011. Isolation and analysis of high quality nuclear DNA with reduced organellar DNA for plant genome sequencing and resequencing. BMC Biotechnology, 11(1): 54. doi: 10.1186/1472-6750-11-54
Mari X, Rassoulzadegan F, Brussaard C P D, et al. 2005. Dynamics of transparent exopolymeric particles (TEP) production by Phaeocystis globosa under N- or P-limitation: a controlling factor of the retention/export balance. Harmful Algae, 4(5): 895–914. doi: 10.1016/j.hal.2004.12.014
Martiny J B H, Bohannan B J M, Brown J H, et al. 2006. Microbial biogeography: putting microorganisms on the map. Nature Reviews Microbiology, 4(2): 102–112. doi: 10.1038/nrmicro1341
McArdle B H, Anderson M J. 2001. Fitting multivariate models to community data: a comment on distance-based redundancy analysis. Ecology, 82(1): 290–297. doi: 10.1890/0012-9658(2001)082[0290:FMMTCD]2.0.CO;2
Nelson C E, Carlson C A, Ewart C S, et al. 2014. Community differentiation and population enrichment of Sargasso Sea bacterioplankton in the euphotic zone of a mesoscale mode-water eddy. Environmental Microbiology, 16(3): 871–887. doi: 10.1111/1462-2920.12241
Olapade O A. 2012. Diel fluctuations in the abundance and community diversity of coastal bacterioplankton assemblages over a tidal cycle. Microbial Ecology, 63(1): 96–102. doi: 10.1007/s00248-011-9940-6
Peperzak L, Colijn F, Vrieling E G, et al. 2000. Observations of flagellates in colonies of Phaeocystis globosa (Prymnesiophyceae); a hypothesis for their position in the life cycle. Journal of Plankton Research, 22(12): 2181–2203. doi: 10.1093/plankt/22.12.2181
Qi Yuzao, Xu Ning, Wang Yan, et al. 2002. Progress of studies on red tide in China —Studies on Phaeocystis giobosa red tide and its DMS (DMSP) production. China Basic Science (in Chinese), 4: 23–28
Rink B, Martens T, Fischer D, et al. 2008. Short-term dynamics of bacterial communities in a tidally affected coastal ecosystem. FEMS Microbiology Ecology, 66(2): 306–319. doi: 10.1111/j.1574-6941.2008.00573.x
Rooney-Varga J N, Giewat M W, Savin M C, et al. 2005. Links between phytoplankton and bacterial community dynamics in a coastal marine environment. Microbial Ecology, 49(1): 163–175. doi: 10.1007/s00248-003-1057-0
Rousseau V, Becquevort S, Parent J Y, et al. 2000. Trophic efficiency of the planktonic food web in a coastal ecosystem dominated by Phaeocystis colonies. Journal of Sea Research, 43(3–4): 357–372
Salazar G, Cornejo-Castillo F M, Borrull E, et al. 2015. Particle-association lifestyle is a phylogenetically conserved trait in bathypelagic prokaryotes. Molecular Ecology, 24(22): 5692–5706. doi: 10.1111/mec.13419
Salter I, Galand P E, Fagervold S K, et al. 2015. Seasonal dynamics of active SAR11 ecotypes in the oligotrophic Northwest Mediterranean Sea. The ISME Journal, 9(2): 347–360. doi: 10.1038/ismej.2014.129
Sapp M, Wichels A, Wiltshire K H, et al. 2007. Bacterial community dynamics during the winter-spring transition in the North Sea. FEMS Microbiology Ecology, 59(3): 622–637. doi: 10.1111/j.1574-6941.2006.00238.x
Schoemann V, Becquevort S, Stefels J, et al. 2005. Phaeocystis blooms in the global ocean and their controlling mechanisms: a review. Journal of Sea Research, 53(1–2): 43–66
Sheik A R, Brussaard C P D, Lavik G, et al. 2014. Responses of the coastal bacterial community to viral infection of the algae Phaeocystis globosa. The ISME Journal, 8(1): 212–225. doi: 10.1038/ismej.2013.135
Smith W O Jr, McGillicuddy D J Jr, Olson E B, et al. 2017. Mesoscale variability in intact and ghost colonies of Phaeocystis antarctica in the Ross Sea: Distribution and abundance. Journal of Marine Systems, 166: 97–107. doi: 10.1016/j.jmarsys.2016.05.007
Spilmont N, Denis L, Artigas L F, et al. 2009. Impact of the Phaeocystis globosa spring bloom on the intertidal benthic compartment in the eastern English Channel: a synthesis. Marine Pollution Bulletin, 58(1): 55–63. doi: 10.1016/j.marpolbul.2008.09.007
Strickland J D H, Parsons T R. 1972. A practical Handbook of Seawater Analysis. 2nd ed. Ottawa: Fisheries Research Board of Canada, 201–206
Takahashi S, Tomita J, Nishioka K, et al. 2014. Development of a prokaryotic universal primer for simultaneous analysis of bacteria and archaea using next-generation sequencing. PLoS ONE, 9(8): e105592. doi: 10.1371/journal.pone.0105592
Todd J D, Curson A R J, Nikolaidou-Katsaraidou N, et al. 2010. Molecular dissection of bacterial acrylate catabolism-unexpected links with dimethylsulfoniopropionate catabolism and dimethyl sulfide production. Environmental Microbiology, 12(2): 327–343. doi: 10.1111/j.1462-2920.2009.02071.x
van Rijssel M, Janse I, Noordkamp D J B, et al. 2000. An inventory of factors that affect polysaccharide production by Phaeocystis globosa. Journal of Sea Research, 43(3–4): 297–306
Wang Kai, Ye Xiansen, Chen Heping, et al. 2015. Bacterial biogeography in the coastal waters of northern Zhejiang, East China Sea is highly controlled by spatially structured environmental gradients. Environmental Microbiology, 17(10): 3898–3913. doi: 10.1111/1462-2920.12884
Winter C, Herndl G J, Weinbauer M G. 2004. Diel cycles in viral infection of bacterioplankton in the North Sea. Aquatic Microbial Ecology, 35(3): 207–216
Wöhlbrand L, Wemheuer B, Feenders C, et al. 2017. Complementary metaproteomic approaches to assess the bacterioplankton response toward a phytoplankton spring bloom in the southern North Sea. Frontiers in Microbiology, 8: 442
Xu Yixiao, Zhang Teng, Zhou Jin. 2019. Historical occurrence of algal blooms in the northern Beibu Gulf of China and implications for future trends. Frontiers in Microbiology, 10: 451. doi: 10.3389/fmicb.2019.00451
Yu Shuxian, Pang Yunlong, Wang Yinchu, et al. 2018. Distribution of bacterial communities along the spatial and environmental gradients from Bohai Sea to northern Yellow Sea. PeerJ, 6: e4272. doi: 10.7717/peerj.4272
Yu Zhiming, Song Xiuxian, Cao Xihua, et al. 2017. Mitigation of harmful algal blooms using modified clays: theory, mechanisms, and applications. Harmful Algae, 69: 48–64. doi: 10.1016/j.hal.2017.09.004
Zehr J P, Kudela R M. 2010. Nitrogen cycle of the open ocean: from genes to ecosystems. Annual Review of Marine Science, 3: 197–225
Zu Tingting. 2005. Analysis of the current and its mechanism in the Gulf of Beibu (in Chinese)[dissertation]. Qingdao: Ocean University of China
Cheng He, Sha Xu, Shuqun Song, Caiwen Li. Spatial and diel variations of the prokaryotic community in the Phaeocystis globosa blooms area of Beibu Gulf, China[J]. Acta Oceanologica Sinica, 2022, 41(12): 87-97. doi: 10.1007/s13131-022-1984-6
Cheng He, Sha Xu, Shuqun Song, Caiwen Li. Spatial and diel variations of the prokaryotic community in the Phaeocystis globosa blooms area of Beibu Gulf, China[J]. Acta Oceanologica Sinica, 2022, 41(12): 87-97. doi: 10.1007/s13131-022-1984-6
Figure 1. Location of sampling stations in the northern Beibu Gulf, China. The circles represent coastal stations, the square represents the deeper water station, and the triangles represent stations of the ZN4-X section, among which the empty triangle indicates the diel sampling station. Blue arrows indicate the general pattern of cyclonic circulation, purple arrows show the northeastern monsoon in winter, and black arrows point out riverine inputs in the sampling area (Bauer et al., 2013; Chen, 2013).
Figure 2. The heatmap of prokaryotic community composition in spatial (a) and diel (b) samples at the family level. The information of samples and species annotation were demonstrated along X-axis and Y-axis, respectively. The clustering tree was generated based on the family with the relative abundance >1.0% in at least one sample. The relative values in the heatmap depicted by colors after normalization indicated the aggregation degree or content of prokaryotic species among samples at the family level. Prefix: J, January. Suffix: BA, bottom particle-attached prokaryotes; SA, surface particle-attached prokaryotes; BF, bottom free-living prokaryotes; SF, surface free-living prokaryotes; SNA, surface night particle-attached prokaryotes; SDA, surface day particle-attached prokaryotes; SNF, surface night free-living prokaryotes; SDF, surface day free-living prokaryotes.
Figure 3. Non-metric multidimensional scaling (NMDS) ordination showed dissimilarities in the prokaryotic communities based on Bray-Curtis distances. Results from the first 2 ordination axes are given, with 80% confidence ellipses around the sample groups. a. NMDS plots of all spatial samples. b. The spatial samples in particle-attached (PA) fraction. c. The spatial samples in free-living (FL) fraction. d. NMDS plots of all diel samples. e. The diel samples in PA fraction. f. The diel samples in FL fraction. Prefix: J, January. Suffix: BA, bottom particle-attached prokaryotes; SA, surface particle-attached prokaryotes; BF, bottom free-living prokaryotes; SF, surface free-living prokaryotes; SNA, surface night particle-attached prokaryotes; SDA, surface day particle-attached prokaryotes; SNF, surface night free-living prokaryotes; SDF, surface day free-living prokaryotes (the results of ANOSIM are listed in Table S4).
Figure 4. Distance-based Redundancy Analyses (dbRDA) ordination plot represented the environmental variables that have influences (arrows) on the distribution of prokaryotic communities based on operationaltaxonomic unit (OTU) abundance. a. The spatial samples in particle-attached (PA) fraction. b. The spatial samples in free-living (FL) fraction. c. The diel samples in PA fraction. d. The diel samples in FL fraction. Prefix: J, January. Suffix: BA, bottom particle-attached prokaryotes; SA, surface particle-attached prokaryotes; BF, bottom free-living prokaryotes; SF, surface free-living prokaryotes; SNA, surface night particle-attached prokaryotes; SDA, surface day particle-attached prokaryotes; SNF, surface night free-living prokaryotes; SDF, surface day free-living prokaryotes (the significance of each environmental variable is listed in Table S5). T, temperature; S, salinity; Chl a, chlorophyll a; P. g, the abundance of P. globosa colony; ColD, collection depth; ${\rm{NO}}_3^- $, nitrate nitrogen; ${\rm{NO}}_2^- $, nitrite nitrogen; ${\rm{NH}}_4^+ $, ammonia nitrogen, μmol/L; ${\rm{SiO}}_3^{2-} $, silicate.


 DownLoad:


 DownLoad: