Yuan Li, Liyan Zhang, Jing Zhang, Cheng Liu, Longshan Lin. Levels and patterns of genetic variation in Pampus minor: Assessment of a mitochondrial DNA control region sequence[J]. Acta Oceanologica Sinica, 2021, 40(4): 74-83. doi: 10.1007/s13131-021-1784-4
Citation:
Yuan Li, Liyan Zhang, Jing Zhang, Cheng Liu, Longshan Lin. Levels and patterns of genetic variation in Pampus minor: Assessment of a mitochondrial DNA control region sequence[J]. Acta Oceanologica Sinica, 2021, 40(4): 74-83. doi: 10.1007/s13131-021-1784-4
Yuan Li, Liyan Zhang, Jing Zhang, Cheng Liu, Longshan Lin. Levels and patterns of genetic variation in Pampus minor: Assessment of a mitochondrial DNA control region sequence[J]. Acta Oceanologica Sinica, 2021, 40(4): 74-83. doi: 10.1007/s13131-021-1784-4
Citation:
Yuan Li, Liyan Zhang, Jing Zhang, Cheng Liu, Longshan Lin. Levels and patterns of genetic variation in Pampus minor: Assessment of a mitochondrial DNA control region sequence[J]. Acta Oceanologica Sinica, 2021, 40(4): 74-83. doi: 10.1007/s13131-021-1784-4
Third Institute of Oceanography, Ministry of Natural Resources, Xiamen 361005, China
2.
Fujian Institute of Oceanography, Xiamen 361013, China
3.
Fisheries College, Jimei University, Xiamen 361021, China
Funds:
The National Key Research and Development Program of China under contract No. 2018YFC1406302; the National Programme on Global Change and Air-Sea Interaction under contract No. GASI-02-SCS-YDsum; the Fond of Fujian Provincial Research Institutes of Basic Research and Public Service Special Operations under contract No. 2017R1006-5; the Fond of Bilateral Cooperation of Maritime Affairs under contract No. 2200207.
Pampus minor is an important commercial fish. Due to the similarity of external morphological characteristics among the genus Pampus species, P. minor has often been identified as the juvenile group of both P. cinereus and P. argenteus. While little genetic background on this species is known, this study was based on control region sequences and provided the first evaluation of the genetic signature of 264 individuals of P. minor from 11 populations along the coasts of China and Malaysia. The results indicate high genetic haplotype diversity and low nucleotide diversity in this species. Additionally, two differentiated haplotype lineages were identified in the P. minor populations. However, phylogenetic structures corresponding to the geographical locations were unable to be established. Analysis of molecular variance identified a vast majority of the genetic variation occurring within populations. F-statistic test value (FST) of pairwise indicated that great differences existed between the Chinese and Malaysian P. minor populations. For the Chinese populations, the genetic differences were insignificant with the exception of the Xiamen population, which is a marginal population. During the late Pleistocene, a population expansion of P. minor occurred. These expanded populations originated from the glacial refugium in the South China Sea and then rapidly occupied and adapted to their new habitat. The results of this study provide genetic information for ensuring the protection and management of P. minor resources.
Species can only adapt to vigorous environmental changes if they possess sufficient genetic variation. Under conditions of global climate change, habitat fragmentation, and habitat deterioration, protecting the genetic diversity of species has become a common concern (Stockwell et al., 2003; Butchart et al., 2010). Understanding patterns of variation from the gene level to the community level is the first step in revealing the processes responsible for generating biodiversity (Guo et al., 2013). Examining the genetic signature of species, estimating the effective population size, and investigating the mechanisms influencing various evolutionary factors are the primary focus of current population genetics research, all of which are critical for an accurate understanding of the ecological and evolutionary processes associated with species formation, adaptivity, sustainability, and population dynamics (Ellegren, 2014). Accurately evaluating the genetic structure of an exploited species is important to the management, development, and protection of a fishery. Inappropriate division of conservation units can easily lead to local overfishing and ultimately, severe declines in fishery resources (Hutchings, 2000; Li et al., 2018).
During the late Quaternary period, global climate underwent a series of glacial-interglacial changes that caused major changes in sea level. During the last glacial maxima, sea level dropped approximately 100–140 m. As a result, land bridges were formed between the Asian continent and the nearby islands (e.g., the Qiongzhou Strait) (Lambeck et al., 2002). These climate changes had a tremendous impact on the distribution and biomass of species, which left obvious imprints in the genetic information (Hewitt, 2000; Dynesius and Jansson, 2000). During the late Quaternary glaciation, environmental changes caused by fluctuations in sea level were especially significant in the marginal seas of the West Pacific. Major transformations occurred in the area and structure of the marginal seas (Wang, 1999). These transformations turned the western Pacific into an ideal region for investigating the effects of glacial stage on marine organisms. Levels and patterns of genetic variation for marine organisms were dramatically influenced by both historical and contemporary factors in the western Pacific.
Pampus minor Liu and Li, 1998, belonging to Actinopterygii, Perciformes, and Stromateidae, is primarily distributed in the southern sea of the Taiwan Strait, which features offshore warm water areas (Liu and Li, 1998). Because of the similarity in morphological characteristics and small body size (typical length<150 mm), P. minor was often identified as the juvenile group of both P. cinereus and P. argenteus in earlier studies. During the late glacial maximum, we expect that P. minor was also subjected to the impact of the Pleistocene ice age. Under the harsh environmental conditions in the glacial period, most individuals may have died, with only the subpopulation in the glacial refugium in the South China Sea surviving. Due to warming during the interglacial period, sea levels rose, resulting in expansion of the population. Thus, the phylogeographic patterns and genetic structures of the population that correspond to the changes in climate may be detected. Therefore, the P. minor species is a good target subject for molecular phylogeographic studies.
Until now, few studies in P. minor have focused on its morphology (Liu and Li, 1998), phylogeny (Guo et al., 2010; Cui et al., 2010) and population genetics (Li et al., 2019b). No basic investigation has examined the status of P. minor as a fishery resource and its actual distribution. With decreasing fishery resources, P. minor resources are also declining. As such, an understanding of population genetic characteristics, such as genetic diversity, genetic structure, and effective population size, is necessary. These parameters are the foundation for developing strategies of effective protection, development and exploitation of fishery resources (Funk et al., 2012).
In the research reported herein, we investigated the genetic diversity, genetic structure and historic dynamics of 11 Chinese and Malaysian P. minor populations using a mitochondrial DNA sequence (first hypervariable segment of the control region, CR). In addition, we revealed the effects of factors, such as paleoclimate, ancient geological events and marine geological environments, on population formation, distribution, and gene exchange in P. minor. Furthermore, we explored the mechanism that formed the current phylogeographic pattern of P. minor.
2.
Materials and methods
2.1
Sample collection
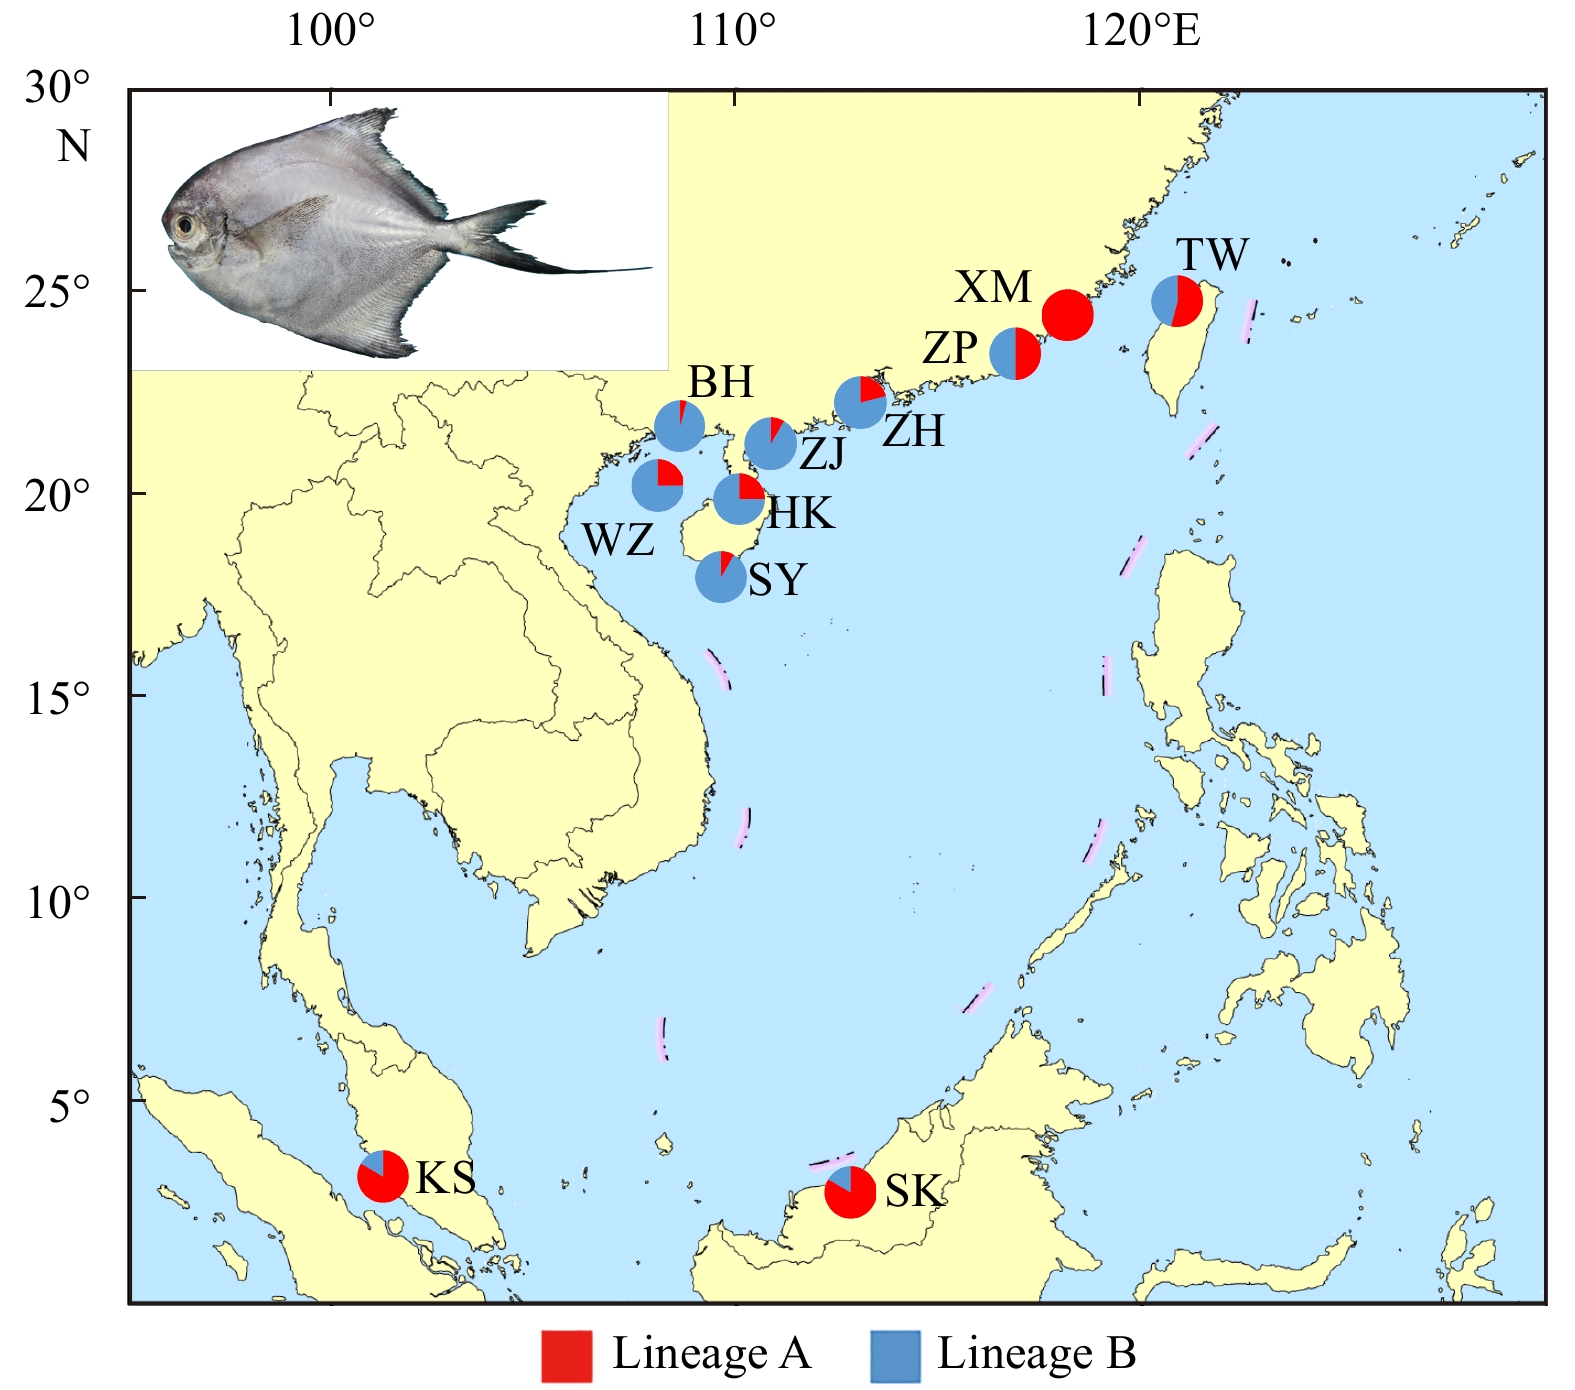
There were 264 individuals of P. minor collected from 11 different geographical populations distributed throughout the coastal waters of China (Xiamen, Zhangpu, Taiwan, Zhuhai, Zhanjiang, Beihai, Weizhou Island, Haikou, Sanya) and Malaysia (Kuala Selangor, Mukah) from May 2016 to December 2017 (Fig. 1, Table 1). To ensure accuracy of the taxonomy, all specimens were identified according to their morphological characteristics (Liu and Li, 1998). A piece of back muscle tissue was excised and preserved in 95% alcohol or frozen for subsequent molecular experiments.
Figure
1.
Sampling locations of Pampus minor. XM, Xiamen; ZP, Zhangpu; TW, Taiwan; ZH, Zhuhai; ZJ, Zhanjiang; BH, Beihai; WZ, Weizhou Island; HK, Haikou; SY, Sanya; KS, Kuala Selangor; SK, Mukah. The area of the circle is proportional to sample number.
Genomic DNA was isolated from muscle tissue by proteinase K digestion and extracted with DNeasy kit (Qiagen, USA). Purified DNA was assessed on 1.5% agarose gel electrophoresis and stored at –20°C for PCR (Polymerase Chain Reaction) amplification. The mtDNA CR was amplified using the primers F-gao: 5′-GAAGTTAAAATCTTCCCTTTTGC-3′ (forward), and R-gao: 5′-GGCCCTGAAGTAGGAACCAAA-3′ (reverse). Each PCR reaction was performed in a 25 μL reaction mixture containing 17.5 μL ultrapure water, 2.5 μL of 10×PCR buffer, 2 μL deoxynucleotides (dNTPs), 1 μL each primer (5 μmol/L), 0.15 μL Taq polymerase, and 1 μL DNA template. PCR amplification was performed in a Biometra thermal cycler under the following conditions: 5 min of initial denaturation at 95°C; 30 cycles of 45 s at 94°C for denaturation, 45 s at 50°C for annealing, and 45 s at 72°C for extension; and a final extension at 72°C for 10 min. PCR products were purified, and both strands were sequenced. Newly isolated haplotypes were deposited in GenBank under accession numbers MK088662—MK088727.
2.3
Data analysis
CR sequences were edited and aligned using DNASTAR software (DNASTAR, USA). Polymorphic sites, haplotype number and molecular diversity indices for each population were calculated using ARLEQUIN version 3.5 (Excoffier et al., 2005). Genetic relationships among haplotypes were reconstructed using the neighbor-joining (NJ) method implemented with 1 000 replicates in MEGA 5.0 (Tamura et al., 2011). Analysis of molecular variation (AMOVA) was performed using ARLEQUIN to investigate the partition of genetic variation among the populations. An unrooted minimum spanning tree (MST) was constructed using the MINSPNET algorithm as implemented in ARLEQUIN to show the relationship among haplotypes (Excoffier et al., 2005), which was subsequently drawn by hand. Historical demography/spatial expansions were inferred by neutrality testing and mismatch distribution analysis, as implemented in ARLEQUIN. Deviations from neutrality were evaluated using F-statistic test and Tajima’s D. Nucleotide mismatch distributions were applied to assess population growth and spatial range expansion. A molecular clock-based time estimate provided an approximate timeframe for evaluating phylogeographical hypotheses (Excoffier et al., 2005). Historical demographic expansions were also investigated by examining frequency distributions of pair-wise differences between sequences (mismatch distribution) based on three parameters: θ0, θ1 (effective population size before and after population growth) and τ (time since expansion, expressed in units of mutational time) (Rogers and Harpending, 1992). The values of τ were transformed to estimates of real time using expansion with the equation τ=2×μ×t, where μ is the mutation rate for the whole sequence under study and t is the time since expansion. In the present study, a sequence divergence rate of 0.5×10⁻⁷–1×10⁻⁷ for each station per year was applied to CR sequences of P. minor (Bowen et al., 2007). Bayesian skyline plots were created using BEAST v.8 (Drummond et al., 2012). However, a molecular clock-based time estimate provided an approximate time frame for evaluating phylogeographic hypotheses.
3.
Results
3.1
Genetic diversity
After being manually compared, the 432–435 bp fragment of the 5′ end of the CR, including a 70 bp partial segment of the tRNApro gene with no variable site, was sequenced in 264 individuals originating from 11 populations. A targeted length of 362–365 bp was obtained after deleting the 70 bp tRNApro sequence. All subsequent analyses were based on the 362–365 bp fragments. There are 44 mutations, 18 parsimony informative sites, and 26 singleton sites found in the targeted fragment, which had 41 transitions, 6 transversions, and 5 insertions/deletions. The ratios of transitions to transversions was 6.8, indicating that mutations in the CR sequence of P. minor had not reached saturation and were less affected by noise from evolution. A+T content (67.25%) was significantly higher than G+C content, indicating a significant AT preference.
The sequence length of all Chinese populations was 363 bp. For Malaysian populations, due to insertion and deletion, the sequence length range was 362–365 bp. The length was primarily 363 bp for the KS population and 364 bp for the SK population (Fig. 2). As indicated by the results, fish from the Chinese and the Malaysian populations can be identified by the lengths of some sequences (362 bp, 364 bp, and 365 bp).
Figure
2.
The frequency of different sequence lengths in 11 populations of Pampus minor.
There are 66 haplotypes defined among the 264 individuals. The number of haplotypes in each population ranged from 7 (TW) to 17 (KS). There are 22 haplotypes (33%) were shared between 2 or more populations, whereas the remaining haplotypes (44, 66.7%) were unique. Every population had a unique haplotype that ranged from 1 (ZP, TW, BH, SY) to 13 (SK) (Table 1). Greater differences in the composition and distribution of haplotypes occurred between the Chinese and the Malaysian populations, and only two haplotypes were shared between the Chinese and the Malaysian populations. The shared haplotypes (21/38=55.3%) were dominant in the Chinese populations, whereas unique haplotypes (24/30=80%) were dominant in the Malaysian populations (Fig. 3). The most frequent haplotype, Hap_4, consisting of 72 sequences, was observed only in the Chinese populations and is possibly an ancestral haplotype.
Figure
3.
Composition and distribution of 66 haplotypes in Chinese and Malaysian populations of Pampus minor.
Overall, P. minor populations exhibited high haplotype diversity (h, 0.907 4±0.013 6) and low nucleotide diversity (π, 0.008 1±0.004 7). The reason for this phenomenon is that, after the bottleneck effect occurs, a large number of new mutations occur in a small population due to population expansion or rapid population growth (Avise et al., 1984; Grant and Bowen, 1998).
3.2
Genetic structure
A NJ tree was constructed based on the 66 CR haplotypes of P. minor. The results indicated that two differentiated haplotype lineages existed within P. minor with low bootstrap values. A phylogenetic structure corresponding to geographical locations was not detected (Fig. 4). Lineage A was built on 36 haplotypes (112 individuals), whereas Lineage B was composed of 30 haplotypes (52 individuals) (Fig. 4). No obvious difference was observed in haplotype composition between the two lineages. However, each haplotype lineage contained a small branch that was composed of only Chinese individuals or only Malaysian individuals.
Figure
4.
Neighbor joining tree of control region haplotypes in Pampus minor. Bootstrap supports of larger than 50 in 1 000 replicates are shown.
Based on the 66 haplotypes of P. minor, a haplotype network diagram was constructed using MST methods (Fig. 5). The results indicated that all sequences showed multiple primary haplotypes, and the other haplotypes exhibited a radial distribution around the main haplotypes with weak phylogenetic structure. The frequency distribution (Fig. 4) of the two major haplotype lineages indicates that no significant difference existed in haplotype lineages among different geographical populations. In other words, no geographical structure was present, indicating that some gene exchange occurred.
Figure
5.
Unrooted minimum spanning tree showing the genetic relationship among CR haplotypes of Pampus minor. Circle size is proportional to haplotype frequency. Perpendicular tick marks on the lines joining haplotypes represent the number of nucleotide substitutions.
Based on the Tamura-Nei model with a gamma distribution (TrN+G model), the net genetic distance between the two major haplotype lineages was 0.002 8. Based on the rates of divergence of mitochondrial DNA at 5%–10% per million years, the divergence between Lineage A and Lineage B occurred approximately 28×103–56×103 a ago.
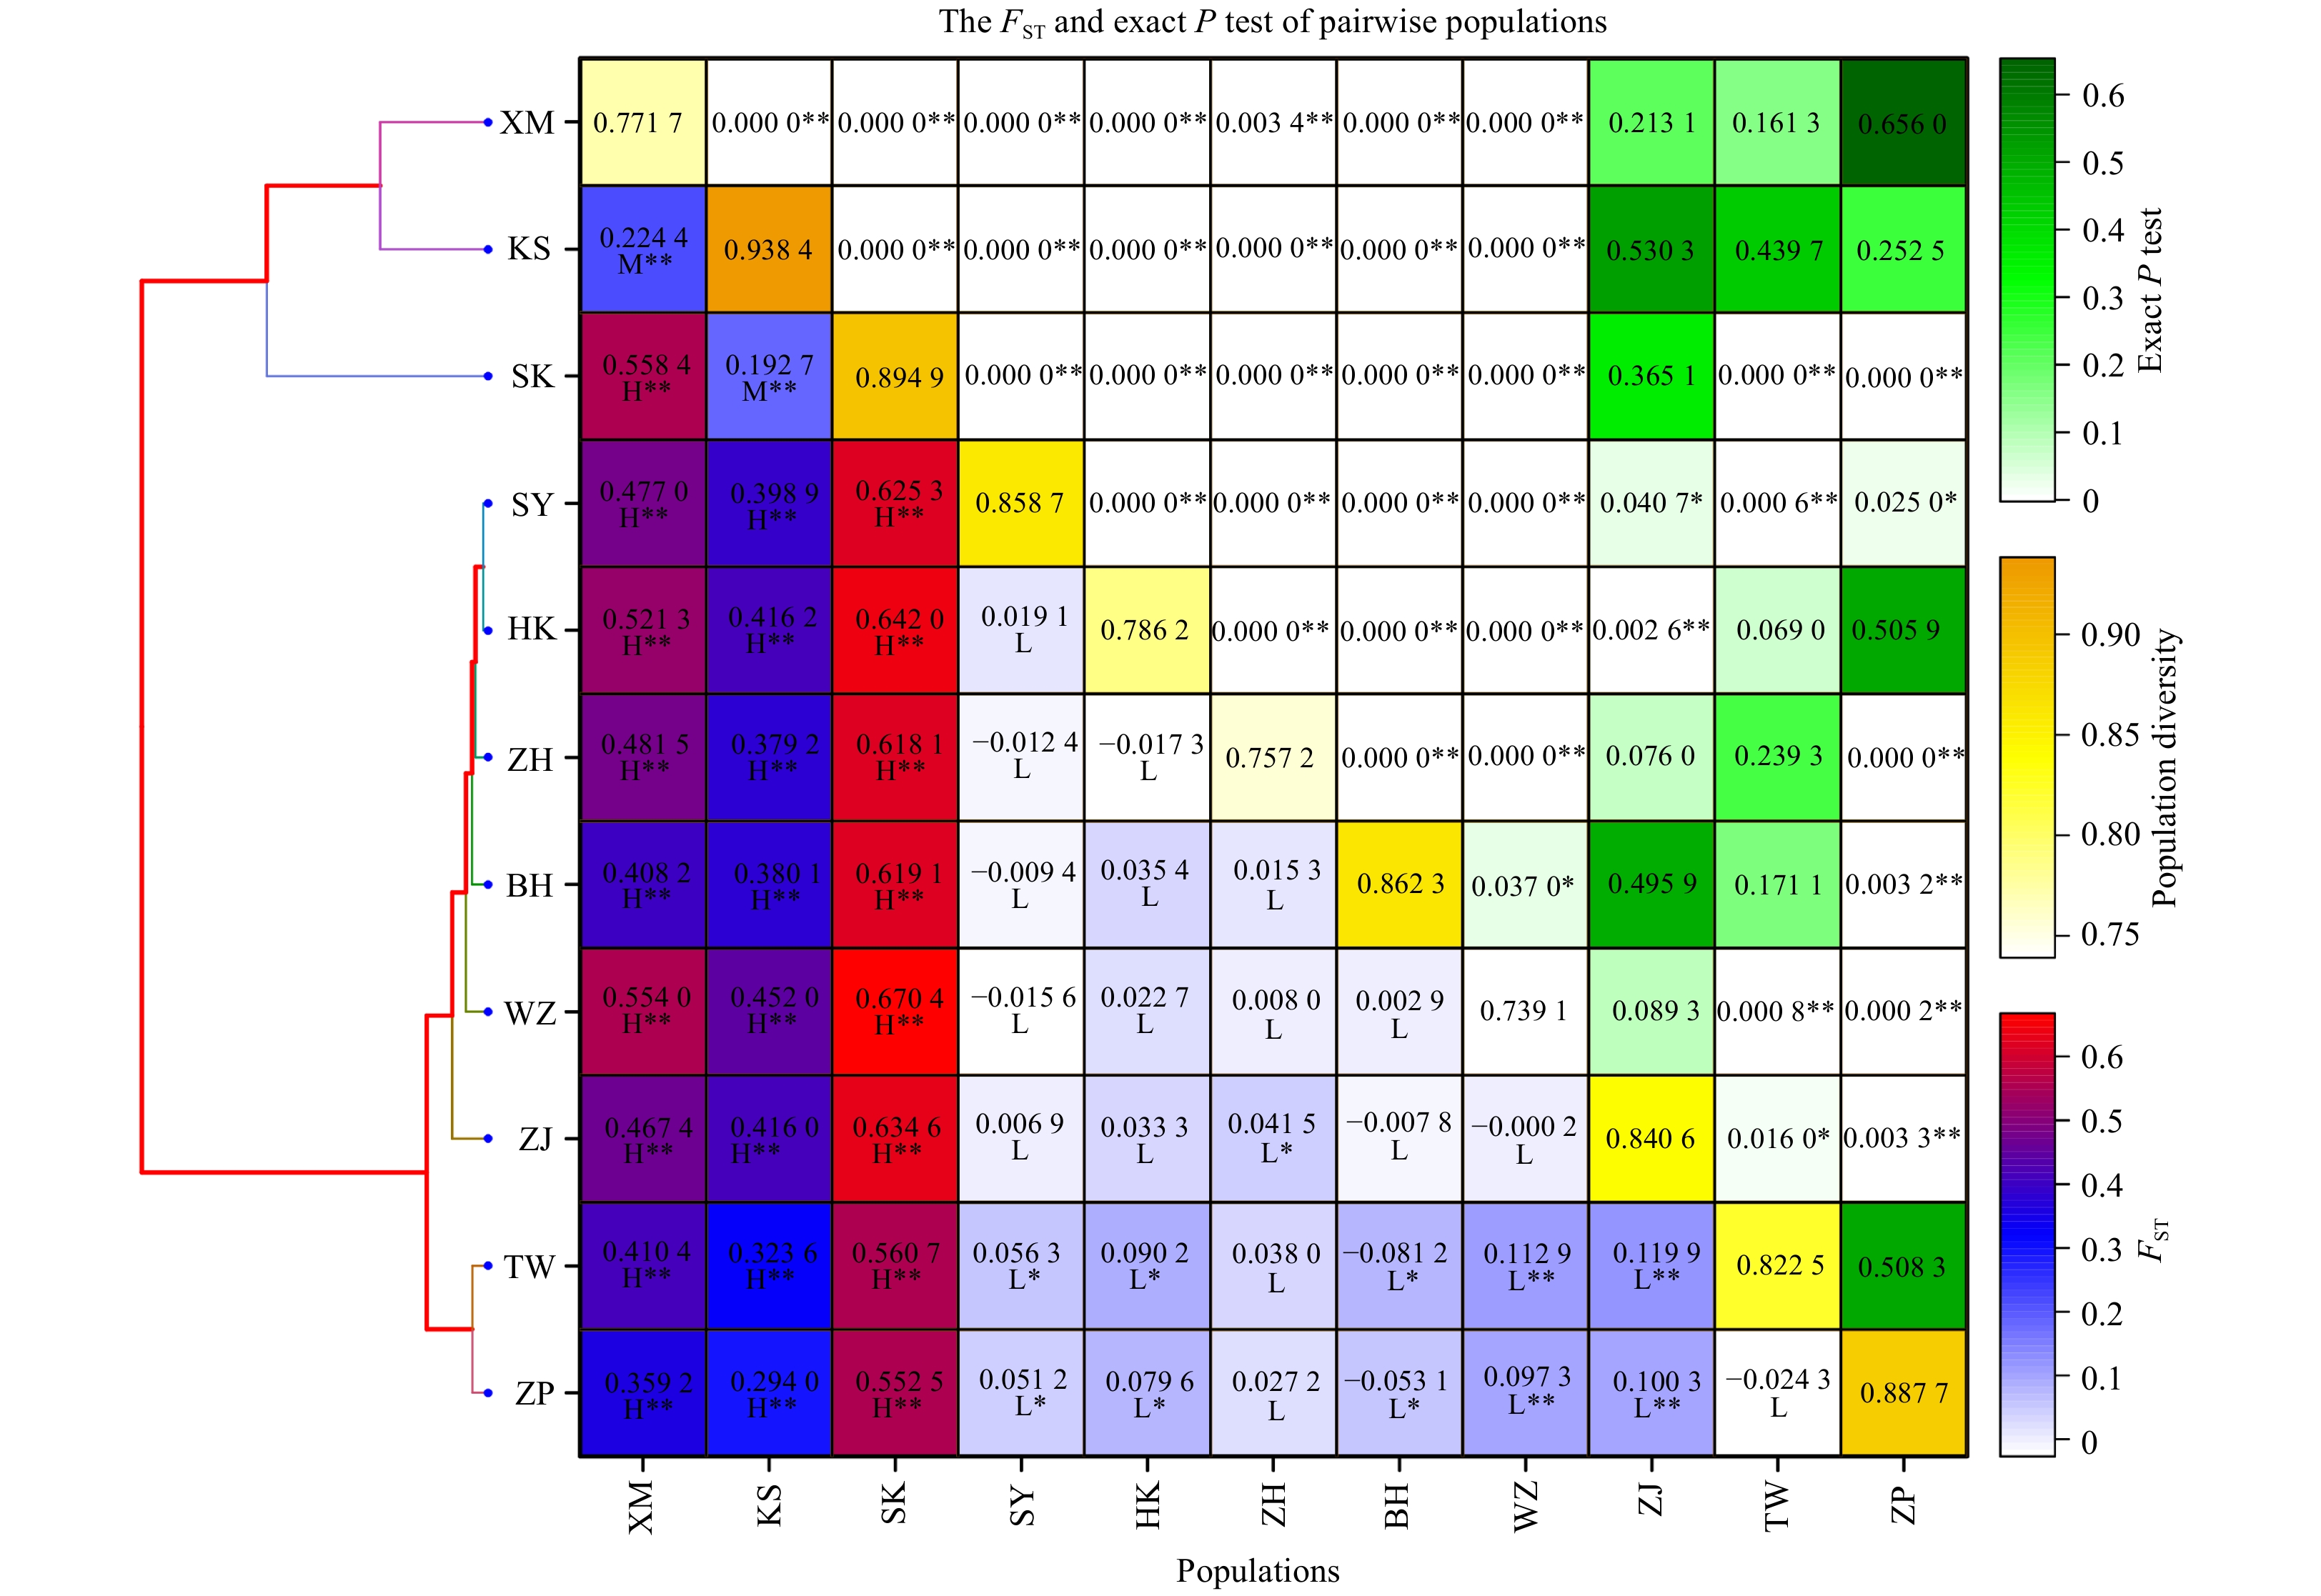
According to the F-statistic test value (FST), the genetic difference between populations was classified as low (–1, 0.15], medium (0.15, 0.25], and high (0.25, 1) (Fig. 6), respectively. Greater fluctuation occurred in the pairwise FST in P. minor populations. In addition, pairwise FST values between Chinese and Malaysian populations were higher than 0.25, indicating significant differentiation (Wright, 1965), which was statistically significant. Pairwise FST values between Xiamen and other populations were relatively high, and differences were statistically significant. Other than the Xiamen population, the pairwise FST values among Chinese populations were lower than 0.25, indicating little and moderate differentiation with statistically insignificant differences (Fig. 6). Negative pairwise FST values were observed among P. minor populations, indicating that the differentiation within populations was greater than that among populations (Aris-Brosou and Excoffier, 1996).
Figure
6.
Neighbor joining cluster tree (left), FST (right, below diagonal), and exact P test (right, above diagonal) of Pampus minor. The genetic difference between populations was classified as low (–1, 0.15], medium (0.15, 0.25] and high (0.25, 1) according to the FST value, represented as L, M and H, respectively. The “*” sign indicates a significance level of 0.05, whereas “**” indicates a significance level of 0.01.
AMOVA was used to examine the genetic structure in P. minor populations (Table 2). All populations were subjected to analysis as one gene pool. The results indicated that significant genetic differentiation existed within populations (ΦST=0.36, P<0.01), with 64.48% of the total genetic variation, while 35.52% existed among populations.
Table
2.
AMOVA of Pampus minor populations based on mitochondrial sequences of control region
Source of variation
Statistic squares sum
Proportion/%
Φstatistic
P
One gene pool (XM, ZP, TW, ZH, ZJ, BH, WZ, HK, SY, KS and SK)
Among populations
139.49
35.52
ΦST=0.36
0.00
Within populations
248.13
64.48
Two gene pools (XM, ZP, TW, ZH, ZJ, BH, WZ, HK and SY) (KS and SK)
Among groups
88.66
27.35
ΦCT=0.43
0.06
Among populations within groups
50.84
8.71
ΦSC=0.17
0.00
Within populations
248.13
63.94
ΦST=0.56
0.00
Four gene pools (TW) (XM, ZP, ZH, ZJ, BH and WZ) (HK and SY) (KS and SK)
Among groups
95.85
27.95
ΦCT=0.28
0.07
Among populations within groups
43.64
13.15
ΦSC=0.18
0.00
Within populations
248.13
58.91
ΦST=0.41
0.00
Six gene pools (TW) (XM, ZP, ZH and ZJ) (BH and WZ) (HK and SY) (KS) (SK)
Among groups
110.63
25.25
ΦCT=0.25
0.07
Among populations within groups
28.87
12.65
ΦSC=0.17
0.00
Within populations
248.13
62.11
ΦST=0.38
0.00
Note: The proportion refers to significant genetic differentiation existed within populations. Φ refers to the differentiation index within different types, Φstatistic refers to the statistical test within different types, ΦSTis the value of genetic differentiation within populations,ΦCTis the value of genetic differentiation among groups,and ΦSC is the value of genetic differentiation among populations among groups.
To further confirm the genetic structure of P. minor populations, the 11 populations were separated into 2, 4 and 6 gene pools according to their geographical locations. All results indicated that the genetic variation among groups was greater but not statistically significant (P>0.05). Statistically significant genetic variation primarily came from within populations (P<0.01), and the genetic differentiation among populations within groups was significant.
3.3
Historical demography
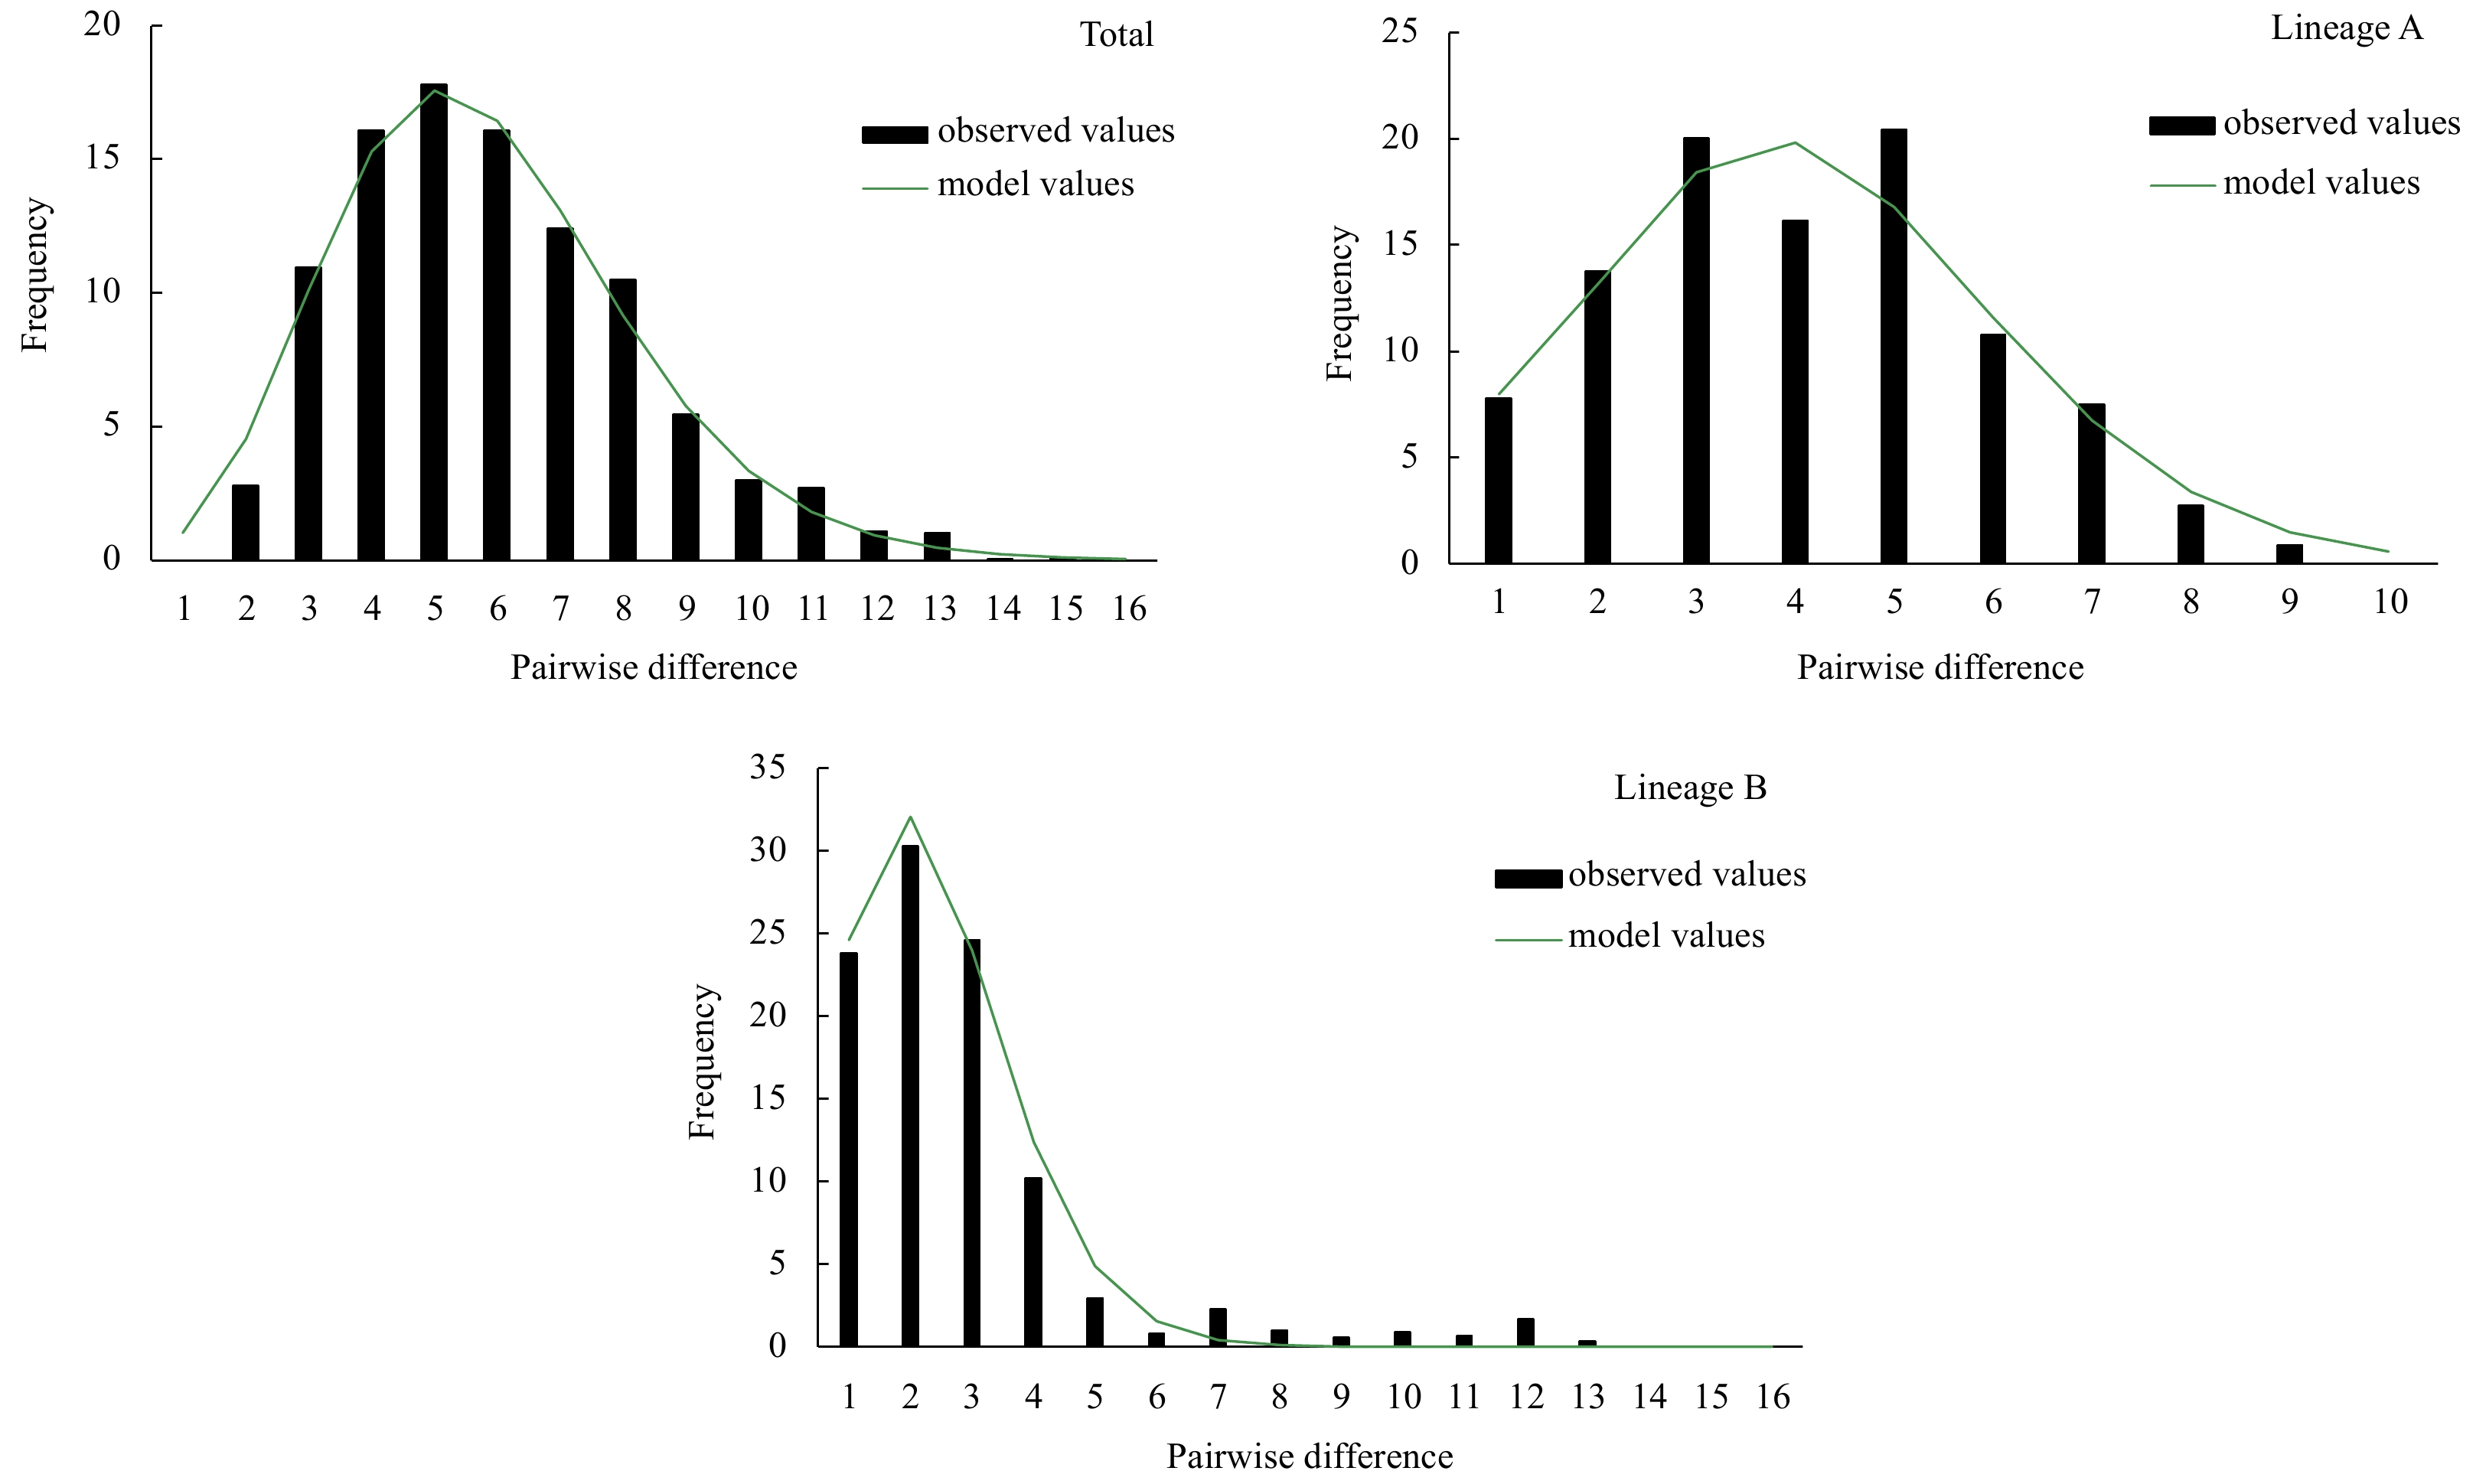
Although two haplotype lineages were detected in the P. minor populations, no significant geographical structure was observed for these two lineages, indicating that genetic variation may not have yet reached equilibrium after population differentiation. Since apparent differentiation was found between the P. minor populations, analysis of historic dynamics was performed for each haplotype lineage. The nucleotide mismatch distribution of all sequences was unimodal, and similar results were found in both lineages (Fig. 7). The results of the sums of the squared deviations and Harpending’s raggedness index were statistically insignificant (P>0.05) (Table 3), suggesting that no significant deviation was found from the expected distribution under the population expansion model. Therefore, the mismatch distribution test can be used to analyze the historic dynamics of the populations. The results of the neutrality test, which yielded negative values in FST and the Tajima’S D test for each lineage, and the overall populations with statistical significance (P<0.05) of the Bayesian skyline plot indicated that P. minor has experienced population expansion.
Figure
7.
Nucleotide mismatch distributions of control region of Pampus minor haplotypes.
Table
3.
Summary of molecular diversity, neutral test, and goodness-of-fit test for P. minor
Number
NH
h±SD
π±SD
k±SD
Tajima’s D test
F-statistic test
Goodness-of-fit test
D
P
FST
P
τ
θ0
θ1
SSD
HRI
Lineage A
112
36
0.922 1±0.011 3
0.008 5±0.004 9
3.089 3±1.617 4
–1.618
0.029
–25.874
0.000
3.432
0.104
16.406
0.003 2*
0.0239*
Lineage B
152
30
0.762 2±0.035 8
0.005 2±0.003 3
1.882 3±1.081 7
–1.576
0.021
–24.142
0.000
1.451
0.130
11.568
0.002 2*
0.0346*
All
264
66
0.907 4±0.013 6
0.008 1±0.004 7
2.947 7±1.548 7
–1.778
0.008
–26.145
0.000
1.396
0.000
99999
0.069 0*
0.0180*
Note: NH, numbers of haplotypes; h, haplotype diversity; π, nucleotide diversity; k, average number of pairwise differences; SSD, the sums of the squared deviations; HRI, Harpending’s raggedness index; τ, time since expansion, expressed in units of mutational time; *P>0.05.
The τ value from the nucleotide mismatch distribution provided an estimate of the time of population expansion. The τ of Lineage A was greater than that of Lineage B, which was 3.432 (95%CI: 1.742–5.369) and 1.451 (95%CI: 0.457–3.082), respectively (Table 3). CI is the confidence internal. According to the sequence divergence rate of 0.5×10⁻⁷–1×10⁻⁷ per site for each year and the τ values, the estimated times of expansion for Lineages A and B were 95×103–189×103 a and 40×103–80×103 a ago, respectively, during the late Pleistocene. The ratios of θ1 (after expansion) and θ0 (before expansion) reached infinity, suggesting that the effective maternal population size of P. minor underwent rapid growth.
Bayesian skyline plots revealed a detailed demographic history of population size changes, from that both Lineages A and B underwent population expansion in the late Pleistocene. The effective population size of Lineage A increased sharply after the last glacial maximum approximately 1.2×10⁵ a before the present, and the effective population size of Lineage B increased slowly from 7.5×10⁴ a ago (Fig. 8).
Figure
8.
Bayesian skyline plots showing the change of effective population size following with generation time for P. minor based on control region sequences. The upper and lower limits of the blue lines represent the 95% confidence intervals of highest posterior densities analysis. The black line represents median estimates of effective population size following with generation time.
Genetic diversity is the basis of species diversity and ecological diversity. The degree of genetic diversity can directly impact the adaptivity of species to the environment. A higher diversity suggests that a species has a greater potential to evolve and greater ability to adapt to environmental changes (Rosel et al., 1995). Meanwhile, genetic diversity and population structure are the fundamental information needed for fishery management and resource restoration. Therefore, we evaluated the genetic diversity, the current genetic structure, and historic dynamics using mitochondrial CR. The molecular phylogeographic results provide a scientific basis for the division of conservation units and the development of measures for resource protection.
4.1
Genetic diversity
Haplotype diversity (h) and nucleotide diversity (π) are two critical indicators for assessing the genetic diversity of a species. The results of our study indicate that examined P. minor populations have high h and low π. This type of fish population may have experienced an expansion event in its history. Expansion refers to rapid growth from a small effective population to a large population within a short period of time. During the process of expansion, haplotype diversity increases with the increasing populations. However, not enough time has passed for variation to accumulate in the nucleotides; therefore, the pattern of higher h and lower nucleotide diversity is formed (Grant and Bowen, 1998).
Although the pomfret fishery resources are declining due to overfishing (Jin et al., 2005), relatively large resources and effective populations explain the high genetic diversity identified among P. minor populations. This characteristic is more obvious among Malaysian populations that experience less overfishing. Pampus minor is a widespread species and has high adaptivity to food sources. Spawning grounds are different according to the locations of the fish, and heterogeneity also exists in its habitat (Wu et al., 2012). Life history traits, environmental heterogeneity, and large population size are the critical factors that allow stable population and high h among fishes of the continental shelf (Stepien, 1999). Therefore, the natural selection stress encountered by the species is relatively small, resulting in the accumulation of greater gene mutation and genetic diversity.
With more genetic variation, some individuals within a population are more likely to possess variations that are suited to the environment (Sun and Tang, 2018). Malaysia is located in a lower latitude region, with higher water temperature and a more diverse habitat, compared to those of China. Because of the monsoon, a rich amount of plankton is carried by the tide, providing better food sources. Therefore, the Malaysian P. minor populations are under low natural selection stress and can accumulate many genetic variations that can further evolve into genetic diversity (Fig. 2 and Fig. 3).
Generally, habitat expansion is important for the distribution of genetic diversity of a species. The genetic diversity of the derived populations tends to be lower than that of the ancestral populations. The results of our study show that the genetic diversity of HK and SY groups from the glacial refugium in the South China Sea was not higher than that in other Chinese populations. Additionally, the genetic diversity of all Chinese populations was lower than that of the Malaysian populations. This result can be attributed to the higher fishing pressure endured by the Chinese populations. Overfishing can result in greater pressure on the genetic information that has been preserved, which then leads to a loss in genetic diversity (Allendorf et al., 2008).
4.2
Genetic structure
Two lineages were identified among P. minor populations based on NJ tree and MST results. However, there is no significant frequency difference in the different geographic populations between the two major lineages in Chinese and Malaysian populations. In other words, the phylogenetic structure does not correspond to geographical location. Similar characteristics have been found among P. argenteus populations (Li et al., 2017). The FST results among P. minor populations indicate that significant differentiation exists between Chinese and Malaysian populations. AMOVA results suggest that the variation within populations is the primary contributor to the genetic differentiation (Table 2). Various studies have shown that marine fishes can spread over large areas. Eggs, juveniles, and adults can travel long distances with the assistance of ocean currents. Therefore, frequent gene exchange can occur between populations located far apart. As a result, the genetic differentiation within a wide area may be low (Grant and Bowen, 1998; Lecomte et al., 2004; Sun and Tang, 2018). Genetic differentiation between the Chinese and Malaysian populations studied in our research may correlate to the geographical distance. The physical barriers of the Wallacea Trough and Strait of Malacca may be the main factors contributing to the observed genetic differentiation. The same characteristics were observed among the P. chinensis populations (Li et al., 2019a). For the Chinese populations, other than the Xiamen population, genetic differentiation among populations was insignificant. The ecological and geographical barriers formed by the Leizhou Peninsula, Hainan Island, Zhujiang River Diluted Water, and Taiwan Strait do not result in segregation in the phylogeographic pattern of P. minor. The insignificant genetic differentiation in P. minor may be correlated to life history traits, such as spreading during the pelagic period, recent population expansion, and transportation through currents. Population expansion occurred later for P. minor, and the newly developed population after the expansion may not have had sufficient time to reach a balance between migration and drift. In the regions with P. minor, the northward currents, such as the Southwest Monsoon Drift, the South China Sea Warm Current, and the coastal currents in eastern Guangdong and eastern Hainan Island (Li et al., 2000; Ge, 2010; Qiao, 2012), can assist northward migration of eggs and juveniles from the southern population. Likewise, southward currents, such as the Northeast Monsoon Drift, coastal currents around Guangdong, Fujian and Zhejiang, and the Kuroshio South China Sea branch of the Kuroshio Current (Li et al., 2000; Ge, 2010; Qiao, 2012), can facilitate southward migration of the northern population. Gene exchange can occur for the population along the Leizhou Peninsula and Hainan Island because these fish can migrate through the Qiongzhou Strait through residual currents (current daily variations, both eastward or westward) (Qiao, 2012; Gao, 2013).
Interesting results were observed in the Xiamen population. Differentiation of this population from the other populations is significant, suggesting that the existence strategy among the populations is asymmetric. We re-examined sample sources and data analysis results to eliminate the effects of these factors. This species was first found as far north as the coast of Xiamen, and its geographical distribution is southward from the Taiwan Strait (Liu and Li, 1998). Therefore, the Xiamen population can be considered a marginal population along the northern boundary of the distribution of P. minor. Studies on adaptive evolution have shown that the marginal populations of a species are more sensitive to environmental changes, which results in significant population differentiation. Genetic variation correlated with adaptive evolution can more easily be detected (Bridle and Vines, 2007). These phenomena were supported by the characteristics observed in the Xiamen population. The results obtained also support the idea that the marginal effect of a single species can assist analysis of the genetic structure and evolution of the entire population within a finite temporal and spatial domain. Xiamen is a peninsula, and freshwater from the Jiulong River enters the region from the southwest, whereas the Jinmen Islands form a barrier on the outside. Therefore, the hydrological environment in the region varies widely and is complicated (Jing et al., 2011). These environmental factors may be the cause for differentiation of the Xiamen population.
4.3
Patterns of demographic history
The phylogeographic pattern and genetic structure of a marine organism are correlated with specific geological or environmental factors. These phenomena are supported by results from various studies (Liu et al., 2007; Shen et al., 2011; Han et al., 2012; Li et al., 2017). Among the various environmental factors, segregation caused by the Pleistocene ice age may represent the primary factor for the systematic differentiation of species. Nucleotide mismatch distribution (Fig. 7) and neutrality test results suggest that population expansion occurred for P. minor during the late Pleistocene, which is in accordance with some historic geological events. During the glacial maxima, the sea level of the South China Sea dropped approximately 100–140 m, and the South China Sea was turned into a semi-blocked inland sea, giving many marine organisms a glacial refugium. The drop in sea level caused the exposure of most of the continental shelves (Wang, 1999; Lambeck et al., 2002). Part of the Chinese coast turned into land, whereas Malaysia became part of the Sundaland. Climatic oscillations during this period may have greatly influenced the shapes of the present geographical distributions and genetic structures of species (Avise, 1998; Hewitt, 2000). With the harsh environment during the glacial period, the distribution and number of P. minor may have declined. With rising temperatures during the interglacial period, sea level rose, and many near-shore habitats were developed. The remaining P. minor individuals in the glacial refugium may then have rapidly expanded.
During the late Pleistocene (before the P. minor population expansion), the East Asia monsoon was enhanced, which promoted rainfall to the South China Sea. Therefore, the inflow current increased, which transported land-originated food sources to the ecological systems in the South China Sea, especially the near-sea regions. As a result, the surface-water paleoproductivity of the South China Sea increased (He et al., 2015). Additionally, in the last glacial maximum (after population expansion), the winter monsoon increased, which generated an upwelling current. With the increased land-originated food sources, the surface-water paleoproductivity of the region was boosted (Jian et al., 1999; He et al., 2014). Significantly increased paleoproductivity may have driven the rapid growth of fishes in the middle-to-surface water layers (Pauly and Christensen, 1995; Gong et al., 2011), resulting in P. minor population expansion. A large number of individuals then re-inhabited the northern continental shelf of the South China Sea, as well as the offshore shelf of Malaysia. The migrated population then adapted to differential habitats of the diverse seas. Many mutations could have formed during this process, allowing the accumulation of haplotype diversity and the formation of unique haplotypes. However, not enough time has passed for the accumulation of nucleotide diversity. These results of haplotype distribution, AMOVA and FST further suggest that these populations accumulated genetic variation while adapting to their environment. With the progression of time, differentiation between Chinese and Malaysian populations was inevitable. These expected results were confirmed by the genetic structure of P. chinensis because significant genetic differentiation is also shown in the mitochondrial (CR) and nuclear genes of its populations from China and Pakistan (Li et al., 2019a).
5.
Conservation implications for fishery management
The results reported herein revealed a correlation between low genetic diversity of the Chinese populations and high overfishing along the Chinese coast. Therefore, efforts should be made to protect P. minor fishery resources. A marine reserve area should be developed around the spawning grounds of P. minor along the coast. To protect fishery resources, the use of a bottom trawls, gillnets, and fixed nets should be forbidden in that area. Thereby, we will avoid the severe consequences of a decline in resources such as that seen for traditional commercial fishes, such as the large yellow croaker (Larimichthys crocea), small yellow croaker (Larimichthys polyactis), and hairtail (Trichiurus haumela).
Acknowledgements
We thank assistance from Xiang Zhang, Binbin Shan, Yan Li and Karhoe Loh during the collection of P. minor specimens. We also thank the anonymous reviewers for their helpful comments.
Allendorf F W, England P R, Luikart G, et al. 2008. Genetic effects of harvest on wild animal populations. Trends in Ecology and Evolution, 23(6): 327–337. doi: 10.1016/j.tree.2008.02.008
[2]
Aris-Brosou S, Excoffier L. 1996. The impact of population expansion and mutation rate heterogeneity on DNA sequence polymorphism. Molecular Biology and Evolution, 13(3): 494–504. doi: 10.1093/oxfordjournals.molbev.a025610
[3]
Avise J C. 1998. The history and purview of phylogeography: a personal reflection. Molecular Ecology, 7(4): 371–379. doi: 10.1046/j.1365–294x.1998.00391.x
[4]
Avise J C, Neigel J E, Arnold J. 1984. Demographic influences on mitochondrial DNA lineage survivorship in animal populations. Journal of Molecular Evolution, 20(2): 99–105. doi: 10.1007/BF02257369
[5]
Bowen B W, Bass A L, Rocha L A, et al. 2007. Phylogeography of the trumpetfishes (Aulostomus): ring species complex on a global scale. Evolution, 55(5): 1029–1039. doi: 10.1111/j.0014–3820.2001.tb00619.x
[6]
Bridle J R, Vines T H. 2007. Limits to evolution at range margins: when and why does adaptation fail?. Trends in Ecology and Evolution, 22(3): 140–147. doi: 10.1016/j.tree.2006.11.002
[7]
Butchart S H M, Walpole M, Collen B, et al. 2010. Global biodiversity: indicators of recent declines. Science, 328(5982): 1164–1168. doi: 10.1126/science.1187512
[8]
Cui Zhaoxia, Liu Yuan, Liu Jing, et al. 2010. Molecular identification of Pampus fishes (Perciformes, Stromateidae). Ichthyological Research, 57(1): 32–39. doi: 10.1007/s10228–009-0119–9
[9]
Drummond A J, Suchard M A, Xie Dong, et al. 2012. Bayesian phylogenetics with BEAUti and the BEAST 1.7. Molecular Biology and Evolution, 29(8): 1969–1973. doi: 10.1093/molbev/mss075
[10]
Dynesius M, Jansson R. 2000. Evolutionary consequences of changes in species’ geographical distributions driven by Milankovitch climate oscillations. Proceedings of the National Academy of Sciences of the United States of America, 97(16): 9115–9120. doi: 10.1073/pnas.97.16.9115
[11]
Ellegren H. 2014. Genome sequencing and population genomics in non-model organisms. Trends in Ecology and Evolution, 29(1): 51–63. doi: 10.1016/j.tree.2013.09.008
[12]
Excoffier L, Laval G, Schneider S. 2005. Arlequin (version 3.0): an integrated software package for population genetics data analysis. Evolutionary Bioinformatics, 1: 47–50. doi: 10.1177/117693430500100003
[13]
Funk W C, McKay J K, Hohenlohe P A, et al. 2012. Harnessing genomics for delineating conservation units. Trends in Ecology and Evolution, 27(9): 489–496. doi: 10.1016/j.tree.2012.05.012
[14]
Gao Jingsong. 2013. The research on the eddy in the northern South China Sea and circulation in the Beibu Gulf [dissertation] (in Chinese). Qingdao: Ocean University of China
[15]
Ge Qian. 2010. Paleoenvironmental and paleoclimatic records from the South China Sea since the late last Glaical Period [dissertation] (in Chinese). Wuhan: China University of Geosciences
[16]
Gong Gwoching, Liu Konkee, Chiang Kuoping, et al. 2011. Yangtze River floods enhance coastal ocean phytoplankton biomass and potential fish production. Geophysical Research Letters, 38(13): L13603. doi: 10.1029/2011GL047519
[17]
Grant W S, Bowen B W. 1998. Shallow population histories in deep evolutionary lineages of marine fishes: Insights from sardines and anchovies and lessons for conservation. Journal of Heredity, 89(5): 415–426. doi: 10.1093/jhered/89.5.415
[18]
Guo Enmian, Liu Yuan, Liu Jing, et al. 2010. DNA barcoding discriminates Pampus minor (Liu et al., 1998) from Pampus species. Chinese Journal of Oceanology and Limnology, 28(6): 1266–1274. doi: 10.1007/s00343–010-9917–1
[19]
Guo Qinfeng, Kelt D A, Sun Zhongyu, et al. 2013. Global variation in elevational diversity patterns. Scientific Reports, 3: 3007. doi: 10.1038/srep03007
[20]
Han Zhiqiang, Yanagimoto T, Zhang Yaping, et al. 2012. Phylogeography study of Ammodytes personatus in northwestern Pacific: Pleistocene isolation, temperature and current conducted secondary contact. PLoS One, 7: e37425. doi: 10.1371/journal.pone.0037425
[21]
He Lijun, Mukai T, Chu Kahou, et al. 2015. Biogeographical role of the Kuroshio Current in the amphibious mudskipper Periophthalmus modestus indicated by mitochondrial DNA data. Scientific Reports, 5: 15645. doi: 10.1038/srep15645
[22]
He Lijun, Zhang Aibing, Weese D, et al. 2014. Demographic response of cutlassfish (Trichiurus japonicus and T. nanhaiensis) to fluctuating palaeo-climate and regional oceanographic conditions in the China seas. Scientific Reports, 4: 6380. doi: 10.1038/srep06380
[23]
Hewitt G. 2000. The genetic legacy of the Quaternary ice ages. Nature, 405(6789): 907–913. doi: 10.1038/35016000
[24]
Jian Zhimin, Wang Lüjiang, Kienast M. 1999. Late Quaternary surface paleoproductivity and variations of the East Asian Monsoon in the South China Sea. Quaternary Sciences (in Chinese), 19(1): 32–40
[25]
Jin Xianshi, Zhao Xianyong, Meng Tianxiang, et al. 2005. Biology Resource and Environment in the Bohai Sea and Yellow Sea (in Chinese). Beijing: Scientific Press, 287–299
[26]
Jing Chunsheng, Zhu Xueming, Bao Xianwen, et al. 2011. Three dimensional tidal current numerical simulation based on FVCOM in and around Xiamen Bay. Journal of Oceanography in Taiwan Strait (in Chinese), 30(1): 103–113
[27]
Lambeck K, Esat T M, Potter E K. 2002. Links between climate and sea levels for the past three million years. Nature, 419(6903): 199–206. doi: 10.1038/nature01089
[28]
Lecomte F, Grant W S, Dodson J J, et al. 2004. Living with uncertainty: genetic imprints of climate shifts in East Pacific anchovy (Engraulis mordax) and sardine (Sardinops sagax). Molecular Ecology, 13(8): 2169–2182. doi: 10.1111/j.1365–294X.2004.02229.x
[29]
Li Yuan, Gao Tianxiang, Zhou Yongdong, et al. 2019a. Spatial genetic subdivision among populations of Pampus chinensis between China and Pakistan: testing the barrier effect of the Malay Peninsula. Aquatic Living Resources, 32(8): 1–10. doi: 10.1051/alr/2019004
[30]
Li Yuan, Lin Longshan, Song Na, et al. 2018. Population genetics of Pampus echinogaster along the Pacific coastline of China: Insights from the mitochondrial DNA control region and microsatellite molecular markers. Marine and Freshwater Research, 69(6): 971–981. doi: 10.1071/MF17218
[31]
Li Yuan, Zhang Yan, Lin Longshan, et al. 2017. New genetic perspectives of the ambiguous pomfret as revealed by CR sequences. ZooKeys, 719: 59–73. doi: 10.3897/zookeys.719.19914
[32]
Li Yuan, Zhang Liyan, Loh K, et al. 2019b. Genetic diversity comparison of Pampus minor between Chinese and Malaysian populations inferred from mtDNA Cytb. Pakistan Journal of Zoology, 51(1): 149–157. doi: 10.17582/journal.pjz/2019.51.1.149.157
[33]
Li Naisheng, Zhao Songling, Wasiliev B. 2000. Geology of Marginal Seas in the Northwest Pacific (in Chinese). Harbin: Heilongjiang Education Press, 60–68, 485–486
[34]
Liu Jinxian, Gao Tianxiang, Wu Shifang, et al. 2007. Pleistocene isolation in the Northwestern Pacific marginal seas and limited dispersal in a marine fish, Chelon haematocheilus (Temminck & Schlegel, 1845). Molecular Ecology, 16(2): 275–288. doi: 10.1111/j.1365–294X.2006.03140.x
[35]
Liu Jing, Li Chunsheng. 1998. A new pomfret species, Pampus minor sp. nov. (Stromateidae) from Chinese waters. Chinese Journal of Oceanology and Limnology, 16(3): 280–285. doi: 10.1007/BF02848735
[36]
Pauly D, Christensen V. 1995. Primary production required to sustain global fisheries. Nature, 374(6519): 255–257. doi: 10.1038/374255a0
[37]
Qiao Fangli. 2012. Regional Oceanography of China Seas: Physical Oceanography (in Chinese). Beijing: China Ocean Press, 310–350
[38]
Rogers A R, Harpending H. 1992. Population growth makes waves in the distribution of pairwise genetic differences. Molecular Biology and Evolution, 9(3): 552–569. doi: 10.1093/oxfordjournals.molbev.a040727
[39]
Rosel P E, Haygood M G, Perrin W F. 1995. Phylogenetic relationships among the true porpoises (Cetacea: Phocoenidae). Molecular Phylogenetics and Evolution, 4(4): 463–474. doi: 10.1006/mpev.1995.1043
[40]
Shen Kangning, Jamandre B W, Hsu C C, et al. 2011. Plio-Pleistocene sea level and temperature fluctuations in the northwestern Pacific promoted speciation in the globally-distributed flathead mullet Mugil cephalus. BMC Evolutionary Biology, 11(1): 83. doi: 10.1186/1471–2148-11–83
[41]
Stepien C A. 1999. Phylogeographical structure of the Dover sole Microstomus pacificus: the larval retention hypothesis and genetic divergence along the deep continental slope of the Northeastern Pacific Ocean. Molecular Ecology, 8(6): 923–939. doi: 10.1046/j.1365–294x.1999.00643.x
[42]
Stockwell C A, Hendry A P, Kinnison M T. 2003. Contemporary evolution meets conservation biology. Trends in Ecology & Evolution, 18(2): 94–101. doi: 10.1016/S0169–5347(02)00044–7
[43]
Sun Peng, Tang Baojun. 2018. Low mtDNA variation and shallow population structure of the Chinese pomfret Pampus chinensis along the China coast. Journal of Fish Biology, 92(1): 214–228. doi: 10.1111/jfb.13515
[44]
Tamura K, Peterson D, Peterson N, et al. 2011. MEGA 5: molecular evolutionary genetics analysis using maximum likelihood, evolutionary distance, and maximum parsimony methods. Molecular Biology and Evolution, 28(10): 2731–2739. doi: 10.1093/molbev/msr121
[45]
Wang Pinxian. 1999. Response of Western Pacific marginal seas to glacial cycles: paleoceanographic and sedimentological features. Marine Geology, 156(1–4): 5–39. doi: 10.1016/S0025–3227(98)00172–8
[46]
Wright S. 1965. The interpretation of population structure by F-statistics with special regard to systems of mating. Evolution, 19(3): 395–420. doi: 10.1111/j.1558–5646.1965.tb01731.x
[47]
Wu Renxie, Liang Xiuhe, Zhuang Zhimeng, et al. 2012. Mitochondrial CO I sequance variation of silver pomfret (Pampus argentus) from Chinese coastal waters. Acta Zootaxonomica Sinica (in Chinese), 37(3): 480–488
Chunyan Xu, Jiandi Cai, Zhidong Zhuang, et al. Investigation of fish diversity in the Xiamen Sea in spring using environmental DNA technology. Marine Biodiversity, 2024, 54(4) doi:10.1007/s12526-024-01447-3
Yuan Li, Liyan Zhang, Jing Zhang, Cheng Liu, Longshan Lin. Levels and patterns of genetic variation in Pampus minor: Assessment of a mitochondrial DNA control region sequence[J]. Acta Oceanologica Sinica, 2021, 40(4): 74-83. doi: 10.1007/s13131-021-1784-4
Yuan Li, Liyan Zhang, Jing Zhang, Cheng Liu, Longshan Lin. Levels and patterns of genetic variation in Pampus minor: Assessment of a mitochondrial DNA control region sequence[J]. Acta Oceanologica Sinica, 2021, 40(4): 74-83. doi: 10.1007/s13131-021-1784-4
Table
2.
AMOVA of Pampus minor populations based on mitochondrial sequences of control region
Source of variation
Statistic squares sum
Proportion/%
Φstatistic
P
One gene pool (XM, ZP, TW, ZH, ZJ, BH, WZ, HK, SY, KS and SK)
Among populations
139.49
35.52
ΦST=0.36
0.00
Within populations
248.13
64.48
Two gene pools (XM, ZP, TW, ZH, ZJ, BH, WZ, HK and SY) (KS and SK)
Among groups
88.66
27.35
ΦCT=0.43
0.06
Among populations within groups
50.84
8.71
ΦSC=0.17
0.00
Within populations
248.13
63.94
ΦST=0.56
0.00
Four gene pools (TW) (XM, ZP, ZH, ZJ, BH and WZ) (HK and SY) (KS and SK)
Among groups
95.85
27.95
ΦCT=0.28
0.07
Among populations within groups
43.64
13.15
ΦSC=0.18
0.00
Within populations
248.13
58.91
ΦST=0.41
0.00
Six gene pools (TW) (XM, ZP, ZH and ZJ) (BH and WZ) (HK and SY) (KS) (SK)
Among groups
110.63
25.25
ΦCT=0.25
0.07
Among populations within groups
28.87
12.65
ΦSC=0.17
0.00
Within populations
248.13
62.11
ΦST=0.38
0.00
Note: The proportion refers to significant genetic differentiation existed within populations. Φ refers to the differentiation index within different types, Φstatistic refers to the statistical test within different types, ΦSTis the value of genetic differentiation within populations,ΦCTis the value of genetic differentiation among groups,and ΦSC is the value of genetic differentiation among populations among groups.
Table
3.
Summary of molecular diversity, neutral test, and goodness-of-fit test for P. minor
Number
NH
h±SD
π±SD
k±SD
Tajima’s D test
F-statistic test
Goodness-of-fit test
D
P
FST
P
τ
θ0
θ1
SSD
HRI
Lineage A
112
36
0.922 1±0.011 3
0.008 5±0.004 9
3.089 3±1.617 4
–1.618
0.029
–25.874
0.000
3.432
0.104
16.406
0.003 2*
0.0239*
Lineage B
152
30
0.762 2±0.035 8
0.005 2±0.003 3
1.882 3±1.081 7
–1.576
0.021
–24.142
0.000
1.451
0.130
11.568
0.002 2*
0.0346*
All
264
66
0.907 4±0.013 6
0.008 1±0.004 7
2.947 7±1.548 7
–1.778
0.008
–26.145
0.000
1.396
0.000
99999
0.069 0*
0.0180*
Note: NH, numbers of haplotypes; h, haplotype diversity; π, nucleotide diversity; k, average number of pairwise differences; SSD, the sums of the squared deviations; HRI, Harpending’s raggedness index; τ, time since expansion, expressed in units of mutational time; *P>0.05.
Figure 1. Sampling locations of Pampus minor. XM, Xiamen; ZP, Zhangpu; TW, Taiwan; ZH, Zhuhai; ZJ, Zhanjiang; BH, Beihai; WZ, Weizhou Island; HK, Haikou; SY, Sanya; KS, Kuala Selangor; SK, Mukah. The area of the circle is proportional to sample number.
Figure 2. The frequency of different sequence lengths in 11 populations of Pampus minor.
Figure 3. Composition and distribution of 66 haplotypes in Chinese and Malaysian populations of Pampus minor.
Figure 4. Neighbor joining tree of control region haplotypes in Pampus minor. Bootstrap supports of larger than 50 in 1 000 replicates are shown.
Figure 5. Unrooted minimum spanning tree showing the genetic relationship among CR haplotypes of Pampus minor. Circle size is proportional to haplotype frequency. Perpendicular tick marks on the lines joining haplotypes represent the number of nucleotide substitutions.
Figure 6. Neighbor joining cluster tree (left), FST (right, below diagonal), and exact P test (right, above diagonal) of Pampus minor. The genetic difference between populations was classified as low (–1, 0.15], medium (0.15, 0.25] and high (0.25, 1) according to the FST value, represented as L, M and H, respectively. The “*” sign indicates a significance level of 0.05, whereas “**” indicates a significance level of 0.01.
Figure 7. Nucleotide mismatch distributions of control region of Pampus minor haplotypes.
Figure 8. Bayesian skyline plots showing the change of effective population size following with generation time for P. minor based on control region sequences. The upper and lower limits of the blue lines represent the 95% confidence intervals of highest posterior densities analysis. The black line represents median estimates of effective population size following with generation time.


 DownLoad:
 DownLoad: