Renming Jia, Xinyue Mu, Min Chen, Jing Zhu, Bo Wang, Xiaopeng Li, A S Astakhov, Minfang Zheng, Yusheng Qiu. Sources of particulate organic matter in the Chukchi and Siberian shelves: clues from carbon and nitrogen isotopes[J]. Acta Oceanologica Sinica, 2020, 39(9): 96-108. doi: 10.1007/s13131-020-1650-9
Citation:
Renming Jia, Xinyue Mu, Min Chen, Jing Zhu, Bo Wang, Xiaopeng Li, A S Astakhov, Minfang Zheng, Yusheng Qiu. Sources of particulate organic matter in the Chukchi and Siberian shelves: clues from carbon and nitrogen isotopes[J]. Acta Oceanologica Sinica, 2020, 39(9): 96-108. doi: 10.1007/s13131-020-1650-9
Renming Jia, Xinyue Mu, Min Chen, Jing Zhu, Bo Wang, Xiaopeng Li, A S Astakhov, Minfang Zheng, Yusheng Qiu. Sources of particulate organic matter in the Chukchi and Siberian shelves: clues from carbon and nitrogen isotopes[J]. Acta Oceanologica Sinica, 2020, 39(9): 96-108. doi: 10.1007/s13131-020-1650-9
Citation:
Renming Jia, Xinyue Mu, Min Chen, Jing Zhu, Bo Wang, Xiaopeng Li, A S Astakhov, Minfang Zheng, Yusheng Qiu. Sources of particulate organic matter in the Chukchi and Siberian shelves: clues from carbon and nitrogen isotopes[J]. Acta Oceanologica Sinica, 2020, 39(9): 96-108. doi: 10.1007/s13131-020-1650-9
College of Ocean and Earth Sciences, Xiamen University, Xiamen 361005, China
2.
V.I. Il’ichev Pacific Oceanological Institute, Far Eastern Branch, Russian Academy of Sciences, Vladivostok 690041, Russia
Funds:
The National Natural Science Foundation of China under contract No. 41721005; the China Ocean Mineral Resources R&D Association (COMRA) Program under contract No. DY135-E2-2-03; the Marine S&T Fund of Shandong Province for Pilot National Laboratory for Marine Science and Technology under contract No. 2018SDKJ0104-3; the Ministry of Science and Education of Russia Project under contract No. АААА-А17-117030110033-0.
The stable isotopic composition (δ13C and δ15N) and carbon/nitrogen ratio (C/N) of particulate organic matter (POM) in the Chukchi and East Siberian shelves from July to September, 2016 were measured to evaluate the spatial variability and origin of POM. The δ13CPOC values were in the range of −29.5‰ to −17.5‰ with an average of −25.9‰±2.0‰, and the δ15NPN values ranged from 3.9‰ to 13.1‰ with an average of 8.0‰±1.6‰. The C/N ratios in the East Siberian shelf were generally higher than those in the Chukchi shelf, while the δ13C and δ15N values were just the opposite. Abnormally low C/N ratios (<4), low δ13CPOC (almost −28‰) and high δ15NPN (>10‰) values were observed in the Wrangel Island polynya, which was attributed to the early bloom of small phytoplankton. The contributions of terrestrial POM, bloom-produced POM and non-bloom marine POM were estimated using a three end-member mixing model. The spatial distribution of terrestrial POM showed a high fraction in the East Siberian shelf and decreased eastward, indicating the influence of Russian rivers. The distribution of non-bloom marine POM showed a high fraction in the Chukchi shelf with the highest fraction occurring in the Bering Strait and decreased westward, suggesting the stimulation of biological production by the Pacific inflow in the Chukchi shelf. The fractions of bloom-produced POM were highest in the winter polynya and gradually decreased toward the periphery. A negative relationship between the bloom-produced POM and the sea ice meltwater inventory was observed, indicating that the net sea ice loss promotes early bloom in the polynya. Given the high fraction of bloom-produced POM, the early bloom of phytoplankton in the polynyas may play an important role on marine production and POM export in the Arctic shelves.
The Chukchi Sea and the East Siberian Sea are the most productive waters in the western Arctic and the eastern Arctic, respectively, both of which receive a large amount of river water and terrestrial organic matter from the Arctic rivers (Arrigo and van Dijken, 2011). The terrestrial POM in the Chukchi Sea and the East Siberian Sea are mainly derived from the North American rivers (e.g., Yukon River and Mackenzie River) and the Russian rivers (e.g., Lena River, Kolyma River and Indigirka River) respectively. These terrestrial POM have similar C/N ratios (12–40, Lobbes et al., 2000; Guo and Macdonald, 2006; Guo et al., 2012) and isotopic compositions (δ13C values ranged from −28‰ to −26‰, McClelland et al., 2008; Vonk et al., 2010; Guo and Macdonald, 2006, and δ15N values were about 2.0‰, McClelland et al., 2008; Guo and Macdonald, 2006). Due to the complex effects of sea ice, stratification, dissolved inorganic carbon, nutrients and community species, the concentration and isotopic composition of marine POM derived from autochthonous production show large spatial variations in the Arctic Ocean (McLaughlin and Carmack, 2010; Arrigo et al., 2012; Zhang et al., 2012; Pineault et al., 2013). The δ13C value is as high as −11.4‰ in ice-algal POM (Tremblay et al., 2006; Pineault et al., 2013) and less than −27‰ in the 13C-depleted phytoplankton (Zhang et al., 2012; Pineault et al., 2013). The C/N ratio of POM also varies greatly. The high cellular C/N ratios were observed under N-limited conditions (Körtzinger et al., 2001; Vrede et al., 2002) and the low cellular C/N ratios occurred in small phytoplankton and light limitation conditions (Taguchi, 1976; Chalup and Laws, 1990; Crawford et al., 2015). The western and the eastern Arctic Ocean have different freshwater discharge and ecological characteristics. It is of significance to reveal the origin and variations of POM in the Chukchi Sea and the East Siberian Sea.
Polynyas, the areas of open water in seas that are usually ice-covered, are found more or less all around the Arctic Ocean, at least during some time of the year (Barber and Massom, 2007). Many coastal polynyas are open up during winter when strong wind blows off the coast, and disappear in summer. These polynyas are ice factories in which sea ice is produced while the brine is rejected and transported to depth. The brine-enriched water that is transported will be replaced by shelf water originating from adjacent oceans (Hoppema and Anderson, 2007). The polynyas are biologically productive regions in the Arctic Ocean due to their early bloom after the polar night (Tremblay et al., 2002; Arrigo, 2007). For example, the Wrangel Island polynya, located in the mixing area of Pacific waters and Atlantic waters, showed the highest production in the Chukchi and Siberian shelves (Anderson et al., 2011). The results of the size-fractionated biomass indicated that phytoplankton community was dominated by small cells in the Northeast Water polynya (Pesant et al., 1996), the North Water polynya (Klein et al., 2002) and the Arctic Ocean (Gosselin et al., 1997). Unfortunately, little is known about particulate organic matter and its isotopic composition in the Arctic polynyas. Tremblay (2006) found that the δ13C value of bottom-ice POM was as low as −24.9‰ in the initial stage of the early bloom in the North Water polynya, which was attributed to the 13C-depleted pelagic bloom. Considering the significant contribution of early bloom on primary production in the Arctic polynyas, the bloom-produced POM in the early stage may have an impact on temporal and spatial variations and characteristics of POM in summer.
The C/N ratio and δ13C have been widely used to distinguish organic matter between autochthonous and allochthonous (mostly terrestrial) sources, based on the fact that marine and terrestrial organic matter have distinctly different δ13C values. The accuracy of distinguishing between marine and terrestrial sources depends on the end-member characteristics of the C/N ratio and δ13C (Kuliński et al., 2014; Kumar et al., 2016). Based on the C/N ratio and δ13C of POM, a three endmember mixing model was used to trace the origin of POM in southern Beaufort Sea by further dividing the marine source POM into refractory and fresh POMs (Magen et al., 2010).
In this study, seawater samples were collected from the Chukchi Sea and East Siberian Sea for measurements of carbon and nitrogen content, C/N ratio, δ13C and δ15N of suspended particulate organic matter. The spatial distributions of C/N ratio, δ13C and δ15N were depicted, in which an anomalous characteristic was found in the Wrangel Island polynya. A three endmember mixing model of C/N ratio and δ13C value was used to quantify the contribution of POMs from different sources. This study will deepen our understanding of biogeochemical cycle of organic matter in the Chukchi Sea and East Siberian Sea.
2.
Methods
2.1
Study area
The Chukchi Sea is connected to the Bering Sea through the Bering Strait in the south, and connects to the East Siberian Sea through the Long Strait in the west. The Chukchi and Siberian shelves are shallow, with a depth of less than 60 m and several shoals and canyons appearing. The circulations in the shelves are mainly restricted by the Pacific inflow, the Siberian Coastal Current (SCC, blue arrow) and the bathymetry (Fig. 1). The Pacific inflows are divided into three branches after leaving the Bering Strait, i.e., the Anadyr Water (AW) flows northwest to the East Siberian Sea through the Herald Canyon, the Bering Shelf Water (BSW) flows northward to the Chukchi Plateau and the Canada Basin through the Central Canyon, and the Alaska Coastal Water (ACW) flows northeast to the Canada Basin through the Barrow Canyon (Woodgate et al., 2005; Weingartner et al., 2005; Martin and Drucker, 1997). The SCC flows eastward from the Laptev Sea into the East Siberian Sea through the New Siberian Islands, then one branch of the SCC turns north entering the Makarov Basin and the other continues to flow eastward and mix with the Pacific water around the Wrangel Island (Talley et al., 2011). The pathway of the Siberian Slope Current (SSC) is uncertain and may sometimes flow eastward along the Siberian slope into the Canada Basin (Talley et al., 2011).
Figure
1.
The sampling locations, bathymetry and schematic circulations around the Chukchi Sea and the East Siberian Sea. The sampling locations during the Sino-Russian Joint Scientific Expedition and the 7th Chinese National Arctic Research Expedition were marked in squares and red circles, respectively. The grey squares represent stations where only surface samples have been collected. The bathymetric contours of 50 m, 100 m and 250 m are shown in blue, grey and red lines, respectively. Surface currents are marked with arrows of different colors, including Anadyr Water (AW, red arrows), Bering Shelf Water (BSW, brown arrows), Alaska Coastal Water (ACW, green arrows), Siberian Coastal Current (SCC, blue arrows), Siberian Slope Current (SSC, purple arrows) and Beaufort Gyre (BG, grey arrows). River runoff are marked in yellow arrows, including Lena River, Indigirka River, Kolyma River and Mackenzie River.
Samples for measurements of δ18O in seawater and POC, PN, δ13CPOC and δ15CPN of suspended particles were collected from July to September, 2016 in the Chukchi Sea and the Canada Basin (red dots in Fig. 1) onboard R/V Xuelong during the 7th Chinese National Arctic Research Expedition (CHINARE), and from August to September, 2016 in the East Siberian Sea (blue squares in Fig. 1) onboard R/V Academician LavrenJeev during the China−Russian Joint Cruise (LV-77 Cruise). A total of 69 stations were surveyed in the Chukchi Sea, the East Siberian Sea and the Canada Basin. Samples were collected from the entire water column, but only the data of the samples shallower than 200 m were analyzed here. Temperature and salinity were measured in-situ via a Sea-bird CTD sensor (SBE911 plus) during the 7th CHINARE. Temperature, salinity and Chl a concentration were measured onboard using an Alec CTD during the LV-77 Cruise.
Seawater samples for δ18O measurement were collected from Niskin bottles mounted on the CTD rosettes. Immediately after collection, the seawater sample was transferred to a 30 mL polyethylene bottle and kept in gas-tight, and brought back to the shore laboratory. In the shore laboratory, the sample was transferred into a 2 mL glass vial and sealed with Parafilm®. The isotopic composition of oxygen was analyzed via a Wavelength-scanned Cavity Ring-down Spectroscopy (WS-CRDS) in a laser spectroscopy analyzer (Picarro L2140-i, USA) (Skrzypek and Ford, 2014). Samples were prepared and run in batches. Each sample was conducted by eight injections of 2 μL seawater. During the measurements, five internal standards with different δ18O values (−6.91‰, −4.86‰, −2.79‰, −0.23‰, and 2.15‰) were synchronously measured after several samples for calibration. These standards were periodically calibrated against the Vienna Standard Mean Ocean Water (VSMOW) and the Standard Light Antarctic Precipitation (SLAP) from the International Atomic Energy Agency (IAEA). The δ18O value, referenced to the VSMOW, was reported in per mil with a precision of better than ±0.03‰:
Seawater samples for POC, PN, δ13CPOC and δ15NPN measurements were collected from Niskin bottles mounted on the CTD rosettes. The sample was filtered through a precombusted (450°C, 4 h) Whatman GF/F membrane onboard. The filters were kept frozen to shore laboratory for further treatments. After dried at 60°C, the membrane containing the particles was divided into subsamples. One quarter of the membrane was acid-fumed to remove inorganic carbon for subsequent measurements of particulate organic carbon (POC) and its isotopic composition (δ13CPOC). Half of the remained membrane was untreated to measure the particulate nitrogen (PN) and its isotopic composition (δ15NPN). POC and PN contents as well as δ13CPOC and δ15NPN were determined by a Thermo Finnigan Delta V mass spectrometer interfaced with an elemental analyzer (Carlo Erba NC 2500).
The internal standard (C6H6N2O) was used to establish a standard curve for the calculation of C and N contents. The detection limits for carbon and nitrogen content were both 0.1 μmol. The isotopic reference standards for C and N are PeeDee Belemnite and atmospheric N2, respectively. To monitor the instrument performance and data quality, certified standard samples, IAEA-C8 (δ13C=−18.3‰) and USGS40 (δ13C=−26.4‰), and IAEA-N2 (δ15N=20.3‰) and IAEA-N3 (δ15N=4.7‰) were used for δ13C and δ15N determination respectively. Both the analytical precisions of δ13C and δ15N are ±0.2‰. The values of δ13C and δ15N were defined as follows:
Seawater in the Chukchi Sea, the East Siberian Sea and the Canada Basin is considered as a mixture of the Atlantic water (AW), meteoric water (MW, including runoff and precipitation) and sea ice meltwater (SIM). As a result, the fractions of these three components were calculated from the mass balance of salinity and δ18O as follows:
where f, δ and S refer to the fraction of each component, δ18O and salinity respectively. Subscript AW, MW, SIM and obs represent the Atlantic water, meteoric water, sea ice meltwater and the observed value of each sample respectively. The characteristic salinity and δ18O values of the AW, MW and SIM used in our calculations were adopted from Li et al. (2017) and listed in Table 1.
Table
1.
The characteristic δ18O and salinity of three endmembers used to quantify the freshwater components in the Chukchi Sea and the Siberian Sea
The scatter plot of temperature, salinity and δ18O was showed in Fig. 2. The waters in the Chukchi and Siberian shelves were divided into three parts, i.e., Pacific water in the Chukchi shelf; the East Siberian Shelf Water in the western Siberian shelf and the mixed water of the Pacific, and the East Siberian Shelf water in the central and eastern Siberian shelf. The Pacific water was characterized by high temperature (>2°C), high salinity (>30) and high δ18O values (>−2‰). The East Siberian Shelf Water was characterized by low temperature (<4°C), low salinity (<26) and low δ18O values (<−4‰). The hydrological characteristics of the mixed water were between the above two water masses. The temperature and salinity in the upper 200 m water column in the basins were lower than 0°C and ranged from 26 to 34 respectively. The δ18O values ranged from −4‰ to 0‰.
Figure
2.
The scatter plot of temperature, salinity and δ18O value in the upper 200 m around the Chukchi and East Siberian seas. The color bar shows δ18O values of sample. Samples influenced by the Pacific inflow, the East Siberian Shelf Water and the mixed shelf water are marked in different colored frames.
The concentrations of POC and PN varied from 0.18 μmol/L to 37.77 μmol/L, and from below detection to 4.40 μmol/L, with average values of (4.65±5.65) μmol/L and (0.77±0.77) μmol/L, respectively. The C/N ratios (mol/mol) ranged from 1.7 to 17.3 with an average of 6.1±2.6. The high C/N ratios (>8) appeared near the estuary, indicating the effect of terrestrial organic matter characterized by a high C/N ratio (>12) (Lobbes et al., 2000; McClelland et al., 2016). Although the average value of C/N ratio was close to the Redfield ratio (6.5 to 8.7) (Redfield, 1958; Takahashi et al., 1985), some C/N ratios were between 2 to 5, which was significantly lower than the average ratio of marine organic matter (5.6) (Copin-Montegut and Copin-Montegut, 1983) and that in the high latitude (6.0) (Martiny et al., 2013b). Considering that the shelves are significantly affected by terrestrial organic matter, and the C/N ratio of terrestrial organic matter is much higher than that of marine organic matter, the true C/N ratio of organic matter produced by marine organisms may be lower than the measured value. The measured C/N ratio in our study areas was as low as 2.0, which was consistent with the cellular C/N ratio of small phytoplankton Phaeodactylum tricornatum (2.7) (Taguchi, 1976) and the recently reported C/N ratios of natural POM and phytoplankton (Crawford et al., 2015). The physiological basis for the low C/N ratio was mainly related to light limitation as phytoplankton growing under low irradiance accumulate less carbon storage polymers (Chalup and Laws, 1990; Cronin and Lodge, 2003; Martiny et al., 2013a) and small cell size of phytoplankton (<5 μm) has a lower uptake ratio (ρC : ρN) than the larger one (>5 μm) (Crawford et al., 2015). Recent studies have shown that the dominance of picophytoplankton and bacterioplankton is increasing in the Arctic Ocean, which may produce organic matter with a low C/N ratio (Li et al., 2009; He et al., 2012).
Figure
3.
The scatter plot of C/N ratio and δ13CPOC in the upper 100 m water column around the Chukchi Sea and East Siberian Sea. The color bar shows the δ15N value of sample. The average values of terrestrial and marine POM are marked in grey diamonds and their mixing zone is marked by grey shadow. The black arrow shows the decrease of δ13CPOC and C/N.
The surface distributions of temperature (°C), salinity, δ18O (‰), fraction of meteoric water (fMW, %) and sea ice meltwater (fSIM, %), POC (μmol/L), PN (μmol/L), δ13CPOC (‰) and δ15NPN (‰) were displayed in Fig. 4.
Figure
4.
Surface distribution of temperature (b, color), salinity (b, contour), δ18O (c), fMW (d), fSIM (e), POC (f), PN (g), C/N ratio (g), δ13C (h) and δ15N (i) around the Chukchi Sea and the East Siberian Sea. The simplified bathymetry is shown in Fig. 4a. Geographic locations marked with abbreviations are Bering Strait (BS), Chukchi shelf (CS), Wrangel Island (WI), Siberian shelf (SS), Makarov Basin (MB), Chukchi Plateau (CP) and Canada Basin (CB). The distribution of salinity and C/N ratio is shown in Figs 4b and g with the white contour respectively. The geographic locations marked in Fig. 4c are Siberian West Shelf (SWS), Siberian Middle Shelf (SMS) and Siberian East Shelf (SES).
The surface temperature and salinity decreased westward from the Chukchi Sea (T>6°C, S>30) to the East Siberian Sea (T<4°C, S<26), and a sharp front appeared near the Wrangel Island (180°E) (Figs 4a and b), indicating the combined effects of the warm, saline Pacific water and the cold, fresh Siberian shelf water (Woodgate et al., 2005; Talley et al., 2011). Surface temperature decreased to the north and reached below 0°C in the basins (Fig. 4a). The spatial variation of surface salinity was more complicated than temperature. Surface salinity decreased northward from the Chukchi Sea to the Chukchi Plateau and then to the Canada Basin (S<28), but increased northward from the East Siberian Sea to the Makarov Basin (Fig. 4b), reflecting the accumulation of freshwater in the Canada Basin (Alkire et al., 2015) and the influence of river runoff on the coast of the Eastern Siberian Sea (Lobbes et al., 2000). The maximum surface salinity appeared in the slope region off the Siberian, which may be due to the upwelling of subsurface water.
The spatial distribution of surface δ18O showed a pattern similar to salinity, with a decrease from the Chukchi Sea (>−2‰) to the East Siberian Sea (<−6‰). Whether in the Makarov Basin or in the Canada Basin, the δ18O values in surface seawater were stable at about −3‰ (Fig. 4c). According to the spatial variations of salinity and δ18O, surface waters in different regions in the Siberian shelf showed different characteristics. The Siberian West Shelf (SWS) has the lowest salinity and δ18O value, while the Siberian East Shelf (SES) has the highest salinity and δ18O value, and the Siberian Middle Shelf (SMS) shows the mediate salinity and δ18O value (Fig. 4c).
The variation pattern of fMW was similar to δ18O, suggesting that meteoric water plays a dominant role in regulating δ18O distribution in the high Arctic (Li et al., 2017). The distribution of fMW showed a continuous decrease from the SWS to the SMS, SES and the Chukchi shelf (CS), indicating that river water has a greater impact on the Siberian West Shelf and decreases eastward (Fig. 4d). The value of fSIM and its distribution were affected by the formation and melting of sea ice. The negative fSIM represents a net loss of sea ice, and the positive value represents a net accumulation of sea ice meltwater. The negative fSIM was observed in the SWS (−10% to −5%) and Makarov Basin (−5% to 0), whereas the positive fSIM was observed in the SMS, SES, CS (0 to 15%) and Canada Basin (0 to 5%), with the highest fSIM (>10%) occurring in the northern Chukchi shelf (Fig. 4e), showing the loss of sea ice in the Eastern Arctic and accumulation of sea ice in the Western Arctic (Alkire et al., 2015). The high positive fSIM values in the SMS and the northern Chukchi shelf were due to the regional accumulation of sea ice melting water.
The surface POC showed the highest concentrations (>6 μmol/L) in the SWS (Fig. 4f) due to the terrestrial influence from the Russian rivers (Anderson et al., 2011). Unlike the SWS, the high POC concentration observed in the CS (>4 μmol/L) (Fig. 4f) is mainly due to its high primary productivity (Arrigo et al., 2014). In general, the surface POC concentration decreased northward from the shelves (>2 μmol/L) to the basins (<2 μmol/L), reflecting the spatial variation of primary productivity.
The spatial distribution of surface PN concentration was very similar to that of POC, with high values in the SWS and the CS, and low values in the basins (Fig. 4g). The resultant C/N ratios in the shelves (<8, most of them <6) were generally lower than those in the basins (6 to 8). In the shelves, the SWS exhibited a high C/N ratio (6 to 8), while the SES showed a low value (<4) (Fig. 4g). It is worth noting that surface C/N ratio in the basins is close to the Redfield ratio and the average ratio of marine organic matter (Redfield, 1958; Martiny et al., 2013b).
The surface δ13CPOC ranged from −28‰ to −22‰, with high values in the CS (−26‰ to −22‰) and low values in the SMS, SES and Canada Basin (−28‰ to −26‰) (Fig. 4h). The surface δ13CPOC decreased by 0.8‰ on average from the Chukchi Sea to the Canada Basin, which is similar to the results of Zhang et al. (2012) and is the effect of increased dissolved CO2 concentration in seawater. It is noted that the δ13CPOC value in the East Siberian Sea is significantly lower than that in the Chukchi Sea. The surface δ15NPN ranged from 3.9‰ to 11.3‰, showing a general decrease from the shelf to the basin. In the shelves, the highest δ15NPN was observed in the SES, while the lowest in the SWS (Fig. 4i). Considering that terrestrial organic matter is often depleted in 15N (Guo and Macdonald, 2006), it is a paradox that the low δ13C and high δ15N occur simultaneously in the SMS and the SES (Fig. 4i). In fact, this phenomenon has been found in other estuaries or shelves, as a result of complex biochemical processes (Kumar et al., 2016). Burkhardt et al. (1999) demonstrated that stable carbon isotope fractionation εp is inversely correlated with cell size among the diatoms. Thus the low-δ13C and high-δ15N POM in the SMS and SES might be the result of bloom of small size phytoplankton.
3.5
Latitudinal distribution in the Chukchi and Siberian shelves
The distributions of temperature (°C), salinity, δ18O (‰), fMW (%), fSIM (%), POC (μmol/L), PN (μmol/L), δ13CPOC (‰) and δ15NPN (‰) along 148°E to 168°W in the Chukchi and Siberian shelves were shown in the Fig. 5. In the SWS and SMS, all parameters varied little vertically due to the shallow depth (20–30 m) and strong mixing. In contrast, the water column in the SES and CS was stratified to the upper warm layer (0–20 m) and the lower cold layer (20 m to bottom). Compared with the upper warm water, the cold water below the depth of about 20 m showed the higher salinity, more negative fSIM, and the higher POC, PN, δ13C and δ15N values.
Figure
5.
The longitudinal distribution of temperature (a, color), salinity (a, contour), δ18O (b), fMW (c), fSIM (d), POC (e), PN (f, color), C/N ratio (f, contour), δ13C (g) and δ15N (h) in the Chukchi and the Siberian shelves. The distribution of salinity and C/N ratio is shown in Figs 5a and f with the white contour respectively. The geographic locations separated by white dashed lines are Siberian West Shelf (SWS), Siberian Middle Shelf (SMS), Siberian East Shelf (SES) and Chukchi Shelf (CS).
The sectional distribution of various parameters points to the following understandings: (1) The SES is a mixing zone for the Siberian shelf water and the Pacific inflow. The contours of salinity and δ18O showed that the light, fresh and 18O-depleted Siberian shelf water is mixed with the dense, saline and 18O-enriched Pacific inflow in the SES (Figs 5a and b). The mixing of seawater from the Atlantic and the Pacific promoted a pelagic bloom in the SES (Tremblay et al., 2006; Anderson et al., 2011). (2) The high concentrations of POC and PN observed at the bottom of the SES and the CS may be due to sediment resuspension. Resuspension of sediments is common in the Arctic shelves, which affects the POM and its isotopic composition in the water column (Lehmann et al., 2002). (3) Abnormal values of the fSIM, C/N ratio, δ13CPOC and δ15NPN were observed in the SES (Figs 5d, g, f and h). For example, the fSIM in the SES was lower than the surrounding waters, indicating a significant loss of sea ice. The lowest C/N ratio, the lowest δ13CPOC and the highest δ15NPN were all present in the SES. The simultaneous occurrence of these anomalies raises a question of what biogeochemical process plays a role in the SES, which is one of the issues that will be discussed in this study.
4.
Discussion
4.1
Variation in isotopic composition
The POM in the Arctic seas is composed of terrestrial exogenous organic matter and marine authigenic organic matter, but contributions of these two sources will change in different regions. The covariation relationship between the averaged fMW and the averaged POC or PN concentration indicated that the POM in the SWS and the SMS is more significantly affected by terrestrial source (a positive relationship between the fMW and the POC or PN), while that in the SES, the CS and the basins (including the MB, CP and CB) may be mainly contributed by marine organisms (a negative relationship between the fMW and the POC or PN) (Fig. 6a). Although the POMs in different regions have different sources, the δ13CPOC values of all regions were close to those of terrestrial organic matter, and the δ15NPN values were close to marine organic matter (Figs 6b and c). It seems that δ13CPOC and δ15NPN give inconsistent information, suggesting that the POC and PN are different in sources, turnover rates, and cycling pathways in the Arctic Ocean. Considering that δ13C and δ15N values of POM in the Arctic rivers are less changed than marine organic matter (Descolas-Gros and Fontugne, 1985; Tremblay et al., 2006; McClelland et al., 2008), this inconsistency was more likely due to the variation in isotopic composition of marine organic matter. As a result, we will focus below on possible factors that regulate the variation of δ13CPOC and δ15NPN in the regions dominated by marine organic matter, i.e., the SES, the CS and the basins.
Figure
6.
The averaged POC and PN (a), fMW (a), δ13C (b) and δ15N (c) in different regions. The solid and dashed lines represent the averaged δ13C and δ15N value of marine POM and terrestrial POM respectively. Regions shown in the x-axis include Siberian West Shelf (SWS), Siberian Middle Shelf (SMS), Siberian East Shelf (SES), Chukchi Shelf (CS), Makarov Basin (MB), Chukchi Plateau (CP) and Canada Basin (CB).
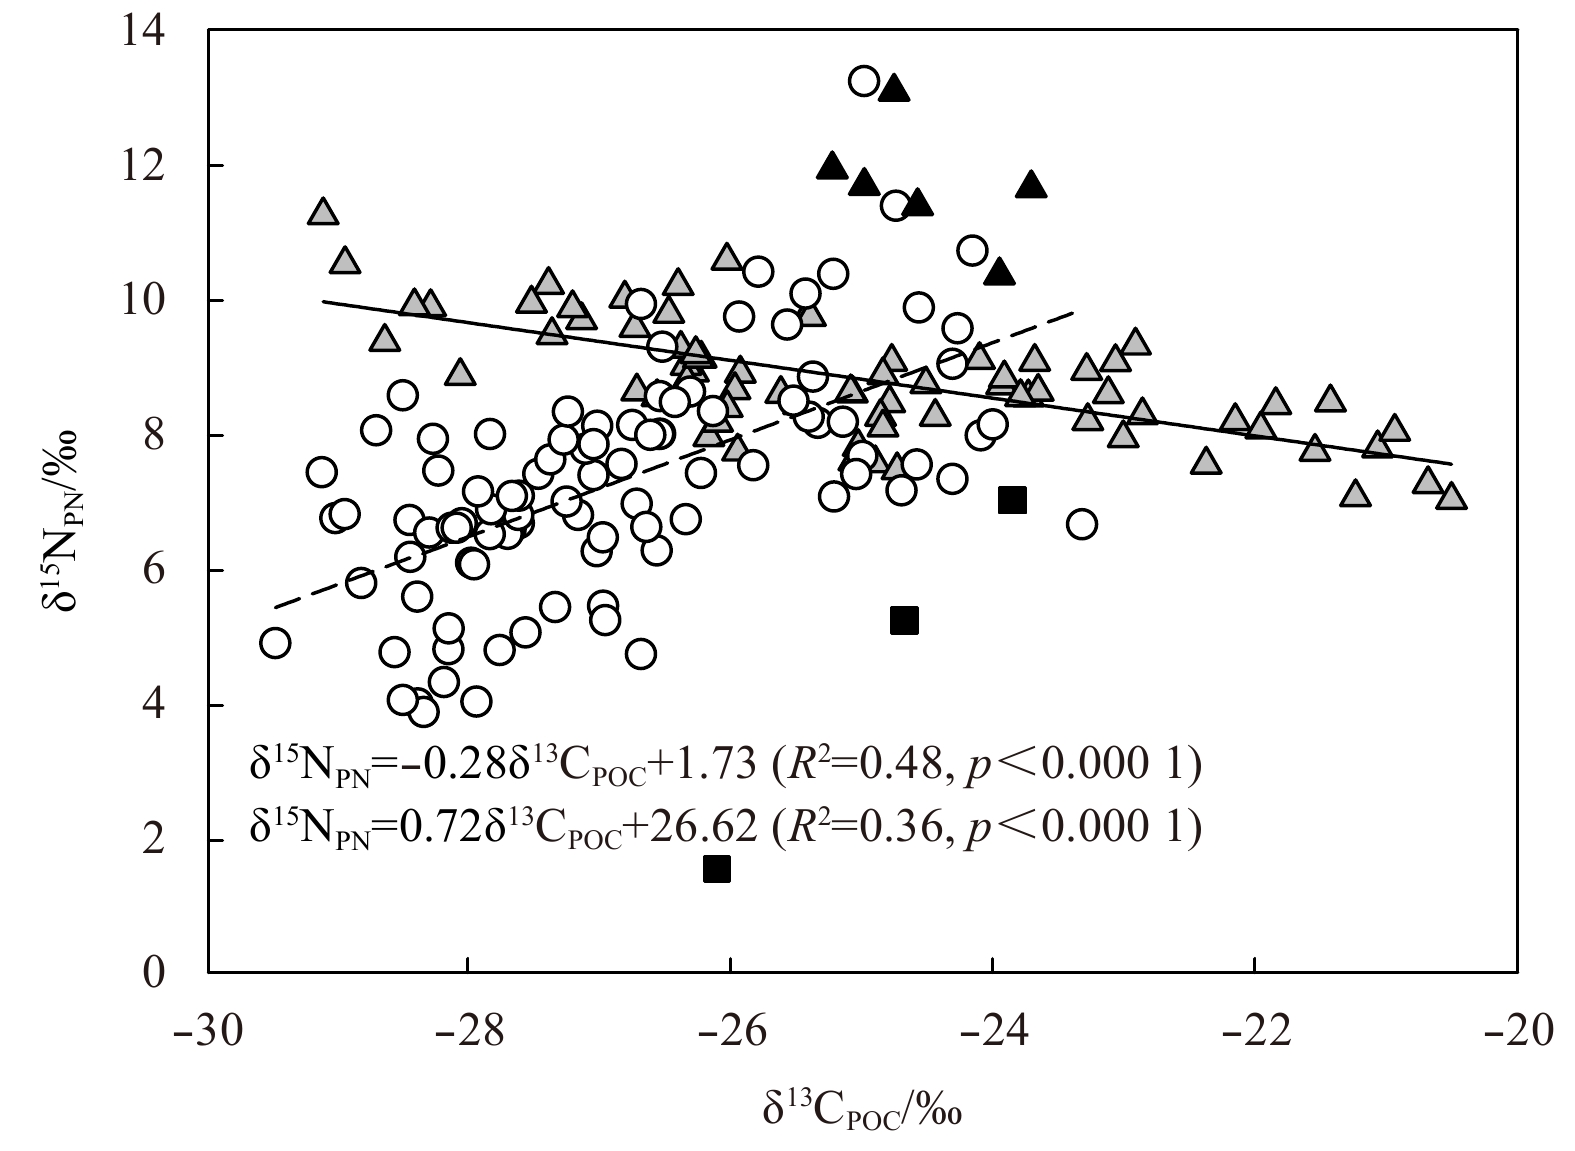
In the MB, CP and CB basins, the δ15NPN was positively correlated with δ13CPOC, and the fitting equation was: δ15N=0.72δ13C+26.62, R2=0.36, p<0.000 1 (Fig. 7). Note that the δ15NPN values at depths of 30 and 50 m at Station R14 are significantly lower and excluded from the fitting, although the reason for the lower δ15N was not clear. Previous studies have shown that the isotopic fractionation of carbon isotopes increases with the increasing CO2 concentration and is negatively correlated with the growth rate and cell size of marine phytoplankton (Burkhardt et al., 1999). In the Arctic basins, low temperature results in high concentration of dissolved CO2 and low growth rate of phytoplankton, which produces low δ13CPOC in the basins (Zhang et al., 2012). Unlike the case of carbon isotopes, nitrogen isotopic fractionation varied with phytoplankton species, and showed non-significant relationship with cell size or growth rate among most species of phytoplankton (Needoba et al., 2003), but a negative relationship with growth rate in the diatom Thalassiosira weissflogii (Montoya and McCarthy, 1995). Considering that diatom is an abundant species in the basins (Booth and Horner, 1997; Gosselin et al., 1997; Ardyna et al., 2017), it is reasonable to speculate that the positive correlation between δ13CPOC and δ15NPN may be due to the slow growth rate of phytoplankton in the basins. Previous studies suggested that the growth rate of phytoplankton is controlled by light availability regulated by sea ice conditions (Yun et al., 2012). The synchronous decrease in δ13CPOC and δ15NPN from the slope to the Chukchi plateau and then to the Canada Basin further supports this hypothesis (Figs 3h and i).
Figure
7.
Relationship between δ15N and δ13C of POM in the shelves and the basins. The samples collected from the Makarov Basin (MB), Chukchi Plateau (CP) and Canada Basin (CB) are marked in circles while the samples at depths of 30–50 m at station R14 are marked in black squares. The samples collected from the Siberian East Shelf (SES) and Chukchi Shelf (CS) are marked in grey triangles while the bottom samples from the SES and the CS are marked in black triangles. The dashed and the solid line represent the fitted lines of the basin and the shelf samples respectively.
Contrary to the situation in the basins, the δ15NPN was inversely correlated with the δ13CPOC in the SES and the CS (δ15N=−0.28δ13C+1.73, R2=0.48, p<0.000 1, Fig. 7). Note that the bottom samples were not included in the regression as they were affected by sediment resuspension and remineralization (Figs 5e and f). Considering the high productivity in the Arctic shelves (Arrigo et al., 2014) and the low dissolved CO2 concentration in the SES and CS (Anderson et al., 2011; Zhang et al., 2012), the low δ13C values in the SES and the CS could not be completely attributed to the CO2 concentration and growth rate of phytoplankton. The possible reason was the contribution of 13C-depleted phytoplankton. First, a significantly lower C/N ratio was observed in the SES (Fig. 5f), indicating the presence of small phytoplankton (Taguchi, 1976; Crawford et al., 2015). Second, carbon isotope fractionation decreases as the cell size of phytoplankton increases, and small phytoplankton will produce 13C-depleted POM (Burkhardt et al., 1999). Therefore, the productivity of the low-cellular C/N ratio and 13C-depleted phytoplankton may explain the negative correlation between δ13CPOC and δ15NPN in the SES and the CS.
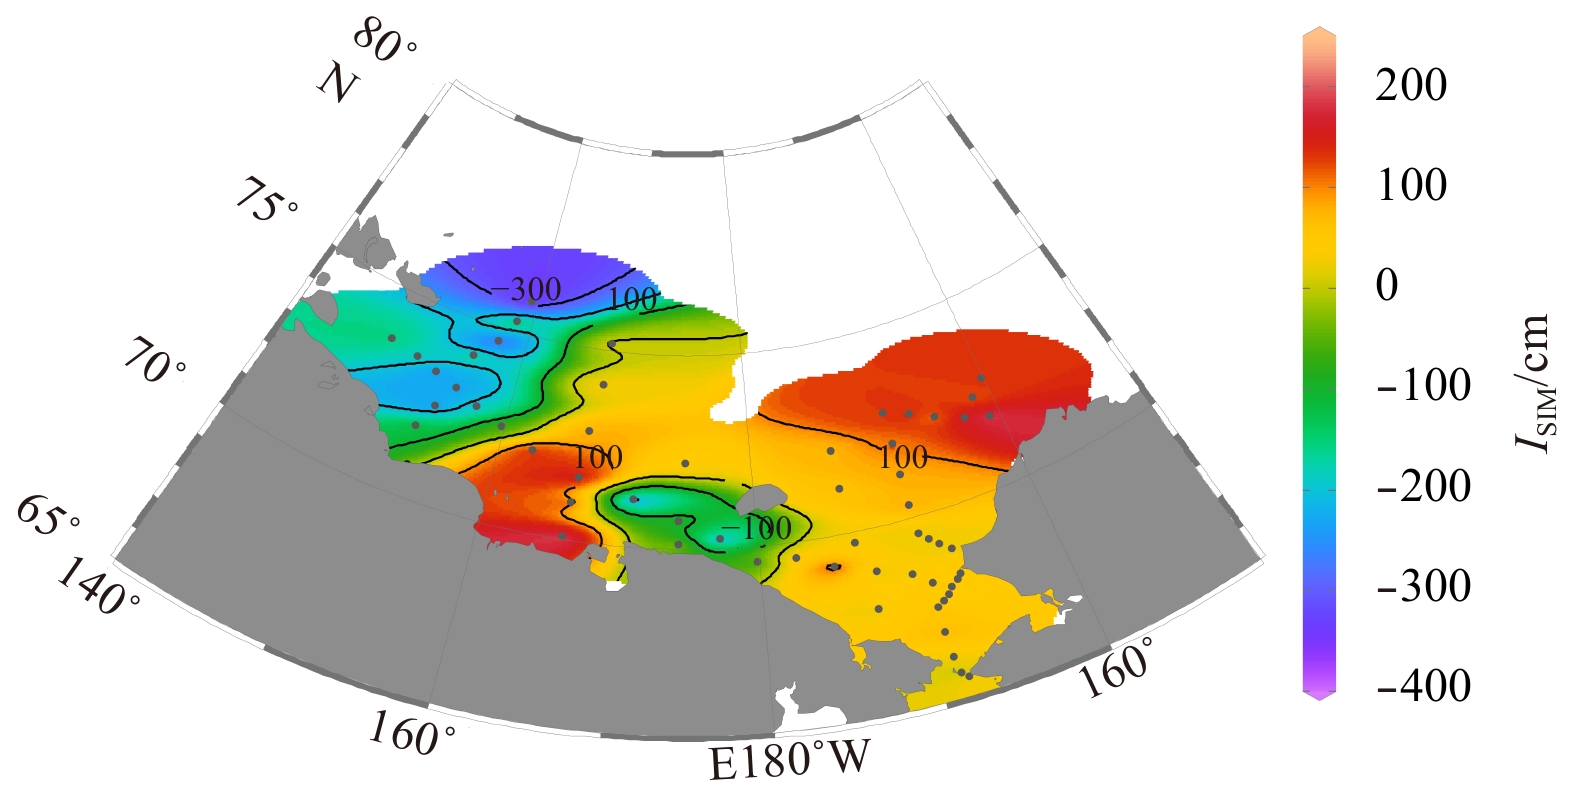
In fact, the low C/N ratios and δ13C values observed in the SES were in consistent with previously reported in the Arctic (Crawford et al., 2015; Kumar et al., 2016), which was attributed to the contribution of small phytoplankton with low cellular C/N ratio and low δ13C. However, inconsistent with the low δ13C values, the POM in the SES exhibited an abnormally high δ15NPN value (Fig. 4i). Therefore, it was necessary to clarify the mechanism by which the high δ15NPN was produced in the SES. Here, we proposed that it is produced by nitrogen isotope fractionation during phytoplankton assimilation. The spatial distribution of the SIM inventory showed the negative values in the SES, but the positive values in its surrounding areas, which indicates the net loss of sea ice from the SES (Fig. 8). The net loss of sea ice is consistent with the fact that a polynya exists around the Wrangel Island in early summer (Stringer and Groves, 1991; Pickart et al., 2010; Moore and Pickart, 2012). In the spring and early summer, due to the disappearance of low irradiance and thick ices, the polynyas usually produce phytoplankton blooms earlier than the surrounding waters (Hsiao, 1992; Arrigo, 2007; Ambrose and Renaud, 1995; Arrigo and van Dijken, 2004; Tremblay et al., 2002). The biomass and production in the early bloom were dominated by small phytoplankton (<5 μm), and changed to large phytoplankton in late summer (Pesant et al., 1996). The Wrangel Island polynya is located in the mixed zone of the Pacific inflow and the Siberian Shelf Water, which provides nutrients for the early bloom of phytoplankton. For comparison, during the early bloom in the North Water polynya, nitrate concentration was as high as 10 μmol/L in the initial stage and decreased progressively in less than one month, which led to the exhausting of nitrate in the upper water column (>25 m) and increasing of δ15NPN (Tremblay et al., 2006). Therefore, the early bloom of small phytoplankton was the most likely reason for the abnormally high δ15NPN in the SES.
Figure
8.
Distribution of the inventory of sea ice meltwater in the Chukchi and the Siberian shelves.
Denitrification and sediment resuspension are two other possible factors for the high δ15NPN in the SES. Denitrification was reported to be widespread in sediments and waters of the Chukchi and the Siberian shelves (Devol et al., 1997; Nitishinsky et al., 2007), and its isotope fractionation is as high as 20‰ (Granger et al., 2008). However, nitrogen isotopic composition of nitrate in the same voyage was similar in different regions (data not shown), which is difficult to explain the high δ15N observed only in the SES. For the effects of sediment resuspension, the δ15NPN in surface sediments of the Siberian shelf ranged from 4.3‰ to 9.8‰ with an average of 8.0‰ (data not shown), which was significantly lower than those observed in the suspended particles of the SES (Fig. 5h). Obviously, the abnormally high δ15NPN in the SES can’t be attributed to sediment resuspension. As for the effect of remineralization of particulate organic matter, it will simultaneously increase the δ15NPN and δ13CPOC (Landrum et al., 2011). However, the negative correlation between the δ15NPN and δ13CPOC in the SES ruled out this possibility (Fig. 7). In summary, the abnormally high δ15NPN in the SES may be induced by the early bloom of small phytoplankton in the polynya.
4.2
Contribution of terrestrial, bloom-produced and non-bloom POMs
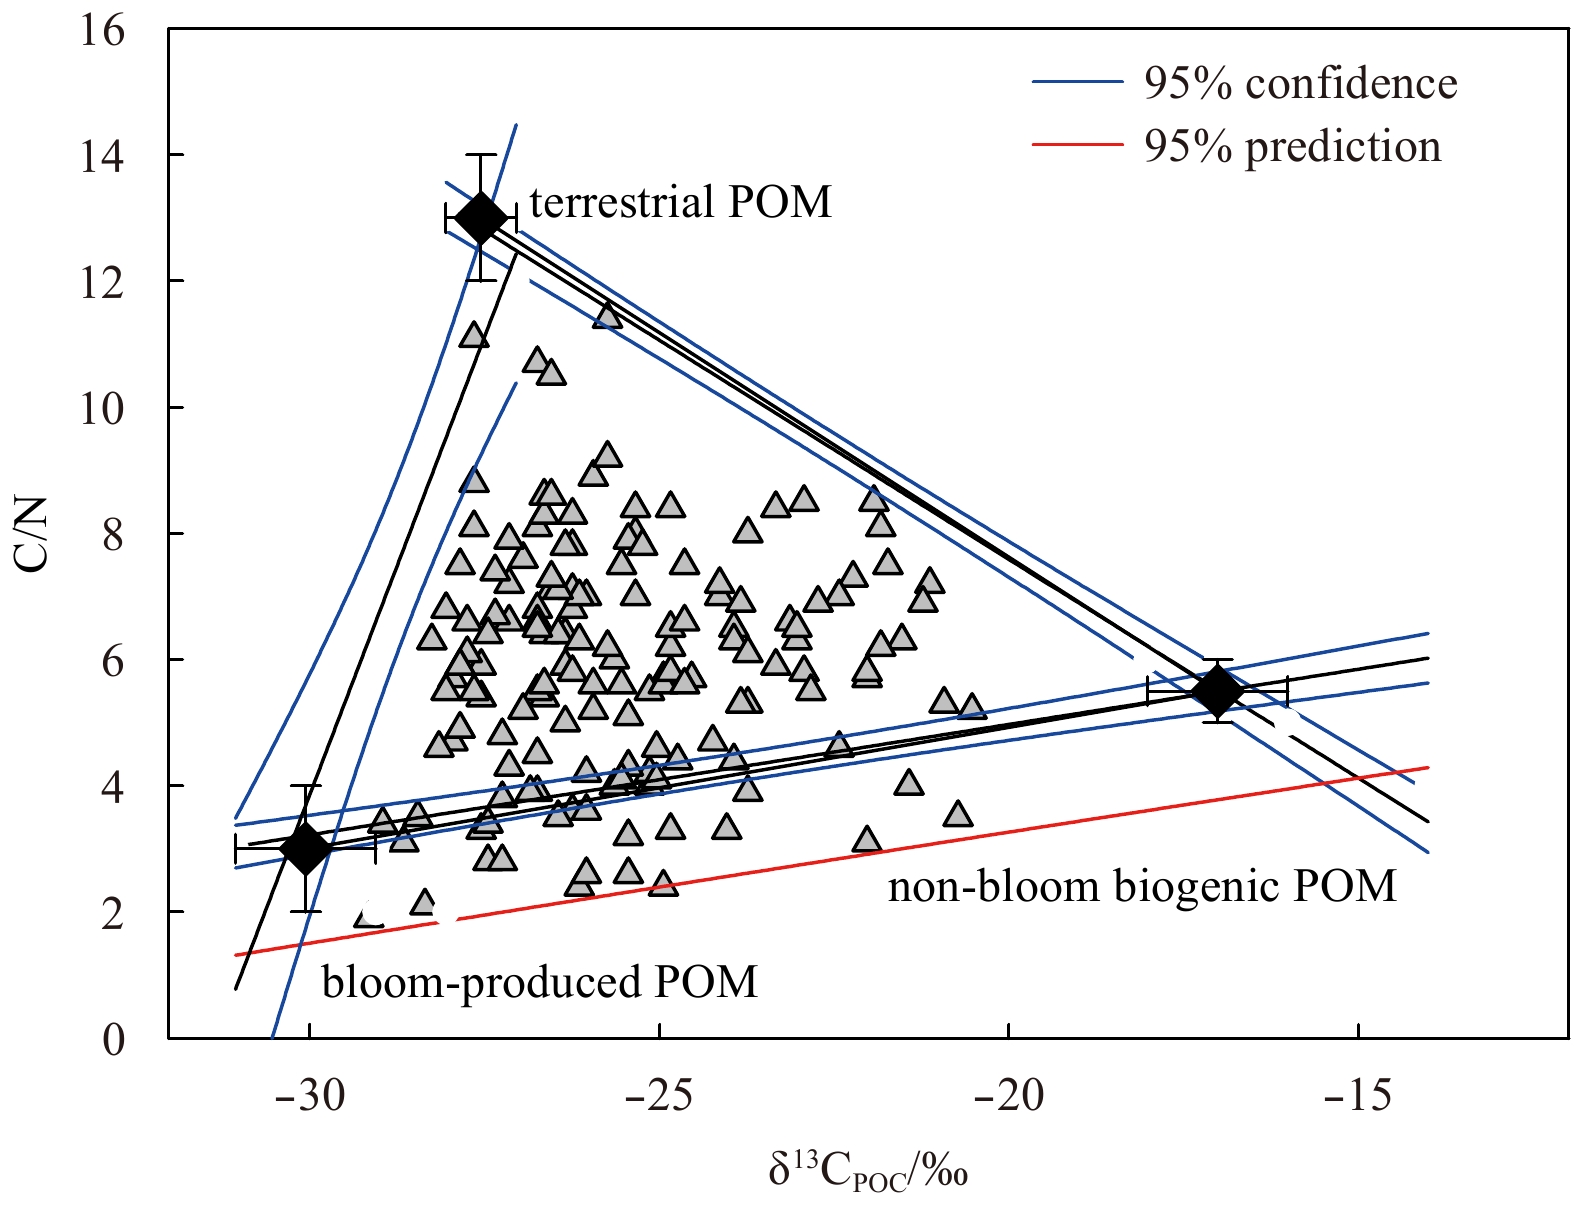
As stated above, the early bloom of small phytoplankton produced a distinctive POM characterized by low C/N ratio and low δ13C value, but high δ15N value. Here, the POM in the Chukchi and the Siberian shelves was thought to be composed of three different sources, namely terrestrial, bloom-produced and non-bloom biogenic. Based on the mass balance of C/N ratio and δ13CPOC, contribution fraction of these three sources was calculated as follows:
where f, R and δ13C refer to the source fraction, C/N ratio and δ13C value respectively. Subscript t, m, bm and obs represent the terrestrial POM, non-bloom biogenic POM, bloom-produced POM and the observed value respectively. The characteristic C/N ratio and δ13C value of each endmember were summarized in Table 2 and denoted in Fig. 9. The reasons for adopting these endmember values were described in the notes of Table 2.
Table
2.
The characteristic δ13C and C/N ratio of three endmembers used to calculate the contribution of terrestrial, bloom-produced and non-bloom biogenic POM in the Chukchi and the Siberian shelves
Notes: 1) Terrestrial POM: The reported δ13C value of terrestrial POM ranged from −22‰ to −30‰ with an average of −27‰ (Ehleringer et al., 1997) and its C/N ratio was higher than 12 (Lobbes et al., 2000; Guo et al., 2012; McClelland et al., 2016). The riverine POM dominated the source of terrestrial POM in the CS and the SES, while coastal erosion contributed nearly 60% to terrestrial POM in the SWS (Vonk et al., 2010). The weighted average of erosion-derived δ13CPOC was determined to be −27.5‰ in the SWS (McClelland et al., 2008; Vonk et al., 2010). Similar to the erosion-derived POM, the δ13CPOC value of riverine POM from the Russian rivers and the Yukon river was −25.6‰ to –27.4‰ (Lobbes et al., 2000) and about −26.2‰ respectively (Guo and Macdonald, 2006). In this study, the δ13C endmember value of terrestrial POM was assessed to be −27.5‰ ±0.5‰. As for the C/N ratio of terrestial POM, the reported value varied greatly, with around 12 in the Russian rivers (Lobbes et al., 2000) and from 14 to 40 in the Yukon River (Guo and Macdonald, 2006; Guo et al., 2012). Considering that the Russian rivers play a dominate role in our study areas, a value of 13±1 was adopted as the endmember C/N ratio. 2) Non-bloom biogenic POM: The δ13C value of biogenic POM ranged from −10‰ to −31‰ with an average of −20‰, and most of which was constrained between −17‰ to −22‰ (Descolas-Gros and Fontugne, 1985; Semiletov et al., 2005; Vonk et al., 2010). In the Arctic Ocean, the δ13C values of POM exhibit a wide range and vary from −16.7‰ to −30.4‰ (Goericke and Fry, 1994). In the Chukchi shelf, dissolved CO2 concentration is less than 20 μmol/L (Zhang et al., 2012), which corresponds to an isotope fractionation factor (εp) of 17‰ predicted by the Henry’s Law (Goericke and Fry, 1994). The highest value of δ13CPOC in the Chukchi and the Siberian shelves is −17.5‰ in this study. Obviously, the measured, the reported and the calculated δ13C values (by εp) in Arctic shelves are consistent, which supports the use of −17‰±1‰ as the δ13C endmember of non-bloom biogenic POM. The average C/N ratio of marine organic matter was 5.6 (Copin-Montegut and Copin-Montegut, 1983), and that in high-latitude cold waters was 6.0 (Martiny et al., 2013b). Here, the endmember C/N ratio of non-bloom biogenic POM was assessed to be 5.5±0.5. 3) Bloom-produced POM: The reported δ13C value of POM during phytoplankton bloom was as low as −24.5‰ to −31‰, which is significantly lower than those predicted by εp (Pineault et al., 2013; Kuliński et al., 2014; Kumar et al., 2016). The low δ13C value may be related to the high εp for small phytoplankton. For example, the εp of P. tricornutum is higher than 25‰ (Burkhardt et al., 1999). The lowest value of δ13CPOC measured in the Chukchi Sea and the Siberian Sea in this study was −29.5‰. Considering the contribution of 13C-depleted POM from the early bloom and the low δ13CPOC values measured, a value of −30‰±1‰ was adopted as the δ13CPOC endmember of bloom-produced POM. The C/N ratio of biogenic POM was as low as 2 to 4 in the Chukchi Sea and the Canada Basin (Crawford et al., 2015). The C/N ratio in the SES ranged from 2 to 5 in this study (Fig. 5f). The cellular C/N ratio of small diatoms (volume<300 μm3) was reported to be in a range of 2.8 to 3.8 (Taguchi, 1976). Therefore, a value of 3±1 was adopted as the C/N ratio endmember.
Figure
9.
The scatter plot of C/N ratio and δ13CPOC in the Chukchi and the Siberian shelves. The endmember values of terrestrial, non-bloom biogenic and bloom-produces POM are marked in black diamonds.
After clarifying the C/N ratio and δ13C endmembers, most of the data we measured in the Chukchi and the Siberian shelves were located in the mixed area of these three sources (Fig. 9). Although a few data are below the mixing line of the bloom-produced and the non-bloom biogenic POM, they were still within 95% of the prediction interval (Fig. 9). This deviation reflects the impact of endmember fluctuations. The values of ft, fm and fbm were calculated using Monte Carlo analysis with an average deviation of 7% for each source.
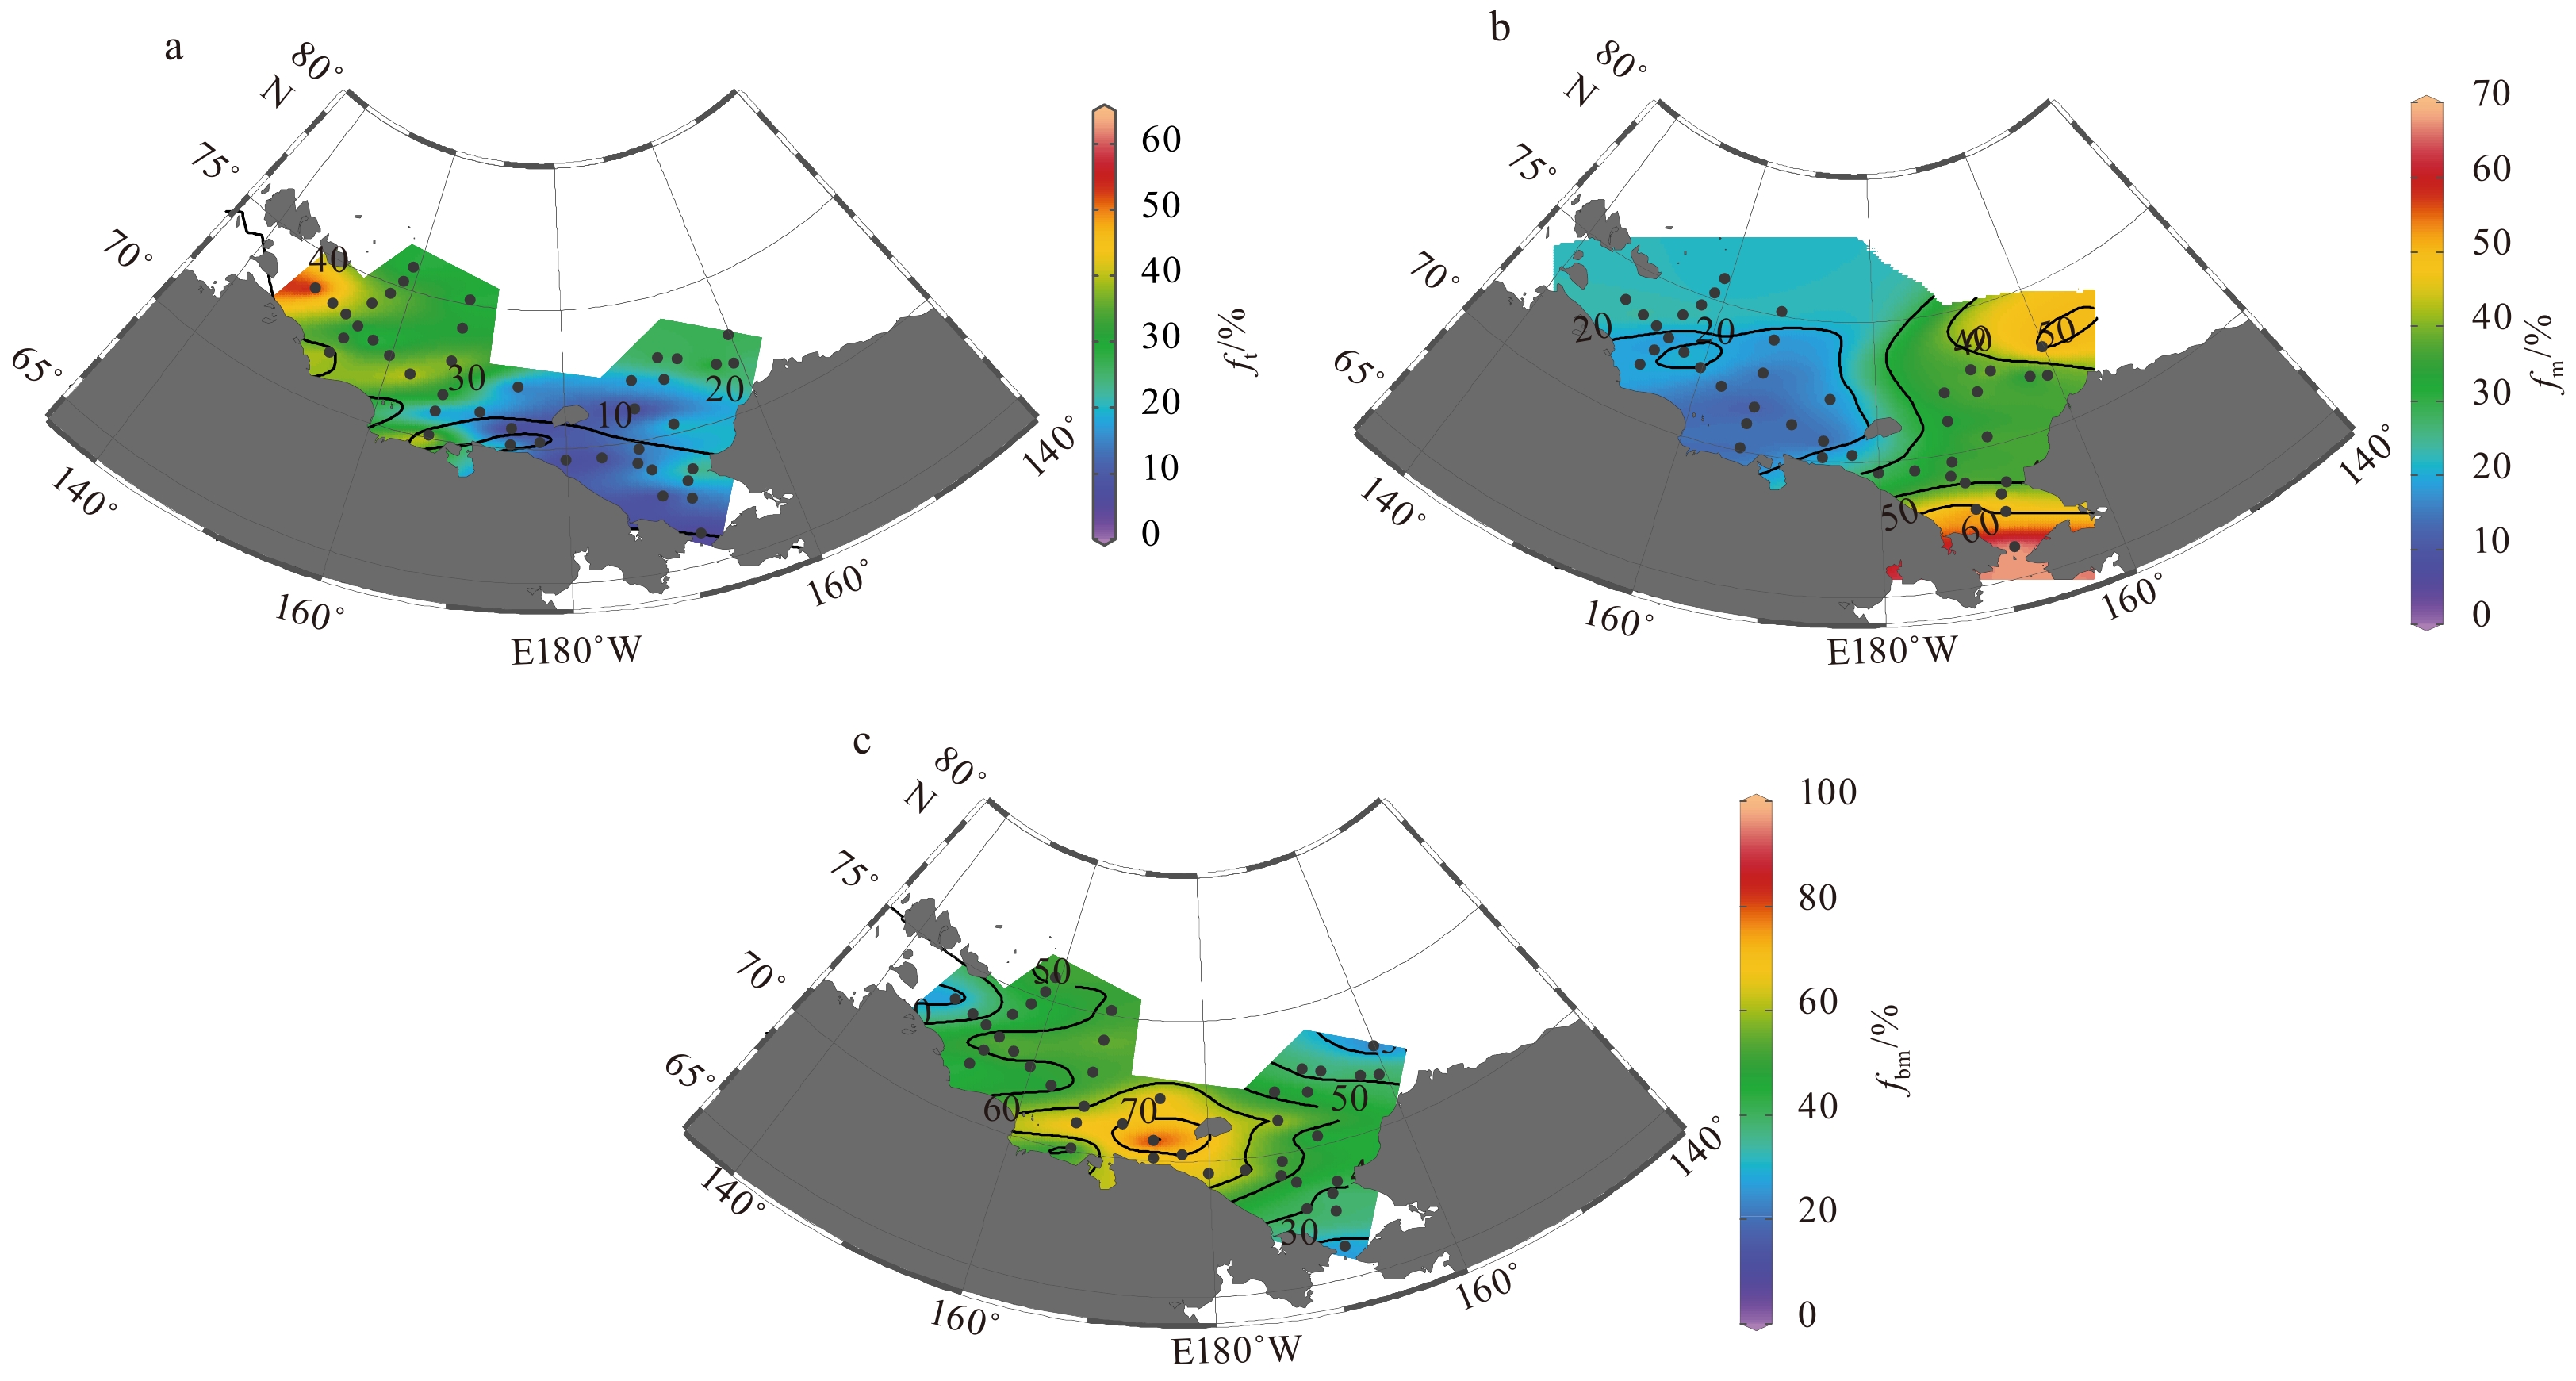
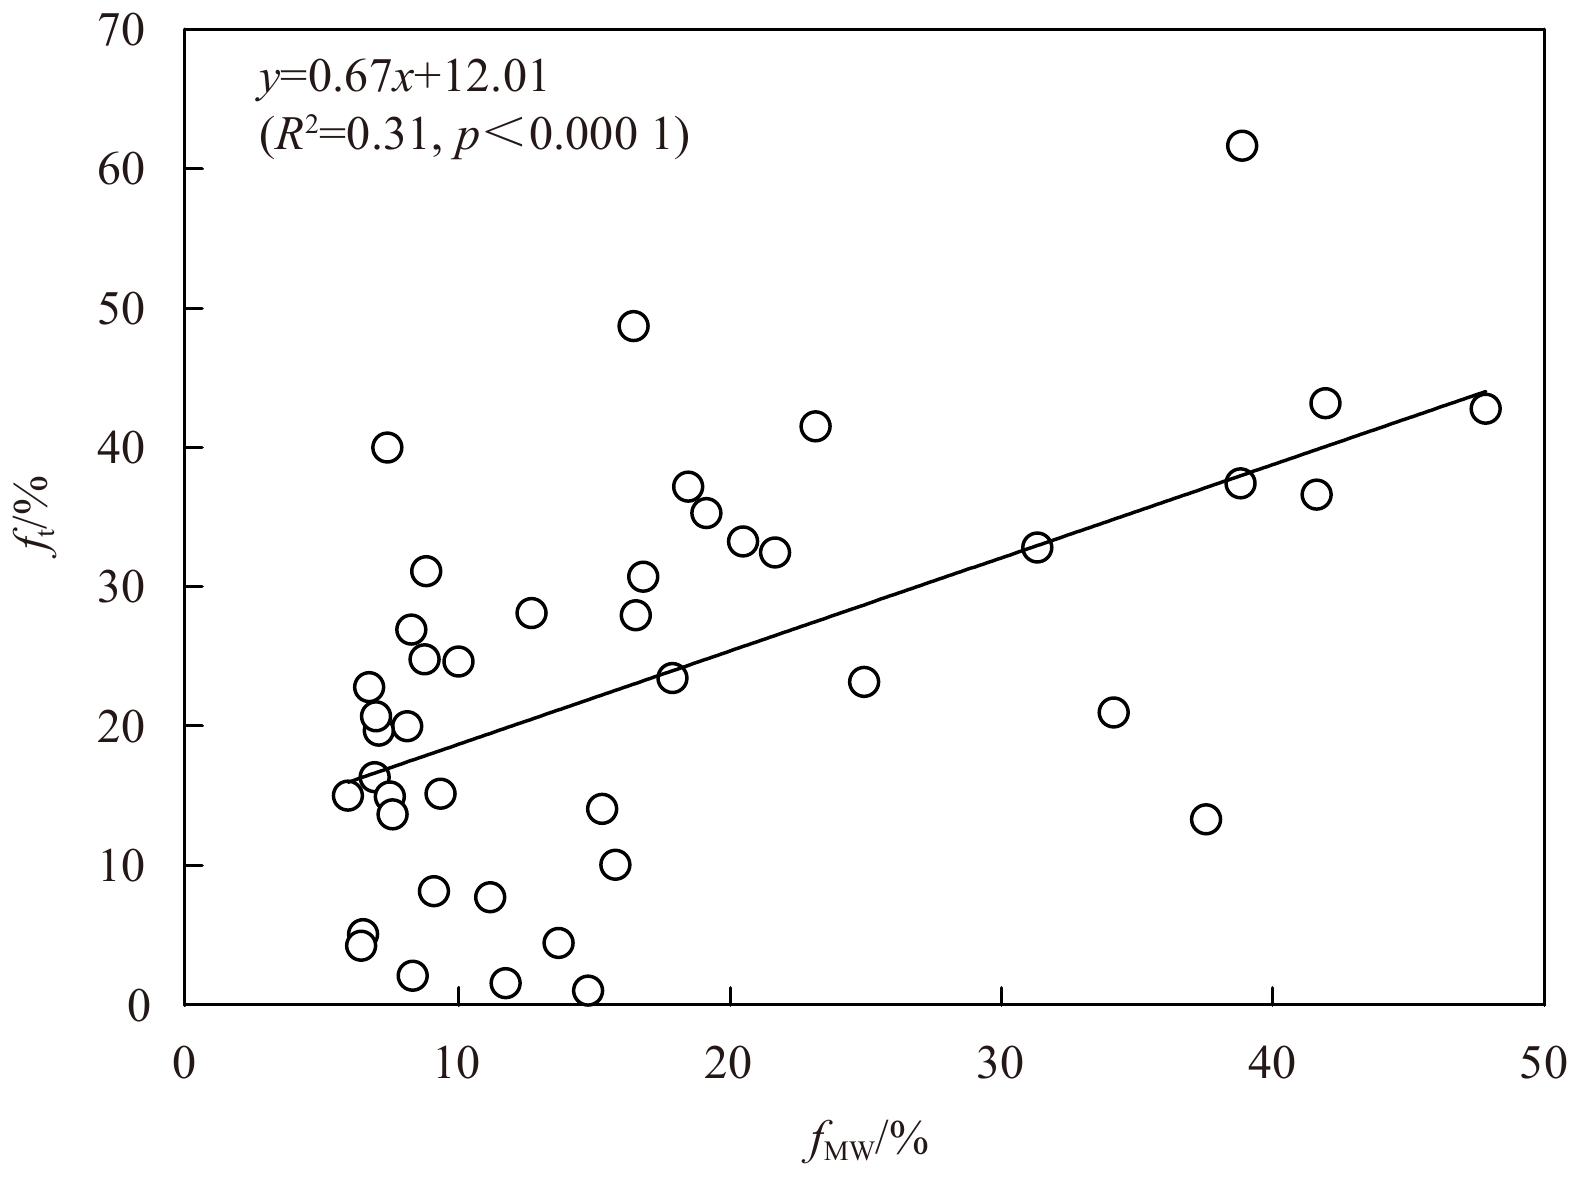
The averaged ft in the water column varied from <10% to 60%, and presented an eastward decline in the Chukchi and the Siberian shelves (Fig. 10a). The higher ft value (>30%) occurred in the SWS and decreased slightly to the north, indicating a strong source of terrestrial POM to the Siberian shelf. The ft value was the lowest (<20%) in the SES and the CS, corresponding to the high biological production in these areas (Anderson et al., 2011). The ft value in the northern CS (20%<ft<30%) was higher than that in the southern shelf, probably due to the terrestrial input from the Mackenzie River on the east side. Note that a significant positive correlation between the ft and the fMW is observed (p<0.000 1), further supporting the reliability of the calculated ft (Fig. 11).
Figure
10.
Distribution of depth-averaged ft (a), fm (b) and fbm (c) in the Chukchi and the Siberian shelves.
The averaged fm in the water column varied from 10% to 70%, with values being >30% and ≤20% in the Chukchi shelf and the Siberian shelf respectively (Fig. 10b). The highest fm (>60%) appeared near the Bering Strait, confirming that the Pacific inflow stimulated biological production in the Chukchi shelf (Zhuang et al., 2016).
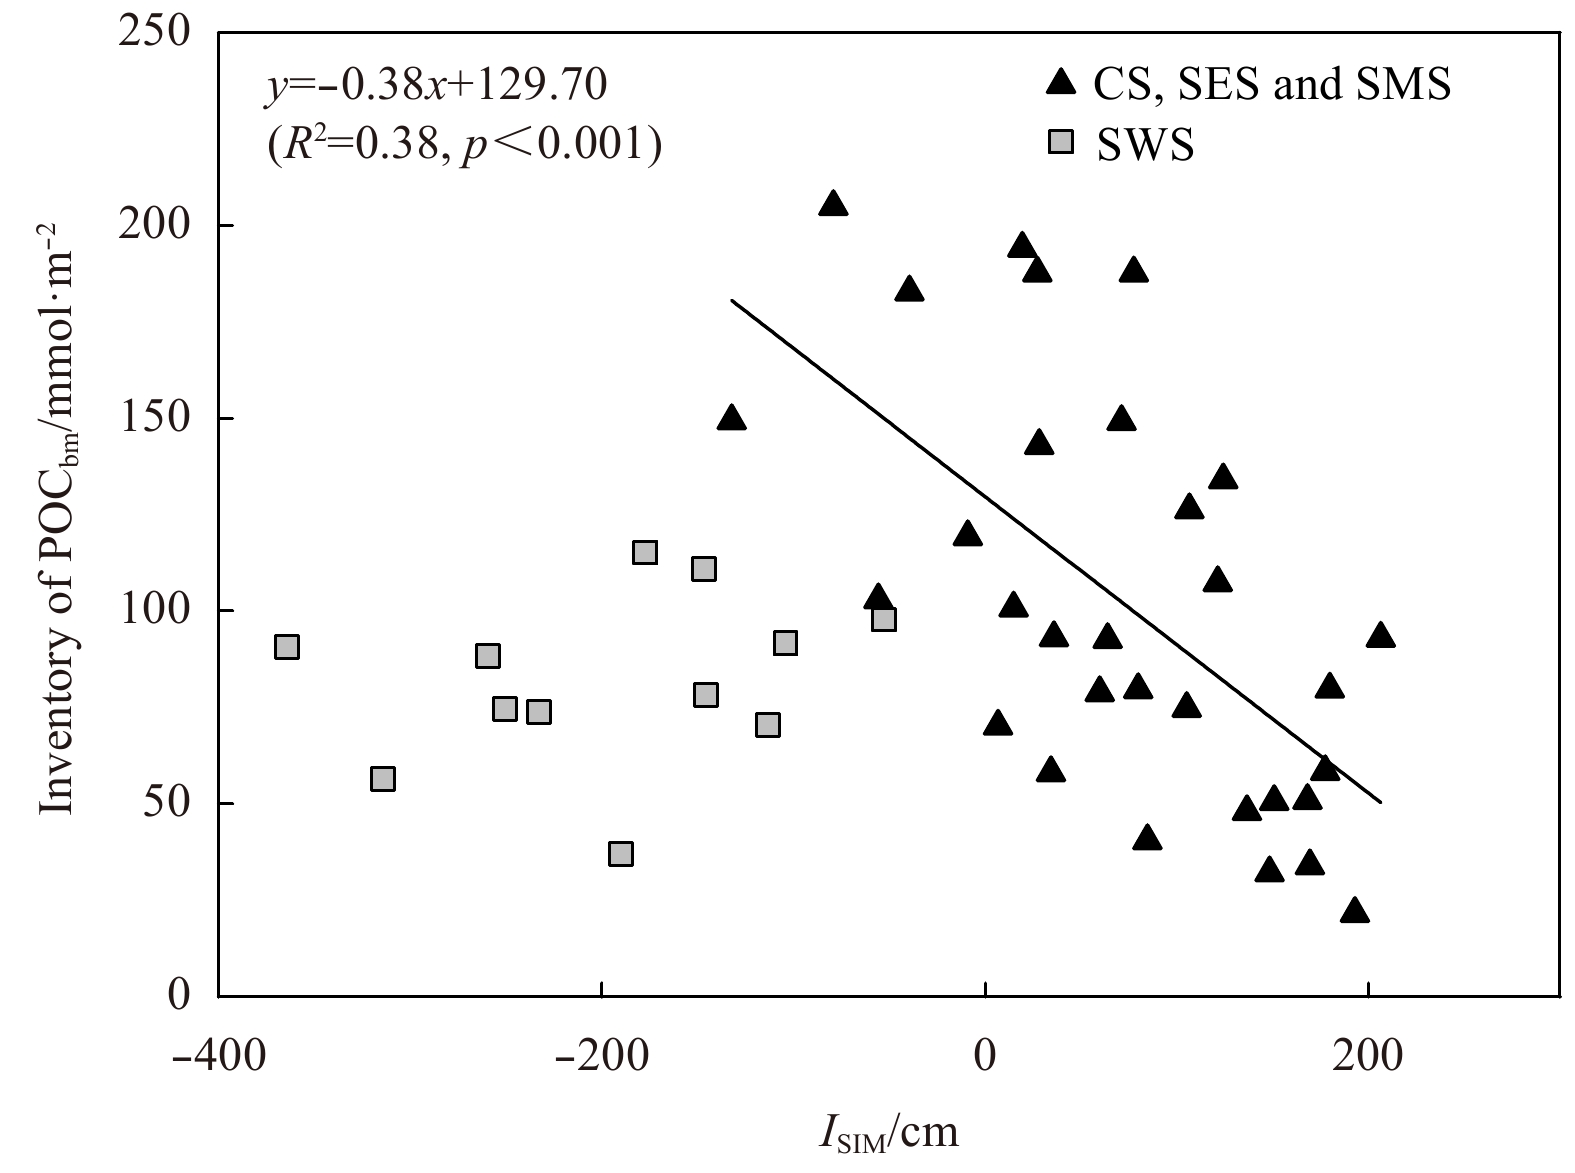
The averaged fbm ranged from 15% to 90% and exhibited a radial decrease around the SES (Fig. 10c). The particularly high fbm value (>60%) in the SES indicated that the POM was dominated by bloom-produced organic matter, which was consistent with the early bloom of phytoplankton in the polynya. The fbm value was higher than the fm value in most of the Chukchi and the Siberian shelves, which emphasizes the role of small phytoplankton in the ecosystem. With the exception of the SWS, the spatial variation of fbm in other regions was mirrored to that of sea ice meltwater inventory with the highest fbm and the lowest ISIM in the polynya region (Figs 8 and 10c). The inventory of bloom-produced POC (POCbm) in the water column, calculated by depth integration (excluding the bottom samples affected by sediment resuspension as shown in Figs 5e and f), was inversely correlated to the inventory of sea ice meltwater in the CS, SES and SMS (Fig. 12). This relationship suggested that the early bloom of phytoplankton benefits from the loss of sea ice. The loss of sea ice will increase irradiance in the waters, thus promotes the early bloom of phytoplankton shortly after the end of polar night (Hsiao, 1992; Tremblay et al., 2002). Since utilization efficiency of light by small phytoplankton (small chloroplast in cell) is higher than that of large phytoplankton (large chloroplast in cell) (Taguchi, 1976; Pesant et al., 1996), the early bloom was dominated by small phytoplankton, which leads to the low C/N ratio and high δ15NPN, and thus the high fbm in our study areas. The reasons that the POM signals generated by the early bloom of small phytoplankton persist until summer may have two aspects, one is the high buoyancy of diatoms (Pesant et al., 1996), which are dominate species in the Arctic polynyas (Pesant et al., 1996; Lewis et al., 1996; Oxtoby et al., 2016), and the other is the weak hydrodynamic conditions. The SES is a typical region where water exchange is limited by the Pacific inflow in the east and the Siberian Coastal Current in the west (Fig. 1). The data from the SWS fell below the fitted line of POCbm and ISIM in Fig. 12, probably due to the nutrient deficiencies that limit primary production.
Figure
12.
Relationship between POCbm inventory and ISIM in the Chukchi and Siberian shelves.
The POM in the Chukchi Sea and the East Siberian Sea was generally characterized by low C/N ratio, low δ13C and high δ15N in summer. A positive relationship between δ13C and δ15N in the basins and a negative one in the Chukchi and Siberian shelves were observed, which indicated that the POC and PN are different in sources, turnover rates, and cycling pathways. The low δ13C values and a positive correlation between δ13C and δ15N in the basins are due to high dissolved concentration of CO2 and slow growth rate of phytoplankton, while the low C/N ratios, the low δ13C values, the high δ15N values and a negative correlation between δ13C and δ15N in the shelves are attributed to the early bloom of small phytoplankton in the polynya. The contributions of terrestrial, bloom-produced and non-bloom biogenic components in bulk POM were estimated by the mass balance of C/N ratio and δ13C value. The terrestrial POM in the SWS accounted for more than 30% of the bulk POM, and was reduced to less than 20% in the CS and the SES, indicating that the POM in the SWS is greatly affected by terrestrial source, while that in the CS and the SES is dominated by biological source. The non-bloom biogenic POM occupied more than 60% near the Bering Strait and less than 20% in the Siberian Sea. The bloom-produced POM was the most abundant component in bulk POM, with the highest fraction (>70%) in the Wrangel polynya and about 40% in most of the Chukchi and the Siberian shelves. A negative relationship was observed between the inventory of bloom-produced POM and the inventory of sea ice meltwater in the CS, SES and the SMS, indicating the early bloom of small phytoplankton benefits from the loss of sea ice in the polynya. Our results demonstrate that phytoplankton blooms in spring or early summer may have residual effects on summer ecosystem. It is necessary to have a deeper understanding of seasonal variations in the Arctic Ocean in future.
Acknowledgements
We thank Xiaoyu Wang for generously providing temperature, salinity and Chl a data in the LV-77 Cruise.
Aagaard K, Carmack E C. 1989. The role of sea ice and other fresh water in the Arctic circulation. Journal of Geophysical Research: Oceans, 94(C10): 14485–14498. doi: 10.1029/JC094iC10p14485
[2]
Alkire M B, Morison J, Andersen R. 2015. Variability in the meteoric water, sea-ice melt, and Pacific water contributions to the central Arctic Ocean, 2000−2014. Journal of Geophysical Research: Oceans, 120(3): 1573–1598. doi: 10.1002/2014JC010023
[3]
Ambrose W G, Renaud P E. 1995. Benthic response to water column productivity patterns: Evidence for benthic−pelagic coupling in the Northeast Water Polynya. Journal of Geophysical Research: Oceans, 100(C3): 4411–4421. doi: 10.1029/94JC01982
[4]
Anderson L G, Björk G, Jutterström S, et al. 2011. East Siberian Sea, an Arctic region of very high biogeochemical activity. Biogeosciences, 8(6): 1745–1754. doi: 10.5194/bg-8-1745-2011
[5]
Ardyna M, Babin M, Devred E, et al. 2017. Shelf−basin gradients shape ecological phytoplankton niches and community composition in the coastal Arctic Ocean (Beaufort Sea). Limnology and Oceanography, 62(5): 2113–2132. doi: 10.1002/lno.10554
[6]
Arrigo K R. 2007. Physical control of primary productivity in Arctic and Antarctic polynyas. In: Smith W O, Barber D G, eds. Polynyas: Windows to the World. Elsevier Oceanography Series, 74: 223–238
[7]
Arrigo K R, Perovich D K, Pickart R S, et al. 2012. Massive phytoplankton blooms under Arctic sea ice. Science, 336(6087): 1408. doi: 10.1126/science.1215065
[8]
Arrigo K R, Perovich D K, Pickart R S, et al. 2014. Phytoplankton blooms beneath the sea ice in the Chukchi Sea. Deep Sea Research Part II: Topical Studies in Oceanography, 105: 1–16. doi: 10.1016/j.dsr2.2014.03.018
[9]
Arrigo K R, van Dijken G L. 2004. Annual changes in sea-ice, chlorophyll a, and primary production in the Ross Sea, Antarctica. Deep Sea Research Part II: Topical Studies in Oceanography, 51(1–3): 117–138
[10]
Arrigo K R, van Dijken G L. 2011. Secular trends in Arctic Ocean net primary production. Journal of Geophysical Research, 116(C9): C09011
[11]
Barber D G, Massom R A. 2007. The role of sea ice in Arctic and Antarctic polynyas. In: Smith W O, Barber D G, eds. Polynyas: Windows to the World. Elsevier Oceanography Series, 74: 1–54
[12]
Bhavya P S, Lee J H, Lee H W, et al. 2018. First in situ estimations of small phytoplankton carbon and nitrogen uptake rates in the Kara, Laptev, and East Siberian seas. Biogeosciences, 15(18): 5503–5517. doi: 10.5194/bg-15-5503-2018
[13]
Booth B C, Horner R A. 1997. Microalgae on the Arctic Ocean section, 1994: species abundance and biomass. Deep Sea Research Part II: Topical Studies in Oceanography, 44(8): 1607–1622. doi: 10.1016/S0967-0645(97)00057-X
[14]
Buchwald C. 2013. Nitrogen cycling in oxygen deficient zones: insights from δ15N and δ18O of nitrite and nitrate [dissertation]. Boston: Massachusetts Institute of Technology
[15]
Burkhardt S, Riebesell U, Zondervan I. 1999. Effects of growth rate, CO2 concentration, and cell size on the stable carbon isotope fractionation in marine phytoplankton. Geochimica et Cosmochimica Acta, 63(22): 3729–3741. doi: 10.1016/S0016-7037(99)00217-3
[16]
Chalup M S, Laws E A. 1990. A test of the assumptions and predictions of recent microalgal growth models with the marine phytoplankter Pavlova lutheri. Limnology and Oceanography, 35(3): 583–596. doi: 10.4319/lo.1990.35.3.0583
[17]
Cooper L W, Benner R, McClelland J W, et al. 2005. Linkages among runoff, dissolved organic carbon, and the stable oxygen isotope composition of seawater and other water mass indicators in the Arctic Ocean. Journal of Geophysical Research-Biogeosciences, 110: G02013
[18]
Copin-Montegut C, Copin-Montegut G. 1983. Stoichiometry of carbon, nitrogen, and phosphorus in marine particulate matter. Deep Sea Research Part A. Oceanographic Research Papers, 30(1): 31–46. doi: 10.1016/0198-0149(83)90031-6
[19]
Coupel P, Matsuoka A, Ruiz-Pino D, et al. 2015. Pigment signatures of phytoplankton communities in the Beaufort Sea. Biogeosciences, 12(4): 991–1006. doi: 10.5194/bg-12-991-2015
[20]
Crawford D W, Wyatt S N, Wrohan I A, et al. 2015. Low particulate carbon to nitrogen ratios in marine surface waters of the Arctic. Global Biogeochemical Cycles, 29(12): 2021–2033. doi: 10.1002/2015GB005200
[21]
Cronin G, Lodge D M. 2003. Effects of light and nutrient availability on the growth, allocation, carbon/nitrogen balance, phenolic chemistry, and resistance to herbivory of two freshwater macrophytes. Oecologia, 137(1): 32–41. doi: 10.1007/s00442-003-1315-3
[22]
Déry S J, Hernández-Henríquez M A, Burford J E, et al. 2009. Observational evidence of an intensifying hydrological cycle in northern Canada. Geophysical Research Letters, 36(13): L13402. doi: 10.1029/2009GL038852
[23]
Descolas-Gros C, Fontugne M R. 1985. Carbon fixation in marine phytoplankton: carboxylase activities and stable carbon-isotope ratios; physiological and paleoclimatological aspects. Marine Biology, 87(1): 1–6. doi: 10.1007/BF00396999
[24]
Devol A H, Codispoti L A, Christensen J P. 1997. Summer and winter denitrification rates in western Arctic shelf sediments. Continental Shelf Research, 17(9): 1029–1033. doi: 10.1016/S0278-4343(97)00003-4
[25]
Ehleringer J R, Cerling T E, Helliker B R. 1997. C4 photosynthesis, atmospheric CO2, and climate. Oecologia, 112(3): 285–299. doi: 10.1007/s004420050311
[26]
Frank M. 1996. Spurenstoffuntersuchungen zur Zirkulation im Eurasischen Becken des Nordpolarmeeres [dissertation]. Heidelberg: Ruprecht Karls Universität
[27]
Goericke R, Fry B. 1994. Variations of marine plankton δ13C with latitude, temperature, and dissolved CO2 in the world ocean. Global Biogeochemical Cycles, 8(1): 85–90. doi: 10.1029/93GB03272
[28]
Gordeev V V, Martin J M, Sidorov I S, et al. 1996. A reassessment of the Eurasian river input of water, sediment, major elements, and nutrients to the Arctic Ocean. American Journal of Science, 296(6): 664–691. doi: 10.2475/ajs.296.6.664
[29]
Gosselin M, Levasseur M, Wheeler P A, et al. 1997. New measurements of phytoplankton and ice algal production in the Arctic Ocean. Deep Sea Research Part II: Topical Studies in Oceanography, 44(8): 1623–1625. doi: 10.1016/S0967-0645(97)00054-4
[30]
Granger J, Sigman D M, Lehmann M F, et al. 2008. Nitrogen and oxygen isotope fractionation during dissimilatory nitrate reduction by denitrifying bacteria. Limnology and Oceanography, 53(6): 2533–2545. doi: 10.4319/lo.2008.53.6.2533
[31]
Guo Laodong, Cai Yihua, Belzile C, et al. 2012. Sources and export fluxes of inorganic and organic carbon and nutrient species from the seasonally ice-covered Yukon River. Biogeochemistry, 107(1–3): 187–206
[32]
Guo Laodong, Macdonald R W. 2006. Source and transport of terrigenous organic matter in the upper Yukon River: Evidence from isotope (δ13C, δ14C, and δ15N) composition of dissolved, colloidal, and particulate phases. Global Biogeochemical Cycles, 20(2): GB2011
[33]
He Jianfeng, Zhang Fang, Lin Ling, et al. 2012. Bacterioplankton and picophytoplankton abundance, biomass, and distribution in the Western Canada Basin during summer 2008. Deep Sea Research Part II: Topical Studies in Oceanography, 81−84: 36–45
[34]
Hoppema M, Anderson L G. 2007. Biogeochemistry of polynyas and their role in sequestration of anthropogenic constituents. In: Smith W O, Barber D G, eds. Polynyas: Windows to the World. Elsevier Oceanography Series, 74: 193–221
[35]
Hsiao S I C. 1992. Dynamics of ice algae and phytoplankton in Frobisher Bay. Polar Biology, 12(6): 645–651
[36]
Klein B, LeBlanc B, Mei Zhiping, et al. 2002. Phytoplankton biomass, production and potential export in the North Water. Deep Sea Research Part II: Topical Studies in Oceanography, 49(22–23): 4983–5002
[37]
Kling G W, Fry B, O’Brien W J. 1992. Stable isotopes and planktonic trophic structure in arctic lakes. Ecology, 73(2): 561–566. doi: 10.2307/1940762
[38]
Körtzinger A, Koeve W, Kähler W, et al. 2001. C:N ratios in the mixed layer during the productive season in the northeast Atlantic Ocean. Deep Sea Research Part I: Oceanographic Research Papers, 48(3): 661–688. doi: 10.1016/S0967-0637(00)00051-0
[39]
Kuliński K, Kędra M, Legeżyńska J, et al. 2014. Particulate organic matter sinks and sources in high Arctic fjord. Journal of Marine Systems, 139: 27–37. doi: 10.1016/j.jmarsys.2014.04.018
[40]
Kumar V, Tiwari M, Nagoji S, et al. 2016. Evidence of anomalously low δ13C of marine organic matter in an Arctic fjord. Scientific Reports, 6(1): 36192. doi: 10.1038/srep36192
[41]
Landrum J P, Altabet M A, Montoya J P. 2011. Basin-scale distributions of stable nitrogen isotopes in the subtropical North Atlantic Ocean: Contribution of diazotroph nitrogen to particulate organic matter and mesozooplankton. Deep Sea Research Part I: Oceanographic Research Papers, 58(5): 615–625. doi: 10.1016/j.dsr.2011.01.012
[42]
Lehmann M F, Bernasconi S M, Barbieri A, et al. 2002. Preservation of organic matter and alteration of its carbon and nitrogen isotope composition during simulated and in situ early sedimentary diagenesis. Geochimica et Cosmochimica Acta, 66(20): 3573–3584. doi: 10.1016/S0016-7037(02)00968-7
[43]
Lewis E L, Ponton D, Legendre L, et al. 1996. Springtime sensible heat, nutrients and phytoplankton in the Northwater Polynya, Canadian Arctic. Continental Shelf Research, 16(14): 1775–1781. doi: 10.1016/0278-4343(96)00015-5
[44]
Li Qi, Chen Min, Jia Renming, et al. 2017. Transit time of river water in the Bering and Chukchi Seas estimated from δ18O and radium isotopes. Progress in Oceanography, 159: 115–129. doi: 10.1016/j.pocean.2017.08.004
[45]
Li W K W, McLaughlin F A, Lovejoy C, et al. 2009. Smallest algae thrive as the Arctic Ocean freshens. Science, 326(5952): 539. doi: 10.1126/science.1179798
[46]
Lobbes J M, Fitznar H P, Kattner G. 2000. Biogeochemical characteristics of dissolved and particulate organic matter in Russian rivers entering the Arctic Ocean. Geochimica et Cosmochimica Acta, 64(17): 2973–2983. doi: 10.1016/S0016-7037(00)00409-9
[47]
Macdonald R W, Carmack E C, McLaughlin F A, et al. 1999. Connections among ice, runoff and atmospheric forcing in the Beaufort Gyre. Geophysical Research Letters, 26(15): 2223–2226. doi: 10.1029/1999GL900508
[48]
Macdonald R W, McLaughlin F A, Carmack E C. 2002. Fresh water and its sources during the SHEBA drift in the Canada Basin of the Arctic Ocean. Deep Sea Research Part I, 49(10): 1769–1785. doi: 10.1016/S0967-0637(02)00097-3
[49]
Magen C, Chaillou G, Crowe S A, et al. 2010. Origin and fate of particulate organic matter in the southern Beaufort Sea−Amundsen Gulf region, Canadian Arctic. Estuarine, Coastal and Shelf Science, 86: 31–41. doi: 10.1016/j.ecss.2009.09.009
[50]
Martin S, Drucker R. 1997. The effect of possible Taylor columns on the summer ice retreat in the Chukchi Sea. Journal of Geophysical Research: Oceans, 102(C5): 10473–10482. doi: 10.1029/97JC00145
[51]
Martiny A C, Pham C T A, Primeau F W, et al. 2013a. Strong latitudinal patterns in the elemental ratios of marine plankton and organic matter. Nature Geoscience, 6(4): 279–283. doi: 10.1038/ngeo1757
[52]
Martiny A C, Vrugt J A, Primeau F W, et al. 2013b. Regional variation in the particulate organic carbon to nitrogen ratio in the surface ocean. Global Biogeochemical Cycles, 27(3): 723–731. doi: 10.1002/gbc.20061
[53]
McClelland J W, Déry S J, Peterson B J, et al. 2006. A pan-arctic evaluation of changes in river discharge during the latter half of the 20th century. Geophysical Research Letters, 33(6): L06715
[54]
McClelland J W, Holmes R M, Peterson B J, et al. 2008. Development of a pan-Arctic database for river chemistry. EOS, Transactions American Geophysical Union, 89(24): 217–218
[55]
McClelland J W, Holmes R M, Peterson B J, et al. 2016. Particulate organic carbon and nitrogen export from major Arctic rivers. Global Biogeochemical Cycles, 30(5): 629–643. doi: 10.1002/2015GB005351
[56]
McLaughlin F A, Carmack E C. 2010. Deepening of the nutricline and chlorophyll maximum in the Canada Basin interior, 2003−2009. Geophysical Research Letters, 37(24): L24602
[57]
Montoya J P, McCarthy J J. 1995. Isotopic fractionation during nitrate uptake by phytoplankton grown in continuous culture. Journal of Plankton Research, 17(3): 439–464. doi: 10.1093/plankt/17.3.439
[58]
Moore G W K, Pickart R S. 2012. The Wrangel Island Polynya in early summer: Trends and relationships to other polynyas and the Beaufort Sea High. Geophysical Research Letters, 39(5): L05503
[59]
Naidu A S, Cooper L W, Finney B P, et al. 2000. Organic carbon isotope ratios (δ13C) of Arctic Amerasian continental shelf sediments. International Journal of Earth Sciences, 89(3): 522–532. doi: 10.1007/s005310000121
[60]
Needoba J A, Waser N A, Harrison P J, et al. 2003. Nitrogen isotope fractionation in 12 species of marine phytoplankton during growth on nitrate. Marine Ecology Progress Series, 255: 81–91. doi: 10.3354/meps255081
[61]
Nitishinsky M, Anderson L G, Hölemann J A. 2007. Inorganic carbon and nutrient fluxes on the Arctic Shelf. Continental Shelf Research, 27(10–11): 1584–1599
[62]
Östlund H G, Hut G. 1984. Arctic Ocean water mass balance from isotope data. Journal of Geophysical Research, 89: 6373–6381. doi: 10.1029/JC089iC04p06373
[63]
Oxtoby L E, Mathis J T, Juranek L W, et al. 2016. Estimating stable carbon isotope values of microphytobenthos in the Arctic for application to food web studies. Polar Biology, 39(3): 473–483. doi: 10.1007/s00300-015-1800-2
[64]
Pesant S, Legendre L, Gosselin M, et al. 1996. Size-differential regimes of phytoplankton production in the Northeast Water Polynya (77°–81°N). Marine Ecology Progress Series, 142: 75–86. doi: 10.3354/meps142075
[65]
Pickart R S, Pratt L J, Torres D J, et al. 2010. Evolution and dynamics of the flow through Herald Canyon in the western Chukchi Sea. Deep Sea Research Part II: Topical Studies in Oceanography, 57(1–2): 5–26
[66]
Pineault S, Tremblay J É, Gosselin M, et al. 2013. The isotopic signature of particulate organic C and N in bottom ice: Key influencing factors and applications for tracing the fate of ice-algae in the Arctic Ocean. Journal of Geophysical Research: Oceans, 118(1): 287–300. doi: 10.1029/2012JC008331
[67]
Qi Di, Chen Liqi, Chen Baoshan, et al. 2017. Increase in acidifying water in the western Arctic Ocean. Nature Climate Change, 7(3): 195–199. doi: 10.1038/nclimate3228
[68]
Rawlins M A, Steele M, Holland M M, et al. 2010. Analysis of the Arctic system for freshwater cycle intensification: Observations and expectations. Journal of Climate, 23(21): 5715–5737. doi: 10.1175/2010JCLI3421.1
[69]
Redfield A C. 1958. The biological control of chemical factors in the environment. American Scientist, 46: 205–221
[70]
Semiletov I, Dudarev O, Luchin V, et al. 2005. The East Siberian Sea as a transition zone between Pacific-derived waters and Arctic shelf waters. Geophysical Research Letters, 32(10): L10614. doi: 10.1029/2005GL022490
[71]
Semiletov I, Pipko I, Gustafsson Ö, et al. 2016. Acidification of East Siberian Arctic Shelf waters through addition of freshwater and terrestrial carbon. Nature Geoscience, 9(5): 361–365. doi: 10.1038/ngeo2695
[72]
Skrzypek G, Ford D. 2014. Stable isotope analysis of saline water samples on a cavity ring-down spectroscopy instrument. Environmental Science and Technology, 48(5): 2827–2834. doi: 10.1021/es4049412
[73]
Stringer W J, Groves J E. 1991. Location and areal extent of polynyas in the Bering and Chukchi Seas. Arctic, 44(S1): 164–171
[74]
Tagliabue A, Bopp L. 2008. Towards understanding global variability in ocean carbon-13. Global Biogeochemical Cycles, 22(1): GB1025
[75]
Taguchi S. 1976. Relationship between photosynthesis and cell size of marine diatoms. Journal of Phycology, 12(2): 185–189
[76]
Takahashi T, Broecker W S, Langer S. 1985. Redfield ratio based on chemical data from isopycnal surfaces. Journal of Geophysical Research: Oceans, 90(C4): 6907–6924. doi: 10.1029/JC090iC04p06907
[77]
Talley L D, Pickard G L, Emery W J, et al. 2011. Descriptive Physical Oceanography: An Introduction. 6th ed. Boston: Elsevier, 1–560
[78]
Tank S E, Raymond P A, Striegl R G, et al. 2012. A land-to-ocean perspective on the magnitude, source and implication of DIC flux from major Arctic rivers to the Arctic Ocean. Global Biochemical Cycles, 26(4): GB4018
[79]
Tremblay J E, Gratton Y, Fauchot J, et al. 2002. Climatic and oceanic forcing of new, net, and diatom production in the North Water. Deep Sea Research Part II: Topical Studies in Oceanography, 49(22−23): 4927–4946
[80]
Tremblay J É, Michel C, Hobson K A, et al. 2006. Bloom dynamics in early opening waters of the Arctic Ocean. Limnology and Oceanography, 51(2): 900–912. doi: 10.4319/lo.2006.51.2.0900
[81]
Vonk J E, Sánchez-García L, Semiletov I, et al. 2010. Molecular and radiocarbon constraints on sources and degradation of terrestrial organic carbon along the Kolyma paleoriver transect, East Siberian Sea. Biogeosciences, 7(10): 3153–3166. doi: 10.5194/bg-7-3153-2010
[82]
Vrede K, Heldal M, Norland S, et al. 2002. Elemental composition (C, N, P) and cell volume of exponentially growing and nutrient-limited bacterioplankton. Applied and Environmental Microbiology, 68(6): 2965–2971. doi: 10.1128/AEM.68.6.2965-2971.2002
[83]
Weingartner T, Aagaard K, Woodgate R, et al. 2005. Circulation on the north central Chukchi Sea shelf. Deep Sea Research Part II: Topical Studies in Oceanography, 52(24−26): 3150–3174
[84]
Woodgate R A, Aagaard K, Weingartner T J. 2005. A year in the physical oceanography of the Chukchi Sea: Moored measurements from autumn 1990–1991. Deep Sea Research Part II: Topical Studies in Oceanography, 52(24−26): 3116–3149
[85]
Yun M S, Chung K H, Zimmermann S, et al. 2012. Phytoplankton productivity and its response to higher light levels in the Canada Basin. Polar Biology, 35(2): 257–268. doi: 10.1007/s00300-011-1070-6
[86]
Yun M S, Kim B K, Joo H T, et al. 2015. Regional productivity of phytoplankton in the western Arctic Ocean during summer in 2010. Deep Sea Research Part II: Topical Studies in Oceanography, 120: 61–71. doi: 10.1016/j.dsr2.2014.11.023
[87]
Zhang Run, Chen Min, Guo Laodong, et al. 2012. Variations in the isotopic composition of particulate organic carbon and their relation with carbon dynamics in the western Arctic Ocean. Deep Sea Research Part II: Topical Studies in Oceanography, 81(81–84): 72–78
[88]
Zhuang Yanpei, Jin Haiyan, Li Hongliang, et al. 2016. Pacific inflow control on phytoplankton community in the Eastern Chukchi Shelf during summer. Continental Shelf Research, 129: 23–32. doi: 10.1016/j.csr.2016.09.010
Table
2.
The characteristic δ13C and C/N ratio of three endmembers used to calculate the contribution of terrestrial, bloom-produced and non-bloom biogenic POM in the Chukchi and the Siberian shelves
Notes: 1) Terrestrial POM: The reported δ13C value of terrestrial POM ranged from −22‰ to −30‰ with an average of −27‰ (Ehleringer et al., 1997) and its C/N ratio was higher than 12 (Lobbes et al., 2000; Guo et al., 2012; McClelland et al., 2016). The riverine POM dominated the source of terrestrial POM in the CS and the SES, while coastal erosion contributed nearly 60% to terrestrial POM in the SWS (Vonk et al., 2010). The weighted average of erosion-derived δ13CPOC was determined to be −27.5‰ in the SWS (McClelland et al., 2008; Vonk et al., 2010). Similar to the erosion-derived POM, the δ13CPOC value of riverine POM from the Russian rivers and the Yukon river was −25.6‰ to –27.4‰ (Lobbes et al., 2000) and about −26.2‰ respectively (Guo and Macdonald, 2006). In this study, the δ13C endmember value of terrestrial POM was assessed to be −27.5‰ ±0.5‰. As for the C/N ratio of terrestial POM, the reported value varied greatly, with around 12 in the Russian rivers (Lobbes et al., 2000) and from 14 to 40 in the Yukon River (Guo and Macdonald, 2006; Guo et al., 2012). Considering that the Russian rivers play a dominate role in our study areas, a value of 13±1 was adopted as the endmember C/N ratio. 2) Non-bloom biogenic POM: The δ13C value of biogenic POM ranged from −10‰ to −31‰ with an average of −20‰, and most of which was constrained between −17‰ to −22‰ (Descolas-Gros and Fontugne, 1985; Semiletov et al., 2005; Vonk et al., 2010). In the Arctic Ocean, the δ13C values of POM exhibit a wide range and vary from −16.7‰ to −30.4‰ (Goericke and Fry, 1994). In the Chukchi shelf, dissolved CO2 concentration is less than 20 μmol/L (Zhang et al., 2012), which corresponds to an isotope fractionation factor (εp) of 17‰ predicted by the Henry’s Law (Goericke and Fry, 1994). The highest value of δ13CPOC in the Chukchi and the Siberian shelves is −17.5‰ in this study. Obviously, the measured, the reported and the calculated δ13C values (by εp) in Arctic shelves are consistent, which supports the use of −17‰±1‰ as the δ13C endmember of non-bloom biogenic POM. The average C/N ratio of marine organic matter was 5.6 (Copin-Montegut and Copin-Montegut, 1983), and that in high-latitude cold waters was 6.0 (Martiny et al., 2013b). Here, the endmember C/N ratio of non-bloom biogenic POM was assessed to be 5.5±0.5. 3) Bloom-produced POM: The reported δ13C value of POM during phytoplankton bloom was as low as −24.5‰ to −31‰, which is significantly lower than those predicted by εp (Pineault et al., 2013; Kuliński et al., 2014; Kumar et al., 2016). The low δ13C value may be related to the high εp for small phytoplankton. For example, the εp of P. tricornutum is higher than 25‰ (Burkhardt et al., 1999). The lowest value of δ13CPOC measured in the Chukchi Sea and the Siberian Sea in this study was −29.5‰. Considering the contribution of 13C-depleted POM from the early bloom and the low δ13CPOC values measured, a value of −30‰±1‰ was adopted as the δ13CPOC endmember of bloom-produced POM. The C/N ratio of biogenic POM was as low as 2 to 4 in the Chukchi Sea and the Canada Basin (Crawford et al., 2015). The C/N ratio in the SES ranged from 2 to 5 in this study (Fig. 5f). The cellular C/N ratio of small diatoms (volume<300 μm3) was reported to be in a range of 2.8 to 3.8 (Taguchi, 1976). Therefore, a value of 3±1 was adopted as the C/N ratio endmember.
Notes: 1) Terrestrial POM: The reported δ13C value of terrestrial POM ranged from −22‰ to −30‰ with an average of −27‰ (Ehleringer et al., 1997) and its C/N ratio was higher than 12 (Lobbes et al., 2000; Guo et al., 2012; McClelland et al., 2016). The riverine POM dominated the source of terrestrial POM in the CS and the SES, while coastal erosion contributed nearly 60% to terrestrial POM in the SWS (Vonk et al., 2010). The weighted average of erosion-derived δ13CPOC was determined to be −27.5‰ in the SWS (McClelland et al., 2008; Vonk et al., 2010). Similar to the erosion-derived POM, the δ13CPOC value of riverine POM from the Russian rivers and the Yukon river was −25.6‰ to –27.4‰ (Lobbes et al., 2000) and about −26.2‰ respectively (Guo and Macdonald, 2006). In this study, the δ13C endmember value of terrestrial POM was assessed to be −27.5‰ ±0.5‰. As for the C/N ratio of terrestial POM, the reported value varied greatly, with around 12 in the Russian rivers (Lobbes et al., 2000) and from 14 to 40 in the Yukon River (Guo and Macdonald, 2006; Guo et al., 2012). Considering that the Russian rivers play a dominate role in our study areas, a value of 13±1 was adopted as the endmember C/N ratio. 2) Non-bloom biogenic POM: The δ13C value of biogenic POM ranged from −10‰ to −31‰ with an average of −20‰, and most of which was constrained between −17‰ to −22‰ (Descolas-Gros and Fontugne, 1985; Semiletov et al., 2005; Vonk et al., 2010). In the Arctic Ocean, the δ13C values of POM exhibit a wide range and vary from −16.7‰ to −30.4‰ (Goericke and Fry, 1994). In the Chukchi shelf, dissolved CO2 concentration is less than 20 μmol/L (Zhang et al., 2012), which corresponds to an isotope fractionation factor (εp) of 17‰ predicted by the Henry’s Law (Goericke and Fry, 1994). The highest value of δ13CPOC in the Chukchi and the Siberian shelves is −17.5‰ in this study. Obviously, the measured, the reported and the calculated δ13C values (by εp) in Arctic shelves are consistent, which supports the use of −17‰±1‰ as the δ13C endmember of non-bloom biogenic POM. The average C/N ratio of marine organic matter was 5.6 (Copin-Montegut and Copin-Montegut, 1983), and that in high-latitude cold waters was 6.0 (Martiny et al., 2013b). Here, the endmember C/N ratio of non-bloom biogenic POM was assessed to be 5.5±0.5. 3) Bloom-produced POM: The reported δ13C value of POM during phytoplankton bloom was as low as −24.5‰ to −31‰, which is significantly lower than those predicted by εp (Pineault et al., 2013; Kuliński et al., 2014; Kumar et al., 2016). The low δ13C value may be related to the high εp for small phytoplankton. For example, the εp of P. tricornutum is higher than 25‰ (Burkhardt et al., 1999). The lowest value of δ13CPOC measured in the Chukchi Sea and the Siberian Sea in this study was −29.5‰. Considering the contribution of 13C-depleted POM from the early bloom and the low δ13CPOC values measured, a value of −30‰±1‰ was adopted as the δ13CPOC endmember of bloom-produced POM. The C/N ratio of biogenic POM was as low as 2 to 4 in the Chukchi Sea and the Canada Basin (Crawford et al., 2015). The C/N ratio in the SES ranged from 2 to 5 in this study (Fig. 5f). The cellular C/N ratio of small diatoms (volume<300 μm3) was reported to be in a range of 2.8 to 3.8 (Taguchi, 1976). Therefore, a value of 3±1 was adopted as the C/N ratio endmember.
Figure 1. The sampling locations, bathymetry and schematic circulations around the Chukchi Sea and the East Siberian Sea. The sampling locations during the Sino-Russian Joint Scientific Expedition and the 7th Chinese National Arctic Research Expedition were marked in squares and red circles, respectively. The grey squares represent stations where only surface samples have been collected. The bathymetric contours of 50 m, 100 m and 250 m are shown in blue, grey and red lines, respectively. Surface currents are marked with arrows of different colors, including Anadyr Water (AW, red arrows), Bering Shelf Water (BSW, brown arrows), Alaska Coastal Water (ACW, green arrows), Siberian Coastal Current (SCC, blue arrows), Siberian Slope Current (SSC, purple arrows) and Beaufort Gyre (BG, grey arrows). River runoff are marked in yellow arrows, including Lena River, Indigirka River, Kolyma River and Mackenzie River.
Figure 2. The scatter plot of temperature, salinity and δ18O value in the upper 200 m around the Chukchi and East Siberian seas. The color bar shows δ18O values of sample. Samples influenced by the Pacific inflow, the East Siberian Shelf Water and the mixed shelf water are marked in different colored frames.
Figure 3. The scatter plot of C/N ratio and δ13CPOC in the upper 100 m water column around the Chukchi Sea and East Siberian Sea. The color bar shows the δ15N value of sample. The average values of terrestrial and marine POM are marked in grey diamonds and their mixing zone is marked by grey shadow. The black arrow shows the decrease of δ13CPOC and C/N.
Figure 4. Surface distribution of temperature (b, color), salinity (b, contour), δ18O (c), fMW (d), fSIM (e), POC (f), PN (g), C/N ratio (g), δ13C (h) and δ15N (i) around the Chukchi Sea and the East Siberian Sea. The simplified bathymetry is shown in Fig. 4a. Geographic locations marked with abbreviations are Bering Strait (BS), Chukchi shelf (CS), Wrangel Island (WI), Siberian shelf (SS), Makarov Basin (MB), Chukchi Plateau (CP) and Canada Basin (CB). The distribution of salinity and C/N ratio is shown in Figs 4b and g with the white contour respectively. The geographic locations marked in Fig. 4c are Siberian West Shelf (SWS), Siberian Middle Shelf (SMS) and Siberian East Shelf (SES).
Figure 5. The longitudinal distribution of temperature (a, color), salinity (a, contour), δ18O (b), fMW (c), fSIM (d), POC (e), PN (f, color), C/N ratio (f, contour), δ13C (g) and δ15N (h) in the Chukchi and the Siberian shelves. The distribution of salinity and C/N ratio is shown in Figs 5a and f with the white contour respectively. The geographic locations separated by white dashed lines are Siberian West Shelf (SWS), Siberian Middle Shelf (SMS), Siberian East Shelf (SES) and Chukchi Shelf (CS).
Figure 6. The averaged POC and PN (a), fMW (a), δ13C (b) and δ15N (c) in different regions. The solid and dashed lines represent the averaged δ13C and δ15N value of marine POM and terrestrial POM respectively. Regions shown in the x-axis include Siberian West Shelf (SWS), Siberian Middle Shelf (SMS), Siberian East Shelf (SES), Chukchi Shelf (CS), Makarov Basin (MB), Chukchi Plateau (CP) and Canada Basin (CB).
Figure 7. Relationship between δ15N and δ13C of POM in the shelves and the basins. The samples collected from the Makarov Basin (MB), Chukchi Plateau (CP) and Canada Basin (CB) are marked in circles while the samples at depths of 30–50 m at station R14 are marked in black squares. The samples collected from the Siberian East Shelf (SES) and Chukchi Shelf (CS) are marked in grey triangles while the bottom samples from the SES and the CS are marked in black triangles. The dashed and the solid line represent the fitted lines of the basin and the shelf samples respectively.
Figure 8. Distribution of the inventory of sea ice meltwater in the Chukchi and the Siberian shelves.
Figure 9. The scatter plot of C/N ratio and δ13CPOC in the Chukchi and the Siberian shelves. The endmember values of terrestrial, non-bloom biogenic and bloom-produces POM are marked in black diamonds.
Figure 10. Distribution of depth-averaged ft (a), fm (b) and fbm (c) in the Chukchi and the Siberian shelves.
Figure 11. Relationship between the depth-averaged ft and the depth-averaged fMW in the Chukchi and the Siberian shelves.
Figure 12. Relationship between POCbm inventory and ISIM in the Chukchi and Siberian shelves.


 DownLoad:


 DownLoad:


 DownLoad: