
Figure
1.
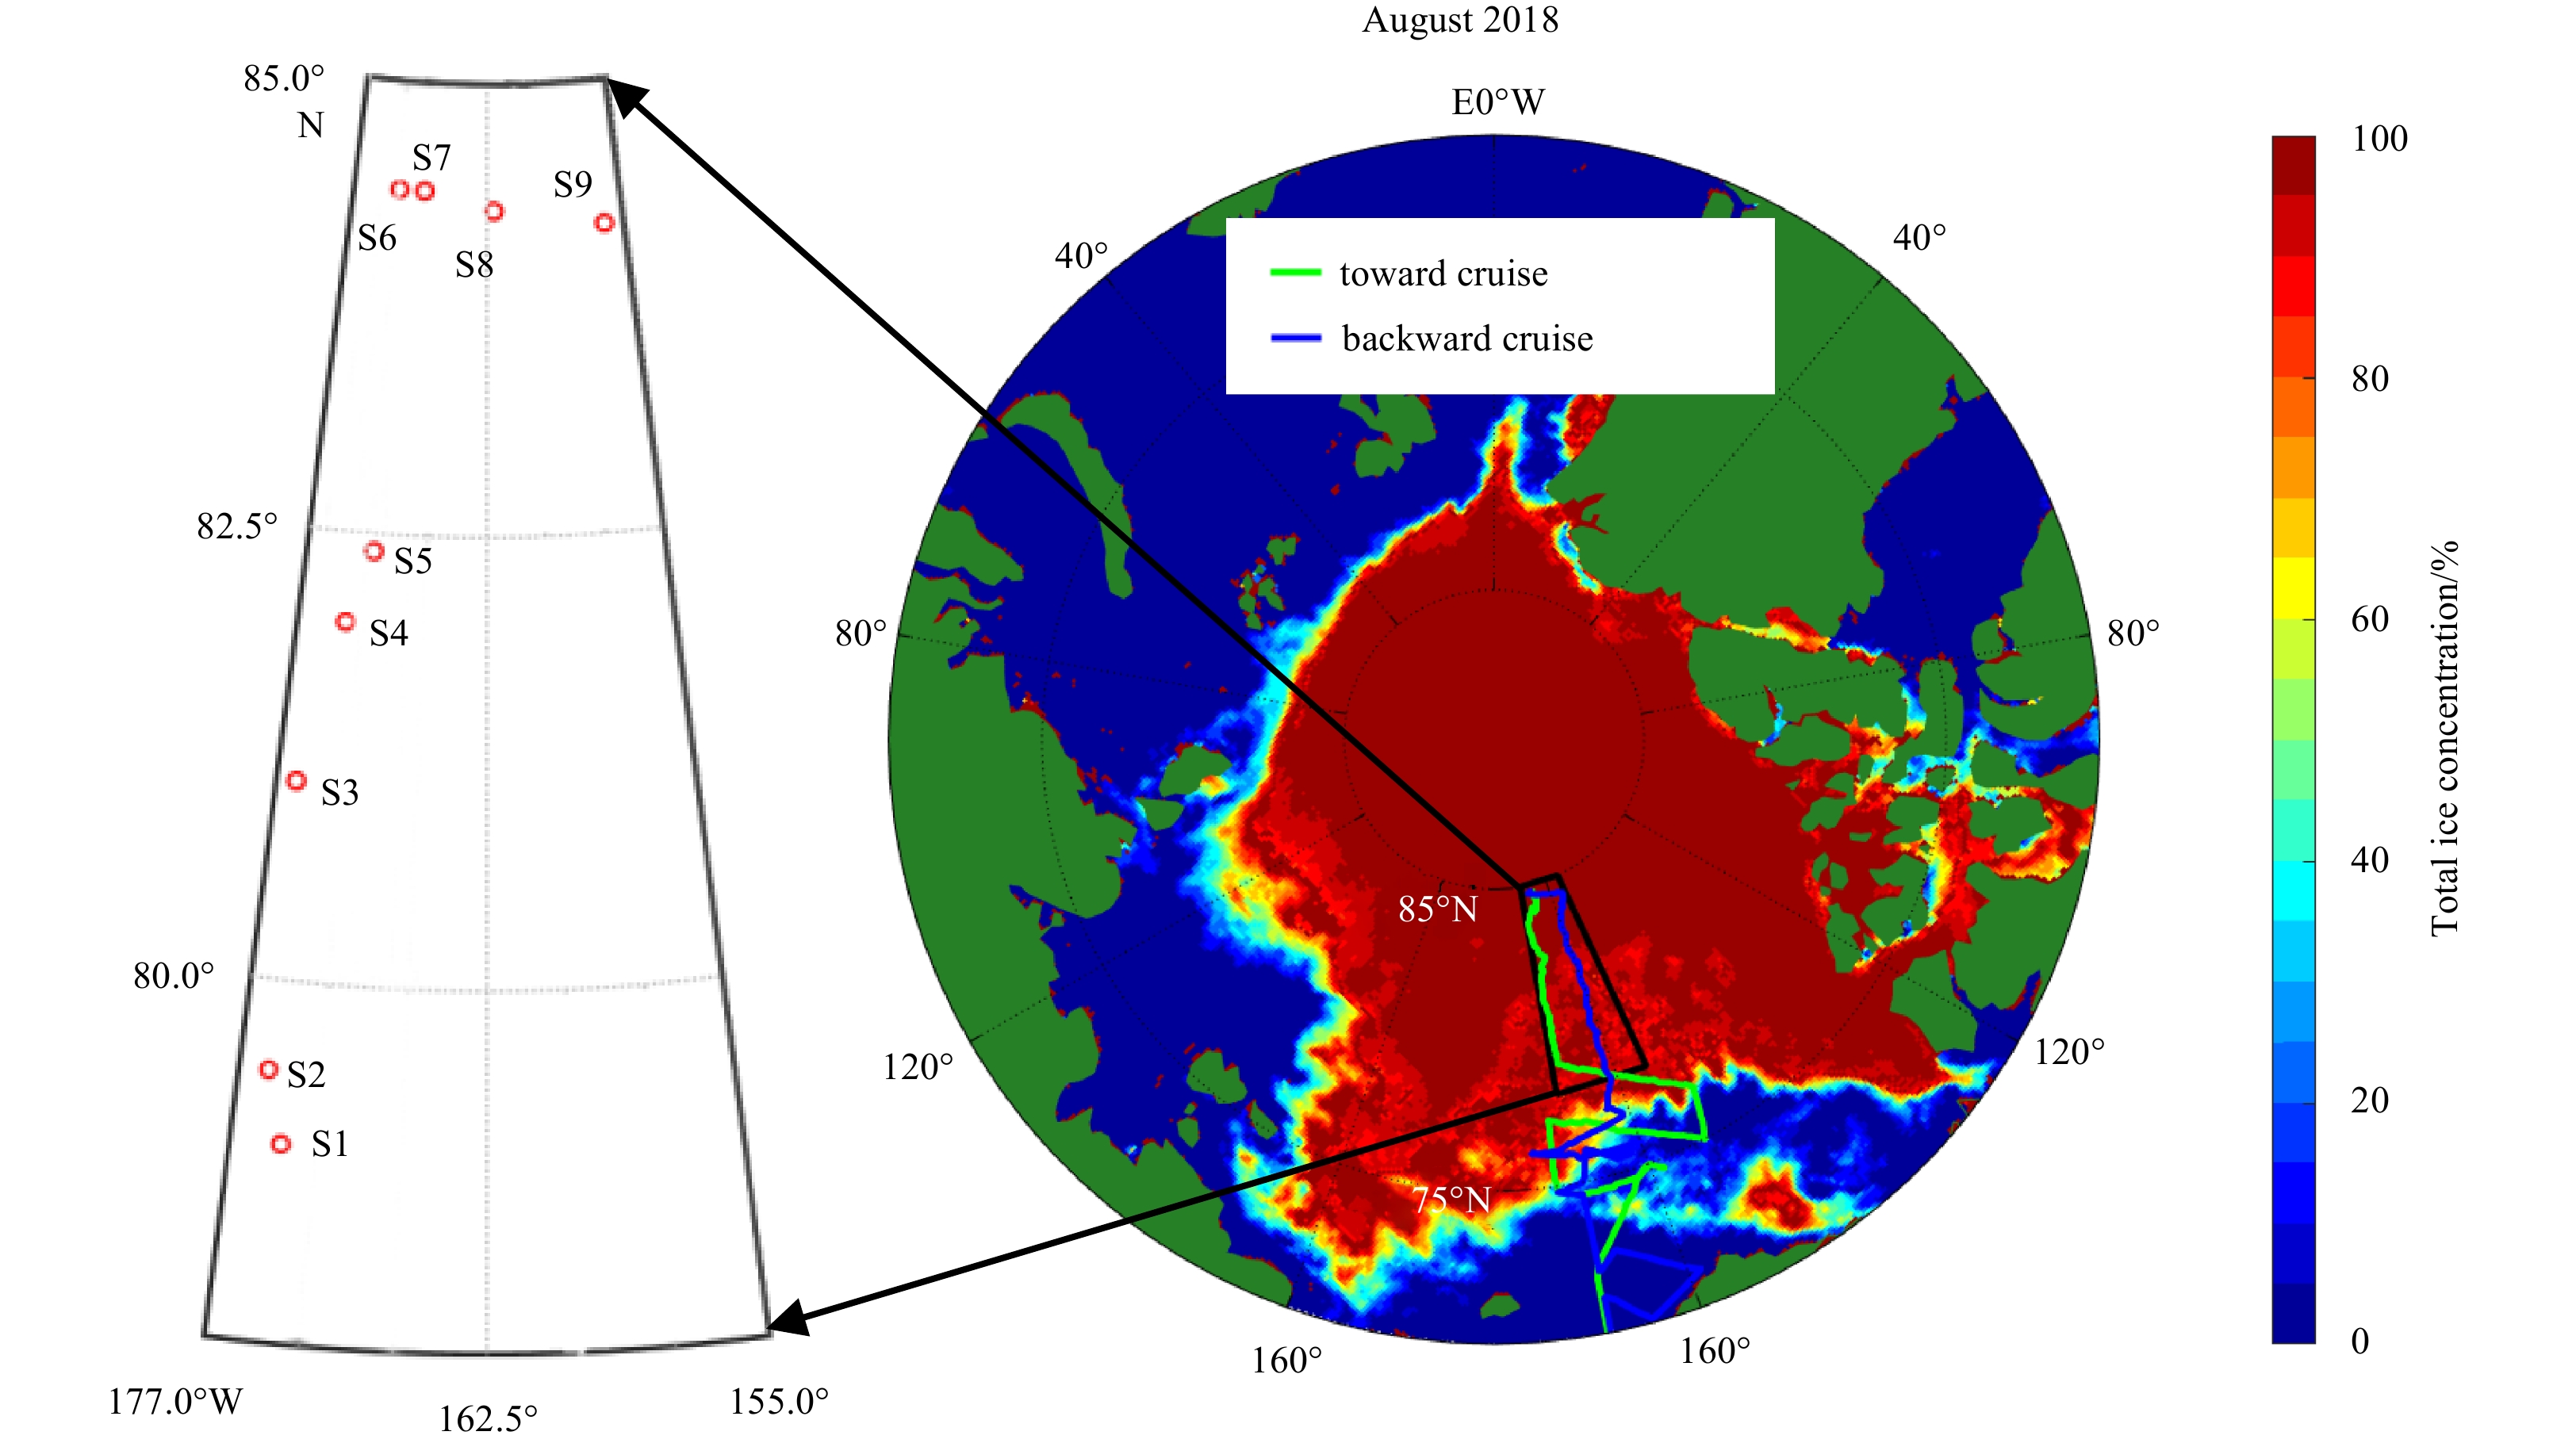
Locations of ice stations, monthly sea ice concentration from AMSR2 data in August 2018 and tracks of the ship.
| Citation: | Xiaowei Cao, Peng Lu, Ruibo Lei, Qingkai Wang, Zhijun Li. Physical and optical characteristics of sea ice in the Pacific Arctic Sector during the summer of 2018[J]. Acta Oceanologica Sinica, 2020, 39(9): 25-37. doi: 10.1007/s13131-020-1645-6

|
Sea ice has been long considered an important factor affecting global systems and an effective climatologic indicator, owing to its sensitivity to climate change (Honda et al., 2009; Huang et al., 2013; Lei et al., 2018; Johannessen et al., 2004). Research has shown that Arctic sea ice has decreased in terms of extent (Comiso et al., 2008; Stroeve et al., 2012), thickness (Cheng et al., 2008; Lindsay and Schweiger, 2015; Renner et al., 2014) and multiyear ice (Comiso, 2012) over the past few decades. In particular for the melting season, the average extent of September Arctic sea ice decreased by 8.76% per decade from 1980 to 2017 (data obtained from the National Snow and Ice Data Center). From 2011 to 2018, the thickness of Arctic sea ice at the end of the melt season has decreased by 2 m, or approximately 66%, relative to that in 1958–1976 (Kwok, 2018).
The reduction in Arctic sea ice cover during summertime reduces the sea ice albedo and leads to more radiation being transmitted to the upper ocean (Perovich et al., 2009). The ice-albedo feedback plays a key role in the mass balance of ice and the Upper Ocean in the Arctic (Maykut and Untersteiner, 1971). This results from the ability of these surfaces to reflect most short-wave irradiance. This ability, along with the rising temperature that warms the snow and ice, causes reduces the albedo, leading to further warming (Curry et al., 2001). In summer, the albedo of sea ice cover depends upon the physical properties at the surface, optical properties of snow and ice, and the properties and distribution of melt ponds (Aoki et al., 2003; Curry et al., 2001; Perovich et al., 2002; Grenfell and Perovich, 1984). The surface of snow exhibits a higher albedo than that of bare ice (Mundy et al., 2007), and the snow optical properties of snow depend on its grain size and shape, depth of the snow layer, and its wetness and impurities in it (Curry et al., 2001). The optical properties of sea ice are determined by its thickness and physical properties (brine, density, and crystal structure) (Lei et al., 2011; Perovich, 1996). Melt ponds exhibit a smaller albedo than bare ice, leading to greater radiation transmitting to the ice, where this is influenced by the depth of the pond and type of underlying ice (Perovich et al., 2009).
In recent years, many investigations have been conducted on the physical properties of ice and snow, and the results have shown that the temperature of Arctic sea ice in summer slowly increases, with salinity less than 4.0 psu (Han et al., 2015; Huang et al., 2013; Wang et al., 2018). Many studies on the optical properties of sea ice have shown that its albedo ranges from 0.5 to 0.9, and is primarily dependent on conditions at the surface (Nicolaus et al., 2012; Lei et al., 2012b; Lu et al., 2018b; Perovich et al., 2009). The melt pond has been a popular object of research in recent years (Lu et al., 2016; Polashenski et al., 2012; Webster et al., 2015). Research has shown that the depth of the melt pond is less than 70 cm (Morassutti and Ledrew, 1996), its size varies from 1 m2 to 1×10⁵ m2 (Hohenegger et al., 2012), and its albedo ranges from 0.1 to 0.5 (Perovich and Polashenski, 2012). In these studies, melt ponds were considered the traditional open meltwater spots on the ice surface usually seen on Arctic sea ice in the summer. However, the melt pond may be covered by a thin ice lid even midsummer because of strong radiative or turbulent heat losses (Lu et al., 2018a). The thin ice lid influences the albedo, energy, and mass balance of the melt ponds and the sea ice below (Flocco et al., 2015). Calculations of the relevant model (Lu et al., 2018a) have shown that an ice lid with a thickness of 20 cm absorbs 13% of the incident solar energy, half of that absorbed by a 0.3-m-deep meltwater below the ice lid. However, a field campaign to determine the albedo of a refreezing melt pond has rarely been undertaken.
Based on the Chinese National Arctic Expedition in 2018 (CHINARE-2018), we collected in-situ data on the physical properties of snow and sea ice, the albedo of snow and refreezing melt ponds, and the characteristics of these melt ponds. The objectives were (1) to explore changes in the physical properties of snow and sea ice, and (2) to quantify the impact of the thin ice lid of the refreezing melt pond on albedo.
During CHINARE-2018, the ice breaker R/V Xuelong explored sea ice in the range 73º–85ºN and 150º–175ºW, went into the Arctic sea ice zone at 73.5ºN and 164.1ºW, on July 31, and reached the northernmost point at 84.8ºN on August 20. It then sailed southeast and out of the ice zone at 75.5ºN, and 166.1ºW on August 31. In this expedition, nine short-term ice stations (S1 to S9) were carried out, and their locations are shown in Fig. 1. The short-term ice stations were set-up on medium floes with a diameter of 100–500 m, and the operation time was about four to five hours. All data were collected on these stations according to the relevant conditions, and the observations recorded were different. The specific test contents of each short-term ice station are shown in Table 1.
| Station | Date and time (UTC) | Physical properties | Albedo | |||
| Ice | Snow | Melt pond | Snow | |||
| S1 | 10 Aug. 23:00–3:00 | ○ | × | × | × | |
| S2 | 12 Aug. 02:00–6:00 | ○ | ○ | ○ | ○ | |
| S3 | 13 Aug. 02:00–05:00 | ○ | ○ | ○ | ○ | |
| S4 | 14 Aug. 03:00–07:00 | ○ | ○ | ○ | ○ | |
| S5 | 14 Aug. 23:00–05:00 | ○ | × | ○ | × | |
| S6 | 20 Aug. 07:00–12:00 | ○ | × | ○ | ○ | |
| S7 | 21 Aug. 09:30–13:30 | ○ | × | × | × | |
| S8 | 23 Aug. 01:00–05:00 | ○ | × | × | ○ | |
| S9 | 24 Aug. 23:00–04:00 | ○ | ○ | ○ | ○ | |
| Note: ○ means measurement, and × means “no”. | ||||||
 DownLoad:
CSV
DownLoad:
CSV
The sea ice cores were obtained by using coring systems: Mark II (KOVACS, USA), and six full-length ice cores were collected in each station. They were used to measure the temperature, salinity, density, and crystal structure (two) of sea ice. The sea ice temperature was measured in holes drilled into the side of the core at 5 cm intervals immediately after sampling by using a PT-100 needle probe with an accuracy of ±0.1°C. A second ice core was cut into 10 cm long segments and placed in a plastic bottle for it to melt completely to measure its salinity. Salinity was measured by a portable WTW conductivity meter (Xylem Analytics, Germany) with an accuracy of ±0.5. The density and crystal structure of sea ice were measured in a cold laboratory onboard the R/V Xuelong. Density was measured by the weight and volume of a cuboid ice sample (5 cm×5 cm×5 cm) from top to bottom. The crystal structure was observed using a section thinner than 1 mm sliced by the ice core (Huang et al., 2013).
The physical properties of snow, including its liquid water content and density, were measured by a snow fork-LK1604 (Toikka, Finland). It measured the resonance frequency, attenuation, and 3-dB bandwidth, and these results were used in turn to calculate the liquid water content and density of snow with an accuracy of approximate 2%. Figure 2 shows the field measurements of snow. At the short-term stations, a 50 cm×50 cm snow pit was excavated and measured every 2 cm from the surface of snow cover to the bottom.

For albedo measurements, two Trios RAMSES-ACC-VIS hyper-spectral radiometers (Rastede, Germany; www.trios.de) were used. One sensor was up-ward looking to measure the incident irradiance and the other sensor was down-ward looking to measure the reflected irradiance. The sensors detected spectral irradiance over a range of 320 to 950 nm. According to the manufacturer, the sensitivity of the radiometer was 0.04–0.06 mW/(m2·nm). The two sensors were connected to a TriBox3 unit and powered by batteries. Measurements of the melt ponds and snow involved the same setup. Two radiometers were fixed at both ends of a horizontal bar with a length of 4 m, and were placed on a tripod balanced by a counterweight (Fig. 3a). For the melt pond, the tripod was set along the edge of the pond and the horizontal bar extended 3 m toward the center of the melt pond to measure the reflected irradiance (Fig. 3b). For snow, the same setup was arranged on unspoiled snow surface near the melt pond. The albedo was measured for 10 min at each position and the sampling interval was 15 s.

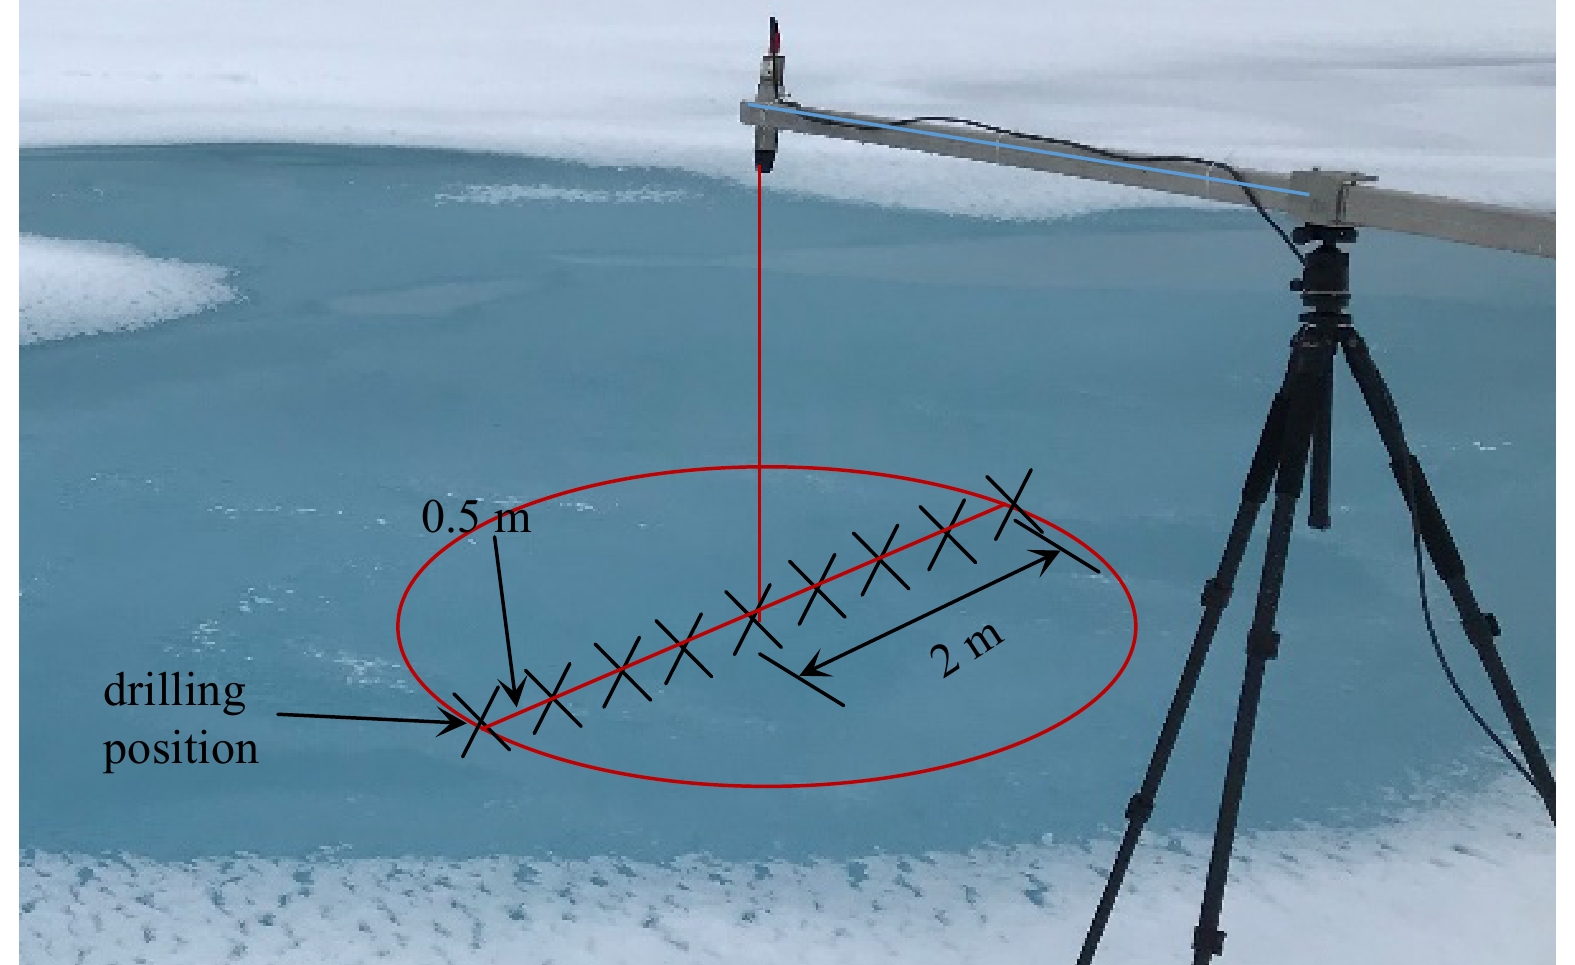
The characteristics of the melt pond were measured to better understand the effects of the thin ice lid on albedo. The measurement content included the thicknesses of the ice lid, water, and underling ice. According to the distance between the down-ward looking sensor and the surface (1 m), the sensor received more than 95% of the measured signal from at least 4 m of undisturbed surface around it (Nicolaus et al., 2010b). Therefore, as shown in Fig. 4, we took the sensor as the center and drilled holes every 0.5 m to measure the melt pond thickness in the range of 2 m in S4 and S6. However, in the remaining ice stations, thickness was measured only at three or four positions in the effective range, owing to a limited number of working hours. The thickness of snow was also measured when the melt pond had snow cover.

The irradiance spectra measured across 320–950 nm showed high noise levels at the upper and lower ends, because of which we limited the analysis of spectra above the ice surface to the band 350–920 nm, as in Nicolaus et al.’s (2010b) work. All spectral irradiance data were interpolated to a 1-nm grid. The spectral albedo α(λ) was defined as the ratio of the upwelling irradiance Fr(λ) to downwelling irradiance Fd(λ) above the surface (Nicolaus et al., 2010a). To compare the albedo of different melt ponds more intuitively, the broadband integrated albedo (350–920 nm) was defined as follows (Lei et al., 2012b):
| $$\alpha {\rm{ = }}\frac{{\displaystyle\int_{350}^{920} {\alpha (\lambda){F_{\rm{r}}}(\lambda){\rm{d}}\lambda } }}{{\displaystyle\int_{350}^{920} {\alpha (\lambda){F_{\rm{d}}}(\lambda){\rm{d}}\lambda } }}.$$ | (1) |
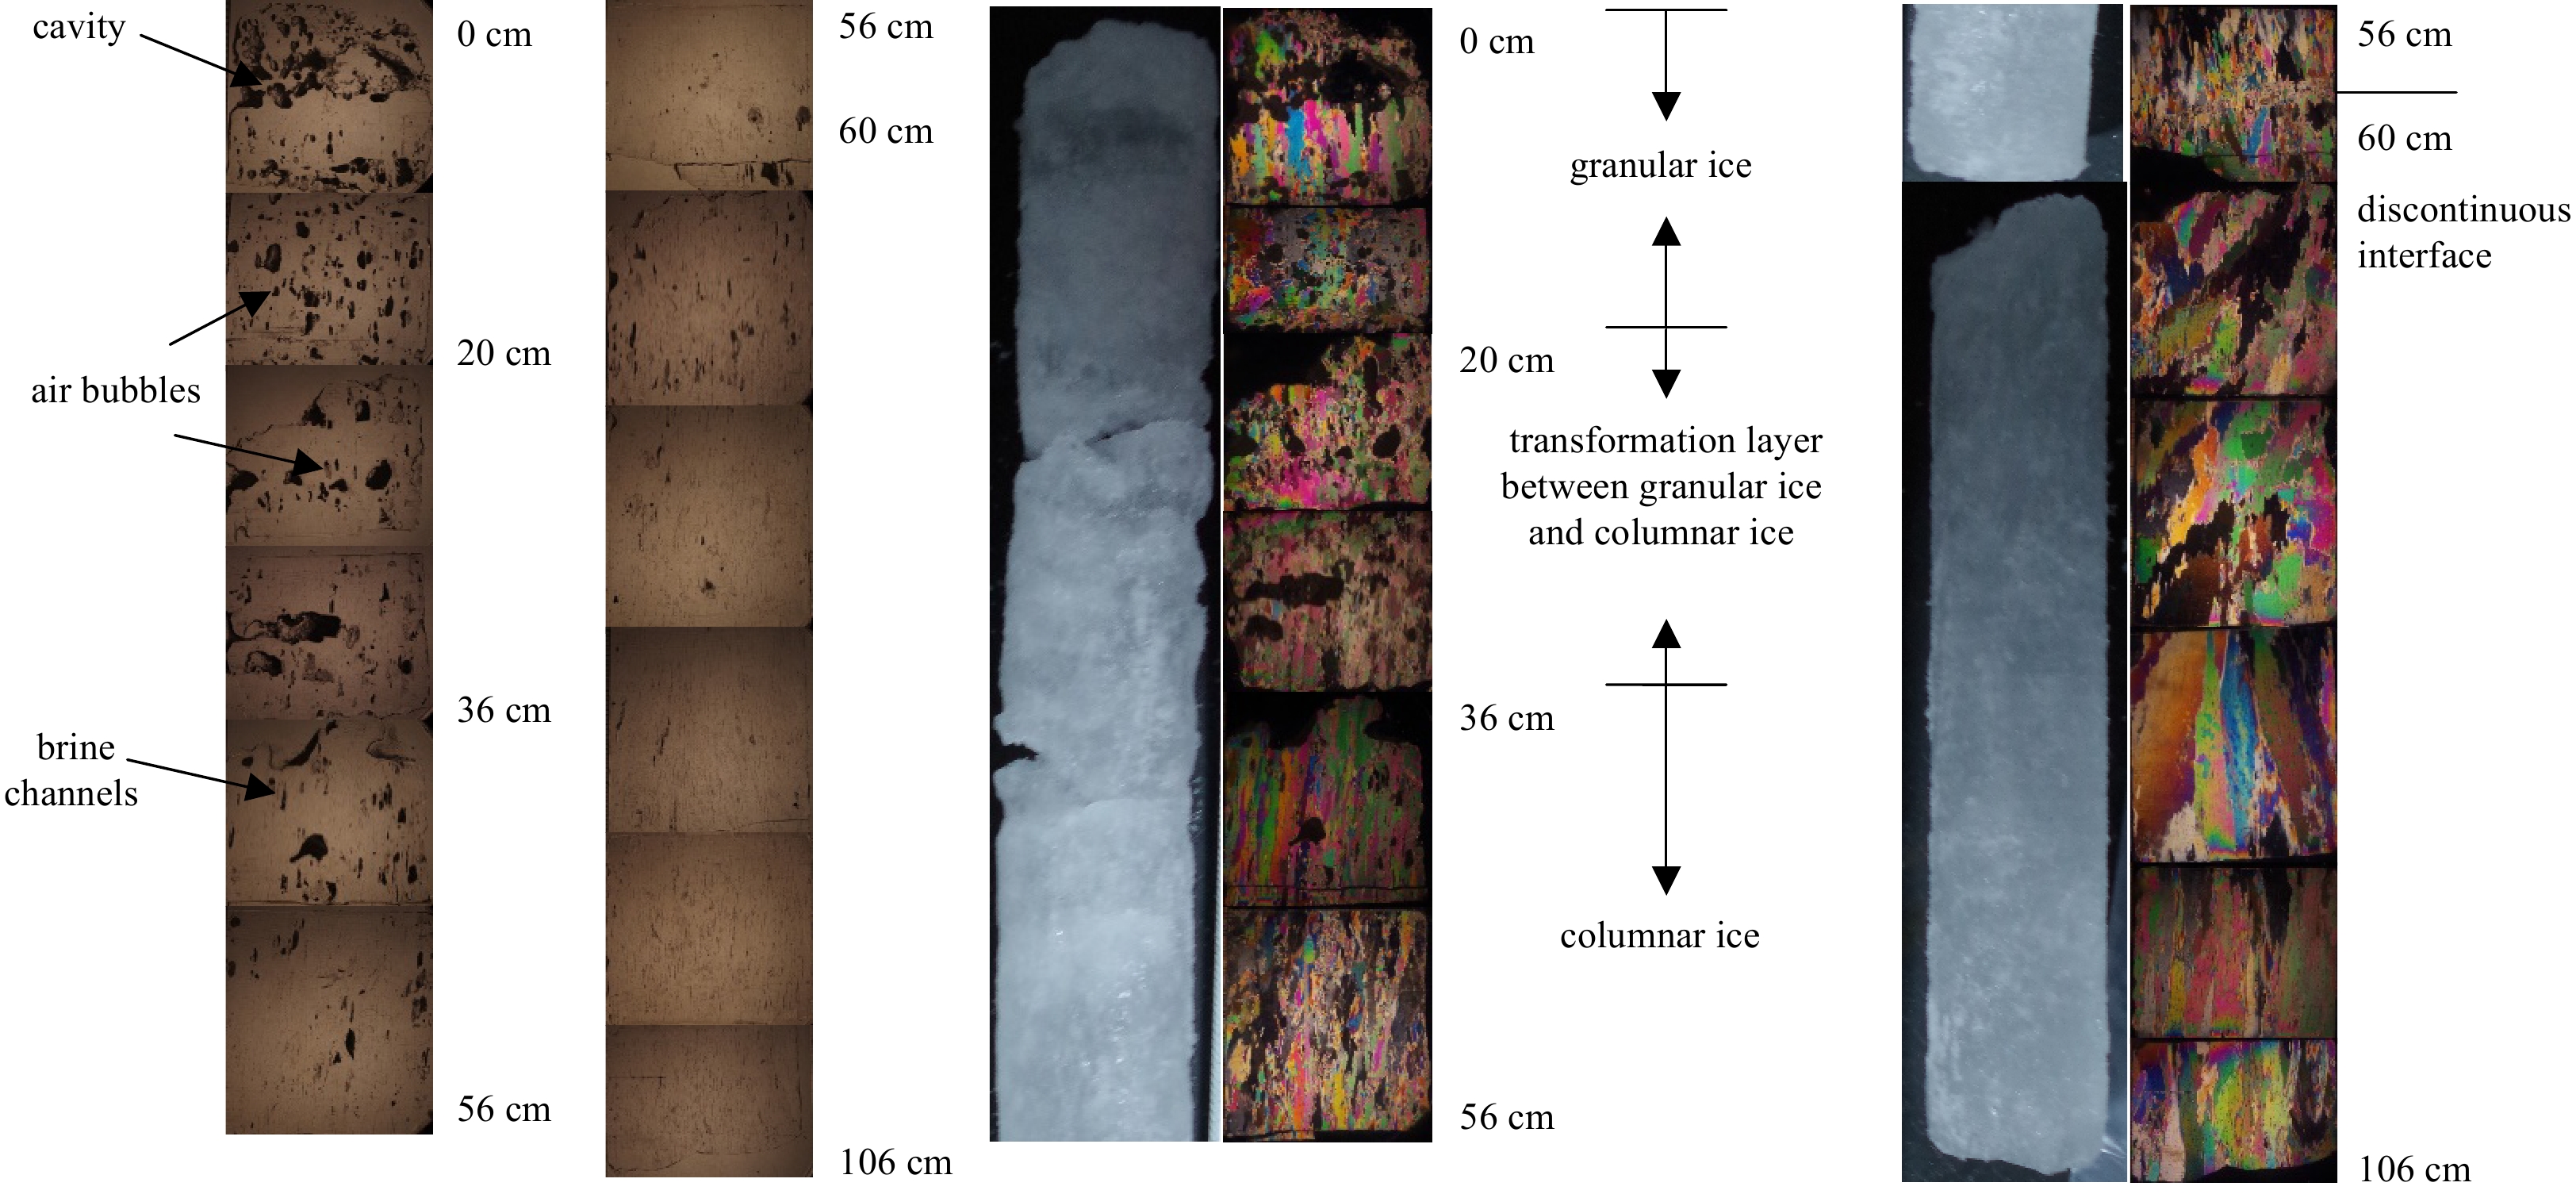
The crystal structure of sea ice was analyzed with referenced to the method used by Huang et al. (2013). Figure 5 shows the typical sections (S6) under natural and polarized light. To compare the structure of sea ice at different stations more intuitively, a diagram of the textural structure of sea ice cores at all short-term stations is shown in Fig. 6.


A thin granular ice layer with a thickness of 5–30 cm appeared at the top of all investigated ice cores. Many factors affected the thickness of the granular ice layer, such as the salinity of sea water, temperature, environmental and water conditions (Timco and Weeks, 2010). Although the ice stations were close to one another, samples of sea ice were collected from different ice floes. Therefore, different growth environments resulted in differences in the granular ice layers. The grains of ice in these layers were spherical or quasi spherical, with a typical size of 2–7 mm. The thin granular ice layer can be classified as superimposed/primary ice originating from the rapid consolidation of the dynamically grown frazil, but not snow ice, because its salinity was nearly zero (Huang et al., 2013, 2016). During melting of the surface, a large amount of deteriorated ice and cavities formed on the top layer, especially for the 0–5 cm (Fig. 5). In all cases, a transition layer could be easily founded between the top granular-ice layer and lower columnar-ice layer. The transition layer was a zone of mixed columnar/granular ice (Weeks and Ackley, 1986). There were two ways for the transition layer to form. One was through the transition of the growth regime from dynamically-growing frazil ice to congelation-grown columnar ice. This kind of transition layer is the most common between granular and columnar ice layers (Eicken et al., 1995). The other kind of transition layer was formed based on the deterioration and retexturing of columnar ice due to sea-ice interior melting. This kind of ice was highly porous and its crystal skeleton was broken to a high degree. Highly porous ice was observed clearly in all cases (e.g., Fig. 5), and the ice core samples were collected in the melting period (10–24 August). Thus, the transition was caused mainly by internal melting. Columnar ice formed the largest part of the core in all cases, and its thickness ranged from 49 cm to 108 cm. It was formed through the consolidation of frazil crystals (tiny spicules and platelets, a few millimeters in size) grown within leads or at depth accumulated at the bottom of the ice cover (Eicken et al., 1995). Inner, discontinuous interfaces were observed at S3 and S6 from a thin section under polarized light, such as the discontinuous interface of S6 shown in Fig. 5. These inner discontinuous interfaces were not related to any inner granular-ice layer or inclined columnar ice. They can be associated with the discontinuous thermodynamic growth processes in winter, but not with the repeated freezing and thawing processes and nor with dynamical deformation processes (Huang et al., 2013). The thickness of the columnar ice layer depended on a variety of factors, such as the growth rate of ice, salinity of the underlying water, and magnitude of currents enhancing transport away from the ice (Petrich and Eicken, 2009). Therefore, columnar ice could stop growing at some time during winter due to changes in external conditions and the ice could continue to grow when the relevant conditions were met (Huang et al., 2013, 2016). This is discontinuous thermodynamic growth that gave rise to inner discontinuous interfaces (Figs 5 and 6). According to Fig. 6, the inner discontinuous interfaces were observed in S3 and S6, which means that the columnar ice layer in other ice stations was formed in one episode of thermodynamic growth. The mean individual columnar-ice layer for all cases was (70±30) cm. The maximum thickness of the individual columnar layer of ice was 108 cm as observed at S7. According to Martin (1979), the granular ice accounts for less than 10% of Arctic sea ice. In our observation, the ratio of granular ice to all ice ranged from 0.07 to 0.10, and was consistent with Martin’s conclusion. The ratio of granular to columnar ice ranged from 0.05 to 0.42 and did not exhibit any proportional relation.
The temperature, density, and salinity of sea ice were measured by ice samples of three lengths at an ice station. To compare the profiles of temperature, density, and salinity more intuitively, we plotted data for the ice-core against the normalized results in Fig. 7 (Huang et al., 2013).

In Fig. 7, the uppermost layers of ice in all cases had relatively low density because the melting of the ice surface caused an increase in porosity. This is also clear in Fig. 5. The average density of the top ice layers (10 cm from the surface) was about 662 kg/m3. The density of ice increased with depth due to a decrease in porosity. From Fig. 5, it is clear that porosity decreased from the top to a depth of 46 cm, where the ice was much clearer. The density of ice decreased slightly at the bottom layer because the increased porosity again caused the bottom ice to melt. The average density of all ice cores was (825±30) kg/m3, with a maximum of 848 kg/m3 at S1 and a minimum of 803 kg/m3 at S9.
The salinity and temperature of sea ice exhibited a completely opposite trend to the above (Fig. 7). Salinity increased slightly with depth and temperature decreased linearly with it. The average temperature of sea ice was about (–0.22±0.08)ºC with a maximum of –0.08ºC at S2 and a minimum of –0.31ºC at S4. The average temperature of sea ice approached 0ºC at the top layer, and decreased from top to bottom (–0.5ºC). The ice core was warmer than the freezing point, especially in the upper layer. As the sea ice warmed, it disintegrated, allowing individual brine pockets to reconnect. These brine pockets determined the salinity of sea ice. In the upper layer, the reconnect brine pocket led to the discharge of brine, and salinity was about 0 psu. The average salinity of all cases was about (1.36±0.31) psu, with a maximum of 1.96 psu at S1 and a minimum of 0.94 psu at S6.
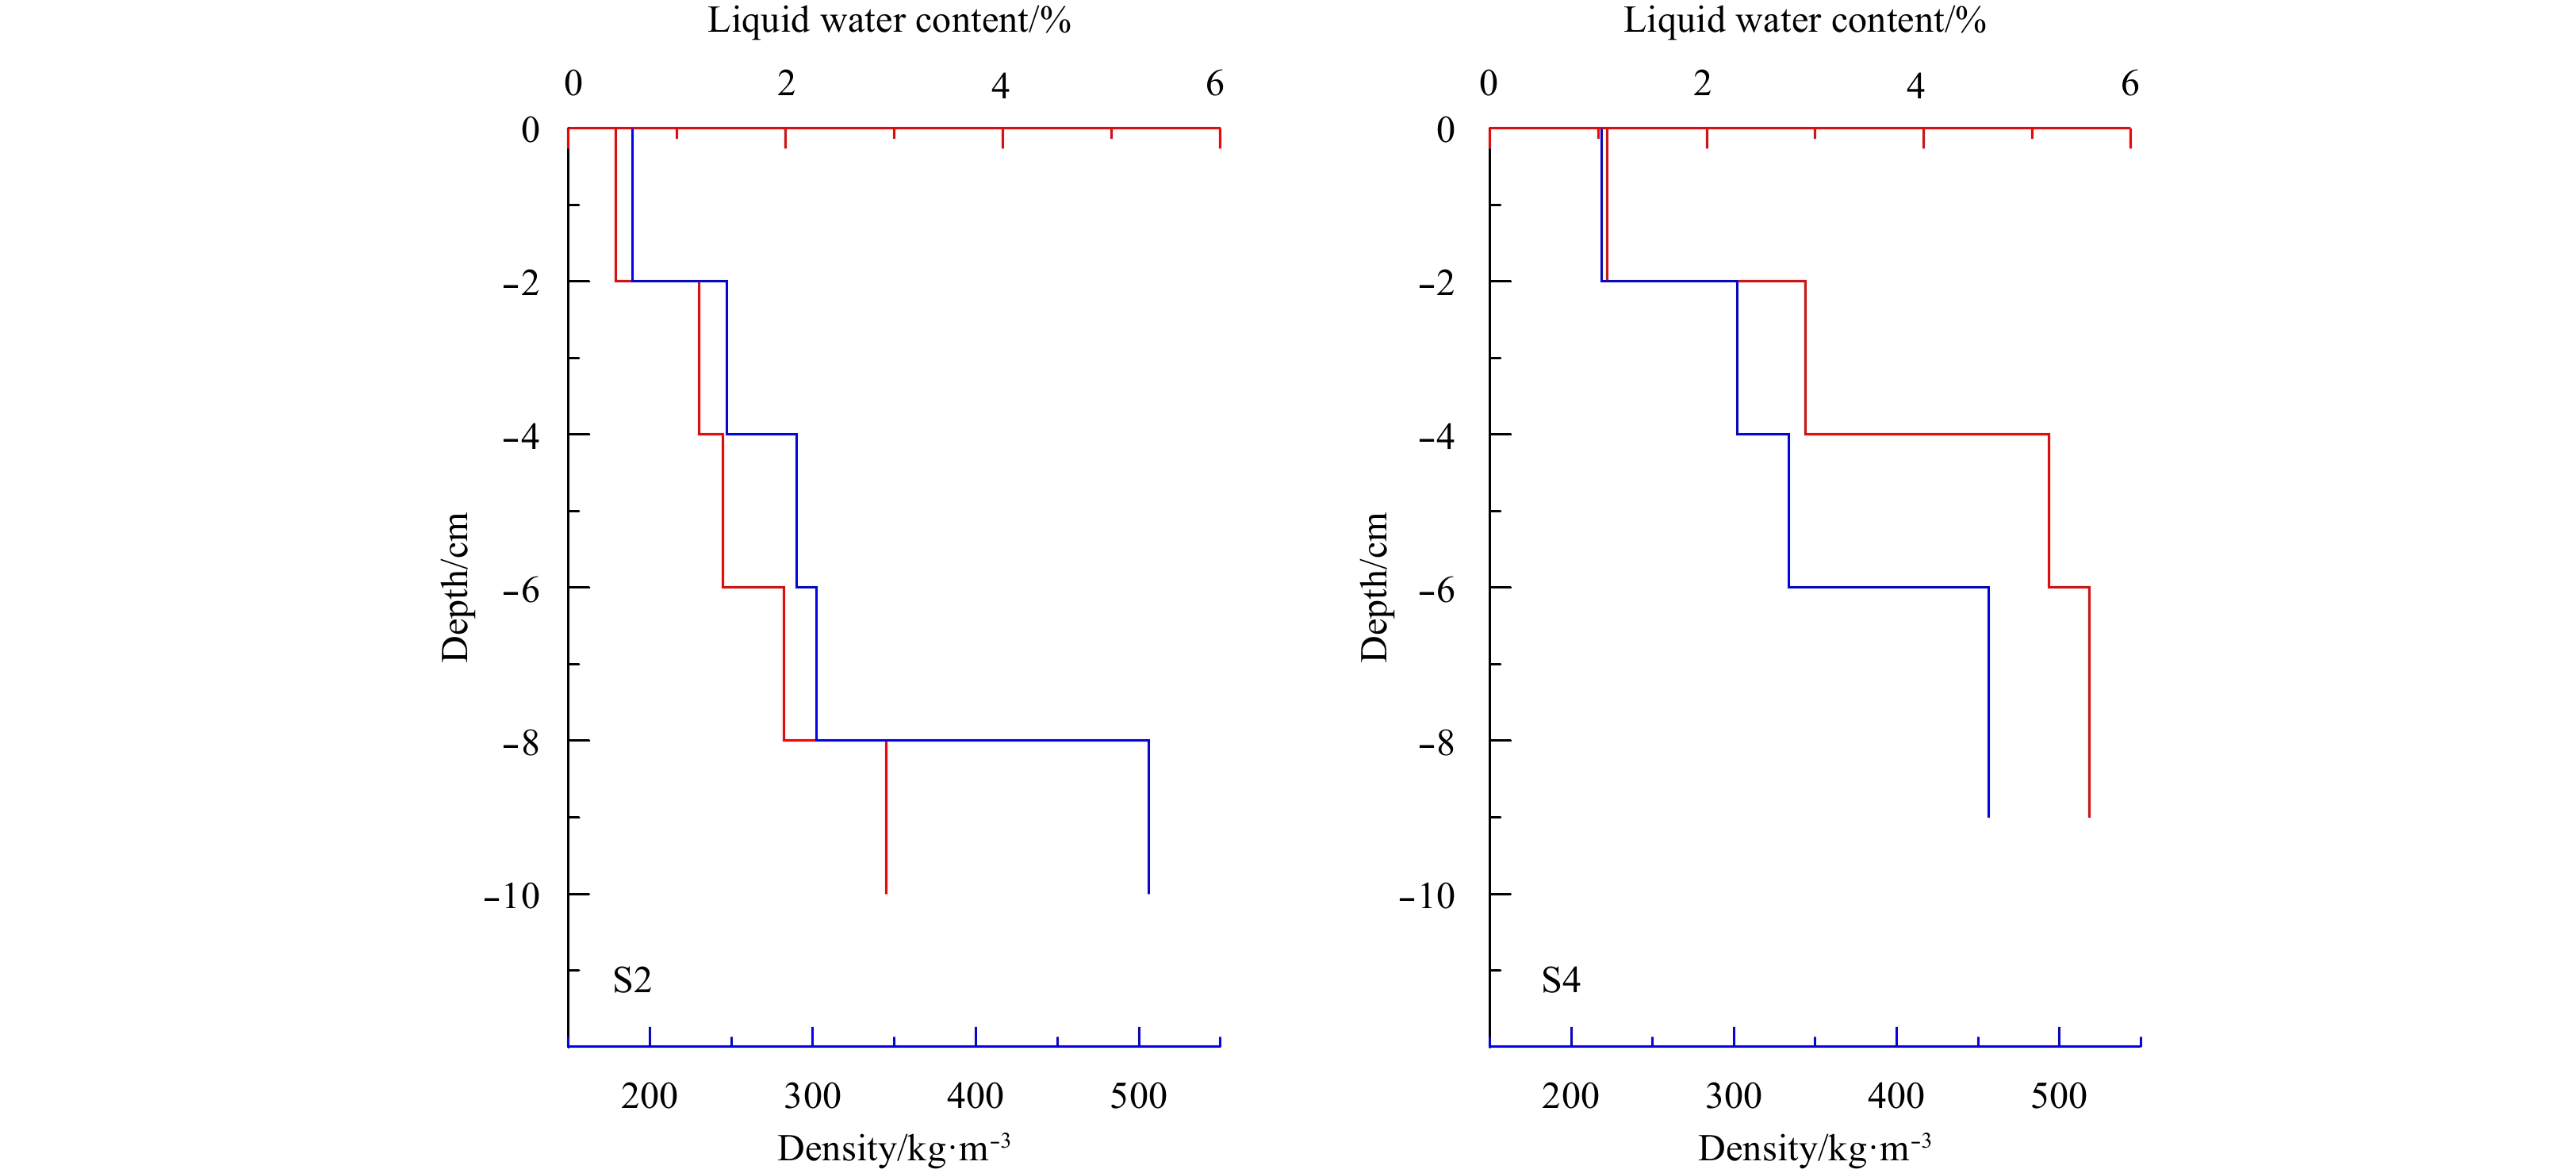
Figure 8 shows profiles of the liquid water content of snow and its density at S2 and S4. The water content and density increased slightly with depth. Water content was low (0.44% and 1.07%) in the top layer, and increased to 2.92% and 5.52% in the bottom layer. The water content influenced the density of snow during melting as shown in Fig. 8. Density in the top layer was 189 kg/m3 and 218 kg/m3, and increased to 506 kg/m3 and 456 kg/m3 in the bottom layer. The coefficients of correlation between the liquid water content of snow and its density were 0.95 and 0.85, respectively, and this agreement further illustrates the effect of liquid water content on the density of snow. Table 2 summarizes the average liquid water content and density of snow ranging from 0.31% to 3.37%, and 185 kg/m3 to 307 kg/m3, respectively. The low value at S4 was caused by new snowfall (López-Moreno et al., 2013).

| Station | Snow thickness/mm | Average water content/% | Average density/kg·m–3 |
| S2 | 100 | 1.59 | 307 |
| S3 | 90 | 3.37 | 218 |
| S4 | 67 | 0.31 | 185 |
| S9 | 120 | 1.38 | 254 |
DownLoad:
CSV
To better understand the effects of different melt ponds and physical properties of snow on albedo, the surface condition and properties of melt ponds, and values of the albedo were obtained. We define the thicknesses of the snow, thin ice lid, melt pond water and underlying ice as Hs, Hl, Hp, and Hi respectively.
Table 3 summarizes the properties of melt ponds and snow cover, the albedo of which was measured. The melt ponds in S4 and S5 had a thin snow cover (2.6 cm and 3.5 cm, respectively), the S4 was completely covered and S5 was partly covered (Fig. 9). The average thickness of thin ice lid ranged from 2.2 cm to 7.0 cm, and the depth of the pond ranged from 1.8 cm to 26.8 cm. The underlying ice was all thicker than 100 cm, with a maximum of 160 cm at S4 and minimum of 105 cm at S6. Snow in this investigation was relatively thin, and ranged from 3.0 cm to 10.2 cm. The thickness of ice under snow cover was similar that under the melt pond, and ranged from 116 cm to 180 cm.
| Station | Melt pond/cm | Snow/cm | |||||
| Hs | Hl | Hp | Hi | Hs | Hi | ||
| S2 | 0 | 2.2 | 12.4 | – | 10.2 | – | |
| S3 | 0 | 3.8 | 4.3 | 117 | 6.0 | 116 | |
| S4 | 2.6 | 7.0 | 1.8 | 160 | 2.5 | – | |
| S5 | 3.5 | 3.9 | 6.1 | 116 | 3.5 | 127 | |
| S6 | 0 | 5.5 | 11.9 | 105 | 3.0 | – | |
| S8 | – | – | – | – | 3.8 | 180 | |
| S9 | 0 | 5.7 | 26.8 | 149 | 8.0 | 168 | |
| Note: – means no data. | |||||||
DownLoad:
CSV

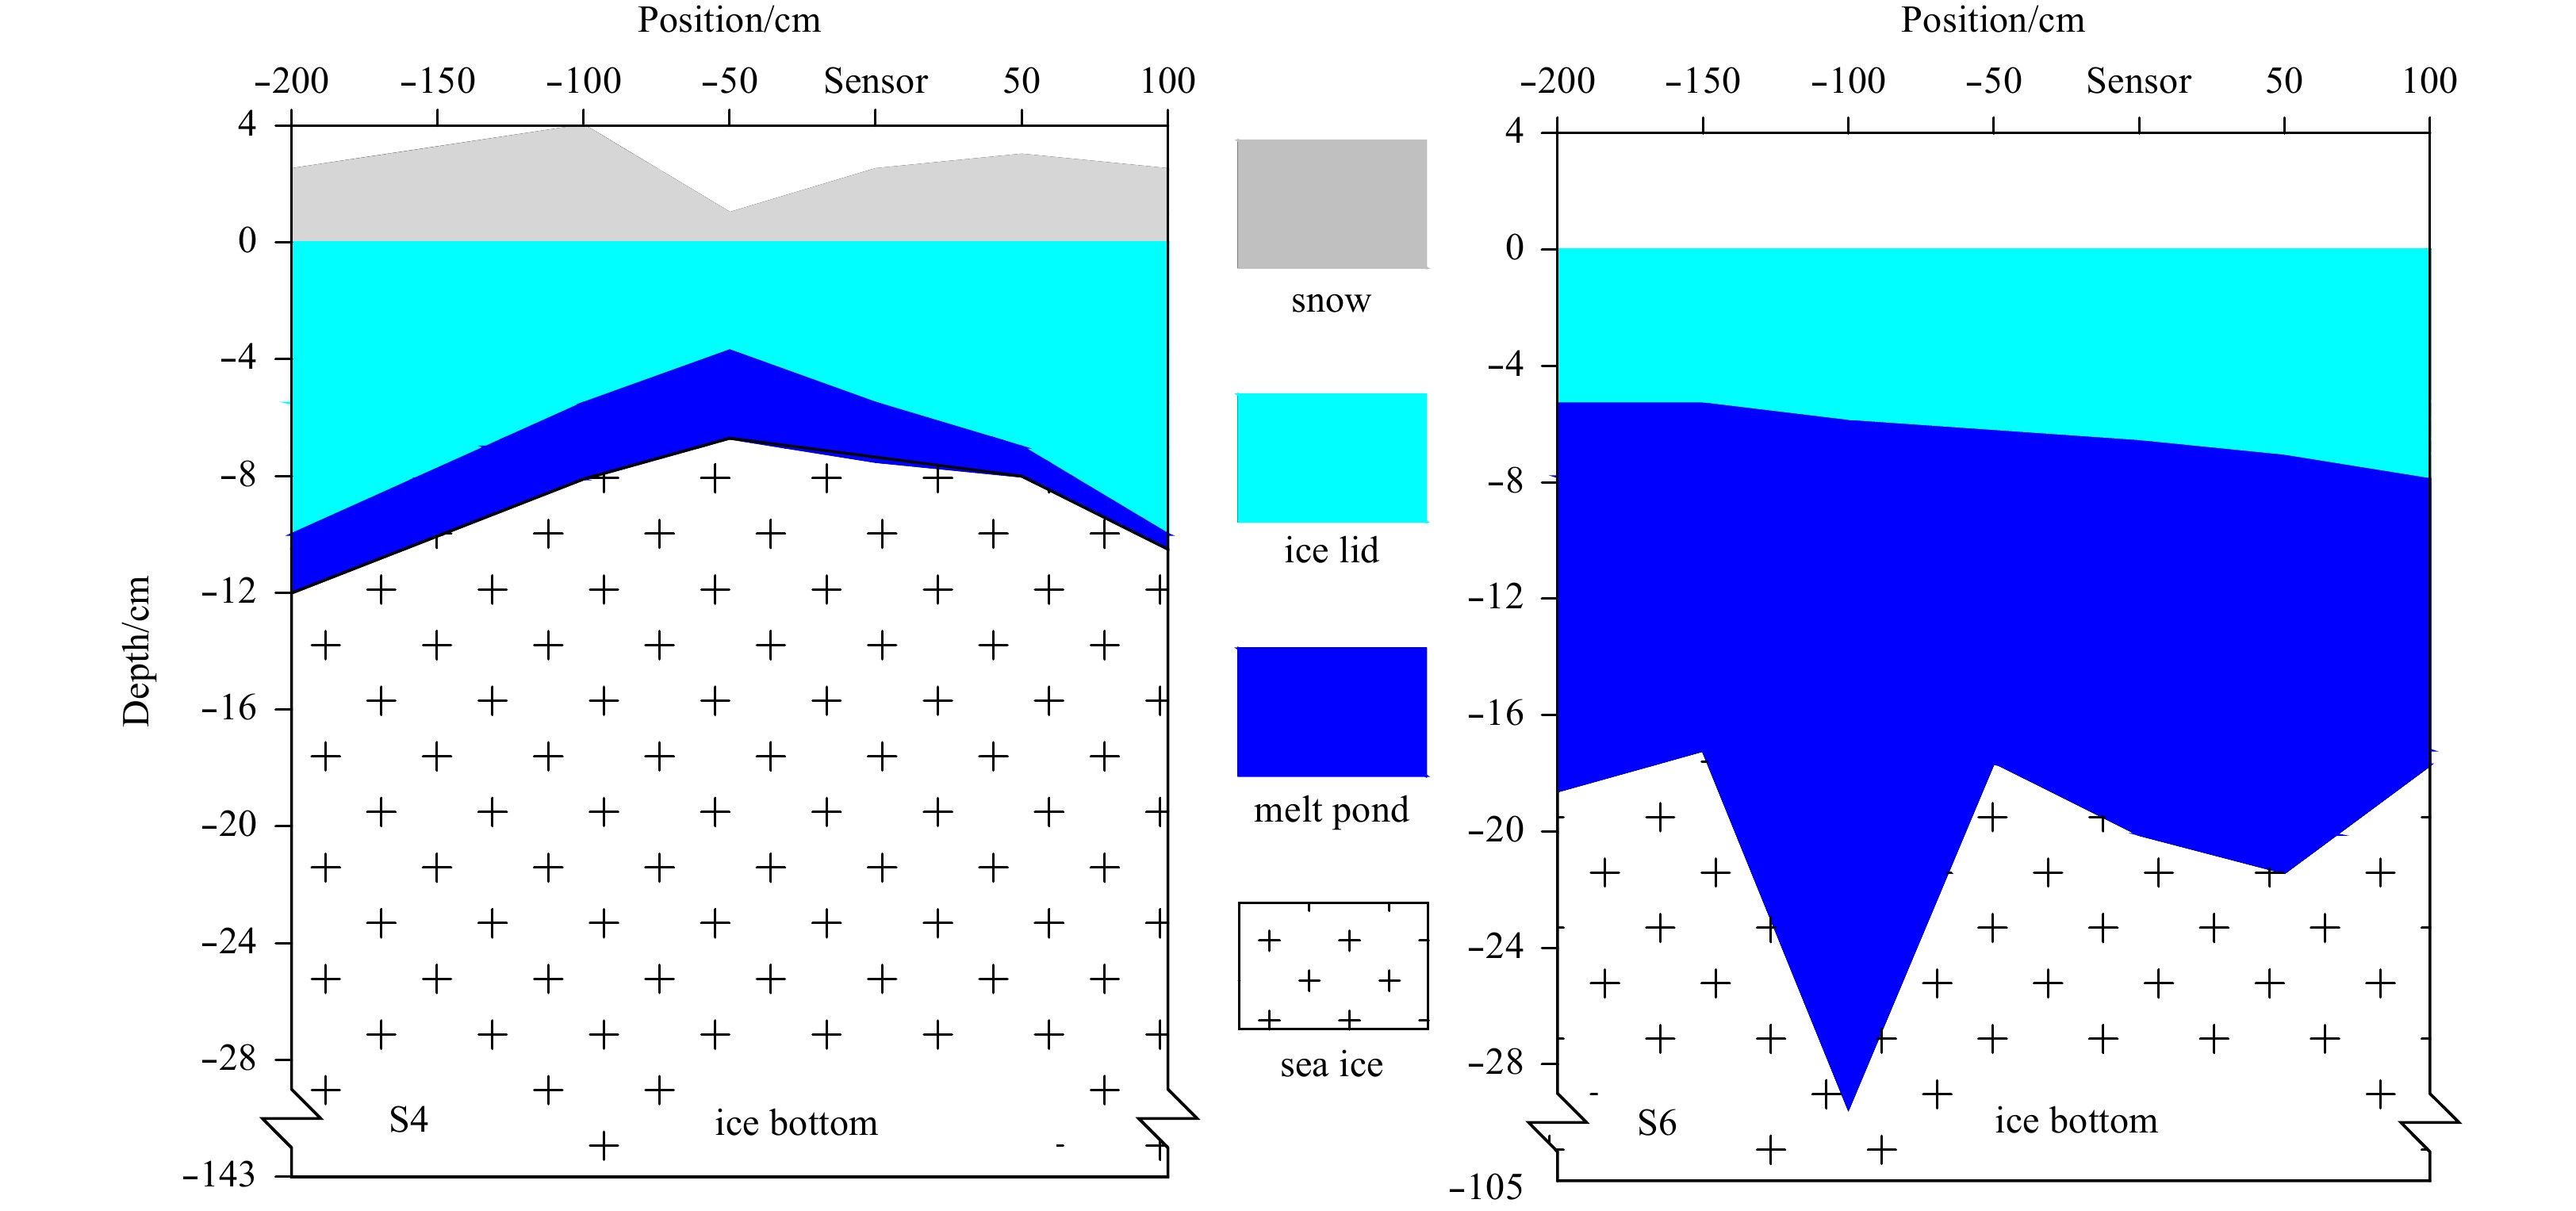
Figure 10 shows the thickness distributions of the melt pond at S4 and S6. The snow cover and ice lid were thick all around and thin in the middle in S4. The thickness of snow decreased from 2.5 cm to 1 cm, and then increased to 2.5 cm. The ice lid decreased in thickness from 10 cm to 3.7 cm and then increased to 10 cm. The depth of melt pond represented the opposite trend. The depth increased from 2 cm to 3 cm and then decreased to 0.5 cm. The same trend was not observed in S6 because the area of measurement was smaller than that of the melt pond. The ice lid increased slightly in thickness from 5.2 cm to 7.8 cm. The depth of melt pond exhibited no regularity, and ranged from 6.6 cm to 23.7 cm.

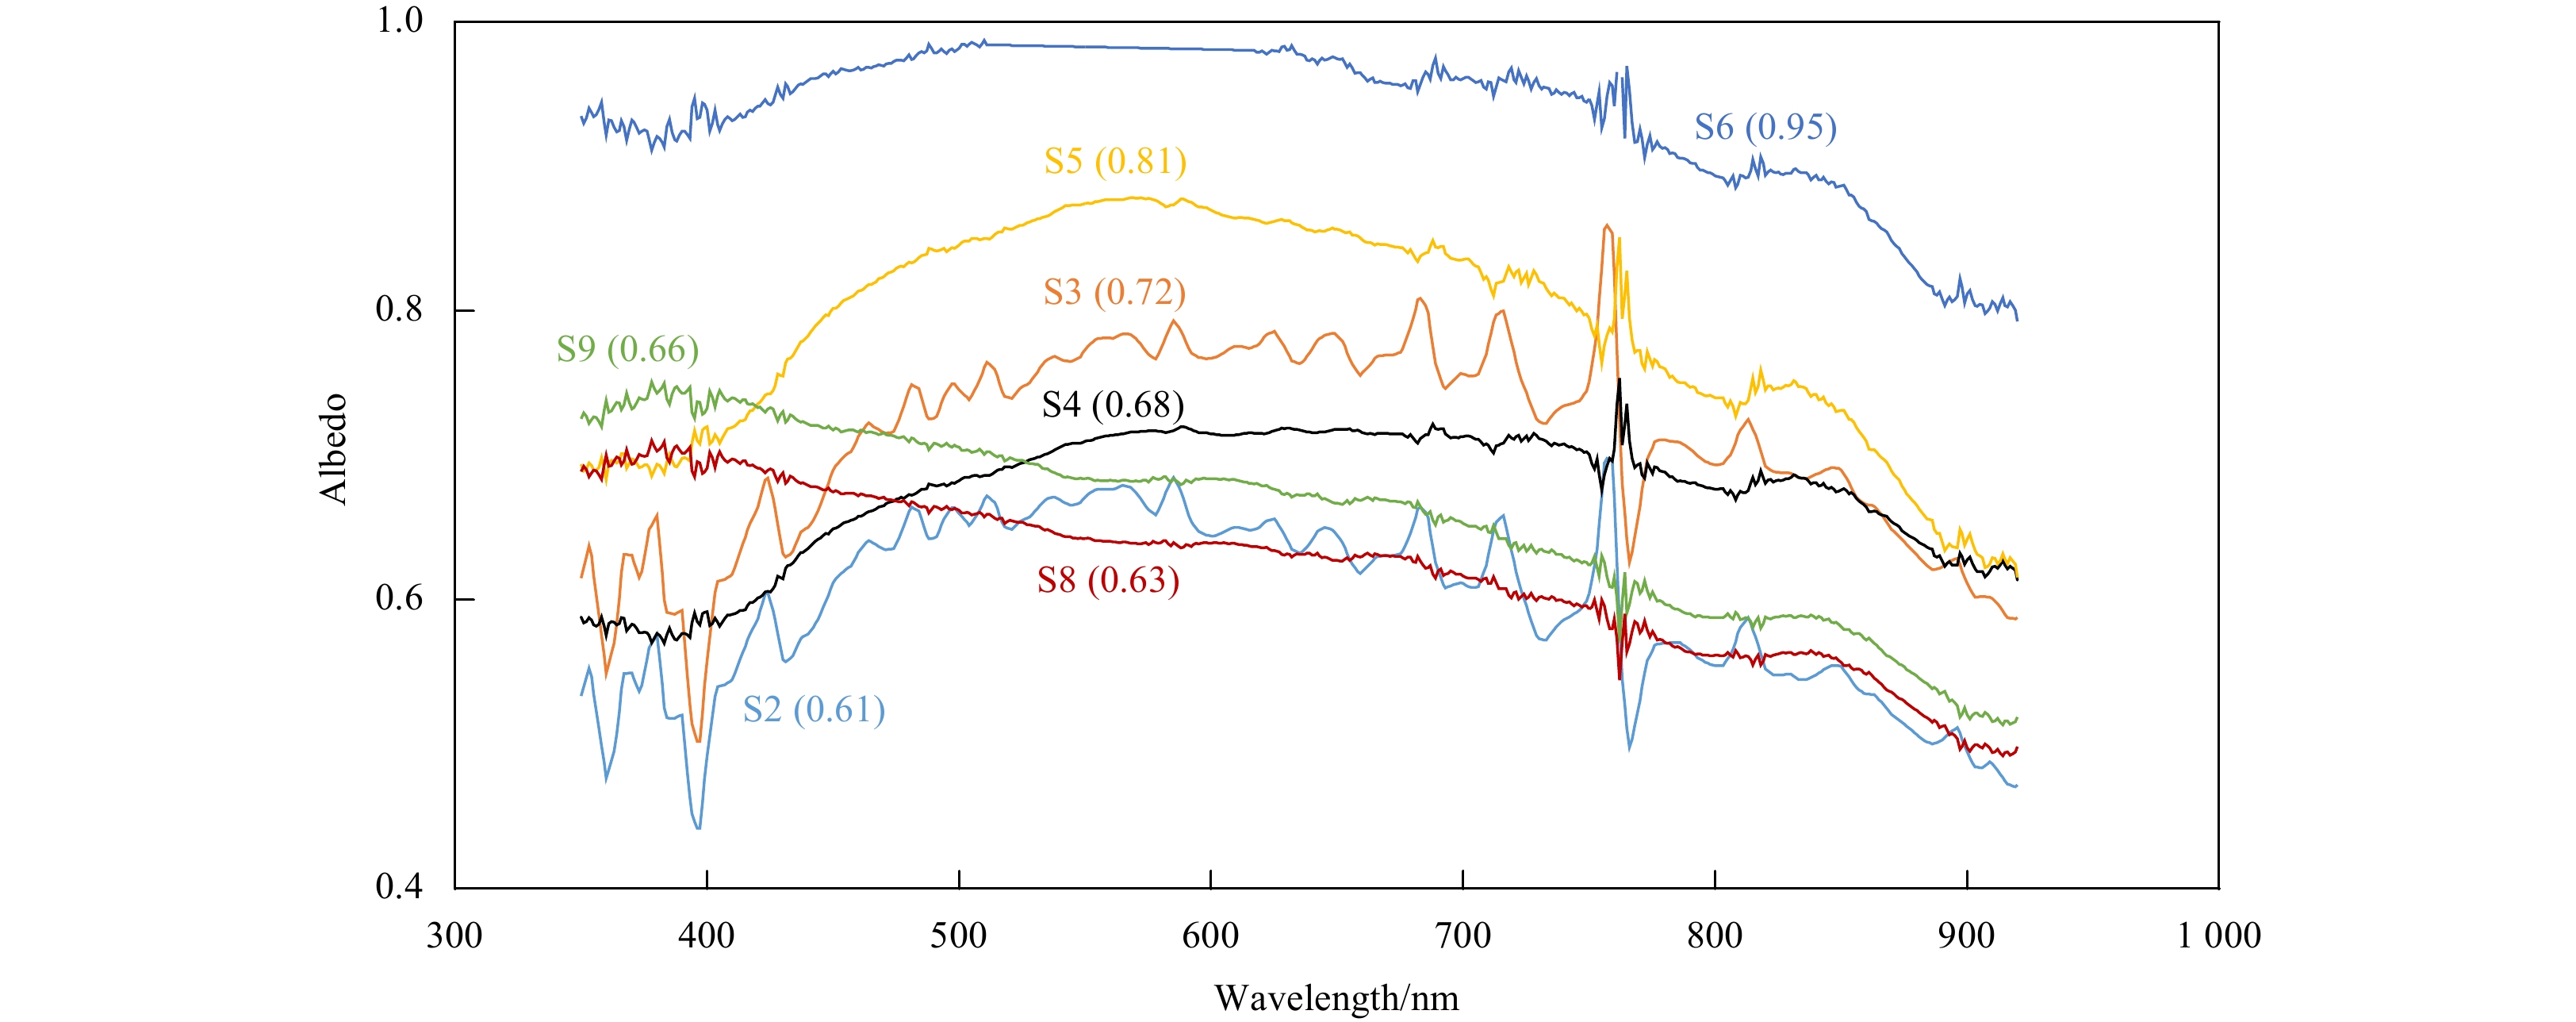
Figure 11 shows the results of the albedo of the refreezing melt pond. The oxygen content exhibited sharp absorption at around 760 nm, and was sampled at slightly different wavelengths by the two sensors owing to their different wavelength grids. Therefore, there were prominent noisy spikes in spectral albedo at 750–775 nm (Keilin and Hartree, 1949; Nicolaus et al., 2010b). The highest spectral albedo occurred at S4, with the value fluctuating from 0.48 to 0.57, brought about by snow cover on the surface of the melt pond. The spectral albedo of S5 was also partly covered by snow, and was lower than that of S4, with a value ranging from 0.34 to 0.43. But the shape of the curve of spectral albedo did not change much, and snow cover played a decisive role in the albedo of the two melt ponds. Figure 9 shows approximately 50% snow cover in the measurement area in S3. However, the thickness of snow was not measured, due to without snow under the down-looking sensor. Therefore, the shape of the spectral albedo was similar to that in S4 and S5, with the lowest value (0.21 to 0.32). S2 and S6, at similar pond depths had similar shapes of the spectral albedo. The spectral albedo was higher at 350–600 nm than at 600–920 nm. However, the albedo of S6 (0.33–0.51) was higher than that of S2 (0.17–0.44) because the thickness of the ice lid was 3.3 cm greater than that of S2. The shape of the albedo curve in S9 was different from that in the other cases, and there was no significant growth in the 400–700 nm band because of the deeper melt pond (Tucker III et al., 1999; Lu et al., 2018a). By comparing the spectral albedo curves of S2 and S6, snow cover was found to increase the albedo at 400–600 nm. The integrated albedo exhibited the same trend as the spectral albedo. The highest integrated albedo appeared at S4, with a value of 0.57. The albedo values at S5, S6, and S9 were all about 0.45, and were slightly lower at S2 and S3, with the values of 0.32 and 0.28, respectively.

Figure 12 show the results of the snow albedo. The highest albedo occurred at S6, with a value ranging from 0.79 to 0.99. The shape of the spectral albedo was similar that those at S3, S4, S5, and S8. They had high albedo values in the PAR band (400–700 nm), with values ranging from 0.49 to 0.79. The albedo at S3 was higher than that at S4 because the thicker snow (6.0 cm vs. 2.5 cm) reflected higher irradiance. The lowest albedo at S2 was brought about by high density. The spectral albedo of S8 and S9 were different from those of others, and decreased with the wavelength increasing. These albedo ranged from 0.49 to 0.71 and 0.51 to 0.75 respectively. The integrated albedo ranged from 0.61 (S2) to 0.95 (S6), and was higher than the albedo of the melt pond.

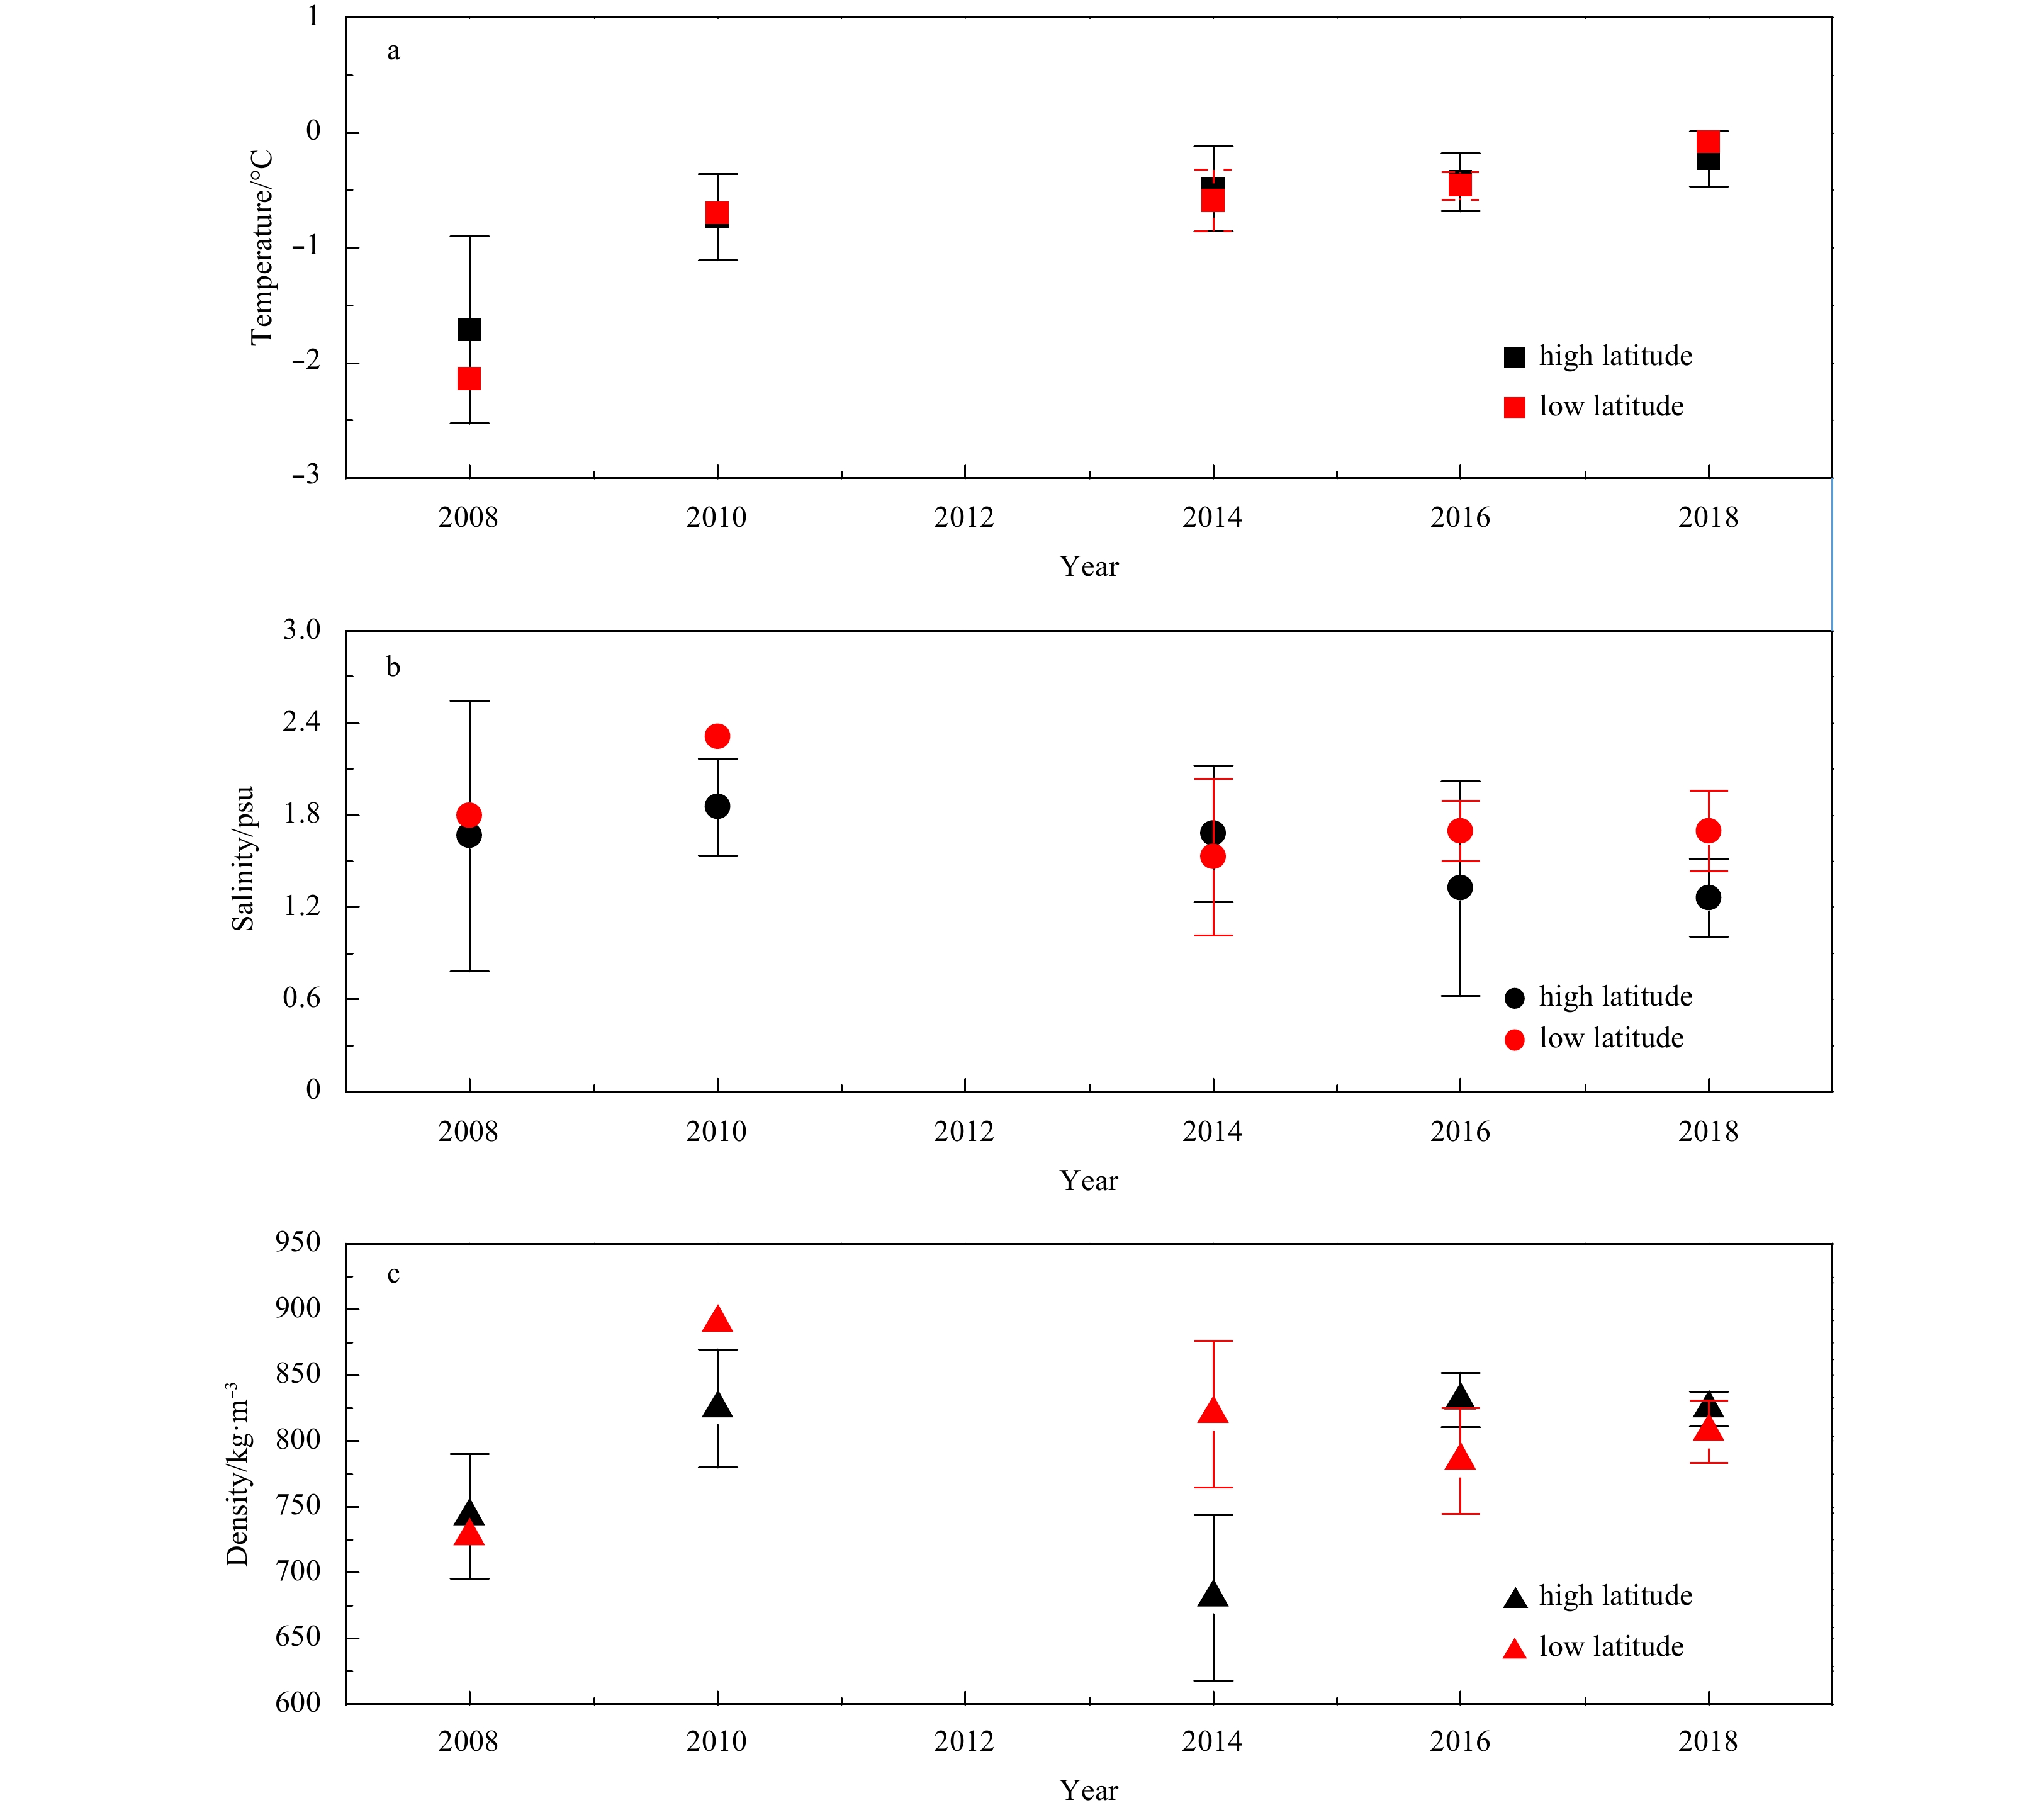
Data on the physical properties of Arctic sea ice in the Pacific region measured by the Chinese National Arctic Expedition in the last 10 years are summarized and analyzed here. They include data from 2008 (Lei et al., 2012a), 2010 (Huang et al., 2013), 2014 and 2016 (Wang et al., 2018). The locations of all measurements are shown in Fig. 13. The measurement positions covered 76.3º–88.4ºN and 147.1º–179.6ºW (Table 4). These data were grouped according to 80ºN, and were divided into high and low latitudes. Figure 14 shows the average and standard deviation of the sea ice temperature, density and salinity in these expeditions. The average sea ice temperature in August increased from –1.80ºC to –0.22ºC. The average salinity ranged from 1.3 psu to 1.8 psu at high latitudes, and from 1.5 psu to 2.3 psu at low latitudes, and the average sea ice density ranged from 681 kg/m3 to 743 kg/m3 at high latitudes, and from 759 kg/m3 to 898 kg/m3 at low latitudes. Only the temperature of sea ice slowly increased, and there was no regularity in changes in its salinity and density. This was because the temperature of sea ice is mainly determined by the atmosphere and marine environment (Timco and Week, 2010). However, its salinity and density are influenced by the type of ice (first-year ice or multi-year ice), location of the ice sample in the original sheet, testing techniques, and handling of the ice after removal from sea water (Timco and Frederking, 1996; Timco and Weeks, 2010). Therefore, no regular trends regarding the salinity and density of sea ice were observed in these data. These data indicated that the internal melting of Arctic sea ice increased at the end of the melting season. This increase provided favorable conditions for the decline of the sea ice to accelerate (Huang et al., 2016). The field observations covered only a small part of the Arctic sea ice, and further research is required to obtain in-situ to determine the general trend of the internal melting of sea ice over the entire Arctic.

| Year | Date | Ice station number | Position | |
| Latitude (N) | Longitude (W) | |||
| 2008 | 27 Aug.–2 Sep. | 5 | 79.9º–85.2º | 147.1º–162.8º |
| 2010 | 30 Jul.–23 Aug. | 7 | 77.5º–88.4º | 158.9º–177.2º |
| 2014 | 10 Aug.–28 Aug. | 8 | 76.7º–80.9º | 149.4º–163.1º |
| 2016 | 4 Aug.–20 Aug. | 7 | 76.3º–82.3º | 167.0º–179.6º |
| 2018 | 10 Aug.–24 Aug. | 9 | 79.2º–84.7º | 156.1º–169.4º |
DownLoad:
CSV

To better understand differences in the albedo of the refreezing melt pond, Fig. 15 shows the Arctic sea ice albedo of different surface conditions, such as with new snow and autumn freeze (Nicolaus et al., 2010a), melting snow, early seasonal melt pond, and mature melt pond (Grenfell and Maykut, 1977). These conditions reflect different seasons in the Arctic as well as seasonal variations in the sea ice albedo. The data reported by Grenfell covered wavelengths in the range of 400–1 000 nm, and Nicolaus used the same sensor covered 350–920 nm. For the refreezing melt pond, Fig. 15 shows the average and scope of these observations.

The highest albedo was the new snow and autumn freeze up, and they were about twice as high as refreezing melt pond (Fig. 15). The melting of snow increased water content, which reduced the albedo, especially in the near infrared band (760–100 nm) (Lei et al., 2012b). The albedo of melting snow was 70% higher than that of the refreezing melt pond. For the three types of melt ponds, the shapes of the albedo curve for the early seasonal melt pond and refreezing melt pond were very different. The early melt pond exhibited a high albedo at 400–600 nm, owing to the shallow melting pond. However, the open water surface brought about the low albedo at 600–920 nm. Compared with the mature melt pond, the thin ice lid improved the albedo, especially in the near infrared band. Figure 15 shows that the albedo decreased and then increased within a year, during the melting and freezing of Arctic sea ice.
In this section, we discuss the uncertainty in the data on sea ice physical properties and albedo measurement, and propose improvements.
For the sea ice physical properties, uncertainty was mainly brought about by the temperature of sea ice and its density. When measuring temperature, it was necessary to drill and measure temperature immediately after the collection of the ice core. The heat generated by friction between the metal bit and the ice sample during drilling resulted in the measured temperature being slightly higher. A drill bit composed of high-strength insulated plastic materials can be applied to reduce the generated heat to improve the accuracy of measuring the sea ice temperature in future measurements. The measurement of density required that the ice sample be processed into standard cubes. This processing could not be completed in the field, and the samples needed to be transported to a cryogenic laboratory for this. During transport, the brine inevitably loosened, which resulted in the density being measured below the actual value. A buoyancy method used for measuring the density of irregular ice samples in situ can be used to avoid having to transport the ice samples and improve the accuracy of measurement.
The setup for the measurement of the albedo of the melt pond used here was very convenient. However, it could measure only the albedo at the edge of the melt pond, but could not measure that of the entire melt pond with a large area. To measure the thickness of the melt pond, it was impossible to measure the morphology of the entire melt pond in light of the safety of the surveyors. UAVs (Unmanned Aerial Vehicles) have been widely used in field investigations (Galley et al., 2009; Berni et al., 2009), and the GPR (Ground Penetrating Radar) has been widely applied to measure the thickness of ice (Galley et al., 2009). In future work, UAVs should be equipped with Trios and a GPR to measure the albedo and the morphology of entire melt ponds. This will significantly improve the efficiency and accuracy of measurement.
Arctic sea ice/snow at the end of the melt season in 2018 was investigated during CHINARE-2018, in terms of temperature, salinity, density, textural structure of sea ice, density, water content and albedo of snow cover, as well as morphology and albedo of refreezing melt pond. This constitutes basic knowledge to better understand the current state of sea ice and the impact of the reduction in Arctic sea ice on the global climate.
The average Arctic sea ice temperature in August was approximately –0.21ºC and increased by 1.5ºC from 2008. The high temperature aggravated the internal melting of the sea ice and resulted in a decrease in salinity. The average salinity of sea ice was about 1.3 psu, and has decreased by about 20% in the last decade. Its density was approximately 825 kg/m3, with the value ranging from 746 kg/m3 to 835 kg/m3 in the past 10 years. Textural observations showed that all ice cores collected consisted of first-year ice, which was dominated by columnar grained ice. The individual freezing and thawing conditions brought about a difference in sea ice texture at each ice station. The average water content and density of snow were 0.74% and 241 kg/m3, respectively. The integrated albedo of snow cover ranged from 0.61 to 0.95, and was mainly influenced by the thickness of snow, and its water content and density.
Eight refreezing melt ponds were measured in this investigation. The thickness of the ice lid ranged from 2.2 cm to 7.0 cm, and the depth of the pond ranged from 1.8 cm to 26.8 cm. The ice lid was thick on both sides and thin in the middle, and the depth of the pond exhibited the same trend. The integrated albedo of the refreezing melt pond ranged from 0.28 to 0.57. When there was snow on the surface of the refreezing melt pond, the albedo was mainly influenced by the snow cover. The thin ice lid improved the albedo of the melt pond, which was twice as high as that of the mature melt pond.
Field investigations can promote our understanding of the physical properties of Arctic sea ice and the mechanism of reduction in it. The albedo of the refreezing melt pond can be used to understand and calculate the mass balance of Arctic sea ice in autumn. In future work, these results will be incorporated into large-scale climate models, to improve forecasts relating to Arctic sea ice. More automatic observation equipment should be developed to measure the density and salinity of sea ice. The observation times and number of short-term and long-term ice stations should be extended, to provide more basic background data support for related research.
The authors thank ship crews onboard the R/V Xuelong for providing excellent logistical support.
| [1] |
Aoki T, Hachikubo A, Hori M. 2003. Effects of snow physical parameters on shortwave broadband albedos. Journal of Geophysical Research, 108(D19): 4616. doi: 10.1029/2003JD003506
|
| [2] |
Berni J A J, Zarco-Tejada P J, Suarez L, et al. 2009. Thermal and narrowband multispectral remote sensing for vegetation monitoring from an unmanned aerial vehicle. IEEE Transactions on Geoscience and Remote Sensing, 47(3): 722–738. doi: 10.1109/tgrs.2008.2010457
|
| [3] |
Cheng Bin, Zhang Zhanhai, Vihma T, et al. 2008. Model experiments on snow and ice thermodynamics in the Arctic Ocean with CHINARE 2003 data. Journal of Geophysical Research, 113(C9): C09020. doi: 10.1029/2007jc004654
|
| [4] |
Comiso J C. 2012. Large decadal decline of the Arctic multiyear ice cover. Journal of Climate, 25(4): 1176–1193. doi: 10.1175/JCLI-D-11-00113.1
|
| [5] |
Comiso J C, Parkinson C L, Gersten R, et al. 2008. Accelerated decline in the arctic sea ice cover. Geophysical Research Letters, 35(1): L01703. doi: 10.1029/2007gl031972
|
| [6] |
Curry J A, Schramm J L, Perovich D K, et al. 2001. Applications of sheba/fire data to evaluation of snow/ice albedo parameterizations. Journal of Geophysical Research, 106(D14): 15345–15355. doi: 10.1029/2000jd900311
|
| [7] |
Eicken H, Lensu M, Leppäranta M, et al. 1995. Thickness, structure, and properties of level summer multiyear ice in the Eurasian sector of the Arctic Ocean. Journal of Geophysical Research, 100(D11): 22697–22710. doi: 10.1029/95JC02188
|
| [8] |
Flocco D, Feltham D L, Bailey E, et al. 2015. The refreezing of melt ponds on Arctic sea ice. Journal of Geophysical Research, 120(2): 647–659. doi: 10.1002/2014JC010140
|
| [9] |
Galley R J, Trachtenberg M, Langlois A, et al. 2009. Observations of geophysical and dielectric properties and ground penetrating radar signatures for discrimination of snow, sea ice and freshwater ice thickness. Cold Regions Science and Technology, 57(1): 29–38. doi: 10.1016/j.coldregions.2009.01.003
|
| [10] |
Grenfell T C, Maykut G A. 1977. The optical properties of ice and snow in the Arctic Basin. Journal of Glaciology, 18(80): 445–463. doi: 10.3189/S0022143000021122
|
| [11] |
Grenfell T C, Perovich D K. 1984. Spectral albedos of sea ice and incident solar irradiance in the southern Beaufort Sea. Journal of Geophysical Research, 89(C3): 3573–3580. doi: 10.1029/jc089ic03p03573
|
| [12] |
Han Hongwei, Li Zhijun, Huang Wenfeng, et al. 2015. The uniaxial compressive strength of the Arctic summer sea ice. Acta Oceanologica Sinica, 34(1): 129–136. doi: 10.1007/s13131-015-0598-7
|
| [13] |
Hohenegger C, Alali B, Steffen K R, et al. 2012. Transition in the fractal geometry of Arctic melt ponds. The Cryosphere, 6(5): 1157–1162. doi: 10.5194/tc-6-1157-2012
|
| [14] |
Honda M, Inoue J, Yamane S. 2009. Influence of low Arctic sea-ice minima on anomalously cold Eurasian winters. Geophysical Research Letters, 36(8): L08707. doi: 10.1029/2008GL037079
|
| [15] |
Huang Wenfeng, Lei Ruibo, Han Hongwei, et al. 2016. Physical structures and interior melt of the central Arctic sea ice/snow in summer 2012. Cold Regions Science and Technology, 124: 127–137. doi: 10.1016/j.coldregions.2016.01.005
|
| [16] |
Huang Wenfeng, Lei Ruibo, Ilkka M, et al. 2013. The physical structures of snow and sea ice in the Arctic section of 150o-180oW during the summer of 2010. Acta Oceanologica Sinica, 32(5): 57–67. doi: 10.1007/s13131-013-0314-4
|
| [17] |
Johannessen O M, Bengtsson L, Miles M W, et al. 2004. Arctic climate change: observed and modelled temperature and sea-ice variability. Tellus A: Dynamic Meteorology and Oceanography, 56(5): 559–560. doi: 10.3402/tellusa.v56i5.14599
|
| [18] |
Keilin D, Hartree E F. 1949. Effect of low temperature on the absorption spectra of haemoproteins; with observations on the absorption spectrum of oxygen. Nature, 164(4163): 254–259. doi: 10.1038/164254a0
|
| [19] |
Kwok R. 2018. Arctic sea ice thickness, volume, and multiyear ice coverage: losses and coupled variability (1958–2018). Environmental Research Letters, 13(10): 105005. doi: 10.1088/1748-9326/aae3ec
|
| [20] |
Lei Ruibo, Cheng Bin, Heil P, et al. 2018. Seasonal and interannual variations of sea ice mass balance from the central Arctic to the Greenland Sea. Journal of Geophysical Research, 123(4): 2422–2439. doi: 10.1002/2017jc013548
|
| [21] |
Lei Ruibo, Leppäranta M, Erm A, et al. 2011. Field investigations of apparent optical properties of ice cover in Finnish and Estonian lakes in winter 2009. Estonian Journal of Earth Sciences, 60(1): 50–64. doi: 10.3176/earth.2011.1.05
|
| [22] |
Lei Ruibo, Li Zhijun, Li Na, et al. 2012a. Crucial physical characteristics of sea ice in the Arctic section of 143°-180°W during August and early September 2008. Acta Oceanologica Sinica, 31(4): 65–75. doi: 10.1007/s13131-012-0221-0
|
| [23] |
Lei Ruibo, Zhang Zhanhai, Matero I, et al. 2012b. Reflection and transmission of irradiance by snow and sea ice in the central Arctic Ocean in summer 2010. Polar Research, 31(1): 17325. doi: 10.3402/polar.v31i0.17325
|
| [24] |
Lindsay R, Schweiger A. 2015. Arctic sea ice thickness loss determined using subsurface, aircraft, and satellite observations. The Cryosphere, 9(1): 269–283. doi: 10.5194/tc-9-269-2015
|
| [25] |
López-Moreno J I, Fassnacht S R, Heath J T, et al. 2013. Small scale spatial variability of snow density and depth over complex alpine terrain: Implications for estimating snow water equivalent. Advances in Water Resources, 55: 40–52. doi: 10.1016/j.advwatres.2012.08.010
|
| [26] |
Lu P, Cao X, Wang Q, et al. 2018a. Impact of a surface ice lid on the optical properties of melt ponds. Journal of Geophysical Research, 123(11): 8313–8328. doi: 10.1029/2018JC014161
|
| [27] |
Lu Peng, Cheng Bin, Leppäranta M, et al. 2018b. Partitioning of solar radiation in Arctic sea ice during melt season. Oceanologia, 60(4): 464–477. doi: 10.1016/j.oceano.2018.03.002
|
| [28] |
Lu Peng, Leppäranta M, Cheng Bin, et al. 2016. Influence of melt-pond depth and ice thickness on Arctic sea-ice albedo and light transmittance. Cold Regions Science and Technology, 124: 1–10. doi: 10.1016/j.coldregions.2015.12.010
|
| [29] |
Maykut G A, Untersteiner N. 1971. Some results from a time-dependent thermodynamic model of sea ice. Journal of Geophysical Research, 76(6): 1550–1575. doi: 10.1029/JC076i006p01550
|
| [30] |
Martin S. 1979. A field study of brine drainage and oil entrainment in first-year sea ice. Journal of Glaciology, 22(88): 473–502. doi: 10.3189/S0022143000014477
|
| [31] |
Morassutti M P, Ledrew E F. 1996. Albedo and depth of melt ponds on sea-ice. International Journal of Climatology, 16(7): 817–838. doi: 10.1002/(sici)1097-0088(199607)16:7<817::aid-joc44>3.0.co;2-5
|
| [32] |
Mundy C J, Ehn J K, Barber D G, et al. 2007. Influence of snow cover and algae on the spectral dependence of transmitted irradiance through Arctic landfast first-year sea ice. Journal of Geophysical Research, 112(C3): C03007. doi: 10.1029/2006JC003683
|
| [33] |
Nicolaus M, Gerland S, Hudson S R, et al. 2010a. Seasonality of spectral albedo and transmittance as observed in the Arctic transpolar drift in 2007. Journal of Geophysical Research, 115(C11): C11011. doi: 10.1029/2009JC006074
|
| [34] |
Nicolaus M, Hudson S R, Gerland S, et al. 2010b. A modern concept for autonomous and continuous measurements of spectral albedo and transmittance of sea ice. Cold Regions Science and Technology, 62(1): 14–28. doi: 10.1016/j.coldregions.2010.03.001
|
| [35] |
Nicolaus M, Katlein C, Maslanik J, et al. 2012. Changes in Arctic sea ice result in increasing light transmittance and absorption. Geophysical Research Letters, 39(24): L24501. doi: 10.1029/2012GL053738
|
| [36] |
Perovich D K. 1996. The optical properties of sea ice. Hanover: Cold Regions Research and Engineering Laboratory
|
| [37] |
Perovich D K, Grenfell T C, Light B, et al. 2002. Seasonal evolution of the albedo of multiyear Arctic sea ice. Journal of Geophysical Research, 107(C10): 8044. doi: 10.1029/2000JC000438
|
| [38] |
Perovich D K, Grenfell T C, Light B, et al. 2009. Transpolar observations of the morphological properties of Arctic sea ice. Journal of Geophysical Research, 114(C1): C00A04. doi: 10.1029/2008JC004892
|
| [39] |
Perovich D K, Polashenski C. 2012. Albedo evolution of seasonal Arctic sea ice. Geophysical Research Letters, 39(8): L08501. doi: 10.1029/2012GL051432
|
| [40] |
Petrich C, Eicken H. 2009. Growth, structure and properties of sea ice. In: Thomas D N, Dieckmann G S, eds. Sea Ice. 2nd ed. Oxford: Wiley-Blackwell
|
| [41] |
Polashenski C, Perovich D, Courville Z. 2012. The mechanisms of sea ice melt pond formation and evolution. Journal of Geophysical Research, 117(C1): C01001. doi: 10.1029/2011JC007231
|
| [42] |
Renner A H H, Gerland S, Haas C, et al. 2014. Evidence of Arctic sea ice thinning from direct observations. Geophysical Research Letters, 41(14): 5029–5036. doi: 10.1002/2014GL060369
|
| [43] |
Stroeve J C, Kattsov V, Barrett A, et al. 2012. Trends in Arctic sea ice extent from CMIP5, CMIP3 and observations. Geophysical Research Letters, 39(16): L16502. doi: 10.1029/2012GL052676
|
| [44] |
Timco G W, Frederking R M W. 1996. A review of sea ice density. Cold Regions Science and Technology, 24(1): 1–6. doi: 10.1016/0165-232X(95)00007-X
|
| [45] |
Timco G W, Weeks W F. 2010. A review of the engineering properties of sea ice. Cold Regions Science and Technology, 60(2): 107–129. doi: 10.1016/j.coldregions.2009.10.003
|
| [46] |
Tucker III W B, Gow A J, Meese D A, et al. 1999. Physical characteristics of summer sea ice across the arctic ocean. Journal of Geophysical Research, 104(C1): 1489–1504. doi: 10.1029/98jc02607
|
| [47] |
Wang Qingkai, Li Zhijun, Lei Ruibo, et al. 2018. Estimation of the uniaxial compressive strength of Arctic sea ice during melt season. Cold Regions Science and Technology, 151: 9–18. doi: 10.1016/j.coldregions.2018.03.002
|
| [48] |
Webster M A, Rigor I G, Perovich D K, et al. 2015. Seasonal evolution of melt ponds on Arctic sea ice. Journal of Geophysical Research, 120(9): 5968–5982. doi: 10.1002/2015JC011030
|
| [49] |
Weeks W F, Ackley S F. 1986. The growth, structure, and properties of sea ice. In: Untersteiner N, ed. The Geophysics of Sea Ice. Boston, MA: Springer, 9–164, doi: 10.1007/978-1-4899-5352-0_2
|
| 1. | Jihee Kim, Jong-Kuk Moon, Eun Jin Yang, et al. Sources and melt flux of methylmercury in sea ice on the Chukchi Plateau, Arctic Ocean. Estuarine, Coastal and Shelf Science, 2023, 294: 108536. doi:10.1016/j.ecss.2023.108536 | |
| 2. | Hang Zhang, Peng Lu, Miao Yu, et al. Comparison of Pond Depth and Ice Thickness Retrieval Algorithms for Summer Arctic Sea Ice. Remote Sensing, 2022, 14(12): 2831. doi:10.3390/rs14122831 | |
| 3. | Qingmin Wang, Mohammed Shokr, Shiyi Chen, et al. Winter Sea-Ice Lead Detection in Arctic Using FY-3D MERSI-II Data. IEEE Geoscience and Remote Sensing Letters, 2022, 19: 1. doi:10.1109/LGRS.2022.3223689 | |
| 4. | Ruibo Lei, Zexun Wei. Exploring the Arctic Ocean under Arctic amplification. Acta Oceanologica Sinica, 2020, 39(9): 1. doi:10.1007/s13131-020-1642-9 |

Figures(15) / Tables(4)

Supported by:
Beijing Renhe Information Technology Co. Ltd

Xiaowei Cao, Peng Lu, Ruibo Lei, Qingkai Wang, Zhijun Li. Physical and optical characteristics of sea ice in the Pacific Arctic Sector during the summer of 2018[J]. Acta Oceanologica Sinica, 2020, 39(9): 25-37. doi: 10.1007/s13131-020-1645-6

| Station | Date and time (UTC) | Physical properties | Albedo | |||
| Ice | Snow | Melt pond | Snow | |||
| S1 | 10 Aug. 23:00–3:00 | ○ | × | × | × | |
| S2 | 12 Aug. 02:00–6:00 | ○ | ○ | ○ | ○ | |
| S3 | 13 Aug. 02:00–05:00 | ○ | ○ | ○ | ○ | |
| S4 | 14 Aug. 03:00–07:00 | ○ | ○ | ○ | ○ | |
| S5 | 14 Aug. 23:00–05:00 | ○ | × | ○ | × | |
| S6 | 20 Aug. 07:00–12:00 | ○ | × | ○ | ○ | |
| S7 | 21 Aug. 09:30–13:30 | ○ | × | × | × | |
| S8 | 23 Aug. 01:00–05:00 | ○ | × | × | ○ | |
| S9 | 24 Aug. 23:00–04:00 | ○ | ○ | ○ | ○ | |
| Note: ○ means measurement, and × means “no”. | ||||||
DownLoad:
CSV
| Station | Snow thickness/mm | Average water content/% | Average density/kg·m–3 |
| S2 | 100 | 1.59 | 307 |
| S3 | 90 | 3.37 | 218 |
| S4 | 67 | 0.31 | 185 |
| S9 | 120 | 1.38 | 254 |
DownLoad:
CSV
| Station | Melt pond/cm | Snow/cm | |||||
| Hs | Hl | Hp | Hi | Hs | Hi | ||
| S2 | 0 | 2.2 | 12.4 | – | 10.2 | – | |
| S3 | 0 | 3.8 | 4.3 | 117 | 6.0 | 116 | |
| S4 | 2.6 | 7.0 | 1.8 | 160 | 2.5 | – | |
| S5 | 3.5 | 3.9 | 6.1 | 116 | 3.5 | 127 | |
| S6 | 0 | 5.5 | 11.9 | 105 | 3.0 | – | |
| S8 | – | – | – | – | 3.8 | 180 | |
| S9 | 0 | 5.7 | 26.8 | 149 | 8.0 | 168 | |
| Note: – means no data. | |||||||
DownLoad:
CSV
| Year | Date | Ice station number | Position | |
| Latitude (N) | Longitude (W) | |||
| 2008 | 27 Aug.–2 Sep. | 5 | 79.9º–85.2º | 147.1º–162.8º |
| 2010 | 30 Jul.–23 Aug. | 7 | 77.5º–88.4º | 158.9º–177.2º |
| 2014 | 10 Aug.–28 Aug. | 8 | 76.7º–80.9º | 149.4º–163.1º |
| 2016 | 4 Aug.–20 Aug. | 7 | 76.3º–82.3º | 167.0º–179.6º |
| 2018 | 10 Aug.–24 Aug. | 9 | 79.2º–84.7º | 156.1º–169.4º |
DownLoad:
CSV
| Station | Date and time (UTC) | Physical properties | Albedo | |||
| Ice | Snow | Melt pond | Snow | |||
| S1 | 10 Aug. 23:00–3:00 | ○ | × | × | × | |
| S2 | 12 Aug. 02:00–6:00 | ○ | ○ | ○ | ○ | |
| S3 | 13 Aug. 02:00–05:00 | ○ | ○ | ○ | ○ | |
| S4 | 14 Aug. 03:00–07:00 | ○ | ○ | ○ | ○ | |
| S5 | 14 Aug. 23:00–05:00 | ○ | × | ○ | × | |
| S6 | 20 Aug. 07:00–12:00 | ○ | × | ○ | ○ | |
| S7 | 21 Aug. 09:30–13:30 | ○ | × | × | × | |
| S8 | 23 Aug. 01:00–05:00 | ○ | × | × | ○ | |
| S9 | 24 Aug. 23:00–04:00 | ○ | ○ | ○ | ○ | |
| Note: ○ means measurement, and × means “no”. | ||||||
| Station | Snow thickness/mm | Average water content/% | Average density/kg·m–3 |
| S2 | 100 | 1.59 | 307 |
| S3 | 90 | 3.37 | 218 |
| S4 | 67 | 0.31 | 185 |
| S9 | 120 | 1.38 | 254 |
| Station | Melt pond/cm | Snow/cm | |||||
| Hs | Hl | Hp | Hi | Hs | Hi | ||
| S2 | 0 | 2.2 | 12.4 | – | 10.2 | – | |
| S3 | 0 | 3.8 | 4.3 | 117 | 6.0 | 116 | |
| S4 | 2.6 | 7.0 | 1.8 | 160 | 2.5 | – | |
| S5 | 3.5 | 3.9 | 6.1 | 116 | 3.5 | 127 | |
| S6 | 0 | 5.5 | 11.9 | 105 | 3.0 | – | |
| S8 | – | – | – | – | 3.8 | 180 | |
| S9 | 0 | 5.7 | 26.8 | 149 | 8.0 | 168 | |
| Note: – means no data. | |||||||
| Year | Date | Ice station number | Position | |
| Latitude (N) | Longitude (W) | |||
| 2008 | 27 Aug.–2 Sep. | 5 | 79.9º–85.2º | 147.1º–162.8º |
| 2010 | 30 Jul.–23 Aug. | 7 | 77.5º–88.4º | 158.9º–177.2º |
| 2014 | 10 Aug.–28 Aug. | 8 | 76.7º–80.9º | 149.4º–163.1º |
| 2016 | 4 Aug.–20 Aug. | 7 | 76.3º–82.3º | 167.0º–179.6º |
| 2018 | 10 Aug.–24 Aug. | 9 | 79.2º–84.7º | 156.1º–169.4º |
 DownLoad:


 DownLoad: